Embed Size (px)
Citation preview

CIRCLE, Lund University, Sweden
CENTER FOR INNOVATION, RESEARCH AND COMPETENCE IN THE LEARNING ECONOMY
Local Clusters of Entrepreneurs
- neighborhood peers effects in entrepreneurship
Martin Andersson* and Johan P Larsson**
*CIRCLE, Lund University and Blekinge Institute of Technology (BTH)
**CEnSE, Jönköping International Business School (JIBS)

CIRCLE, Lund University, Sweden
Our question
• Does living in a neighborhood where many residents are
established entrepreneurs induce entrepreneurial behavior? • Local social interactions: individuals’ behavior depend on the behavior of others in
their environment (Glaeser and Scheinkman 2003)
• Peer/network effects in entrepreneurship (Minniti 2005, Nanda and Sorensen
2010, Bosma et al 2012)
Our finding:
• Yes!
– Local clusters of entrepreneurs at the neighborhood level
– The fraction of neigborhood residents that are established entrepreneurs
has an economic significant and robust effect on the probability that other
residents transcend from employment to entrepreneurship
CIRCLE, Lund University, Sweden
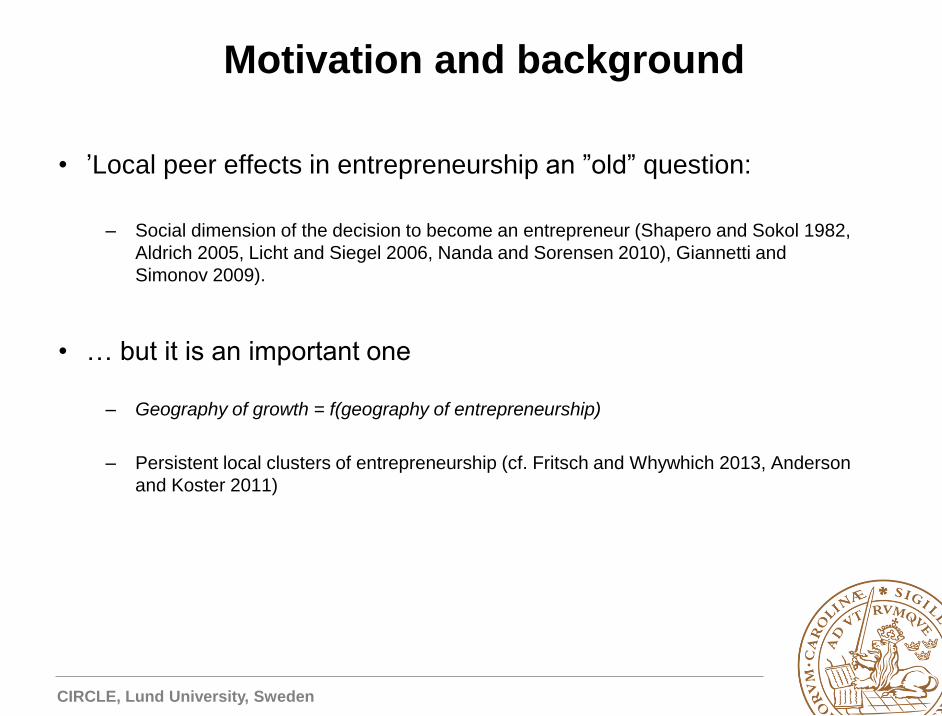
Motivation and background
• ’Local peer effects in entrepreneurship an ”old” question:
– Social dimension of the decision to become an entrepreneur (Shapero and Sokol 1982,
Aldrich 2005, Licht and Siegel 2006, Nanda and Sorensen 2010), Giannetti and
Simonov 2009).
• … but it is an important one
– Geography of growth = f(geography of entrepreneurship)
– Persistent local clusters of entrepreneurship (cf. Fritsch and Whywhich 2013, Anderson
and Koster 2011)

CIRCLE, Lund University, Sweden
Figure 2. The relationship between start-up rates in 2007 (Start_up_rate) and in
1987 (L20.Start_up_rate) across Swedish municipalities (new
establishments per inhabitant 16-64 years of age).
0
.01
.02
.03
.04
Sta
rt_up_ra
te
.01 .02 .03 .04L20.Start_up_rate
PERSISTENCE OF REGIONAL START-UP RATES
CIRCLE, Lund University, Sweden
Motivation and background
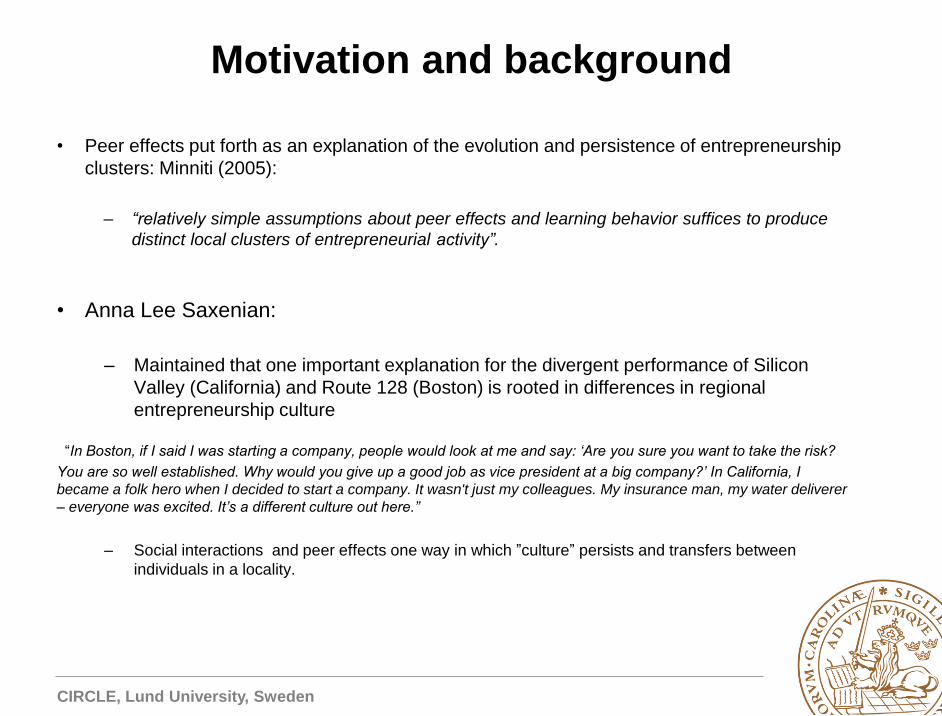
• Peer effects put forth as an explanation of the evolution and persistence of entrepreneurship
clusters: Minniti (2005):
– “relatively simple assumptions about peer effects and learning behavior suffices to produce
distinct local clusters of entrepreneurial activity”.
• Anna Lee Saxenian:
– Maintained that one important explanation for the divergent performance of Silicon
Valley (California) and Route 128 (Boston) is rooted in differences in regional
entrepreneurship culture
“In Boston, if I said I was starting a company, people would look at me and say: ‘Are you sure you want to take the risk?
You are so well established. Why would you give up a good job as vice president at a big company?’ In California, I
became a folk hero when I decided to start a company. It wasn't just my colleagues. My insurance man, my water deliverer
– everyone was excited. It’s a different culture out here.”
– Social interactions and peer effects one way in which ”culture” persists and transfers between
individuals in a locality.

CIRCLE, Lund University, Sweden
Motivation and background
• Policy relevant: social multiplier (Glaeser et al 2003):
– an exogenous shock induces not only a direct effect on individual
behavior, but also an indirect effect mediated by people adopting
the behavior of their peers.
– Potential for long-term policy effect
CIRCLE, Lund University, Sweden
Motivation and background
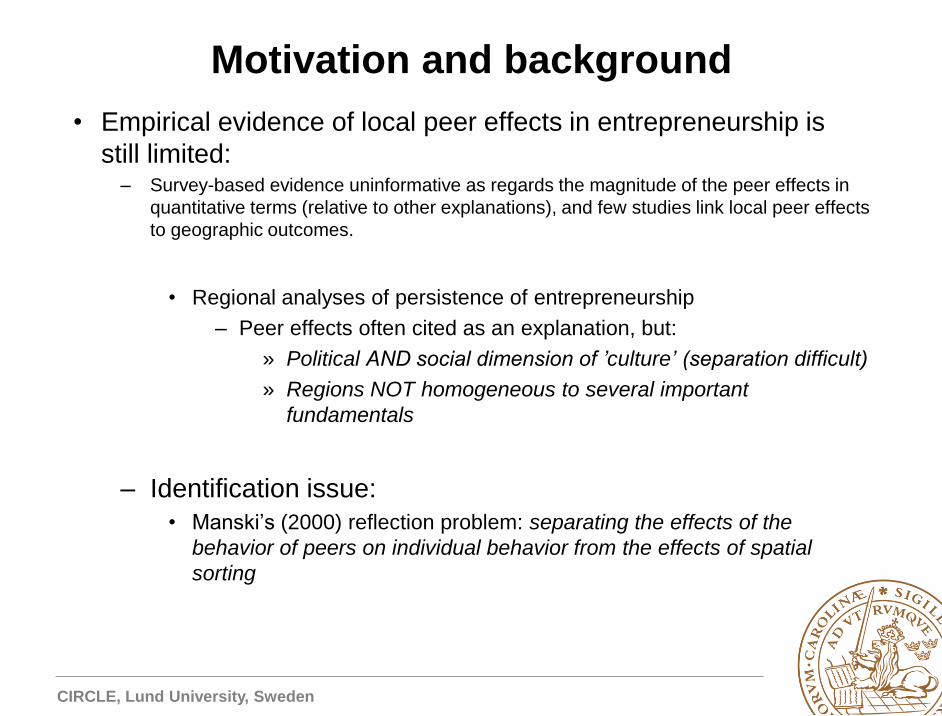
• Empirical evidence of local peer effects in entrepreneurship is
still limited: – Survey-based evidence uninformative as regards the magnitude of the peer effects in
quantitative terms (relative to other explanations), and few studies link local peer effects
to geographic outcomes.
• Regional analyses of persistence of entrepreneurship
– Peer effects often cited as an explanation, but:
» Political AND social dimension of ’culture’ (separation difficult)
» Regions NOT homogeneous to several important
fundamentals
– Identification issue:
• Manski’s (2000) reflection problem: separating the effects of the
behavior of peers on individual behavior from the effects of spatial
sorting

CIRCLE, Lund University, Sweden
Our contribution
– Focus within-city clusters of entrepreneurs neigborhoods (1 square
kilometer)
• (1) Comes much closer to the conceptual notion of a neighborhood
as an arena for social interactions.
• corresponds to established findings of the distance-decay of inter-personal
contacts. 42% of frequent contacts occur between individuals who lives less
than 1 mile apart (Wellman 1996).
• (2) Identification: neighborhoods homogeneous with regard to any
determinant operating at the city (or municipality) level
spatial differentiation in outcomes in the absence of differences
in fundamentals is a key feature of any model of social
interactions (Glaeser and Scheinkman 2003, Minniti 2005)
CIRCLE, Lund University, Sweden
#1: EMPIRICAL REGULARITY
clusters of entrepreneurs across neighborhoods within regions

CIRCLE, Lund University, Sweden
d
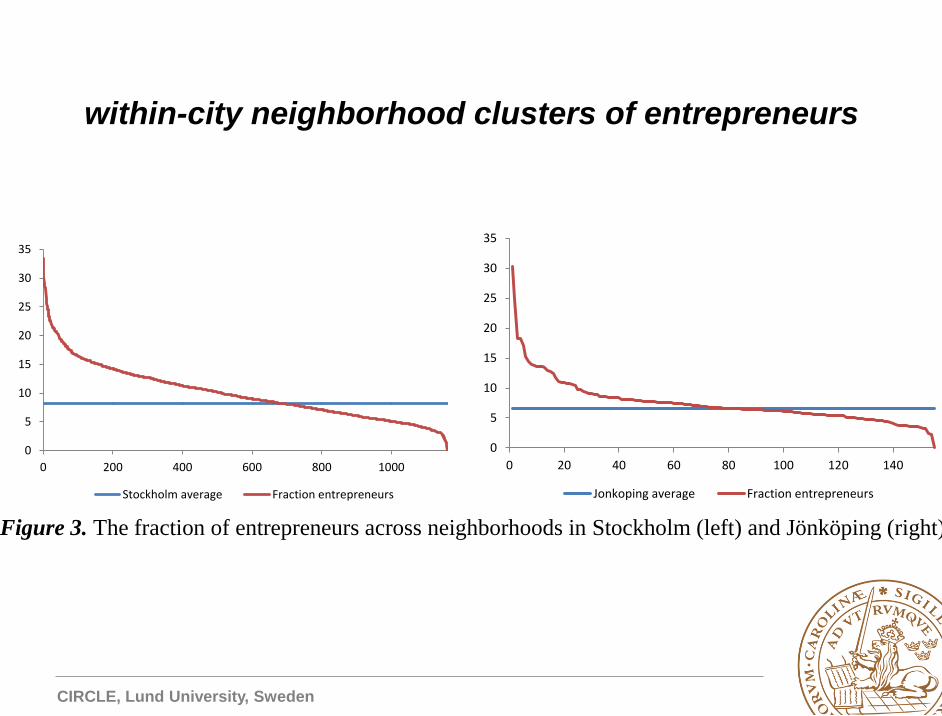
within-city neighborhood clusters of entrepreneurs
Figure 2. Distribution of entrepreneurs within the Stockholm metropolitan area (left), and the Jönköping urban
region (right).
CIRCLE, Lund University, Sweden
0
5
10
15
20
25
30
35
0 200 400 600 800 1000
Stockholm average Fraction entrepreneurs
0
5
10
15
20
25
30
35
0 20 40 60 80 100 120 140
Jonkoping average Fraction entrepreneurs
Figure 3. The fraction of entrepreneurs across neighborhoods in Stockholm (left) and Jönköping (right).
within-city neighborhood clusters of entrepreneurs
CIRCLE, Lund University, Sweden
• Patterns consistent with local social interactions
• variance in entrepreneurship across neighborhoods within one
and the same city cannot be explained by city-wide
fundamentals, since those are shared by all neighborhoods in
the city.
– “Standard” supply- and demand-side determinants likely to operate
at the city (or region) level
» ex. local policy regime, market-size, labor supply

CIRCLE, Lund University, Sweden
#2: MICROECONOMETRIC ANALYSIS
- Does living in a neigborhood where a large fraction of the residents are established
entrepreneurs influence the probability of transcending from employment to
entrepreneurship?

CIRCLE, Lund University, Sweden
– Individuals that become entrepreneurs
– Extensive controls (individual, employer, geography)
– Inclusion of municipality-specific effects
• Parameters identified from variations across neighborhoods within
cities
– Isolate sub-groups to test of robustness of the results with regard to
the underlying identifying assumption (Lindbeck et al 2007)
• Age groups, immigrants, local market-dependent sectors

CIRCLE, Lund University, Sweden
IDENTIFICATION STRATEGY
• Leave full-time employment for full-time entrepreneurship.
• All employees in 2007 (N= about 2.7 million)
• Full population matched employer-employee dataset for Sweden
Γxx 1ti,1ti, 1Pr ,tiE
(1)
ti, σRθΩγZβIΓx 1ti,1ti,1ti,1ti,1ti,
Individual Employer Neighborhood Region

CIRCLE, Lund University, Sweden
Table 4. Determinants of leaving employment for entrepreneurship.
Variable
Fraction entrepreneurs in the neighborhood 0.0323***
(0.00137)
Neighborhood density (ln) -0.00994***
(0.00309)
Human capital (neighborhood) 0.451***
(0.0359)
Fraction entrepreneurs in the municipality 0.00717***
(0.00273)
Size of municipality (ln) 0.00511
(0.00326)
Stockholm (dummy) 0.0753***
(0.0103)
Years of schooling 0.0137***
(0.00170)
Tenure -0.00931***
(0.000669)
Wage (ln) -0.232***
(0.00373)
Establishment exit 0.114***
(0.0139)
Establishment employment size (ln) -0.120***
(0.00321)
Age (ln) 4.679***
(0.350)
Age squared (ln) -0.598***
(0.0470)
Male (dummy) 0.335***
(0.00748)
Immigrant (dummy) 0.00496
(0.00813)
Observations 2,735,407
Pseudo R-squared .146
Note: The table report coefficient of the model in (1) using a Probit estimator. The underlying data is a matched
employer-employee dataset for Sweden for the years 2007, covering all employees in the age interval 25-
64 that live in city areas. The dependent variable is a dummy which is 1 if the individual leave employment
to become self-employed in 2008, either through a sole proprietorship or ownership of an incorporated
business. The model include a full set of dummies for the educational specialization of individuals,
dummies for occupation at the 1-digit ISCO-88 standard and dummies for the industry the in which the
individual works in 2007 at the 2-digit NACE industry level. Robust standard errors are presented in
parentheses. *** p < .01.
CIRCLE, Lund University, Sweden
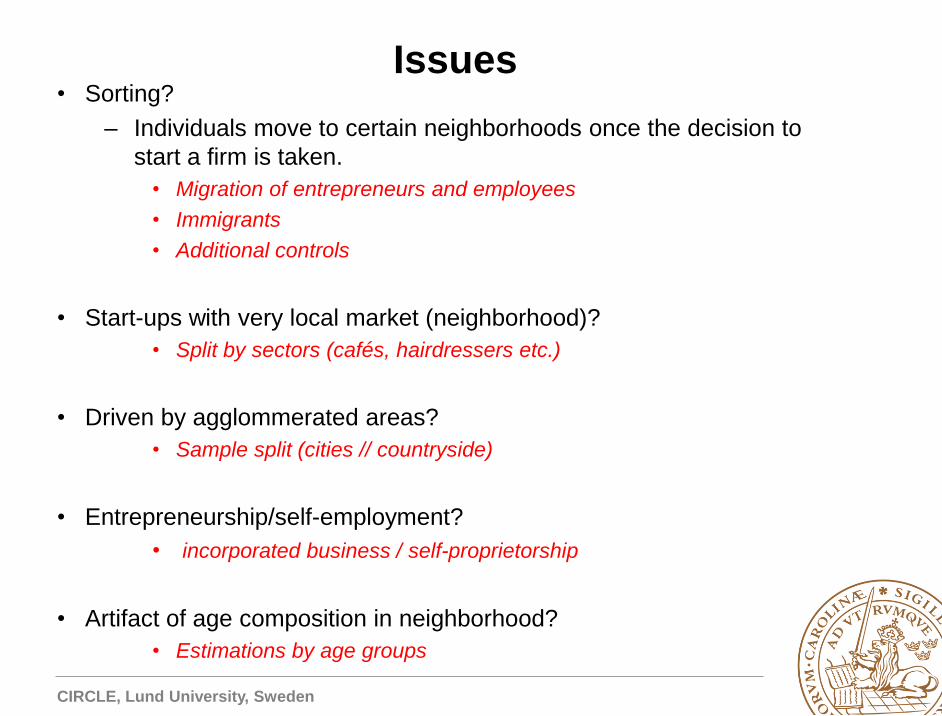
Issues • Sorting?
– Individuals move to certain neighborhoods once the decision to
start a firm is taken.
• Migration of entrepreneurs and employees
• Immigrants
• Additional controls
• Start-ups with very local market (neighborhood)?
• Split by sectors (cafés, hairdressers etc.)
• Driven by agglommerated areas?
• Sample split (cities // countryside)
• Entrepreneurship/self-employment?
• incorporated business / self-proprietorship
• Artifact of age composition in neighborhood?
• Estimations by age groups

CIRCLE, Lund University, Sweden
Mobility of entrepreneurs and non-entrepreneurs
across neighborhoods
0%
5%
10%
15%
20%
25%
30%
1 2 3 4 5 17+
Entrepreneurs Non-entrepreneurs

CIRCLE, Lund University, Sweden
Test #1 Immigrants, neighborhood tenure, agglomeration and ”local-demand” sectors
Table 7. Estimated effects of neighborhood’s fraction of entrepreneurs on the decision to enter
entrepreneurship, by different sub-groups.
(1) (2) (3) (4) (5) (6) (7)
Selection
Imm
igra
nts o
nly
Imm
igra
nts
arriv
ed
afte
r
20
02
Neig
hb
orh
ood
ten
ure
≤ 5
years
Neig
hb
orh
ood
ten
ure
≤ 2
years
50
% le
ast d
en
se
neig
hbo
rhoo
ds
Ex
clu
din
g lo
cal
dem
an
d d
riven
secto
rs
Ex
clu
din
g lo
cal
dem
an
d d
riven
secto
rs an
d
reta
il
Fraction entrepreneurs
in the neighborhood
.0423***
(0.00329)
.0381***
(.00985)
.0376***
(.00287)
.0360***
(.00197)
.0260***
(.00161)
.0382***
(.00123)
.0380***
(.00128)
Average marginal effect .0007 .0007 .0007 .0007 .0005 .0006 .0006
N 437,844 40,458 575,588 1,144,774 1,333,577 2,718,206 2,716,150
Note: The model is identical to (1), the coefficients of which are presented in Table 4. Robust standard errors are
presented in parentheses. *** p < .01. Local demand driven sectors are defined as NACE 93, including
restaurants, and NACE 82, including hair dressers and beauty salons.
CIRCLE, Lund University, Sweden
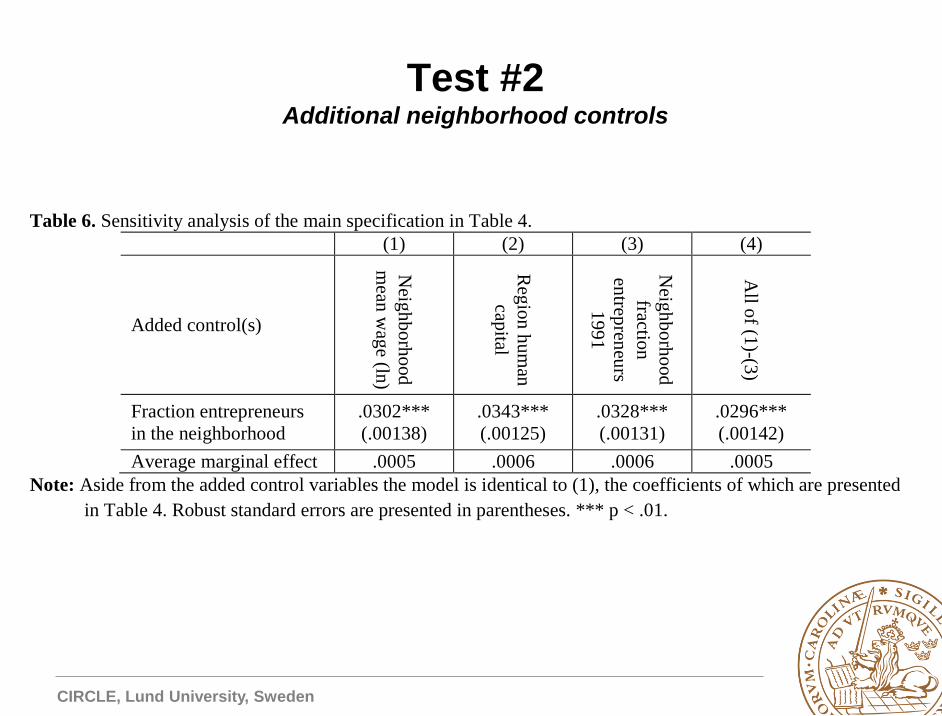
Test #2 Additional neighborhood controls
Table 6. Sensitivity analysis of the main specification in Table 4.
(1) (2) (3) (4)
Added control(s)
Neig
hb
orh
ood
mean
wag
e (ln)
Reg
ion
hu
man
capital
Neig
hb
orh
ood
fraction
entrep
reneu
rs
19
91
All o
f (1)-(3
)
Fraction entrepreneurs
in the neighborhood
.0302***
(.00138)
.0343***
(.00125)
.0328***
(.00131)
.0296***
(.00142)
Average marginal effect .0005 .0006 .0006 .0005
Note: Aside from the added control variables the model is identical to (1), the coefficients of which are presented
in Table 4. Robust standard errors are presented in parentheses. *** p < .01.

CIRCLE, Lund University, Sweden
Test #3 Split by start-up type
Table 5. Estimated effects of neighborhood’s fraction of entrepreneurs on the decision to enter entrepreneurship,
by start-up type.
(1) (2)
Start-up type S
tartup
of
inco
rporated
bu
siness
Startu
p o
f sole
pro
prieto
rship
Fraction entrepreneurs
in the neighborhood
.0352***
(.00138)
.0312 ***
(.00202)
Average marginal effect .0004 .0002
Note: Aside from the added control variables the model is identical to (1), the coefficients of which are
presented in Table 4. Robust standard errors are presented in parentheses. *** p < .01. Out of all startups,
61 percent are sole proprietorships, and 39 percent are incorporated businesses.
CIRCLE, Lund University, Sweden
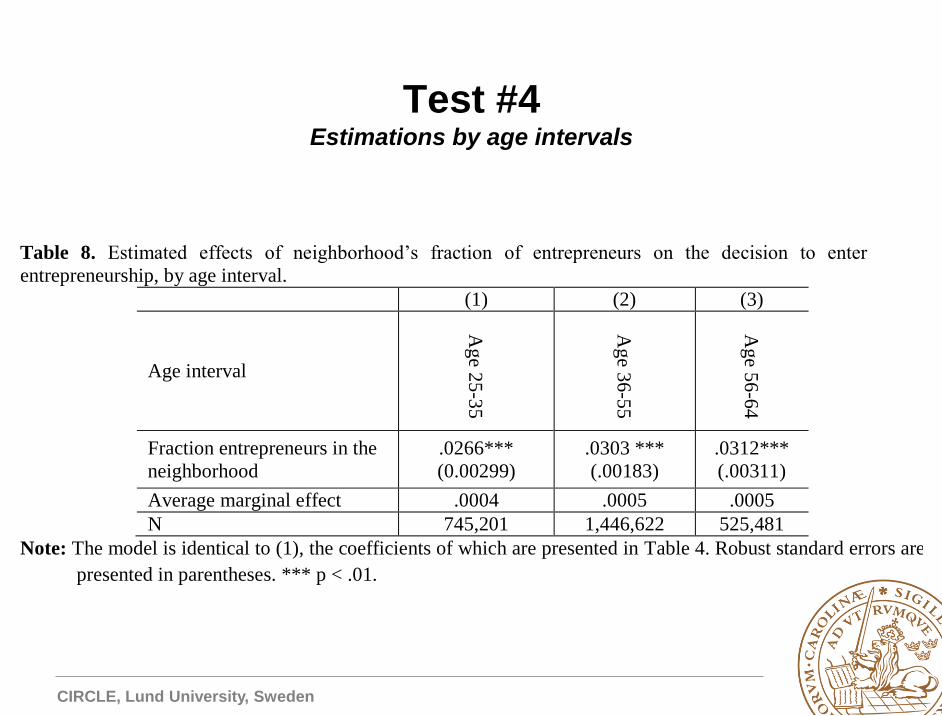
Test #4 Estimations by age intervals
Table 8. Estimated effects of neighborhood’s fraction of entrepreneurs on the decision to enter
entrepreneurship, by age interval.
(1) (2) (3)
Age interval
Ag
e 25
-35
Ag
e 36
-55
Ag
e 56
-64
Fraction entrepreneurs in the
neighborhood
.0266***
(0.00299)
.0303 ***
(.00183)
.0312***
(.00311)
Average marginal effect .0004 .0005 .0005
N 745,201 1,446,622 525,481
Note: The model is identical to (1), the coefficients of which are presented in Table 4. Robust standard errors are
presented in parentheses. *** p < .01.

CIRCLE, Lund University, Sweden
CONCLUSIONS
• Local social interactions (or peer effects) in entrepreneurship
may explain persistent local clusters of entrepreneurship
– emphasized in theoretical work on the emergence and evolution of clusters
(eg. Minniti 2005) as well as in cluster case studies, such as in Saxenian’s
(1994) work on the strengths of the Silicon Valley region.
• Imply potentially large policy effects (social multiplier):
– direct effects amplified by peer effects
CIRCLE, Lund University, Sweden
CONCLUSIONS
• We employed geo-coded matched employer-employee data and showed:
– (i) clusters of entrepreneurs at the neighborhood level within cities =>
consistent with local social interactions.
– (ii) micro-econometric evidence of a significant feedback effect in which
existing entrepreneurs in a neighborhood breeds new local entrepreneurs
• Overall => consistent with local social interactions effects.
• Social interactions appear as relevant in explaining the emergence and
persistence of local clusters of entrepreneurs.
• Provides an example of how characteristics of a local environment induce
entrepreneurial behavior at the individual-level, that then feeds back on the
environment (social multiplier)