Embed Size (px)
Citation preview
BioMed CentralMalaria Journal
ss
Open AcceResearchUsing the SaTScan method to detect local malaria clusters for guiding malaria control programmesMarlize Coleman1, Michael Coleman*2, Aaron M Mabuza3, Gerdalize Kok3, Maureen Coetzee4,5 and David N Durrheim6Address: 1School of Animal, Plant & Environmental Sciences, University of the Witwatersrand, Johannesburg, Gauteng, South Africa, 2Liverpool School of Tropical Medicine, Pembroke Place, Liverpool, L3 5QA, UK, 3Mpumalanga Department of Health, 66 Anderson Street, Nelspruit, 1200, South Africa, 4Vector Control Reference Unit, National Institute for Communicable Diseases, National Health Laboratory Service, 1 Modderfontein Road, Sandringham, 2131 Johannesburg, South Africa, 5SA Research Chair in Medical Entomology & Vector Control, School of Pathology, University of the Witwatersrand, Johannesburg, South Africa and 6Hunter New England Population Health and Hunter Medical Research Institute, Locked Bag 10, Wallsend, 2287, Australia
Email: Marlize Coleman - [email protected]; Michael Coleman* - [email protected]; Aaron M Mabuza - [email protected]; Gerdalize Kok - [email protected]; Maureen Coetzee - [email protected]; David N Durrheim - [email protected]
* Corresponding author
AbstractBackground: Mpumalanga Province, South Africa is a low malaria transmission area that is subjectto malaria epidemics. SaTScan methodology was used by the malaria control programme to detectlocal malaria clusters to assist disease control planning. The third season for case clusteridentification overlapped with the first season of implementing an outbreak identification andresponse system in the area.
Methods: SaTScan™ software using the Kulldorf method of retrospective space-timepermutation and the Bernoulli purely spatial model was used to identify malaria clusters usingdefinitively confirmed individual cases in seven towns over three malaria seasons. Following passivecase reporting at health facilities during the 2002 to 2005 seasons, active case detection was carriedout in the communities, this assisted with determining the probable source of infection. Thedistribution and statistical significance of the clusters were explored by means of Monte Carloreplication of data sets under the null hypothesis with replications greater than 999 to ensureadequate power for defining clusters.
Results and discussion: SaTScan detected five space-clusters and two space-time clusters duringthe study period. There was strong concordance between recognized local clustering of cases andoutbreak declaration in specific towns. Both Albertsnek and Thambokulu reported malariaoutbreaks in the same season as space-time clusters. This synergy may allow mutual validation ofthe two systems in confirming outbreaks demanding additional resources and cluster identificationat local level to better target resources.
Conclusion: Exploring the clustering of cases assisted with the planning of public health activities,including mobilizing health workers and resources. Where appropriate additional indoor residualspraying, focal larviciding and health promotion activities, were all also carried out.
Published: 17 April 2009
Malaria Journal 2009, 8:68 doi:10.1186/1475-2875-8-68
Received: 15 December 2008Accepted: 17 April 2009
This article is available from: http://www.malariajournal.com/content/8/1/68
© 2009 Coleman et al; licensee BioMed Central Ltd. This is an Open Access article distributed under the terms of the Creative Commons Attribution License (http://creativecommons.org/licenses/by/2.0), which permits unrestricted use, distribution, and reproduction in any medium, provided the original work is properly cited.
Page 1 of 6(page number not for citation purposes)
Malaria Journal 2009, 8:68 http://www.malariajournal.com/content/8/1/68
BackgroundMalaria is the most important parasitic disease ofhumans. Over three billion people live in malarious areasand the disease causes over 500 million cases with one tothree million deaths per year [1,2]. An estimated one hun-dred million people in Africa are at risk of malaria epi-demics [3]. In common with most vector-borne infectiousdiseases, malaria is heterogeneous in its distribution intime and space [4-6], and incidence can vary greatlybetween districts, towns and villages. This heterogeneity isaffected by patterns of malaria vector distribution,human-vector contact, human host behavioural factors,house construction, and malaria prevention methodsused [5,7-10].
Characterization of malaria heterogeneity may allow pri-oritization of risk areas and allow focused control inter-ventions. The ability to identify localized malaria clustersin remote highland areas of east Africa facilitated earlyintervention in the absence of early warning systems, asthese malaria "hotspots" remained constant in epidemicand non epidemic years [11].
A number of models have been developed for describingmalaria spatial distribution and seasonality [12-15] trans-mission [8,16-18], mosquito distribution [19,20] and riskfactors associated with malaria [21-23]. However manymalaria endemic environments are resource limited andtools to assist decision support need to take account ofthese limitations.
Malaria remains a public health problem in north-easternSouth Africa, in the low altitude provinces of KwaZulu-Natal, Limpopo and Mpumalanga [24,25]. Malaria risk islow compared to other hyper- and holo-endemic areas ofsub-Saharan Africa and naturally acquired immunity doesnot develop in the local population [26].
The burden of malaria is well described in this region asdefinitive diagnosis using rapid diagnostic tests (RDTs)and mandatory reporting of malaria cases is universallypractised in the public health system, which manages thevast majority of malaria cases [27,28]. All confirmedmalaria cases are entered into a computerized malaria sur-veillance system.
This paper reports on the analysis of malaria notificationdata from 2002–2005 from Mpumalanga Province todetermine local clustering of cases and how that was usedto direct local control efforts and enhance the district out-break identification and response system [29].
MethodsStudy areaMpumalanga Province, which borders Mozambique andSwaziland, is a predominantly rural area with a popula-
tion of approximately four million people. Malaria occur-rence in this area is seasonal during the wet and humidmonths of October to April. Ninety-five percent ofmalaria cases are due to Plasmodium falciparum infection.This area has historically experienced malaria outbreaksand epidemics with relatively high mortality [29,30]. Themain vector in this region is Anopheles arabiensis and vec-tor control is predominantly by indoor residual spraying(IRS) with DDT [31,32].
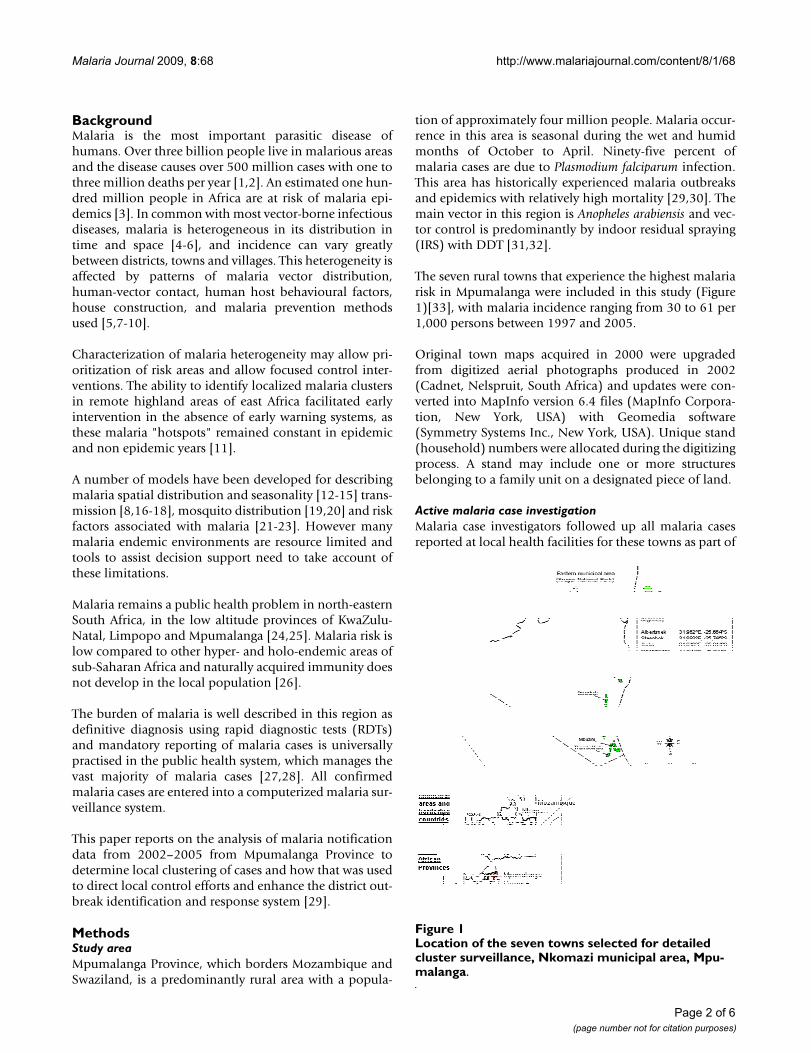
The seven rural towns that experience the highest malariarisk in Mpumalanga were included in this study (Figure1)[33], with malaria incidence ranging from 30 to 61 per1,000 persons between 1997 and 2005.
Original town maps acquired in 2000 were upgradedfrom digitized aerial photographs produced in 2002(Cadnet, Nelspruit, South Africa) and updates were con-verted into MapInfo version 6.4 files (MapInfo Corpora-tion, New York, USA) with Geomedia software(Symmetry Systems Inc., New York, USA). Unique stand(household) numbers were allocated during the digitizingprocess. A stand may include one or more structuresbelonging to a family unit on a designated piece of land.
Active malaria case investigationMalaria case investigators followed up all malaria casesreported at local health facilities for these towns as part of
Location of the seven towns selected for detailed cluster sur-veillance, Nkomazi municipal area, MpumalangaFigure 1Location of the seven towns selected for detailed cluster surveillance, Nkomazi municipal area, Mpu-malanga.
Page 2 of 6(page number not for citation purposes)
Malaria Journal 2009, 8:68 http://www.malariajournal.com/content/8/1/68
malaria control program activities for the 2002/2003,2003/2004 and 2004/2005 seasons. A malaria case isdefined as a person diagnosed either by positive rapid testor blood slide. An investigator would identify the proba-ble source of infection by confirming the travel history ofthe patient recorded on the notification.
Spatial and temporal clustersSaTScan™ software, version 5.1.3, using the Kulldorfmethod of retrospective space-time permutation and theBernoulli purely spatial model [34,35], was used bymalaria control programme operational staff to detectmalaria clusters in individual towns in the three seasonsunder investigation and over the combined time period.Individual malaria cases were used and recorded againstsource of infection households. Households who did notseek health care for malaria or tested negative duringactive case detection were used as controls for the Ber-noulli method. More than one case can be reported perhousehold. A household in these areas is typically definedas a family unit with a single land owner.
The circular scan statistic is isotopic with respect to therotation of the geographical area http://www.satscan.org.This method has previously been validated for plottingand understanding local malaria time-space-clusters[21,36-39].
Observed cases in a cluster were compared to the distribu-tion of expected cases if spatial and temporal locations ofall cases were independent. The model adjusts for entirelyspatial or entirely temporal clusters. With spatial adjust-ment, time remained dormant and during temporal anal-ysis seasons were considered. The distribution andstatistical significance of the clusters were explored bymeans of Monte Carlo replication of data sets under thenull hypothesis with replications greater than 999 toensure adequate power for defining clusters http://www.satscan.org. Clusters were prioritized for publichealth action according to their statistical significance.Hard copy town maps showing cluster areas were distrib-uted to malaria field staff investigating cases allowing thecoordination of intervention efforts within communities.
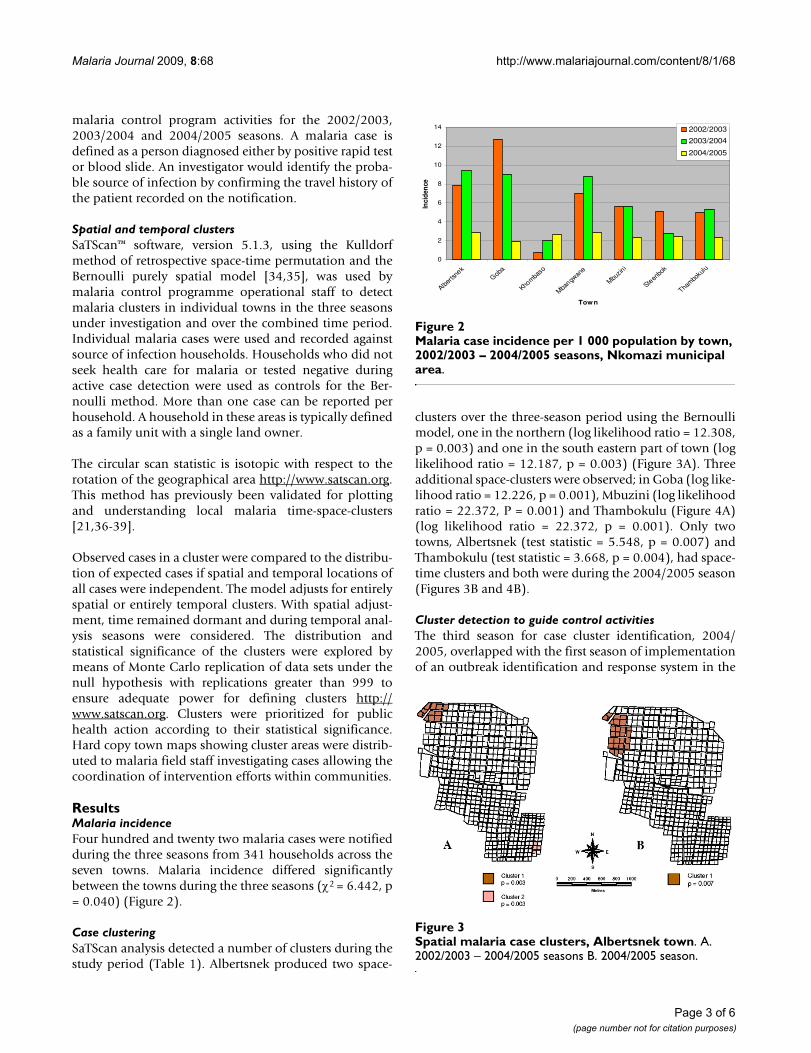
ResultsMalaria incidenceFour hundred and twenty two malaria cases were notifiedduring the three seasons from 341 households across theseven towns. Malaria incidence differed significantlybetween the towns during the three seasons (χ2 = 6.442, p= 0.040) (Figure 2).
Case clusteringSaTScan analysis detected a number of clusters during thestudy period (Table 1). Albertsnek produced two space-
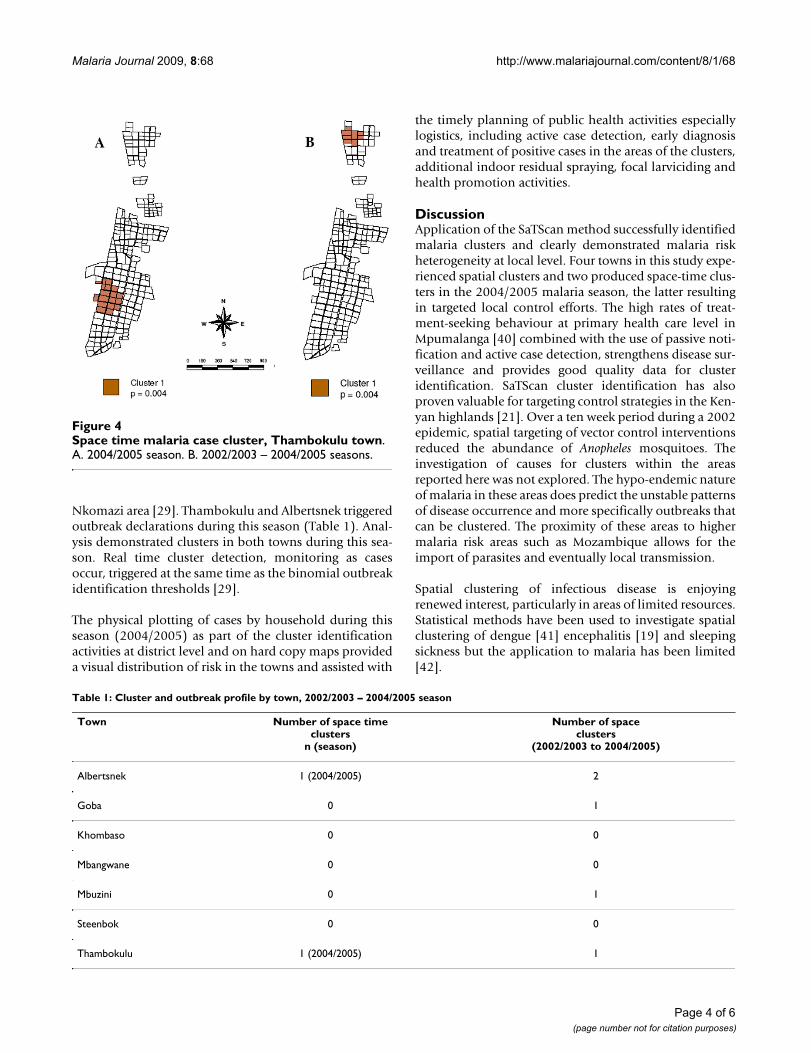
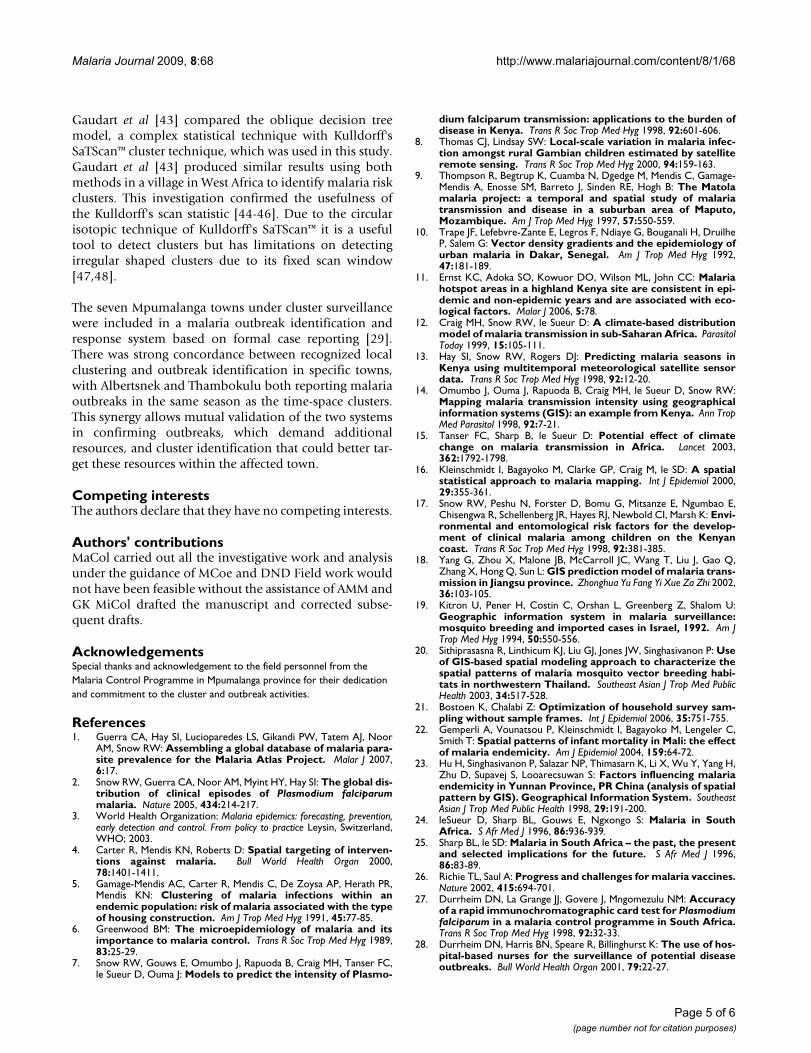
clusters over the three-season period using the Bernoullimodel, one in the northern (log likelihood ratio = 12.308,p = 0.003) and one in the south eastern part of town (loglikelihood ratio = 12.187, p = 0.003) (Figure 3A). Threeadditional space-clusters were observed; in Goba (log like-lihood ratio = 12.226, p = 0.001), Mbuzini (log likelihoodratio = 22.372, P = 0.001) and Thambokulu (Figure 4A)(log likelihood ratio = 22.372, p = 0.001). Only twotowns, Albertsnek (test statistic = 5.548, p = 0.007) andThambokulu (test statistic = 3.668, p = 0.004), had space-time clusters and both were during the 2004/2005 season(Figures 3B and 4B).
Cluster detection to guide control activitiesThe third season for case cluster identification, 2004/2005, overlapped with the first season of implementationof an outbreak identification and response system in the
Malaria case incidence per 1 000 population by town, 2002/2003 – 2004/2005 seasons, Nkomazi municipal areaFigure 2Malaria case incidence per 1 000 population by town, 2002/2003 – 2004/2005 seasons, Nkomazi municipal area.
0
2
4
6
8
10
12
14
Alberts
nek
Goba
Khomba
so
Mbangw
ane
Mbuzin
i
Steen
bok
Thambo
kulu
Town
Inci
denc
e
2002/2003
2003/2004
2004/2005
Spatial malaria case clusters, Albertsnek townFigure 3Spatial malaria case clusters, Albertsnek town. A. 2002/2003 – 2004/2005 seasons B. 2004/2005 season.
Page 3 of 6(page number not for citation purposes)
Malaria Journal 2009, 8:68 http://www.malariajournal.com/content/8/1/68
Nkomazi area [29]. Thambokulu and Albertsnek triggeredoutbreak declarations during this season (Table 1). Anal-ysis demonstrated clusters in both towns during this sea-son. Real time cluster detection, monitoring as casesoccur, triggered at the same time as the binomial outbreakidentification thresholds [29].
The physical plotting of cases by household during thisseason (2004/2005) as part of the cluster identificationactivities at district level and on hard copy maps provideda visual distribution of risk in the towns and assisted with
the timely planning of public health activities especiallylogistics, including active case detection, early diagnosisand treatment of positive cases in the areas of the clusters,additional indoor residual spraying, focal larviciding andhealth promotion activities.
DiscussionApplication of the SaTScan method successfully identifiedmalaria clusters and clearly demonstrated malaria riskheterogeneity at local level. Four towns in this study expe-rienced spatial clusters and two produced space-time clus-ters in the 2004/2005 malaria season, the latter resultingin targeted local control efforts. The high rates of treat-ment-seeking behaviour at primary health care level inMpumalanga [40] combined with the use of passive noti-fication and active case detection, strengthens disease sur-veillance and provides good quality data for clusteridentification. SaTScan cluster identification has alsoproven valuable for targeting control strategies in the Ken-yan highlands [21]. Over a ten week period during a 2002epidemic, spatial targeting of vector control interventionsreduced the abundance of Anopheles mosquitoes. Theinvestigation of causes for clusters within the areasreported here was not explored. The hypo-endemic natureof malaria in these areas does predict the unstable patternsof disease occurrence and more specifically outbreaks thatcan be clustered. The proximity of these areas to highermalaria risk areas such as Mozambique allows for theimport of parasites and eventually local transmission.
Spatial clustering of infectious disease is enjoyingrenewed interest, particularly in areas of limited resources.Statistical methods have been used to investigate spatialclustering of dengue [41] encephalitis [19] and sleepingsickness but the application to malaria has been limited[42].
Space time malaria case cluster, Thambokulu townFigure 4Space time malaria case cluster, Thambokulu town. A. 2004/2005 season. B. 2002/2003 – 2004/2005 seasons.
Table 1: Cluster and outbreak profile by town, 2002/2003 – 2004/2005 season
Town Number of space timeclusters
n (season)
Number of spaceclusters
(2002/2003 to 2004/2005)
Albertsnek 1 (2004/2005) 2
Goba 0 1
Khombaso 0 0
Mbangwane 0 0
Mbuzini 0 1
Steenbok 0 0
Thambokulu 1 (2004/2005) 1
Page 4 of 6(page number not for citation purposes)
Malaria Journal 2009, 8:68 http://www.malariajournal.com/content/8/1/68
Gaudart et al [43] compared the oblique decision treemodel, a complex statistical technique with Kulldorff'sSaTScan™ cluster technique, which was used in this study.Gaudart et al [43] produced similar results using bothmethods in a village in West Africa to identify malaria riskclusters. This investigation confirmed the usefulness ofthe Kulldorff's scan statistic [44-46]. Due to the circularisotopic technique of Kulldorff's SaTScan™ it is a usefultool to detect clusters but has limitations on detectingirregular shaped clusters due to its fixed scan window[47,48].
The seven Mpumalanga towns under cluster surveillancewere included in a malaria outbreak identification andresponse system based on formal case reporting [29].There was strong concordance between recognized localclustering and outbreak identification in specific towns,with Albertsnek and Thambokulu both reporting malariaoutbreaks in the same season as the time-space clusters.This synergy allows mutual validation of the two systemsin confirming outbreaks, which demand additionalresources, and cluster identification that could better tar-get these resources within the affected town.
Competing interestsThe authors declare that they have no competing interests.
Authors' contributionsMaCol carried out all the investigative work and analysisunder the guidance of MCoe and DND Field work wouldnot have been feasible without the assistance of AMM andGK MiCol drafted the manuscript and corrected subse-quent drafts.
AcknowledgementsSpecial thanks and acknowledgement to the field personnel from the Malaria Control Programme in Mpumalanga province for their dedication and commitment to the cluster and outbreak activities.
References1. Guerra CA, Hay SI, Lucioparedes LS, Gikandi PW, Tatem AJ, Noor
AM, Snow RW: Assembling a global database of malaria para-site prevalence for the Malaria Atlas Project. Malar J 2007,6:17.
2. Snow RW, Guerra CA, Noor AM, Myint HY, Hay SI: The global dis-tribution of clinical episodes of Plasmodium falciparummalaria. Nature 2005, 434:214-217.
3. World Health Organization: Malaria epidemics: forecasting, prevention,early detection and control. From policy to practice Leysin, Switzerland,WHO; 2003.
4. Carter R, Mendis KN, Roberts D: Spatial targeting of interven-tions against malaria. Bull World Health Organ 2000,78:1401-1411.
5. Gamage-Mendis AC, Carter R, Mendis C, De Zoysa AP, Herath PR,Mendis KN: Clustering of malaria infections within anendemic population: risk of malaria associated with the typeof housing construction. Am J Trop Med Hyg 1991, 45:77-85.
6. Greenwood BM: The microepidemiology of malaria and itsimportance to malaria control. Trans R Soc Trop Med Hyg 1989,83:25-29.
7. Snow RW, Gouws E, Omumbo J, Rapuoda B, Craig MH, Tanser FC,le Sueur D, Ouma J: Models to predict the intensity of Plasmo-
dium falciparum transmission: applications to the burden ofdisease in Kenya. Trans R Soc Trop Med Hyg 1998, 92:601-606.
8. Thomas CJ, Lindsay SW: Local-scale variation in malaria infec-tion amongst rural Gambian children estimated by satelliteremote sensing. Trans R Soc Trop Med Hyg 2000, 94:159-163.
9. Thompson R, Begtrup K, Cuamba N, Dgedge M, Mendis C, Gamage-Mendis A, Enosse SM, Barreto J, Sinden RE, Hogh B: The Matolamalaria project: a temporal and spatial study of malariatransmission and disease in a suburban area of Maputo,Mozambique. Am J Trop Med Hyg 1997, 57:550-559.
10. Trape JF, Lefebvre-Zante E, Legros F, Ndiaye G, Bouganali H, DruilheP, Salem G: Vector density gradients and the epidemiology ofurban malaria in Dakar, Senegal. Am J Trop Med Hyg 1992,47:181-189.
11. Ernst KC, Adoka SO, Kowuor DO, Wilson ML, John CC: Malariahotspot areas in a highland Kenya site are consistent in epi-demic and non-epidemic years and are associated with eco-logical factors. Malar J 2006, 5:78.
12. Craig MH, Snow RW, le Sueur D: A climate-based distributionmodel of malaria transmission in sub-Saharan Africa. ParasitolToday 1999, 15:105-111.
13. Hay SI, Snow RW, Rogers DJ: Predicting malaria seasons inKenya using multitemporal meteorological satellite sensordata. Trans R Soc Trop Med Hyg 1998, 92:12-20.
14. Omumbo J, Ouma J, Rapuoda B, Craig MH, le Sueur D, Snow RW:Mapping malaria transmission intensity using geographicalinformation systems (GIS): an example from Kenya. Ann TropMed Parasitol 1998, 92:7-21.
15. Tanser FC, Sharp B, le Sueur D: Potential effect of climatechange on malaria transmission in Africa. Lancet 2003,362:1792-1798.
16. Kleinschmidt I, Bagayoko M, Clarke GP, Craig M, le SD: A spatialstatistical approach to malaria mapping. Int J Epidemiol 2000,29:355-361.
17. Snow RW, Peshu N, Forster D, Bomu G, Mitsanze E, Ngumbao E,Chisengwa R, Schellenberg JR, Hayes RJ, Newbold CI, Marsh K: Envi-ronmental and entomological risk factors for the develop-ment of clinical malaria among children on the Kenyancoast. Trans R Soc Trop Med Hyg 1998, 92:381-385.
18. Yang G, Zhou X, Malone JB, McCarroll JC, Wang T, Liu J, Gao Q,Zhang X, Hong Q, Sun L: GIS prediction model of malaria trans-mission in Jiangsu province. Zhonghua Yu Fang Yi Xue Za Zhi 2002,36:103-105.
19. Kitron U, Pener H, Costin C, Orshan L, Greenberg Z, Shalom U:Geographic information system in malaria surveillance:mosquito breeding and imported cases in Israel, 1992. Am JTrop Med Hyg 1994, 50:550-556.
20. Sithiprasasna R, Linthicum KJ, Liu GJ, Jones JW, Singhasivanon P: Useof GIS-based spatial modeling approach to characterize thespatial patterns of malaria mosquito vector breeding habi-tats in northwestern Thailand. Southeast Asian J Trop Med PublicHealth 2003, 34:517-528.
21. Bostoen K, Chalabi Z: Optimization of household survey sam-pling without sample frames. Int J Epidemiol 2006, 35:751-755.
22. Gemperli A, Vounatsou P, Kleinschmidt I, Bagayoko M, Lengeler C,Smith T: Spatial patterns of infant mortality in Mali: the effectof malaria endemicity. Am J Epidemiol 2004, 159:64-72.
23. Hu H, Singhasivanon P, Salazar NP, Thimasarn K, Li X, Wu Y, Yang H,Zhu D, Supavej S, Looarecsuwan S: Factors influencing malariaendemicity in Yunnan Province, PR China (analysis of spatialpattern by GIS). Geographical Information System. SoutheastAsian J Trop Med Public Health 1998, 29:191-200.
24. leSueur D, Sharp BL, Gouws E, Ngxongo S: Malaria in SouthAfrica. S Afr Med J 1996, 86:936-939.
25. Sharp BL, le SD: Malaria in South Africa – the past, the presentand selected implications for the future. S Afr Med J 1996,86:83-89.
26. Richie TL, Saul A: Progress and challenges for malaria vaccines.Nature 2002, 415:694-701.
27. Durrheim DN, La Grange JJ, Govere J, Mngomezulu NM: Accuracyof a rapid immunochromatographic card test for Plasmodiumfalciparum in a malaria control programme in South Africa.Trans R Soc Trop Med Hyg 1998, 92:32-33.
28. Durrheim DN, Harris BN, Speare R, Billinghurst K: The use of hos-pital-based nurses for the surveillance of potential diseaseoutbreaks. Bull World Health Organ 2001, 79:22-27.
Page 5 of 6(page number not for citation purposes)
Malaria Journal 2009, 8:68 http://www.malariajournal.com/content/8/1/68
Publish with BioMed Central and every scientist can read your work free of charge
"BioMed Central will be the most significant development for disseminating the results of biomedical research in our lifetime."
Sir Paul Nurse, Cancer Research UK
Your research papers will be:
available free of charge to the entire biomedical community
peer reviewed and published immediately upon acceptance
cited in PubMed and archived on PubMed Central
yours — you keep the copyright
Submit your manuscript here:http://www.biomedcentral.com/info/publishing_adv.asp
BioMedcentral
29. Coleman M, Coleman M, Mabuza A, Kok G, Coetzee M, Durrheim D:Evaluation of an operational malaria outbreak identificationand response system in Mpumalanga Province, South Africa.Malar J 2008, 7:69.
30. Govere J, Durrheim DN, Baker L, Hunt R, Coetzee M: Efficacy ofthree insect repellents against the malaria vector Anophelesarabiensis. Med Vet Entomol 2000, 14:441-444.
31. Kager PA: Malaria control: constraints and opportunities. TropMed Int Health 2002, 7:1042-1046.
32. Kapp C: Hazard or help? Lancet 2004, 364:1113-1114.33. Booman M, Durrheim DN, La Grange K, Martin C, Mabuza AM, Zitha
A, Mbokazi FM, Fraser C, Sharp BL: Using a geographical infor-mation system to plan a malaria control programme inSouth Africa. Bull World Health Organ 2000, 78:1438-1444.
34. Kulldorff M, Athas WF, Feurer EJ, Miller BA, Key CR: Evaluatingcluster alarms: a space-time scan statistic and brain cancerin Los Alamos, New Mexico. Am J Public Health 1998,88:1377-1380.
35. Kulldorff M, Heffernan R, Hartman J, Assuncao R, Mostashari F: Aspace-time permutation scan statistic for disease outbreakdetection. PLoS Med 2005, 2:e59.
36. Boscoe FP, McLaughlin C, Schymura MJ, Kielb CL: Visualization ofthe spatial scan statistic using nested circles. Health Place 2003,9:273-277.
37. kulldorf m, Feuer EJ, Miller BA, Freeman LS: Breast Cancer innortheastern United States: a geographical analysis. Am J Epi-demiol 1997, 146:161-170.
38. Nkhoma ET, Hsu CE, Hunt VI, Harris AM: Detecting spatiotem-poral clusters of accidental poisoning mortality among texascounties, United States, 1980–2001. Int J Health Geogr 2004,3:25.
39. Odoi A, Martin SW, Michel P, Middleton D, Holt J, Wilson J: Inves-tigation of clusters of giardiasis using GIS and a spatial scanstatistic. Int J Health Geogr 2004, 3:11.
40. Govere J, Durrheim D, La GK, Mabuza A, Booman M: Communityknowledge and perceptions about malaria and practicesinfluencing malaria control in Mpumalanga Province, SouthAfrica. S Afr Med J 2000, 90:611-616.
41. Morrison AC, Getis A, Santiago M, Rigau-Perez JG, Reiter P: Explor-atory space-time analysis of reported dengue cases during anoutbreak in Florida, Puerto Rico, 1991–1992. Am J Trop MedHyg 1998, 58:287-298.
42. Chadee DD, Kitron U: Spatial and temporal patterns ofimported malaria cases and local transmission in Trinidad.Am J Trop Med Hyg 1999, 61:513-517.
43. Gaudart J, Poudiougou B, Ranque S, Doumbo O: Oblique decisiontrees for spatial pattern detection: optimal algorithm andapplication to malaria risk. BMC Med Res Methodol 2005, 5:22.
44. Hjalmars U, Kulldorff M, Gustafsson G, Nagarwalla N: Childhoodleukaemia in Sweden: using GIS and a spatial scan statisticfor cluster detection. Stat Med 1996, 15:707-715.
45. Kulldorf M: A spatial scan statistic. Communications in Statistics:Theory and Methods 1997, 26:1481-1496.
46. Shaheen P, Clart JD, Williams D: Small area analysis: a reviewand analysis of North American literature. J Health Polit PolicyLaw 1987, 12:741-809.
47. Aamodt G, Samuelsen SO, Skrondal A: A simulation study ofthree methods for detecting disease clusters. Int J Health Geogr2006, 5:15.
48. Patil GP, Taille C: Geographic and network surveillance viascan statistics for critical area detection. Stat Sci 2003,18:457-465.
Page 6 of 6(page number not for citation purposes)


![MALARIA [Descriptive Epidemiology of Malaria] Dr …wp.cune.org/.../11/MALARIA-descriptive-epidemiology-of-malaria.pdfMALARIA [Descriptive Epidemiology of Malaria] Dr Adeniyi Mofoluwake](https://img.pdfslide.us/doc/110x75/5ac17de07f8b9ad73f8cf6b2/malaria-descriptive-epidemiology-of-malaria-dr-wpcuneorg11malaria-descriptive-epidemiology-of-.jpg)