Embed Size (px)
Citation preview
LO00
Learning to Make Decisions:LWhen Incentives Help and Hinder
Robin M. Hogarth Brian J. GibbsCraig R. M. McKenzie Margaret A. Marquis
University of ChicagoGraduate School of Business
1)T Center for Decision Research
SJUL 14 1989 June 1989
(yDSponsored by:
Perceptual Sciences ProgramOffice of Naval Research
Contract No. N00014-84-C-0018Work Unit No. R&T 4425080
Approved for publir release; distribution unlimited. Reproduction in whole or in part is permittedfor any purpose of the United States Government.
t713oLL

SECURITY CLASSF Ca" 0% T . 'S PAGE
i Form ApprovedREPORT DOCUMENTATION PAGE OMB No 0704-0188
la REPORT SECjRITY C aSSiF CATION lb RESTRICTIVE MARKINGS
Unclassified N. A.2a SECURITY CLASSIF'CATON AUTHOR-TY 3 DISTRIBUTION, AVAILABILITY OF REPOPT
N A Approved for public release;2b DECLASSIFICATION DOWNGRADING SCHEDULE distribution unlimited.
N. A.4 PERFORMING ORGANIZATION REPORT NUMBER(S) 5 MONITORING ORGANIZATION REPORT NI,BER(S)
Technical Report # 24 Same
3a NAME OF PERFORMING ORGANIZATION 6b OFFICE SYMBOL 7a NAME OF MONITORING ORGAN ZAT ON
University of Chicago (if applicable) Office of Naval ResearchGraduate School of Business _ Code 1142PS6c ADDRESS (City, State, and ZIP Code) 7b ADDRESS (City. State, and ZIP Code)
1101 East 58th Street 800 N. Quincy StreetChicago, IL 60637 Arlington, VA 22217-5000
Ba NAME OF FUNDING ; SPONSORING 8b OFFiCE SYMBOL 9 PRUCUREMENT INSTRUMENT IDENTIFiCA'O NUMBER
ORGANIZATION (If applicable)
Office of Naval Rpqarch ]Code 1142PS N00014-84-C-00188c ADDRESS(City, State, and ZIP Code) 10 SOURCE OF FuNDiNG N UMBERS
800 N. Quincy Street PROGRAM PROjECT TASK VOR, ,,I,Arlington, VA 22217-5000 ELEENT NO NO C ACCE S,ON NO
61153N 421 RR04209 10420901 IR&T 442508CI I TITLE (Include Security Classification)
(U) Learning to make decisions: When incetives help and hinder
12 PERSONAL AUTHOR(S)
,uHoGq:-h, R. M., Gibbs. B. J. . McKenzie. C. R. M. & arquis, A.13a TYPE OF REPORT 1 3b TIME COVERED 114 DATE OF REPORT (Year, Month, Day) [5 PAGE COUNT
Technical I FRONB3/40415Togo=- i4 1989 June 5716 SUPPLEMENTARY NOTATION
17 COSATI CODES 18 SUBJECT TERMS (Continue on reverse if necessary and identit. by block number)
FIELD GROUP SuB-GROuP
19 ABSTRACT (Continue on reverse if necessary and identify by block number) . 12)
Under what conditions do explicit incentives affect learning and performance in decisionmaking? Notinq that feedback often confounds information concerning the underlyingstructure of decision-making tasks (i.e., how variables are related) and levels of per-formance, we distinguish tasks on dimensions of omplexity and,exactingness. By the '
former,'we mean the ease or difficulty of inferring the underlying structure of the task,,by the latter the extent to which erroneous decisions are penalized. Errors are heavilypenalized in exacting environments but lenient environments are forgiving. It is assumedthat incentives increase effort and attti-ion but do not have a direct effect on perfor-mance. Instead, by increasing effort and attention, incentives increase expectations ofperformance. When higher aspirations are not satisfied, however, frustration ensuesleading to lower performance. It is argued that exactingness is unlikely to be important
20 DISTRIBUTION ,AVAILABiLITY OF ABSTRACT 21 ABSTRACT SECURITY CLASSIFICATION
KioUNCLASSI'EDUNLIMITED 0 SAME AS RPT S DTIC USERS Unclassified22a NAME OF ;ESPONSIBLE INDIVIDU)AL 22b TELEPHONE (Include Area Code) 22c OFFICE SYMBO.
John J. O'Hare (202) 696-45021 Code 1142PSDD Form 1473, JUN 86 Previous editions are obsolete SECURITY CLASSfFICATION OF THIS PACE
S/N 0102-LF-014-6603
Unclassifed
SECURITY CLASSIFICATION OF THIS PAGE
19.
in tasks that are inferentially simple or complex because of ceiling and floor effectin the former, there is little room for improvement; in the latter, little possibilitfor decrements in performance. In tasks of intermediate complexity, exactingness ispredicted to have an inverted-U shaped relation with performance. This occurs becaus.feedback in exacting environments induces contrary forces. On the one hand, it is morefined thereby providing greater opportunities for learning; on the other, it is !liable to be more frustrating with outcomes falling below expectations. Becauseincreases in expectations induced by incentives are likely to be satisfied in lenientenvironments but frustrated in exacting ones, incentives are predicted to help per-formance in lenient environments but hinder in exacting. These predictions aretested and validated in two experiments. A further experiment tests the effects ofhaving subjects concentrate on learning the decision making task as opposed to beingconcerned with performance. The experimental results are discussed from boththeoretical and practical perspectives and suggestions made for further research.
.*~ S CCJ'
by
A,.j,I Jilm.ty u des
J , Ii J I(I o r
DD Form 1473, JUN 86 tReverseI SECURITY CLASSIFICATION OF THIS PAGE
3
Learning to make decisions: When incentives help and hinder*
The relation between motivation and performance has intrigued psychologists for many
decades (Yerkes & Dodson, 1908). In this paper, we consider one important aspect of this issue.
What are the effects of external incentives on decision making? More specifically, under what
conditions do incentives aid or impair performance when people are learning to perform decision-
making tasks?
There are several reasons for studying this question. First, at a practical level it is
important to know whether and when providing external incentives improves learning. In business
or the military, for example, does the existence of real consequences in terms, say, of money or
lives help people learn to make decisions more effectively? If incentives are detrimental, how can
learning be structured to overcome this impediment? Second, from a theoretical viewpoint
controversy exists as to whether incentives will necessarily improve performance. From naive
behaviorist or economic viewpoints, for example, one could argue that incentives will always
improve performance and much evidence is consistent with this contention. However, there is also
evidence suggesting that under some conditions incentives may be detrimental to learning (see,
e.g., Lepper & Greene, 1978). One way of reconciling these conflicting views is to specify the
conditions under which the existence of external incentives is likely to help or hinder the learning
of specific kinds of decision-making tasks. This is the goal of the present paper.
To achieve our goal, we argue that it is important to specify three aspects of the system
linking external incentives to learning as measured by performance. These are, first, the kind of
decision-making task; second, the critical features of the environment in which learning occurs;
and third, the mechanisms by which external incentives affect people learning the task. Whereas
the latter will be mediated by characteristics of the human decision maker, the two former aspects
°This work was funded by a contract from the Office of Naval Research.
4
reflect task variables. Behavior, in this case learning and performance, results from the interaction
of both human and task characteristics (cf., Brunswik, 1952; Simon & Newell, 1971).
The paper is organized as follows. We first comment on several studies in the literature that
have considered the link between incentives and performance in decision making. Next, after
specifying the decision-making task considered in this paper, we outline the critical features of task
environments that we believe are important to the relations between incentives and performance.
These are what we call, respectively, the complexity and exactingness of the environment. By the
former, we mean the extent to which it is easy or difficult for the decision maker to infer the
structure of the underlying task in which decisions are made; by the latter, we mean the extent to
which the decision maker is penalized for failing to make the appropriate decisions. In an exacting
environment, even slight deviations from "correct" decisions are heavily penalized; lenient
environments, on the other hand, are forgiving of the decision maker's "mistakes." In discussing
the effects of external incentives, we note that whereas incentives increase effort and/or attention,
they do not necessarily improve performance. On the other hand, we argue that increases in effort
lead to expectations of higher levels of performance which may or may not be realized. These
three considerations concerning (a) the decision-making task, (b) the nature of the decision-making
environment, and (c) effects of incentives on decision makers' expectations, lead to a series of
predictions concerning the relation between incentives and learning that are tested in two
experiments. In a further experiment we consider the effects of having subjects concentrate
attention on learning the decision-making task as opposed to being concerned with performance.
Finally, we discuss the results of our experimental work from both theoretical and practical
perspectives and make suggestions for further research.
Decision making under incentives
In this work we distinguish between internal and external incentives. By internal incentives
we mean any intrinsic motivation people may have to perform well in a task, the source of which
5
can have various origins including, for example, a need to exhibit mastery (White, 1959), pride, or
a wish to impress others. By external incentives we mean explicit rewards such as money that
depend on performance. Thus, when in this paper we talk about manipulating incentives, we refer
only to external incentives.
The role of incentives has been examined in several different types of decision-making
tasks. For our purposes, it is useful to distinguish between studies in which subjects did or did not
receive feedback following their decisions since the latter provide no opportunity for learning.
In the no-feedback studies subjects typically make judgments or choices and are informed
that these will have consequences for them. For example, after having made several hypothetical
choices in gambling experiments, subjects may be required to play a randomly selected choice for
real stakes. Results indicate that under incentives people pay more attention and time to the task and
appear to be more "motivated;" however, it is not clear whether this improves "performance" and,
in particular, whether incentives lead people to concentrate on the appropriate dimensions of tasks.
Indeed, in 1959 Easterbrook summarized a vast psychological literature that shows that under high
drive states people restrict attention to limited ranges of available cues and that this can inhibit both
learning and performance in cognitive tasks. Unless one believes that people should always be able
to intuit "optimal" responses, it should come as little surprise that, in the absence of feedback,
incentives have produced a variety of effects. In some tasks, subjects exhibit greater risk aversion
in respect of possible losses (Slovic, 1969; Schoemaker, 1988). In others, real payoffs did not
reduce the biasing effects of payoff size on inferred subjective probability estimates (Slovic, 1966;
Hogarth & Einhom, 1989), and the presence of incentives has not been found to diminish the level
at which people exhibit "preference reversals" (Lichtenstein & Slovic, 1973; Grether & Plott,
1979). On the other hand, in a task involving the estimation of frequencies, Wright and Aboul-Ezz
(1988) did find that incentives led to more accurate assessments.
The presence of feedback might lead one to expect a simpler relation between incentives
and performance. However, this has not proven to be the case. One well-studied task is the binary-
6
outcome prediction task in which subjects are required to predict which of two signals will appear
on each of a series of trials (for an overview, see Luce & Suppes, 1965). The relative frequency of
the two signals is governed by a Bernoulli process such that on each trial the probability of one
signal appearing is t and that of the other 1 - t. When 7t # .5, the optimal response is to predict
the more frequent signal on every trial. However, this is rarely done. Instead group data tend to
show that the proportion of times subjects choose the more frequent signal approaches 7t as the
number of trials increases. This is known as probability matching as opposed to probability
maximizing behavior. Effects of incentives have produced mixed results in this paradigm. Siegel
(1961) used two levels of monetary incentives and found that, with the greater level of incentives,
the proportion of time subjects chose the more frequent signal became quite extreme (.95 instead of
the normatively appropriate 1.0). Edwards (1956) also found more extreme probabilities under
incentives, and Tversky and Edwards (1966) found that although incentives changed behavior, it
was still far from optimal. In general, the results of these and similar experiments is that payoffs
affect subjects' behavior in the appropriate direction, but that subjects still do not behave as the
normative models prescribe.
More recently, Arkes, Dawes and Christensen (1986) used a probabilistic task in which
subjects were given a good rule that would have enabled them to choose correctly 70% of the time.
They found that, with incentives, subjects were more willing to abandon the rule and try to
outpredict the system with the result that they performed worse than those who had no incentives.
As has been amply documented (see e.g., Hogarth, 1987), the strong desire to master one's
environment can lead people to ignore the implications of statistical regularities and this can be
exacerbated when incentives are high (see also Einhorn, 1986). In commenting on the role of
incentives in the binary-outcome prediction task, Edwards (1956) suggested a hypothesis in the
spirit of the Yerkes-Dodson law. With no real incentives, subjects attempt to match rather than
maximize (it's more fun to try to predict each trial, see Siegel, 1961); with small incentives
7
subjects will move toward maximizing; however, with larger payoffs subjects don't like seeing the
necessary losses associated with a maximizing strategy, and, in trying to predict each trial, regress
to matching behavior.
In an important paper, Schwartz (1982) has studied how reinforcement (rewards for
appropriate responses) shapes the learning and performance of particular behavioral sequences
such that people develop stereotypic responses. This can have both functional and dysfunctional
consequences. Stereotypic responses can be highly effective if one has to deal with the same task
on many future occasions. However, the development of these responses can interfere with
discovering other rules or responses that could also be used to accomplish the task and can
handicap the transfer of knowledge.
Other researchers have shown that rewards are not always beneficial; when, for example,
external incentives are removed for performing a task which people find intrinsically interesting,
subsequent interest and performance in the task can decrease (Lepper, Greene, & Nisbett, 1973;
Levine & Fasnacht, 1974). The presence of incentives has also been found to reduce the amount of
incidental learning people acquire in cognitive tasks, presumably because attention is focussed on
the central task that is rewarded (Bahrick, 1954; Bahrick, Fitts, & Rankin, 1952).
In summarizing many studies on the effects of incentives, McCullers (1978) makes the
point that incentives enhance performance when the latter depends on making "simple, routine,
unchanging responses and when circumstances favor the making of such responses quickly,
frequently, and vigorously" (p.14). He goes on to note that the role of incentives is far less clear
in tasks that require flexible, open-ended and creative responses and, in fact, there is evidence to
suggest that incentives can be detrimental in tasks requiring creativity and problem solving abilities
(McGraw & McCullers, 1979). A similar distinction is made by McGraw (1978) who
distinguishes, on the one hand, between tasks requiring algorithmic or heuristic, problem-solving,
mental strategies, and on the other between tasks that subjects find attractive or aversive. McGraw
reviews several literatures to conclude that incentives are detrimental to performance in tasks that
8
subjects find attractive and which require heuristic, problem-solving, mental strategies.
Theoretical framework
The specific task. The task used in our studies can be characterized on a number of
dimensions. First, it involved a series of discrete decisions made across time in a system with a
stable, underlying data generating process in which successive observations were statistically
independent. Second, on each trial the decision maker observed a value of a predictor variable and
then selected a value of a decision variable. This was followed by immediate feedback expressed
in "evaluation points" concerning the outcome of that decision. Third, in addition to the outcome
feedback, the decision maker was also provided with some additional information concerning the
implications of the decision just taken. Fourth, subjects were instructed that the object of the game
was to maximize the number of evaluation points. To be concrete, in the first experiment subjects
were told that they were managing a small business which sold a perishable product on a daily
basis. Each day (experimental trial) the subject was shown a value of a variable "temperature" (a
weather forecast) prior to making a decision which was the quantity of the product to be ordered
for the day (in number of units). Subjects were told that all units unsold at the end of the day
would be lost. In addition to feedback in terms of evaluation points (an unspecified function of
accounting profits), feedback also consisted of information concerning the number of units sold,
unsold, and the sales cost.
The structure of this task is similar to the much studied single- and multiple-cue probability
learning paradigm (see, e.g., Brehmer & Joyce, 1988) and, as such, suggests that one should be
able to relate results to that literature. However, there is an important difference in that, in addition
to inferring the structure of the underlying system in terms of relations between variables, the
subjects were required to make decisions which were evaluated.
Important dimensions of task environments. The task we employed is similar to many real-
world situations in that subjects are forced to learn by attending to outcome feedback. Whereas it
9
has long been recognized that outcome feedback can be ambiguous, and even misleading (see,
e.g., Hammond, Summers, & Deane, 1973; Einhorn & Hogarth, 1978; Brehmer, 1980), we wish
to emphasize a specific aspect of the ambiguity inherent in outcome feedback in these kinds of
decision-making tasks. This is that outcome feedback simultaneously conveys and confounds
information concerning both the structure of the underlying decision-making task and how well the
subject is performing. Thus, on receiving feedback a person may attempt to infer both something
about the structure of the task (e.g., how two variables are related), and the level of his or her
performance (e.g., better than expected, better than a rival, etc.).
We conceive of feedback as being a function of three variables: (1) the specific action taken
by the decision maker; (2) the nature of the underlying system governing outcomes; and (3) the
manner in which these outcomes are evaluated in the payoffs (i.e., feedback) received by the
subject. To illuminate the distinction between (2) and (3), note that if two otherwise identical tasks
differed only in how outcomes were evaluated, a person making the same decisions in both tasks
could receive different feedback. However, if the person was ignorant a priori of both the nature
of the underlying task and how outcomes were evaluated, it would be difficult to attribute
differences in feedback (i.e., payoffs) to the different evaluation functions as opposed to possible
differences in the structures of the underlying tasks.
This discussion suggests the need to distinguish two aspects of decision-making tasks.
These are, first, complexity, and second, the extent to which the payoff function evaluating
outcomes is relatively lenient or exacting. We define complexity relative to the knowledge of the
decision maker. A task is said to be complex to the extent that the decision maker lacks knowledge
or past experience with it, there are many as opposed to few variables, the cues that suggest the
nature of the underlying system are misleading and/or difficult to interpret, there is random noise in
the system, and so on. Tasks are exacting to the extent that small deviations from optimal
decisions are heavily punished, and lenient to the extent that they are not. In this work, we
characterize decision tasks by their locations in a two-dimensional space of complexity and
10
exactingness as represented in Figure 1.
Relative to a decision-maker's state of knowledge, tasks can be located in Figure 1 along
the horizontal complexity dimension. Similarly, depending on the extent to which deviations from
optimal decisions are penalized, tasks can also be located on the vertical exactingness dimension.
To illustrate, Figure 1 suggests locations of four tasks at the extremes of the two dimensions.
Threading a needle is exacting but simple; in contrast, brain surgery is exacting and complex.
Hitting a target from a short distance falls in the lenient-simple comer, learning to drive in an open
area is in the lenient-complex domain.
As noted above, decision makers frequently do not know where a task is located in this two-
dimensional space. However, because the actual payoff or feedback received by the decision
maker is a function of both the validity of his or her knowledge concerning the underlying system
(and thus of complexity), and the manner in which payoffs are evaluated (i.e., exactingness), the
interpretation of feedback is confounded. Of pa-_ticular interest is how this confounding interacts
with the presence or absence of external incentives.
Insert Figure 1 about here
Effects of external incentives. The experimental evidence reviewed above clearly shows
that the provision of incentives increases attention and effort paid to the task. What is not clear,
however, is the manner in which increased attention and effort affect performance.
The view taken here is that the effect of incentives on performance is mediated by the
decision maker's expectations. Specifically, we draw on the notion and evidence that most people
believe that working harder generally leads to greater rewards (Yates & Kulick, 1977). Thus, if the
direct effect of external incentives is to increase effort, it follows that incentives indirectly affect
expectations of higher levels of performance and their associated rewards.
In summary, we hypothesize that incentives increase expeciations of performance and thus
the aspired level of rewards, i.e., level of aspiration. However, what happens when aspirations
11
are or are not satisfied by actual performance?
When aspirations are attained, the person has a positive experience in which some level of
mastery has been exhibited. This, in turn, can lead to a sense of confidence and the knowledge that
a certain set of rules will lead to satisfactory outcomes.
When aspirations are not attained, however, we postulate that people will suffer a sense of
frustration which can have different effects, both positive and negative. The positive effect of
frustration can be that people exert even greater efforts and, if appropriate, manage to learn from
their negative experience. On the other hand, if such efforts fail, the consequence can be an even
greater sense of frustration accompanied by less effective learning.
Implications. Consider Figure 1 and ask, first, how performance is liable to vary as a
function of the dimensions of complexity and exactingness. Holding other variables constant, we
would expect simple tasks to be learned more easily and effectively than complex tasks. However,
holding complexity constant, it is not clear that the relation would be as simple for exactingness.
Lenient and exacting environments differ in the coarseness of the feedback they provide to
the decision maker. Feedback provided by exacting environments is more sensitive to errors and,
in this sense, provides greater opportunities for learning. On the other hand, exacting
environments have greater potential for frustrating decision makers if they fail to reach their levels
of aspiration. These two contrary forces therefore suggest an inverted-U shaped relation between
learning and exactingness whereby performance is greater for tasks that are at intermediate rather
than more extreme locations of the exactingness scale.
To consider the effects of incentives, recall that incentives are assumed to increase the
decision maker's level of aspiration. In lenient environments, therefore, greater aspirations are
likely to lead to better performance because the decision maker will not be frustrated by failure to
reach those higher aspirations. In contrast, the effect of greater aspirations in exacting
environments is to increase the probability of being frustrated by not reaching those higher
aspirations and thus in lower levels of performance.
12
The differential effect of incentives, however, will also be mediated by the level of
complexity of the task. This prediction is made on the grounds that the effects of exactingness are
assumed to interact with complexity in the following fashion. In very simple tasks, where optimal
responses are learned quickly, aspirations for people both with and without incentives will be
virtually identical. In addition, there will be almost no effect of exactingness in the reedback
observed precisely because people will receive the same feedback (i.e., when making no errors)
irrespective of the exactingness of the environment. In very complex environments, however,
even though people with incentives may set higher aspirations than those without, the difficulty of
achieving both sets of aspirations is likely to be equally frustrating such that differences in
performance will be minimal. In making these arguments about simple and complex tasks, it is
important to state that we have defined limiting conditions. The key point is that our predictions
concerning the interaction of incentives and the exactingness of the environment is most likely to
occur in tasks that are intermediate on the dimension of complexity.
Experimental evidence
The main experimental predictions implied by the above analysis apply to tasks of
intermediate complexity. These are that, first, performance is an inverted-U shaped function of
exactingness. Second, incentives improve performance in lenient environments but hinder
performance in exacting environments. Moreover, it follows that incentives should have little or
no effect on performance in environments that are intermediate in exactingness. Finally, we predict
that incentives will have little or no effect in simple or complex environments. To examine these
predictions, Experiments 1 and 2 consider the effects of incentives in tasks that can be described as
simple and of intermediate complexity, respectively.
An important underlying ratioralo of our work is that feedback confounds information
concerning the underlying structure of the decision-making task and level of performance. It
therefore follows that learning would be enhanced if subjects could ignore the performance
13
dimension of feedback. This prediction is tested in Experiment 3 where subjects performed the
same task as in Experiment 2 but under instructions that emphasized learning as opposed to
performance.
Experiment 1
Rationale. The object was to examine the effects of incentives in an environment that could
be described as simple thereby testing the prediction of no effects of incentives. Whereas this
implies the unsatisfactory procedure of conducting an experiment in the expectation of a null result,
it serves to establish a base-line against which results from the more complex environment
examined in Experiment 2 can be compared.
Subjects. The subjects in this and our other experiments were all recruited in the same
manner through advertisements placed around the University of Chicago. They were offered
between $ 5 and $15 for participating in an experiment on decision making. Their mean age was 21
years and their mean educational level was 2.5 years beyond high school level. In this experiment
there were 66 subjects.
Task. In the task, which was individually administered by microcomputer, subjects were
told to imagine that they were managing a small business which sold a perishable product on a
daily basis. The subject's task was to determine the number of units of the product to be
purchased each day (i.e., experimental trial). This decision variable was labeled "quantity" and
could take values from 1 to 1000. Subjects were informed that before each decision "you will be
shown a weather forecast variable called Temperature."' In fact, demand for the product - - and
thus sales - - was a deterministic function of Temperature which was normally distributed with
mean of 70 and standard deviation of 7. Although Temperature was a random variable, all subjects
saw exactly the same sequence of values across trials. Subjects were told that all units unsold at
the end of the day would be lost. They were informed that the object of the game was to maximize
a score labeled "evaluation points" which was calculated by their boss to evaluate performance.

14
Unknown to the subjects, evaluation points were equal to the accounting profits made on each trial
(i.e., value of sales less cost of goods ordered) minus a penalty that was proportional to the
squared difference between the quantity of goods ordered and actual demand. In the lenient
condition, the constant of proportionality was small and therefore had little potential effect; in the
exacting condition, however, it was large.1 Additional feedback was provided in the form of
values for each decision on variables described as "# sold," " # unsold," and "sales cost."
Subjects were permitted to take notes and were also given the ability to scroll back the computer
screen and examine data from past decisions. The price per unit at which the product was sold was
kept constant throughout the game ("due to government regulation") but subjects were not
informed of this figure. Subjects were kept aware of their performance by having their "Average
evaluation points to date" continually updated and present on the screen of the microcomputer.
Design and procedure. Each subject was assigned at random to one of four groups created
by crossing two levels of two between-subject factors. These were type of decision environment
(lenient vs. exacting) and level of incentives (incentives vs. no incentives). Subjects were not given
any information about how evaluation points were calculated and thus did not know whether they
were in the lenient or exacting condition. Subjects in the no-incentives condition were told "Your
goal is to maximize evaluation points, but your pay will not be based on how well you do."
Subjects in the incentives condition were told that their goal was to maximize evaluation points and
that their pay would depend on how well they did. Subjects were then allowed two practice trials in
order to familiarize themselves with the experimental procedures.
Subjects were first led to believe that they would only play 30 trials "in this part" of the
1 The actual formula used for each trial was nt - 0x(Q - D) 2 where 7t is accounting profit(i.e., sales less cost of goods ordered), Q is the amount (# units) ordered by the subject, and D isdemand (# units). The constant a took different values according to whether the situation waslenient (ac = 0.50) or exacting (a =2.00). This formulation was used so that subjects would be ableto observe a relation between accounting profits and evaluation points in cases in which thequantity ordered exactly matched demand.
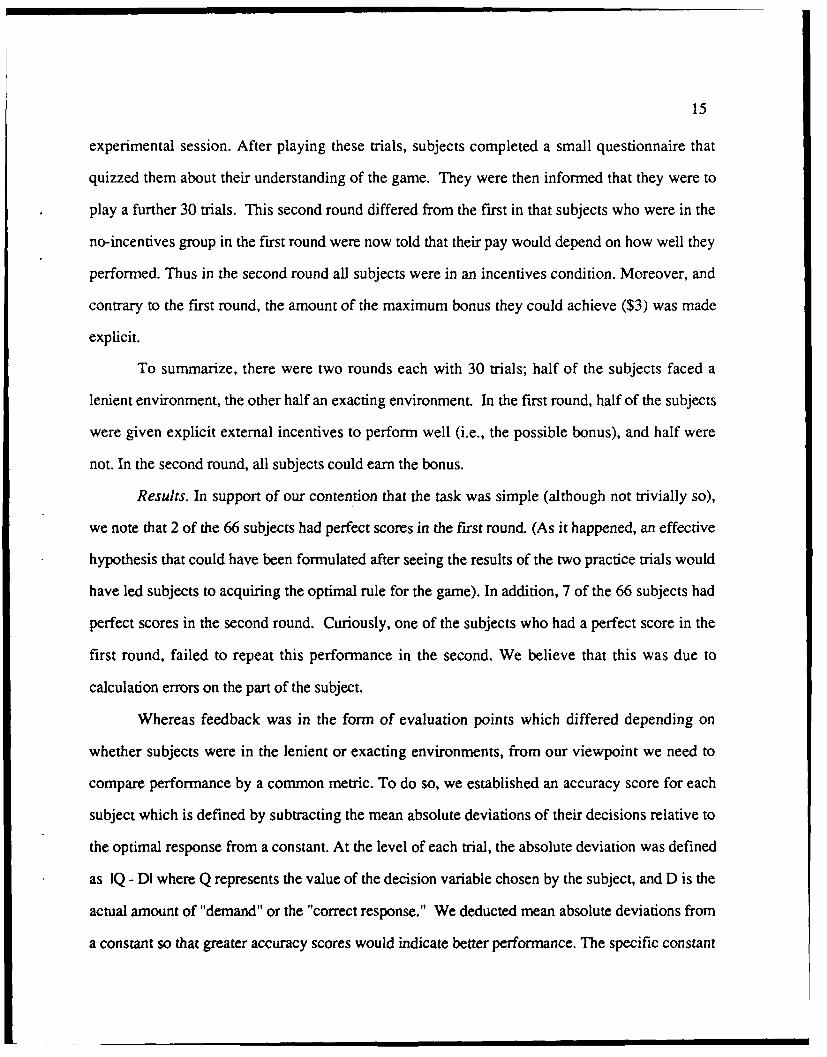
15
experimental session. After playing these trials, subjects completed a small questionnaire that
quizzed them about their understanding of the game. They were then informed that they were to
play a further 30 trials. This second round differed from the fist in that subjects who were in the
no-incentives group in the first round were now told that their pay would depend on how well they
performed. Thus in the second round all subjects were in an incentives condition. Moreover, and
contrary to the first round, the amount of the maximum bonus they could achieve ($3) was made
explicit.
To summarize, there were two rounds each with 30 trials; half of the subjects faced a
lenient environment, the other half an exacting environment. In the first round, half of the subjects
were given explicit external incentives to perform well (i.e., the possible bonus), and half were
not. In the second round, all subjects could earn the bonus.
Results. In support of our contention that the task was simple (although not trivially so),
we note that 2 of the 66 subjects had perfect scores in the first round. (As it happened, an effective
hypothesis that could have been formulated after seeing the results of the two practice trials would
have led subjects to acquiring the optimal rule for the game). In addition, 7 of the 66 subjects had
perfect scores in the second round. Curiously, one of the subjects who had a perfect score in the
first round, failed to repeat this performance in the second. We believe that this was due to
calculation errors on the part of the subject.
Whereas feedback was in the form of evaluation points which differed depending on
whether subjects were in the lenient or exacting environments, from our viewpoint we need to
compare performance by a common metric. To do so, we established an accuracy score for each
subject which is defined by subtracting the mean absolute deviations of their decisions relative to
the optimal response from a constant. At the level of each trial, the absolute deviation was defined
as IQ - DI where Q represents the value of the decision variable chosen by the subject, and D is the
actual amount of "demand" or the "correct response." We deducted mean absolute deviations from
a constant so that greater accuracy scores would indicate better performance. The specific constant
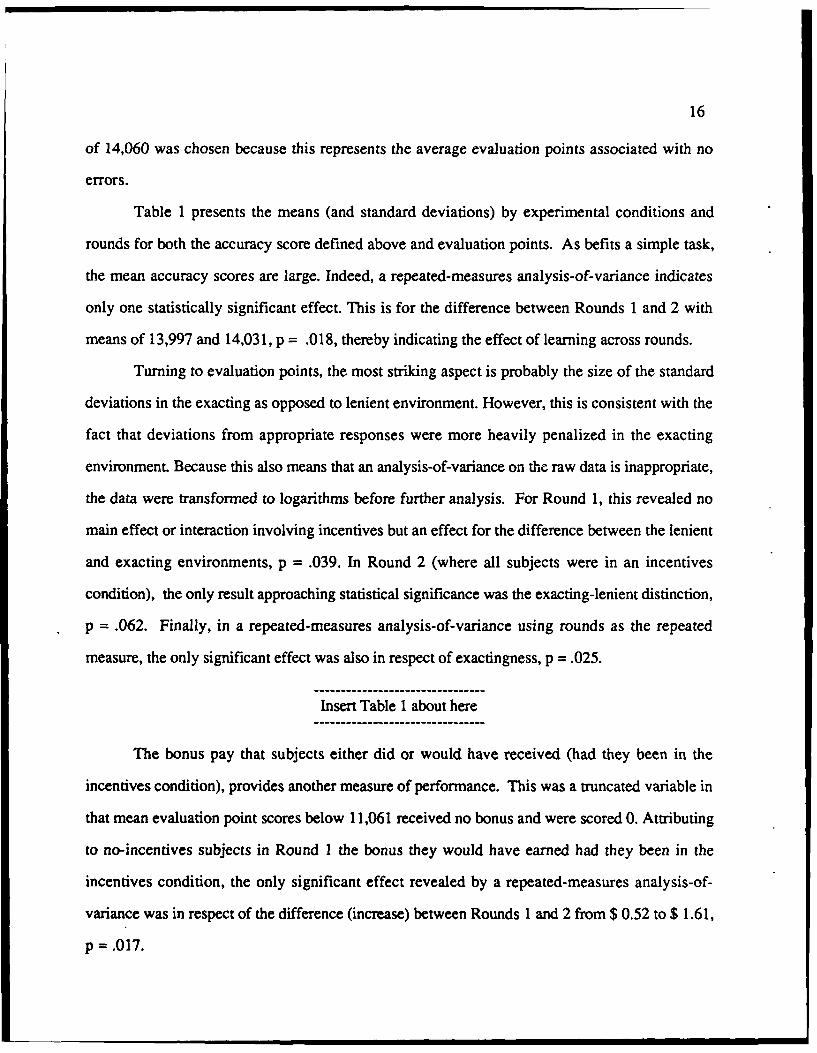
16
of 14,060 was chosen because this represents the average evaluation points associated with no
errors.
Table 1 presents the means (and standard deviations) by experimental conditions and
rounds for both the accuracy score defined above and evaluation points. As befits a simple task,
the mean accuracy scores are large. Indeed, a repeated-measures analysis-of-variance indicates
only one statistically significant effect. This is for the difference between Rounds 1 and 2 with
means of 13,997 and 14,031, p = .018, thereby indicating the effect of learning across rounds.
Turning to evaluation points, the most striking aspect is probably the size of the standard
deviations in the exacting as opposed to lenient environment. However, this is consistent with the
fact that deviations from appropriate responses were more heavily penalized in the exacting
environment. Because this also means that an analysis-of-variance on the raw data is inappropriate,
the data were transformed to logarithms before further analysis. For Round 1, this revealed no
main effect or interaction involving incentives but an effect for the difference between the lenient
and exacting environments, p = .039. In Round 2 (where all subjects were in an incentives
condition), the only result approaching statistical significance was the exacting-lenient distinction,
p = .062. Finally, in a repeated-measures analysis-of-variance using rounds as the repeated
measure, the only significant effect was also in respect of exactingness, p = .025.
Insert Table 1 about here
The bonus pay that subjects either did or would have received (had they been in the
incentives condition), provides another measure of performance. This was a truncated variable in
that mean evaluation point scores below 11,061 received no bonus and were scored 0. Attributing
to no-incentives subjects in Round 1 the bonus they would have earned had they been in the
incentives condition, the only significant effect revealed by a repeated-measures analysis-of-
variance was in respect of the difference (increase) between Rounds 1 and 2 from $ 0.52 to $ 1.61,
p = .017.
17
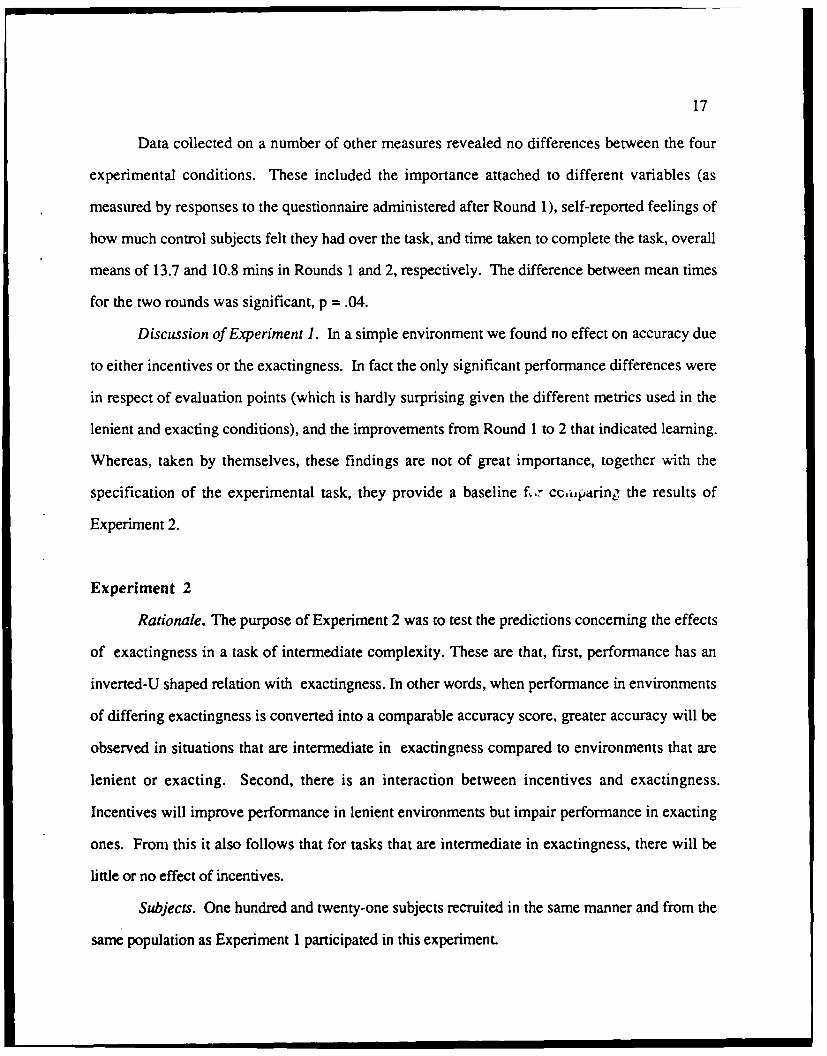
Data collected on a number of other measures revealed no differences between the four
experimental conditions. These included the importance attached to different variables (as
measured by responses to the questionnaire administered after Round 1), self-reported feelings of
how much control subjects felt they had over the task, and time taken to complete the task, overall
means of 13.7 and 10.8 mins in Rounds 1 and 2, respectively. The difference between mean times
for the two rounds was significant, p = .04.
Discussion of Experiment 1. In a simple environment we found no effect on accuracy due
to either incentives or the exactingness. In fact the only significant performance differences were
in respect of evaluation points (which is hardly surprising given the different metrics used in the
lenient and exacting conditions), and the improvements from Round 1 to 2 that indicated learning.
Whereas, taken by themselves, these findings are not of great importance, together with the
specification of the experimental task, they provide a baseline f,,r cca'paring the results of
Experiment 2.
Experiment 2
Rationale. The purpose of Experiment 2 was to test the predictions concerning the effects
of exactingness in a task of intermediate complexity. These are that, first, performance has an
inverted-U shaped relation with exactingness. In other words, when performance in environments
of differing exactingness is converted into a comparable accuracy score, greater accuracy will be
observed in situations that are intermediate in exactingness compared to environments that are
lenient or exacting. Second, there is an interaction between incentives and exactingness.
Incentives will improve performance in lenient environments but impair performance in exacting
ones. From this it also follows that for tasks that are intermediate in exactingness, there will be
little or no effect of incentives.
Subjects. One hundred and twenty-one subjects recruited in the same manner and from the
same population as Experiment 1 participated in this experiment.
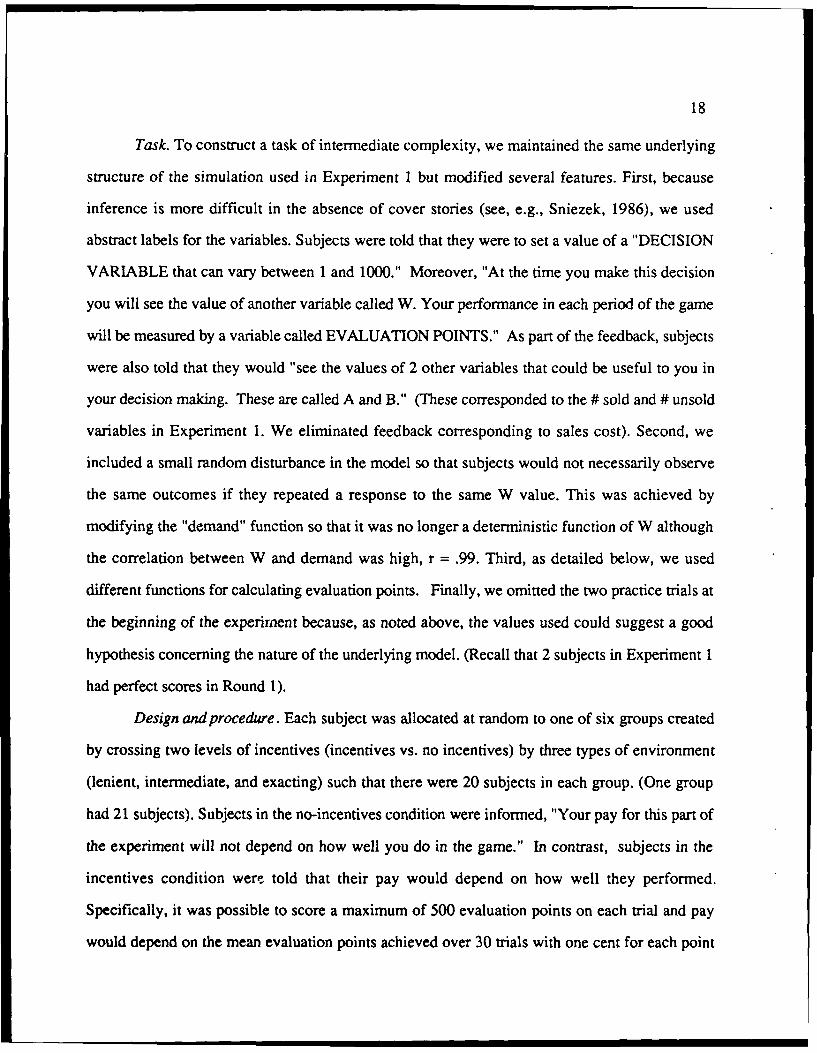
18
Task. To construct a task of intermediate complexity, we maintained the same underlying
structure of the simulation used in Experiment 1 but modified several features. First, because
inference is more difficult in the absence of cover stories (see, e.g., Sniezek, 1986), we used
abstract labels for the variables. Subjects were told that they were to set a value of a "DECISION
VARIABLE that can vary between 1 and 1000." Moreover, "At the time you make this decision
you will see the value of another variable called W. Your performance in each period of the game
will be measured by a variable called EVALUATION POINTS." As part of the feedback, subjects
were also told that they would "see the values of 2 other variables that could be useful to you in
your decision making. These are called A and B." (These corresponded to the # sold and # unsold
variables in Experiment 1. We eliminated feedback corresponding to sales cost). Second, we
included a small random disturbance in the model so that subjects would not necessarily observe
the same outcomes if they repeated a response to the same W value. This was achieved by
modifying the "demand" function so that it was no longer a deterministic function of W although
the correlation between W and demand was high, r = .99. Third, as detailed below, we used
different functions for calculating evaluation points. Finally, we omitted the two practice trials at
the beginning of the experiment because, as noted above, the values used could suggest a good
hypothesis concerning the nature of the underlying model. (Recall that 2 subjects in Experiment I
had perfect scores in Round 1).
Design and procedure. Each subject was allocated at random to one of six groups created
by crossing two levels of incentives (incentives vs. no incentives) by three types of environment
(lenient, intermediate, and exacting) such that there were 20 subjects in each group. (One group
had 21 subjects). Subjects in the no-incentives condition were informed, "Your pay for this part of
the experiment will not depend on how well you do in the game." In contrast, subjects in the
incentives condition were told that their pay would depend on how well they performed.
Specifically, it was possible to score a maximum of 500 evaluation points on each trial and pay
would depend on the mean evaluation points achieved over 30 trials with one cent for each point
19
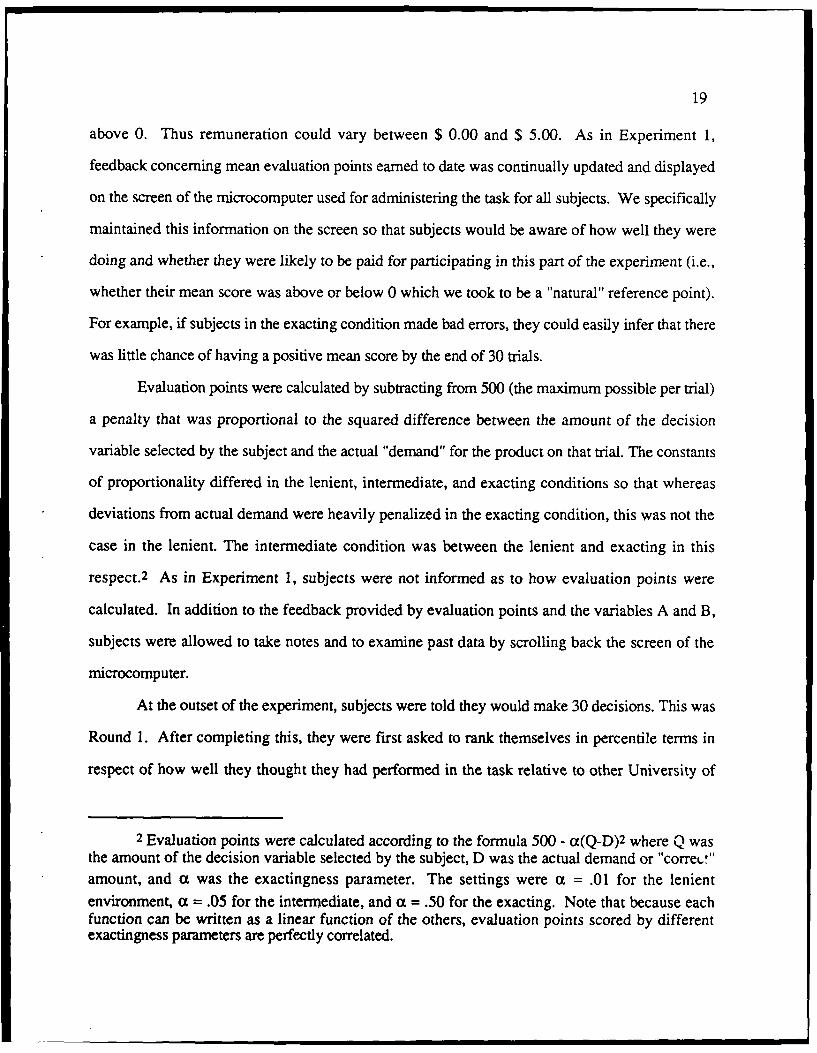
above 0. Thus remuneration could vary between $ 0.00 and $ 5.00. As in Experiment 1,
feedback concerning mean evaluation points earned to date was continually updated and displayed
on the screen of the microcomputer used for administering the task for all subjects. We specifically
maintained this information on the screen so that subjects would be aware of how well they were
doing and whether they were likely to be paid for participating in this part of the experiment (i.e.,
whether their mean score was above or below 0 which we took to be a "natural" reference point).
For example, if subjects in the exacting condition made bad errors, they could easily infer that there
was little chance of having a positive mean score by the end of 30 trials.
Evaluation points were calculated by subtracting from 500 (the maximum possible per trial)
a penalty that was proportional to the squared difference between the amount of the decision
variable selected by the subject and the actual "demand" for the product on that trial. The constants
of proportionality differed in the lenient, intermediate, and exacting conditions so that whereas
deviations from actual demand were heavily penalized in the exacting condition, this was not the
case in the lenient. The intermediate condition was between the lenient and exacting in this
respect. 2 As in Experiment 1, subjects were not informed as to how evaluation points were
calculated. In addition to the feedback provided by evaluation points and the variables A and B,
subjects were allowed to take notes and to examine past data by scrolling back the screen of the
microcomputer.
At the outset of the experiment, subjects were told they would make 30 decisions. This was
Round 1. After completing this, they were first asked to rank themselves in percentile terms in
respect of how well they thought they had performed in the task relative to other University of
2 Evaluation points were calculated according to the formula 500 - a(Q-D) 2 where Q wasthe amount of the decision variable selected by the subject, D was the actual demand or "corre(,!"amount, and a was the exactingness parameter. The settings were cc = .01 for the lenientenvironment, at = .05 for the intermediate, and a = .50 for the exacting. Note that because eachfunction can be written as a linear function of the others, evaluation points scored by differentexactingness parameters are perfectly correlated.
20
Chicago students. They were then told that they were to play a second series of 30 trials under
exactly the same conditions. This was Round 2. Next, subjects were asked to complete a
questionnaire that quizzed them about their understanding of the model underlying the task (i.e.,
relations between variables, and so on). They were then asked to complete a further series of 30
trials for Round 3. For this round, however, subjects who had previously been in the no-
incentives condition were required to make their decisions under the same incentives conditions as
the other subjects. The question on self-ranking of performance was also repeated after Rounds 2
and 3.
To summarize, the design of the experiment involved two between-subject factors, one
with two levels (incentives vs. no incentives), and the other with three (lenient, intermediate, and
exacting environments). There were three rounds each involving 30 trials and subjects completed a
questionnaire about their understanding of the task after the second round. In the third round, all
subjects made their decisions under incentive conditions.
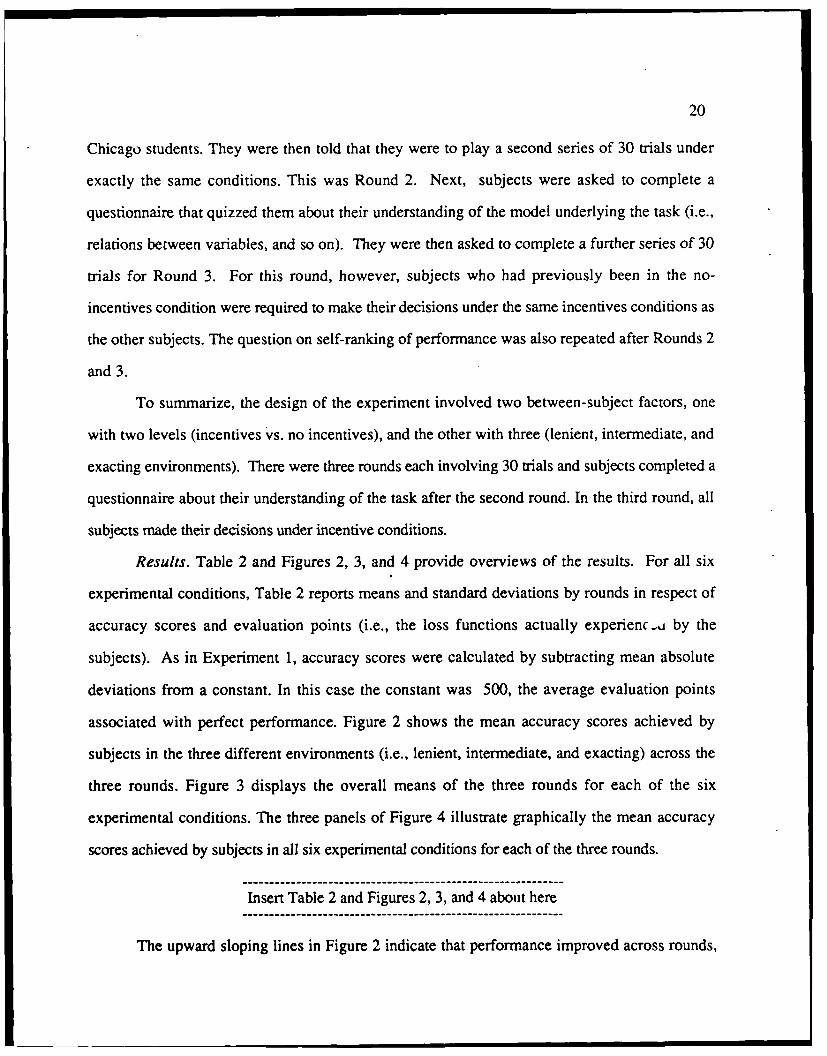
Results. Table 2 and Figures 2, 3, and 4 provide overviews of the results. For all six
experimental conditions, Table 2 reports means and standard deviations by rounds in respect of
accuracy scores and evaluation points (i.e., the loss functions actually experienc .u by the
subjects). As in Experiment 1, accuracy scores were calculated by subtracting mean absolute
deviations from a constant. In this case the constant was 500, the average evaluation points
associated with perfect performance. Figure 2 shows the mean accuracy scores achieved by
subjects in the three different environments (i.e., lenient, intermediate, and exacting) across the
three rounds. Figure 3 displays the overall means of the three rounds for each of the six
experimental conditions. The three panels of Figure 4 illustrate graphically the mean accuracy
scores achieved by subjects in all six experimental conditions for each of the three rounds.
Insert Table 2 and Figures 2, 3, and 4 about here
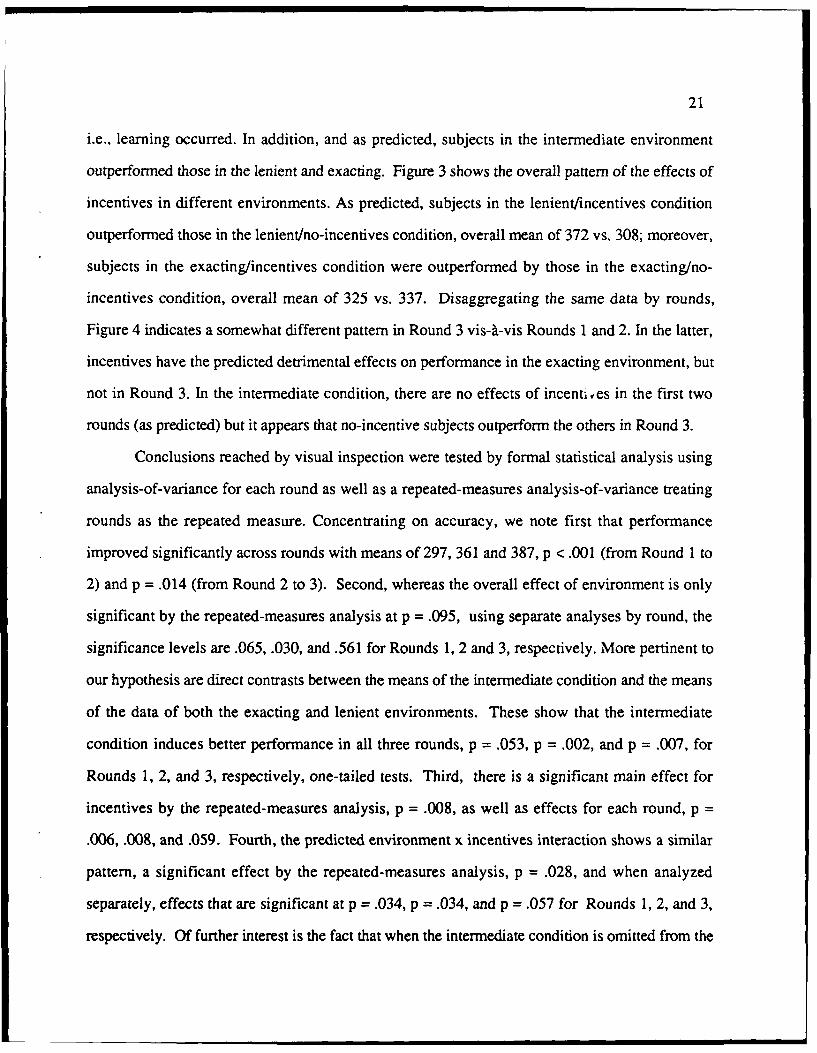
The upward sloping lines in Figure 2 indicate that performance improved across rounds,
21
i.e.. learning occurred. In addition, and as predicted, subjects in the intermediate environment
outperformed those in the lenient and exacting. Figure 3 shows the overall pattern of the effects of
incentives in different environments. As predicted, subjects in the lenient/incentives condition
outperformed those in the lenient/no-incentives condition, overall mean of 372 vs. 308; moreover,
subjects in the exacting/incentives condition were outperformed by those in the exacting/no-
incentives condition, overall mean of 325 vs. 337. Disaggregating the same data by rounds,
Figure 4 indicates a somewhat different pattern in Round 3 vis-A-vis Rounds 1 and 2. In the latter,
incentives have the predicted detrimental effects on performance in the exacting environment, but
not in Round 3. In the intermediate condition, there are no effects of incent- ,es in the first two
rounds (as predicted) but it appears that no-incentive subjects outperform the others in Round 3.
Conclusions reached by visual inspection were tested by formal statistical analysis using
analysis-of-variance for each round as well as a repeated-measures analysis-of-variance treating
rounds as the repeated measure. Concentrating on accuracy, we note first that performance
improved significantly across rounds with means of 297, 361 and 387, p <.001 (from Round 1 to
2) and p = .014 (from Round 2 to 3). Second, whereas the overall effect of environment is only
significant by the repeated-measures analysis at p = .095, using separate analyses by round, the
significance levels are .065, .030, and .561 for Rounds 1, 2 and 3, respectively. More pertinent to
our hypothesis are direct contrasts between the means of the intermediate condition and the means
of the data of both the exacting and lenient environments. These show that the intermediate
condition induces better performance in all three rounds, p = .053, p = .002, and p = .007, for
Rounds 1, 2, and 3, respectively, one-tailed tests. Third, there is a significant main effect for
incentives by the repeated-measures analysis, p = .008, as well as effects for each round, p =
.006, .008, and .059. Fourth, the predicted environment x incentives interaction shows a similar
pattern, a significant effect by the repeated-measures analysis, p = .028, and when analyzed
separately, effects that are significant at p = .034, p = .034, and p = .057 for Rounds 1, 2, and 3,
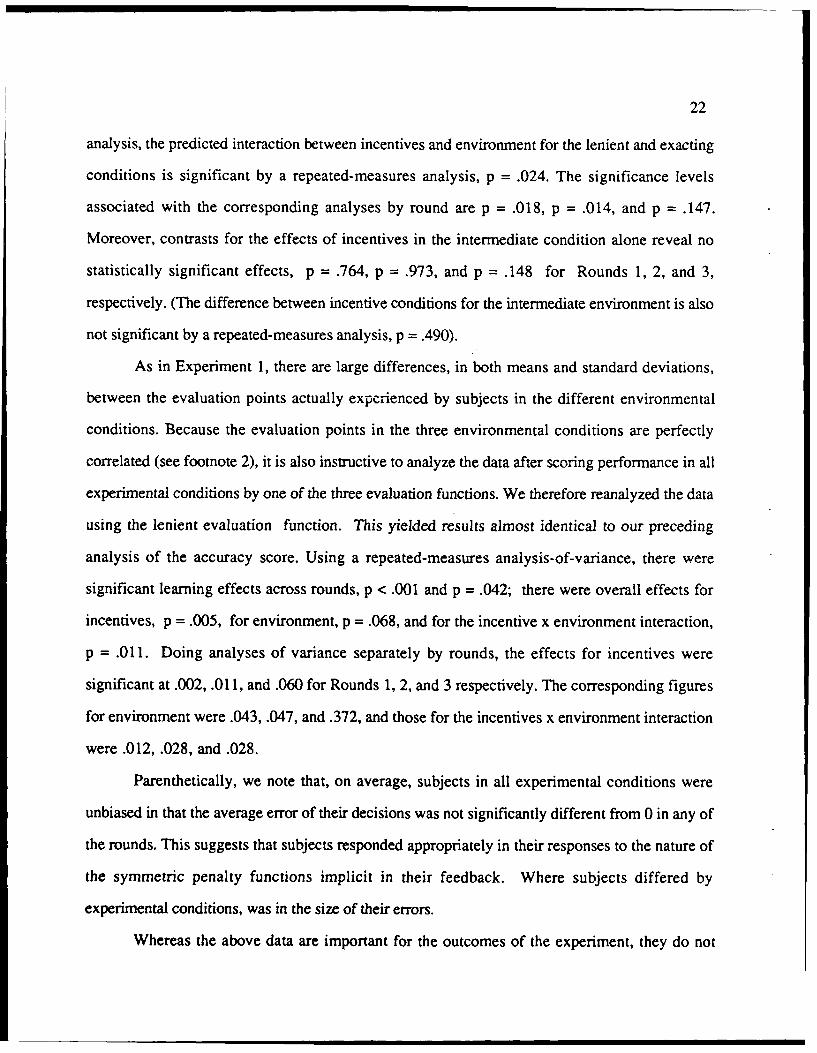
respectively. Of further interest is the fact that when the intermediate condition is omitted from the
22
analysis, the predicted interaction between incentives and environment for the lenient and exacting
conditions is significant by a repeated-measures analysis, p = .024. The significance levels
associated with the corresponding analyses by round are p = .018, p = .014, and p = .147.
Moreover, contrasts for the effects of incentives in the intermediate condition alone reveal no
statistically significant effects, p = .764, p = .973, and p = .148 for Rounds 1, 2, and 3,
respectively. (The difference between incentive conditions for the intermediate environment is also
not significant by a repeated-measures analysis, p = .490).
As in Experiment 1, there are large differences, in both means and standard deviations,
between the evaluation points actually expcrienced by subjects in the different environmental
conditions. Because the evaluation points in the three environmental conditions are perfectly
correlated (see footnote 2), it is also instructive to analyze the data after scoring performance in all
experimental conditions by one of the three evaluation functions. We therefore reanalyzed the data
using the lenient evaluation function. This yielded results almost identical to our preceding
analysis of the accuracy score. Using a repeated-measures analysis-of-variance, there were
significant learning effects across rounds, p < .001 and p = .042; there were overall effects for
incentives, p = .005, for environment, p = .068, and for the incentive x environment interaction,
p = .011. Doing analyses of variance separately by rounds, the effects for incentives were
significant at .002, .011, and .060 for Rounds 1, 2, and 3 respectively. The corresponding figures
for environment were .043, .047, and .372, and those for the incentives x environment interaction
were .012, .028, and .028.
Parenthetically, we note that, on average, subjects in all experimental conditions were
unbiased in that the average error of their decisions was not significantly different from 0 in any of
the rounds. This suggests that subjects responded appropriately in their responses to the nature of
the symmetric penalty functions implicit in their feedback. Where subjects differed by
experimental conditions, was in the size of their errors.
Whereas the above data are important for the outcomes of the experiment, they do not
23
address issues concerning the processes that might have occurred in the different experimental
conditions. Other sources of data, however, shed some light on these issues.
One datum collected by the microcomputer was time taken by subjects to complete each
round. These averaged 22.4, 14.6, and 13.1 minutes for Rounds 1, 2, and 3, respectively. A
repeated-measures analysis-of-variance showed significant differences between rounds, p < .001
and p = .017, but no significant effects for either incentives or environment and no incentive x
environment interaction. On the other hand, accuracy scores were correlated at the individual level
with time spent on the task, r = .21, .29 and .33, for Rounds 1, 2, and 3, respectively. We
therefore reanalyzed our data with time as a covariate. Using accuracy score (and lenient evaluation
points) as the dependent variable(s), an appropriate repeated-measures analysis revealed significant
main effects for incentives, p = .003 (p = .002), environment, p = .013 (p = .008), and the
incentives x environment interaction, p = .026 (p = .010). Analyses by Round 1, 2, and 3,
respectively, also revealed significant main effects for incentives, p = .008, .007, .017 (p = .003,
.010, .021), environment, p = .035, .026, .243 (p = .023, . 035, .143), and the incentives x
environment interaction, p = .041, .045, .055 (p = .016, .040, .027). If anything, using time as a
covariate strengthens our substantive conclusions.
Recall that at the end of each round subjects were asked to rank their performance in
percentile terms vis-A-vis other University of Chicago students. Overall, the means rankings were
at the 45.1, 54.9, and 57.6 percentiles for Rounds 1, 2, and 3, respectively. A repeated-measures
analysis-of-variance showed the difference between Rounds 1 and 2 to be significant, p = .009,
but no other significant effects. At the individual level, it was of interest to note that whereas there
was essentially no relation between self-assessed rank and performance (i.e., evaluation points) for
Round 1, r =. 10, this was not the case for Rounds 2 and 3 where the analogous correlations were
.42 and .48, respectively. Experience with the task did help subjects assess their own performance
more accurately in relative terms.
The questionnaire completed after Round 2 contained two kinds of questions. The first
24
were direct questions concerning which variables subjects deemed most important as well as
whether they thought that "the outcomes of the game (i.e., evaluation points) are determined
according to some systematic set of rules." In respect of the latter, there was an interesting effect
for environment. Subjects in the intermediate condition (who performed best) rated outcomes as
being determined by a more systematic set of rules than subjects in the other conditions, mean of
5.42 on a 7-point scale vs. 4.40 for lenient and 3.88 for exacting, p = .014.
To assess the relative importance of the variables, subjects were asked to indicate the order
in which they would delete the variables W, A, B, and EVALUATION POINTS if they were
forced to make decisions without them. A "1" would mean "delete this variable first," a "2"
meaning "delete this variable next," and so on to "4" meaning "delete this variable last." Thus the
most important variable was ranked 4, the least important 1. Assessing overall perccived
importance by averaging these rankings, W and EVALUATION POINTS were seen as equally
and most important with means of 3.30 and 3.32, respectively. Interestingly, there were some
marginal differences by experimental conditions in how W was viewed in a manner that partially
mimicked performance. W was perceived to be more important in the incenti ves as opposed to the
no-incentives groups, 3.38 vs. 3.22, p = .063. In addition, the variable B ("unsold goods"),
which was far less critical for understanding the task, was seen to be more important in the
exacting environment, 1.70 vs. 1.43 (for lenient) and 1.44 (for intermediate), p = .059. These data
are significant in that they suggest that in conditions in which subjects were relatively more
successful, greater attention was paid to the more important variables.
This suggestion is borne out by considering answers to the open-ended questions. Subjects
were asked to write "How does the game work?" by specifying the roles played by the different
variables and their interrelations, and while imagining having "to explain to an agent how to play
the game in your behalf," to give "a simple description of the system to convey a general sense of
how it works" as well as "any specific tips you might have to achieve high evaluation points." The
answers to these questions were graded like an examination using a preestablished checklist of
25
criteria. Of particular interest was whether subjects articulated both the direction and strength of the
critical relation between W and the decision variable. To simplify matters, we scored each subject's
questionnaire by a 0/1 variable if they explicitly mentioned the appropriate direction, and similarly
for strength. We also gave each subject a total understanding score which, in addition to the scores
for direction and strength, took into account their understanding that there were two types of error
(i.e., setting the decision variable too high as well as too low), recognizing an identity between the
decision variable and the sum of A and B, and whether they gave any valid tips to an "agent." All
these variables were also scored 0/1, and the total score was calculated by summing the scores of
the components (Einhorn & Hogarth, 1975). The ratings of the questionnaires were made
independently by two of the authors and their judgments averaged. As an indication of reliability,
we note that the judges agreed 92% of times for both the direction and strength indices. The
correlation between the scores of the two judges on the total index was .85.
The two panels of Figure 5 plot mean scores on the direction and strength indices by the six
experimental conditions. Analyses of variance on these data show main effects for incentives for
both direction, p = .027, and strength, p = .016. In addition, there is a significant main effect for
environment for the strength variable, p = .009, as well as an environment x incentive interaction,
p = .025. To interpret these data, both the direction and strength of the critical relation were more
clearly articulated by subjects in the incentives condition and there was also a difference for the
strength variable by environment where subjects in the intermediate condition expressed greatest
understanding. Moreover, understanding the strength of the relation exactly mirrored performance
as evidenced by the significant interaction for this variable. This can be seen by noting the
similarity between the patterns of data exhibited in Figures 3 and 5b.
Insert Figure 5 about here
At the individual subject level, the indices are also related to performance. Across all
subjects, the correlations between performance (accuracy score) and the direction index in Rounds
26
1, 2, and 3 are .38, .48, and .45, respectively, with the corresponding figures for thc strength
index being .31, .50, and .46. In addition, the correlations between performance across rounds
and an index of total knowledge (including both direction and strength as components) are .43,
.59, and .62. In order to obtain greater insight into the process, we gave 41 subjects (10 in the
lenient, 21 in the intermediate, and 10 in the exacting environments) more extensive debriefing
interviews in which they were encouraged to describe their thoughts and feelings about the
experiment. In one question, subjects were asked to "describe your experience of playing the game
by a few adjectives or short phrases." Because of the importance of frustration to our theorizing,
we made a simple count of the number of times subjects included words involving "frustration" in
their adjectives or phrases. Without any claim to statistical significance, it was interesting to note
that the relative frequency of reference to frustration varied by environment. Whereas this was
mentioned by 4 out of 10 subjects in the lenient environment, and 3 out of 21 in the intermediate,
there were 7 out of 10 mentions in the exacting environment.
Finally, we found no significant differences when we analyzed results by demographic
variables (e.g., age, gender, mathematics and science vs. non-mathematics and science
background, etc.).
Discussion of Experiment 2. To summarize, Experiment 2 validates the major predictions
of our theoretical framework concerning tasks of intermediate complexity. First, performance was
seen to have an inverted-U shaped relation with exactingness, i.e., performance was better in the
intermediate as opposed to lenient or exacting environments. This lends credence to the notion that
there are both positive and negative aspects of learning under conditions where errors are heavily
penalized. The positive is that exacting feedback is more informative than lenient; the negative is
that exacting feedback can be more disruptive and lead to greater frustration.
Second, there was an interaction between incentives and exactingness. In lenient
environments, incentives improved performance; in exacting environments, incentives impaired
performance; and in an environment characterized as intermediate in exactingness, incentives had
27
no effect.
In addition to performance, recall that we also collected data on how well subjects
understood the experimental task. These were shown to mirror performance. Not only did mean
scores on the direction and strength indices (indicating how well subjects articulated their
understanding of the key predictive relation) match relative performance in the different
experimental groups, but relatively high correlations existed between these variables and measures
of performance (i.e., evaluation points) at the individual level. These are important findings. First,
they indicate that performance was accompanied by an accurate awareness of the key predictive
relation. This contrasts with results of Broadbent and Aston (1978) and Broadbent (1977), who
found no relation between the ability to verbalize understanding of relations between variables
learned through taking decisions and performance. However, the tasks explored by these
investigators (an economic simulation game and a simpler laboratory task) differed from ours on
many dimensions such that it is difficult to state with confidence any hypothesis for the contrasting
results. Second, the fact that performance and the ability to articulate the underlying rationale were
significantly correlated mitigates the possibility that results of our experiment were due to chance.
One of the main theoretical motivations for our research is the notion that feedback is
confounded by the twin tasks of inferring the underlying structure of the task and assessing one's
level of performance. It therefore follows that if one of these sources of confusion were removed,
performance should improve. This notion was subjected to the following experimental test.
Experiment 3
Rationale. The objective was to test how well subjects would score over 30 trials in Round
3 under incentive conditions if they were allowed to learn the task without cost over two preceding
rounds of 30 trials each.
Subjects. There were 41 subjects from the same population as Experiments 1 and 2 who
were recruited in the same manner.
28
Task. This was the same as Experiment 2 with two exceptions. First, instructions differed
in that subjects were told "The object of this game is to maximize EVALUATION POINTS.
However, in playing the game you should not be concerned with how well you do. Instead, your
objective is to learn how the game works." In addition, half of the subjects were specifically told
to expect to be asked how the game worked and to make their understanding explicit. Second,
after Rounds 2 and 3 subjects did not rank their own performance. Instead they ranked how well
they thought they had understood the task relative to other University of Chicago students.
Design and procedure. Subjects were allocated at random to four groups created by
crossing two levels of two between-subjects conditions. These were level of instructions
(specifically told to expect to have to explain their understanding of the game vs. not explicitly told)
and exactingness of the task environment (lenient vs. exacting using the same parameters as
Experiment 2). Apart from the differences in the task noted above, procedures were exactly the
same as in Experiment 2. In summary, subjects had two rounds of 30 trials in which their task was
to discover how the system worked; they then completed the same questionnaire used in
Experiment 2 prior to being switched to the same incentives condition experienced by subjects in
that experiment.
Results. We first note that there were no significant main effects or interactions involving
the difference in the levels of the instructions given to the subjects concerning whether they would
be asked later on to explain their understanding of the game. We therefore ignore this experimental
manipulation.
We contrast results with subjects in the comparable lenient and exacting environments in
Experiment 2. One important finding was that subjects in Experiment 3 took, on average, 55%
longer than their counterparts to complete the experimental tasks. Mean times were 33.2 vs. 22.0
mins in Round 1, 23.6 vs. 13.4 in Round 2, and 18.0 vs. 12.8 in Round 3. All differences are
statistically significant, p = .017, p < .001, and p = .016, respectively. This result is particularly
interesting because subjects in both experiments were given the same expectations concerning
29
remuneration for participating in the experiment and had identical incentives in Round 3. In
addition, neither group was told how long to spend on the experimental tasks. Apparently giving
subjects a set to learn induced a more careful approach (as evidenced by time spent) that also
carried over to the incentives condition in Round 3.
As in Experiment 2, there was also a relation between how well subjects thought they had
performed in the task after Round 3 and actual performance in evaluation points, r = .51.
Table 3 summarizes data on mean accuracy scores for Round 3 (where all subjects were in
an incentives condition) as well as indices of understanding in respect of direction and strength of
the important predictive relation determining outcomes based on the questionnaire completed at the
end of Round 2. For mean accuracy score, an appropriate analysis-of-variance reveals no
significant main effects nor interactions.
Contrasts between conditions reveal, however, that although performance of subjects in
Experiment 3, the "inference" group, was better than the no-incentives group, t = 1.96, p = .053,
there was no difference between the incentives and inference groups, t = .619, p = .538. In other
words, averaging across both lenient and exacting environments, subjects who learned under
incentives in Rounds 1 and 2 performed as well in Round 3 as the inference subjects who had been
given a set to learn despite the fact that the latter took much longer over the task. The inference
subjects did, however, perform better than subjects who played the first two rounds under a no-
incentives condition.
Insert Table 3 about here
The results on performance are mirrored by the understanding of the task expressed by the
subjects at the end of Round 2. As shown in Table 3, subjects in the inference condition had a
better understanding of both the direction and strength indices than the others with means of 0.61
vs. 0.50 and 0.33, for the former, and 0.56 vs. 0.30 and 0.23, for the latter. Analyses-of-variance
showed that main effects of condition were statistically significant for both the direction and
30
strength indices, p = .030 and p = .004, respectively. There were also main effects for lenient vs.
exacting environments, p = .055 for direction and p = .006 for strength, and a significant
incentives x environment interaction for strength, p = .028.
Further comparisons can also be made between subjects in the intermediate condition in
Experiment 2 and the subjects in Experiment 3. The mean accuracy score in Round 3 of
intermediate subjects did not differ significantly from the inference subjects, 415 versus 397, t =
.979, p = .331. In addition, there were no significant differences between the scores both groups
achieved on the direction and strength indices. In short, there were no significant differences in
either performance or understanding between the inference subjects, averaging over lenient and
exacting environments, and subjects in an environment of intermediate exactingness, averaging
over conditions of incentives and no-incentives. In other words, there are different paths to the
same levels of performance and understanding.
Finally, correlations between individual scores on the understanding indices and
performance were also high for the inference group. These were for Rounds 1, 2, and 3,
respectively, .24, .65, and .60 for direction; .36, .60, and .55 for strength; and .30, .75, and .67
for the index of total knowledge.
Discussion of Experiment 3
Contrasting the results of Experiment 3 (inference) with those of Experiment 2 (incentives
and no-incentives), performance in Round 3 (in which all subjects were in an incentives condition)
is seen to reflect subjects' prior exposure to the decision-making task. The inference subjects
outperform those in the no-incentives condition but do no better on average than the incentives
condition. On the other hand, the data suggest the possibility that this latter conclusion might be
mediated by the exactingness of the environment because whereas inference is better in the exacting
environment (mean accuracy score of 405 versus 372), it is essentially the same in the lenient (389
versus 399). Of additional interest is the fact that subjects in the inference condition were more
31
capable of articulating an accurate understanding of the task than their counterparts in Experiment
2. A difficulty in interpreting these data, however, is that subjects in Experiment 3 took on average
55% longer to complete the tasks. Thus any gains in performance should be measured against the
additional cost in time.
Whereas subjects in Rounds 1 and 2 of Experiment 3 were instructed to learn the game and
thus ignore the evaluative dimension of feedback, it is unclear whether people could ignore the
evaluative implications of any feedback. That this may have happened is supported by two pieces
of evidence. First, if exacting feedback has greater potential for learning, one would expect
subjects in the exacting condition to have learned more effectively in the absence of evaluation.
However, performance in Round 3 between inference subjects in the lenient and exacting
environments did not differ significantly (389 vs. 405). Second, whereas from our viewpoint
scoring performance of the inference subjects lacks meaning for Rounds 1 and 2, these subjects
still observed the evaluation points they would have achieved. Moreover, their mean accuracy
"scores" were comparable to those of subjects in Experiment 2 (283 vs. 288 and 359 vs. 344)
thereby suggesting that they were sensitive to the level of evaluation points.
General discussion
The present studies show that, in tasks of intermediate complexity, feedback scored by
lenient or exacting evaluation functions is less effective in promoting learning than feedback scored
by an intermediate evaluation function. Moreover, the type of evaluation function interacts with
incentives. Incentives foster learning in lenient environments but hinder learning in exacting
environments. In intermediate environments, incentives have no differential effect on learning.
These conclusions refer to performance on the decision-making task but are also mirrored by the
ability to articulate the key relation in the task studied. We further demonstrated the relative
effectiveness of giving people a "set" to learn rather than perform but noted that this led to
spending 55% more time on the task. Finally, we showed that in a simple task (Experiment 1),
32
there were no differential effects of incentives. At the very least, the studies demonstrate the
complex nature of the relation between incentives and performance. We now discuss these results
from both theoretical and practical perspectives. We also suggest topics for further study.
Theory. The theoretical contributions of our work involved assumptions concerning the
nature of feedback in decision-making tasks and the manner in which incentives affect individuals
engaged in such tasks.
The observation that feedback may not only be ambiguous with respect to inferring the
structure of decision-making tasks but is confounded with information concerning performance,
led to characterizing decision-making tasks on the twin dimensions of complexity and
exactingness. Whereas many other studies have considered effects of feedback on learning, we
believe that our studies are unique in investigating the effects of exactingness or the manner in
which decisions are evaluated within the same decision-making task, i.e, holding inferential
complexity constant. For example, unrelated to issues of evaluating performance, the fact that
outcome feedback may not be effective in learning has been noted by many investigators. Balzer,
Doherty, and O'Connor (in press) review several studies demonstrating that feedback that
emphasizes the nature of relations in the environment (so-called cognitive feedback) is more
effective in teaching people to learn than outcomes alone. Einhorn and Hogarth (1978) showed
that when feedback is incomplete, it may mislead people into believing that they understand
relations when in fact they don't. This is particularly likely to be the case when actions are taken
that preclude the observation of outcomes associated with the action not taken. For example, in
many hiring decisions in industry, firms learn about the effectiveness of the employees they hire,
but nothing about the subsequent job performance of those they don't hire. To improve learning,
firms would have to experiment by hiring employees whom they judged to be unqualified and then
observe their perforr.iance. Such experimentation, however, implies short-term costs and it is not
clear that people are willing to make these investments (see also Brehmer, 1980; Einhorn, 1980;
Schwartz, 1982). In our studies, we were struck by the fact that subjects in both the no-incentives
33
(of Experiment 2) and inference (Experiment 3) conditions did not seem willing to trade-off
learning and performance at a level different from those operating under incentives.
In an unusually thorough investigation of the process of learning, Klayman (1988)
demonstrated the importance of experimentation by forcing one group of subjects to learn only
through observation while allowing a second group to experiment. In subsequent performance on a
prediction task, the second group was more accurate. One intriguing issue raised by this and other
studies is to specify what cues encourage people to adopt a more experimental approach to
learning.
Concerning the role of incentives on performance, our analysis differs from traditional
accounts (for a review, see McCullers, 1978) by assuming that the relation between these two
variables is indirect rather than direct. In our model, increases in incentives are only assumed to
increase effort and attention paid to the task. Increases in effort and attention, however, are
assumed to increase expectations of performance or levels of aspiration, i.e., working harder leads
to expecting to do better. Actual performance, however, may or may not satisfy these new
aspirations. Because higher aspirations are more likely to be satisfied in lenient environments, this
leads to better performance; however, failure to reach aspirations in exacting environments leads to
a heightened sense of frustration and lower levels of performance. Note that this does not mean
that people will fail to learn under incentives in exacting environments. In fact, our subjects
showed marked signs of learning across the three rounds of experimental trials. But it does mean
that learning in exacting environments in the presence of incentives will tend to be slower and less
effective.
Whereas our postulated account of the effects of incentives can account for our data, other
forces may produce similar or complementary effects. In a comprehensive review, Easterbrook
(1959) summarized much literature showing that in high drive states (of motivation) attention is
narrowly focussed such that people consider only a limited range of cues. In lenient environments,
therefore, where failure to make optimal responses involves smaller ranges of penalties than in
34
exacting environments, incentives might induce a good match between the range of cues people are
motivated to observe and the empirical ranges that are actually observable. In exacting
environments, however, incentives would accentuate mismatching of ranges. Further experimental
work is needed to examine this hypothesis and to contrast it with the account based on the effects
of changes in levels of aspiration.
In reviewing many studies in which incentives were seen to have both positive and negative
effects on performance, McGraw (1978) noted that whereas incentives would seem to be
detrimental in tasks that people find "attractive" (in the sense of interesting to the subjects) and that
require heuristic, problem-solving mental strategies, they help performance in tasks that people
either find "aversive" (in the sense of uninteresting) or requiring practiced, algorithmic procedures
such as lever pressing or remaining vigilant. This classification does not fit our findings. Whereas
our task does require higher-order mental processes, it is unclear how to classify tasks varying on
exactingness as to whether people find them "attractive" or "aversive" within McGraw's definition.
More work is needed to find a larger conceptual framework in which to fit the findings reviewed
by McGraw with our own.
Practice. Our results raise many practical issues concerning the conditions under which
one would or would not wish to provide incentives to foster learning in decision-making tasks.
First, however, it is appropriate to consider the limitations of our experimental paradigm and thus
the extent to which the findings might be expected to generalize to a wider range of situations. In
many ways, our experiments provided almost ideal opportunities for learning compared to more
realistic settings. Feedback following decisions was immediate. Subjects could take notes and
consult their histories of past decisions. The task did not involve a large number of variables and
there was a limited number of relations between variables in the system that were important.
Moreover, the system generating observations did not change across time. There are many real-
world tasks that exhibit similar characteristics, for example, production and inventory scheduling
decisions, predictions of economic and financial indicators, and weather forecasts. Where these
35
tasks may differ from ours, however, is that people would typically not make so many decisions in
such a short period of time (experiments tend to collapse experience in terms of time). In one
sense, real-world tasks may also be more inferentially complex than ours; on the other hand, this
complexity may be offset by having more time to think through issues prior to making decisions.
On the other hand, there are other real-world tasks that are similar to ours and where people do
experience much feedback within fairly short periods of time. These include learning to handle
mechanical or electronic devices, for example, word-processing systems, where people make
frequent decisions and see almost immediate feedback.
Two important dimensions of real-world tasks are whether people are aware of the
exactingness of the environment and whether they or others have the ability to control or
manipulate it. In many situations, where outcomes and rewards are the same (as in financial
transactions), people are typically ignorant of the effects of exactingness. Thus, incentives may or
may not promote effective learning. In this case, it would be advisable to learn to make decisions
within an "inference" set (as in Experiment 3) before having to deal with real payoffs. On the other
hand, in situations where it is possible to control how decisions are evaluated (as in our
experiments), this may be used deliberately in training decision makers. The implications from our
results are clear. Intermediate environments induce more effective learning than lenient or exacting
ones and incentives make little difference. If one is forced into using a lenient evaluation function,
however, use incentives; with an exacting function, don't use incentives. Finally, in our task
subjects were not told how they were evaluated, i.e., how decisions and outcomes were translated
into evaluation points. An argument could be made that learning would be fostered if people were
aware of the exact nature of the evaluation function because this would reduce one source of
ambiguity in feedback. On the other hand, because different evaluation functions induce different
rates of learning, it is not clear that it would always be advantageous to reveal these functions to
learners.
Issues for further study. Because, to the best of our belief, the effects of exactingness and
36
incentives have not previously been studied together, the present research suggests many issues for
further investigation. We mention a few.
First, the evaluation functions used in the tasks of intermediate complexity in Experiments
2 and 3 were symmetric. Subjects received the same penalty if they over- or undershot the
appropriate setting of the decision variable. It would also be interesting to investigate different
types of asymmetric evaluation functions. In particular, with highly skewed functions subjects
would experience large variations in penalties which might be similar in effect to exacting
environments with symmetric functions. However, they would probably also learn to adjust
responses to avoid the larger penalties. Whether such learning would take place soon enough to
avoid the effects of frustration observed in the exacting conditions in our experiments remains an
open question. In our work, we adopted a simple mechanism to model exactingness in the
environment. It is possible this could be achieved in other ways.
Second, the present work employed an incentives and no-incentives condition without
recognizing the fact that there could be different levels of incentives. Whereas the level of
incentives used was sufficient to induce effects, we have no information concerning the relation
between size of incentives and effects. We suspect that in a laboratory task relatively small
differences in real money paid to subjects do have motivational effects (see also Edwards, 1956;
Arkes et al., 1986; Hogarth & Einhorn, 1989) but are uncertain how this might generalize outside
the psychological laboratory.
Third, a related question centers on whether the effects we observed are unique to
incentives per se or whether other variables which demand that greater attention and effort be paid
to tasks induce similar outcomes. Two interesting variables are threat or stress and time pressure.
Both can require that greater attention and effort be paid to the task. However, they could also lead
to reducing levels of aspiration (cf. Mano, in press) such that one could obtain quite different
effects of learning in lenient and exacting environments than observed in our studies.
Fourth, our characterization of task variables in terms of only two dimensions, complexity
37
and exactingness, is necessarily incomplete. Recently, Hammond et al. (1987) have elaborated a
theory of how characteristics of tasks map into different modes of cognition that vary on a
continuum from analysis to intuition. Hammond et al. would classify our task as "analysis-
inducing" such that it would best be handled by an analytical mode of cognition. It is an open and
interesting issue as to whether our theoretical framework and results would also apply in tasks that
could be defined as "intuition-inducing."
Fifth, we noted above that by informing people of the nature of evaluation functions one
should, in principle, reduce the ambiguity of outcome feedback. However, because feedback still
implies an evaluation, it is not clear that people are able to separate the informational content of
feedback concerning the inferential structure of the task from its evaluative component. This
suggests conducting studies similar to those reported above where the nature of the evaluation
function is made explicit to the subjects. The question asked is whether it is necessarily better to
inform people how they are being evaluated.
Sixth, a central premise of this work is that feedback is ambiguous. Given this ambiguity,
it is legitimate to ask whether people might learn more effectively if they received less rather than
more information about the effectiveness of past decisions. For example, instead of providing
feedback for each decision, would subjects perform better by the end of the experimental session if
they only received feedback in the form of average statistics over small blocks of trials?
Advantages are that subjects might be forced to experiment with particular strategies over specific
blocks of trials and the effects of random error would be mitigated by the averaging process.
To conclude, we have demonstrated that small changes in the parameter of the function that
evaluates outcomes of decisions can induce significant changes in performance as well as reverse
the sign of the effects of incentives. Such sensitivity to a single task feature merits more detailed
attention.
38
References
Arkes, H. R., Dawes, R. M., & Christensen, C. (1986). Factors influencing the use of a decision
rule in a probabilistic task. Organizational Behavior and Human Decision Processes, 37,
93-110.
Bahrick, H. P. (1954). Incidental learning under two incentive conditions. Journal of Experimental
Psychology, 47, 170-172.
Bahrick, H. P., Fitts, P. M., & Rankin, R. E. (1952). Effects of incentive upon reactions to
peripheral stimuli. Journal of Experimental Psychology, 44,400-406.
Balzer, W. K., Doherty, M. E., & O'Connor, R. Jr. (in press). The effects of cognitive feedback
on performance. Psychological Bulletin.
Brehmer, B. (1980). In one word: Not from experience. Acta Psychologica, 45, 223-24 1.
Brehmer, B., & Joyce, C. R. B. (1988). (Eds.) Human judgment: The SJT view. Amsterdam,
Holland: Elsevier.
Broadbent, D. E. (1977). Levels, hierarchies, and the locus of control. Quarterly Journal of
Experimental Psychology, 29, 181-201.
Broadbent, D. E., & Aston, B. (1978). Human control of a simulated economic system.
Ergonomics, 21(12), 1035-1043.
Brunswik, E. (1952). Conceptual framework of psychology. Chicago: University of Chicago
Press.
Easterbrook, J. A. (1959). The effect of emotion on cue utilization and the organization of
behavior. Psychological Review, 66 (3), 183-201.
Edwards, W. (1956). Reward probability, amount, and information as determiners of sequential
two-alternative decisions. Journal of Experimental Psychology, 52, 177-188.
Einhorn, H. J. (1980). Learning from experience and suboptimal rules in decision making. In T.
Wallsten (Ed.), Cognitive processes in choice and decision behavior (pp. 1-20). Hillsdale,
39
NJ: Erlbaum.
Einhorn, H. J. (1986). Accepting error to make less error. Journal of Personality Assessment,
50(3), 387-395.
Einhorn, H. J., & Hogarth, R. M. (1975). Unit weighting schemes for decision making.
Organizational Behavior and Human Performance, 13, 171-192.
Einhorn, H. J., & Hogarth, R. M. (1978). Confidence in judgment: Persistence of the illusion of
validity. Psychological Review, 85, 395-416.
Grether, D. M., & Plott, C. R. (1969).Economic theory of choice and the preference reversal
phenomenon. American Economic Review, 69 (4), 623-638.
Hammond, K. R., Summers, D. A., & Deane, D. H. (1973). Negative effects of outcome-
feedback in multiple-cue probability learning. Organizational Behavior and Human
Performance, 9, 30-34.
Hammond, K. R., Hamm, R. M., Grassia, J., & Pearson, T. (1987). Direct comparison of the
efficacy of intuitive and analytical cognition in expert judgment. IEEE Transactions on
Systems, Man, and Cybernetics, SMC-17 (5), 753-770.
Hogarth, R. M. (1987). Judgement and choice: The psychology of decision, (2nd ed.).
Chichester, England: John Wiley & Sons.
Hogarth, R. M., & Einhorn, H. J. (1989). Venture theory: A model of decision weights.
Unpublished manuscript, University of Chicago, Graduate School of Business, Center for
Decision Research.
Klayman, J. (1988). Cue discovery in probabilistic environments: Uncertainty and
experimentation. Journal of Experimental Psychology: Learning, Memory, and Cognition,
14(2), 317-330.
Lepper, M. R., & Greene, D. (Eds.) (1978). The hidden costs of reward. Hillsdale, NJ: Erlbaum.
Lepper, M. R., Greene, D., & Nisbett, R. E. (1973). Undermining children's intrinsic interest
with extrinsic reward: A test of the overjustification hypothesis. Journal of Personality and
40
Social Psychology, 29, 129-137.
Levine, F. M., & Fasnacht, G. (1974). Token rewards may lead to token learning. American
Psychologist, 29, 816-820
Lichtenstein, S., & Slovic, P. (1973). Response-induced reversals of preference in gambling: An
extended replication in Las Vegas. Journal of Experimental Psychology, 101(1), 16-20.
Luce, R. D., & Suppes, P. (1965). Preference, utility, and subjective probability. In R. D. Luce,
R. R. Bush, & E. Galanter (Eds.) Handbook of Mathematical Psychology,Vol. III.
(pp.249-410). New York: John Wiley & Sons.
Mano, H. (in press). Anticipated deadline penalties: Effects on goal levels and task performance.
In R. M. Hogarth (Ed.), Insights in decision making: A tribute to Hillel J. Einhorn.
Chicago, IL: University of Chicago Press.
McCullers, J. C. (1978). Issues in learning and motivation. In M. R. Lepper & D. Greene (Eds.)
(pp. 5-18). The hidden costs of reward. Hillsdale, NJ: Erlbaum.
McGraw, K. 0. (1978). The detrimental effects of reward on performance: A literature review and
a prediction model. In M. R. Lepper & D. Greene (Eds.) (pp. 33-60). The hidden costs of
reward. Hillsdale, NJ: Erlbaum.
McGraw, K. 0., & McCullers, J. C. (1979). Evidence of a detrimental effect of extrinsic
incentives on breaking a mental set. Journal of Experimental Social Psychology, 15, 285-
294.
Schoemaker, P. J. H. (1988). Are risk-attitudes related across domains and response modes?
Unpublished manuscript, University of Chicago, Graduate School of Business, Center for
Decision Research.
Schwartz, B. (1982). Reinforcement-induced behavioral stereotypy: How not to teach people to
discover rules. Journal of Experimental Psychology: General, 111 (1), 23-59.
Siegel, S. (1961). Decision making and learning under varying conditions of reinforcement.
Annals of the New York Academy of Sciences, 89, 766-783.
41
Simon, H. A., & Newell, A. (1971). Human problem solving: The state of the theory in 1970.
American Psychologist, 26(2), 145-159.
Slovic, P. (1966). Value as a determiner of subjective probability. IEEE Transactions on Human
Factors in Electronics. HFE-7 (1), 22-28.
Slovic, P. (1969). Differential effects of real versus hypothetical payoffs on choices among
gambles. Journal of Experimental Psychology, 80 (3), 434-437.
Sniezek, J. A. (1986). The role of variable cue labels in cue probability learning tasks.
Organizational Behavior and Human Performance, 38, 141-161.
Tversky, A., & Edwards, W. (1966). Information versus reward in binary choice. Journal of
Experimental Psychology, 71, 680-683.
White, R. W. (1959). Motivation reconsidered: The concept of competence. Psychological
Review, 66, 297-333.
Wright, W. F., & Aboul-Ezz, M. E. (1988). Effects of extrinsic incentives on the quality of
frequency assessments. Organizational Behavior and Human Decision Processes, 41, 143-
152.
Yates, J. F., & Kulick, R. M. (1977). Effort control and judgments. Organizational Behavior and
Human Performance, 20(1), 54-65.
Yerkes, R. M., & Dodson, J. D. (1908). The relation of strength of stimulus to rapidity of habit-
formation. Journal of Comparative Neurology and Psychology, 18, 459-482.
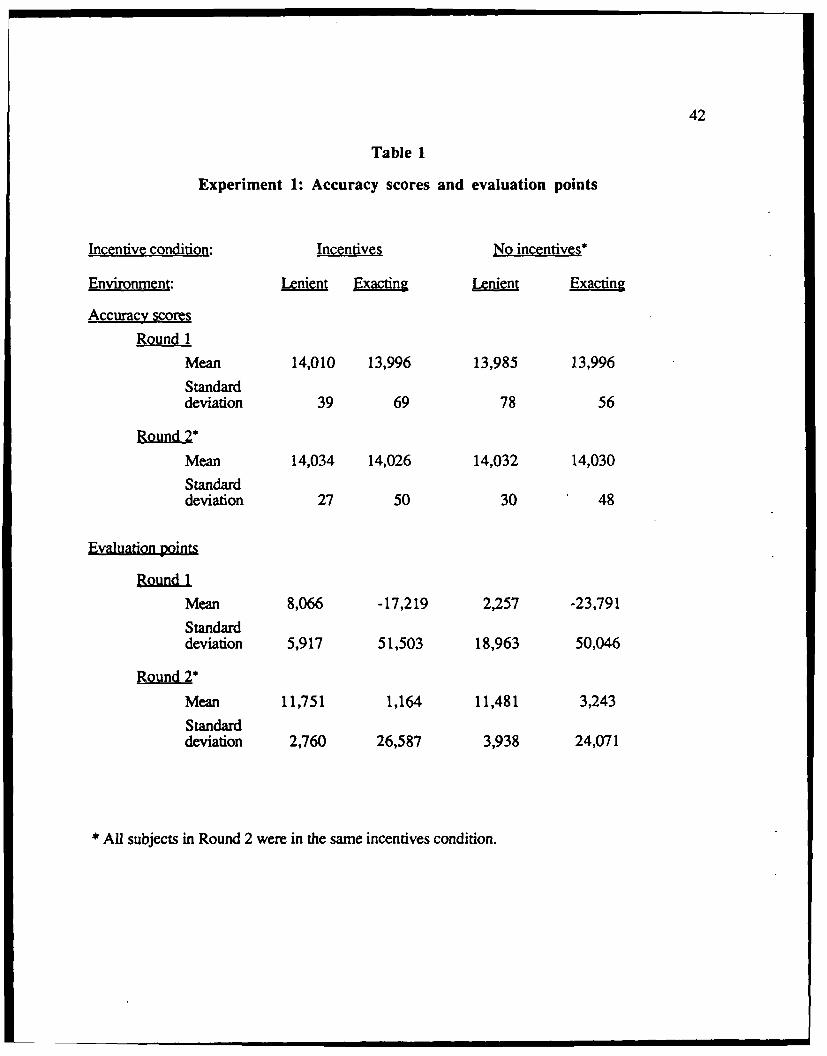
42
Table 1
Experiment 1: Accuracy scores and evaluation points
Incentive condition: Incentives No incentives*
Environment: Lenient Exacting Lenient Exacting
Accuracy scores
Round 1
Mean 14,010 13,996 13,985 13,996
Standarddeviation 39 69 78 56
Round 2"Mean 14,034 14,026 14,032 14,030
Standarddeviation 27 50 30 48
Evaluation tgint
Round 1Mean 8,066 -17,219 2,257 -23,791
Standarddeviation 5,917 51,503 18,963 50,046
Round 2*
Mean 11,751 1,164 11,481 3,243
Standarddeviation 2,760 26,587 3,938 24,071
* All subjects in Round 2 were in the same incentives condition.
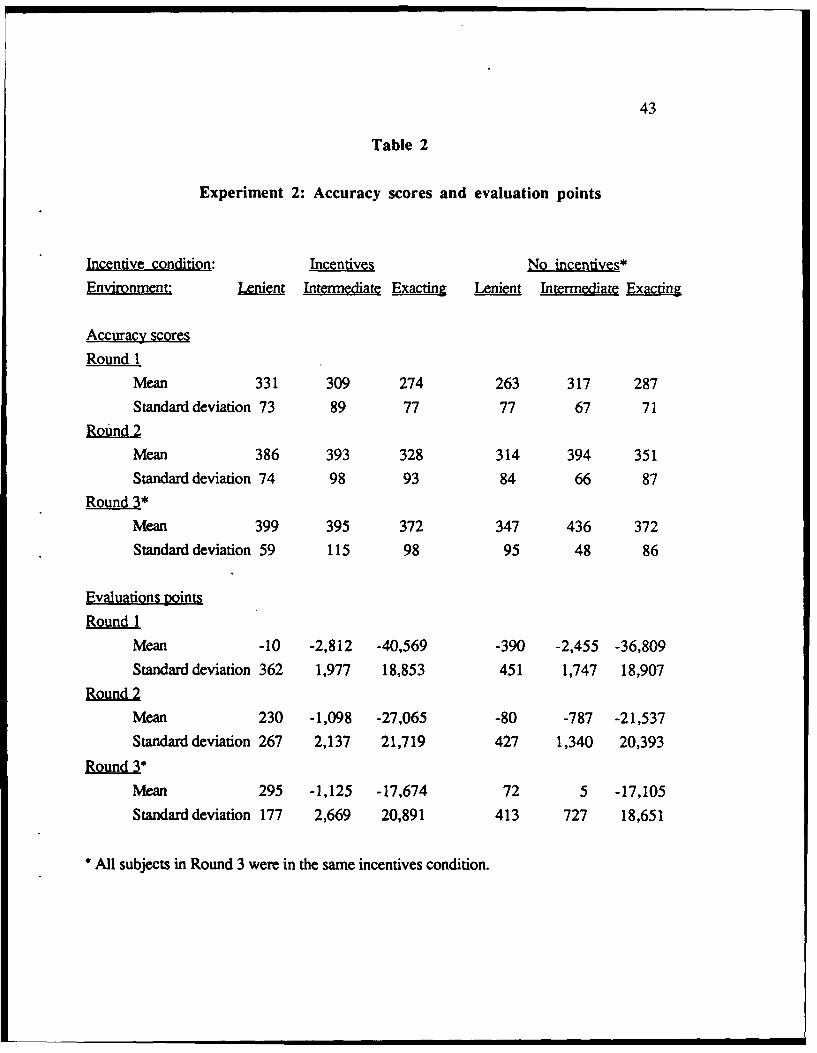
43
Table 2
Experiment 2: Accuracy scores and evaluation points
Incentive condition: Incentives No incentives*
Environment: Lenient Intermediate Exacting Lenient Intermediate Exacting
Accuracy scores
Round I
Mean 331 309 274 263 317 287
Standard deviation 73 89 77 77 67 71
Round 2
Mean 386 393 328 314 394 351
Standard deviation 74 98 93 84 66 87
Round 3*
Mean 399 395 372 347 436 372
Standard deviation 59 115 98 95 48 86
Evaluations points
Round 1
Mean -10 -2,812 -40,569 -390 -2,455 -36,809
Standard deviation 362 1,977 18,853 451 1,747 18,907
Round 2Mean 230 -1,098 -27,065 -80 -787 -21,537
Standard deviation 267 2,137 21,719 427 1,340 20,393
Round 3
Mean 295 -1,125 -17,674 72 5 -17,105
Standard deviation 177 2,669 20,891 413 727 18,651
All subjects in Round 3 were in the same incentives condition.
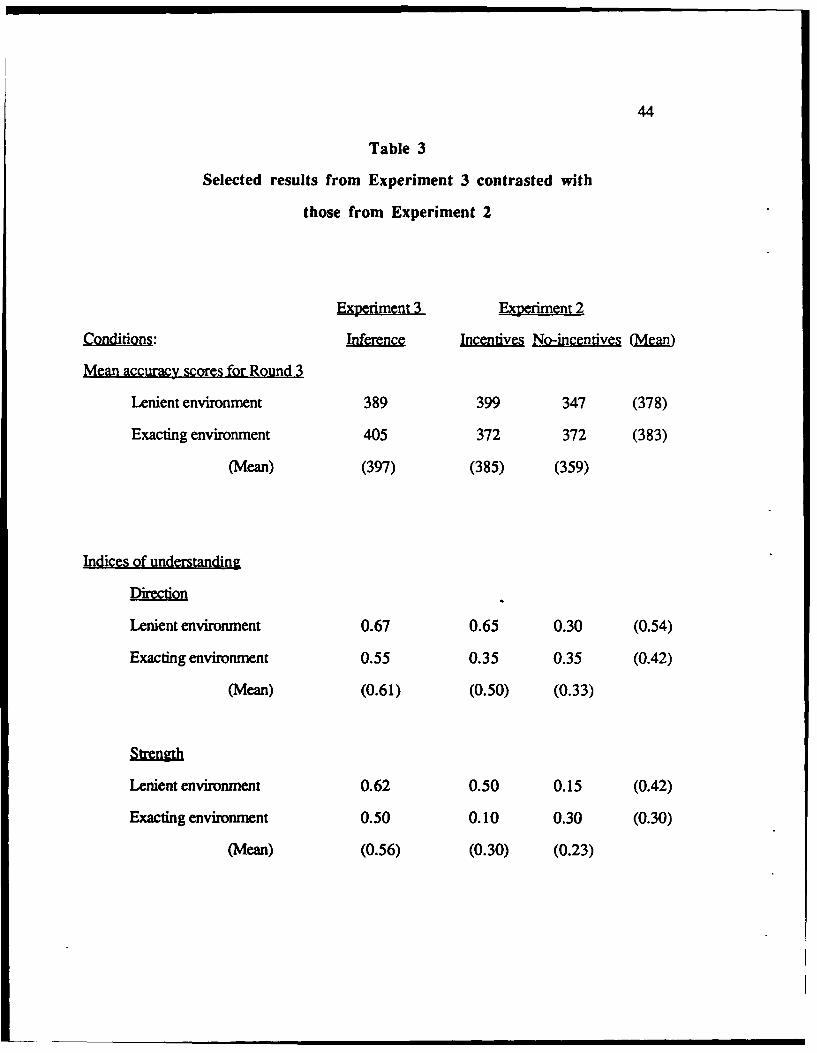
44
Table 3
Selected results from Experiment 3 contrasted with
those from Experiment 2
Excriment 3 Experiment 2
Conditions: Inference Incentives No-incentives Mean
Mean accuracy scores for Round 3
Lenient environment 389 399 347 (378)
Exacting environment 405 372 372 (383)
(Mean) (397) (385) (359)
Indices of understanding
Diretion
Lenient environment 0.67 0.65 0.30 (0.54)
Exacting environment 0.55 0.35 0.35 (0.42)
(Mean) (0.61) (0.50) (0.33)
Strngth
Lenient environment 0.62 0.50 0.15 (0.42)
Exacting environment 0.50 0.10 0.30 (0.30)
(Mean) (0.56) (0.30) (0.23)
45
Figure captions
Figure 1: Space of critical task characteristics: Complexity and exactingness.
Figure 2: Experiment 2. Mean accuracy scores by types of environment (lenient,
intermediate, and exacting) across rounds.
Figure 3: Overall mean accuracy scores by experimental conditions.
Figure 4: Experiment 2. Mean accuracy scores by experimental conditions for each of
the three rounds.
Figure 5: Experiment 2. Analyses of mean direction and strength indices by
experimental conditions.
%k!
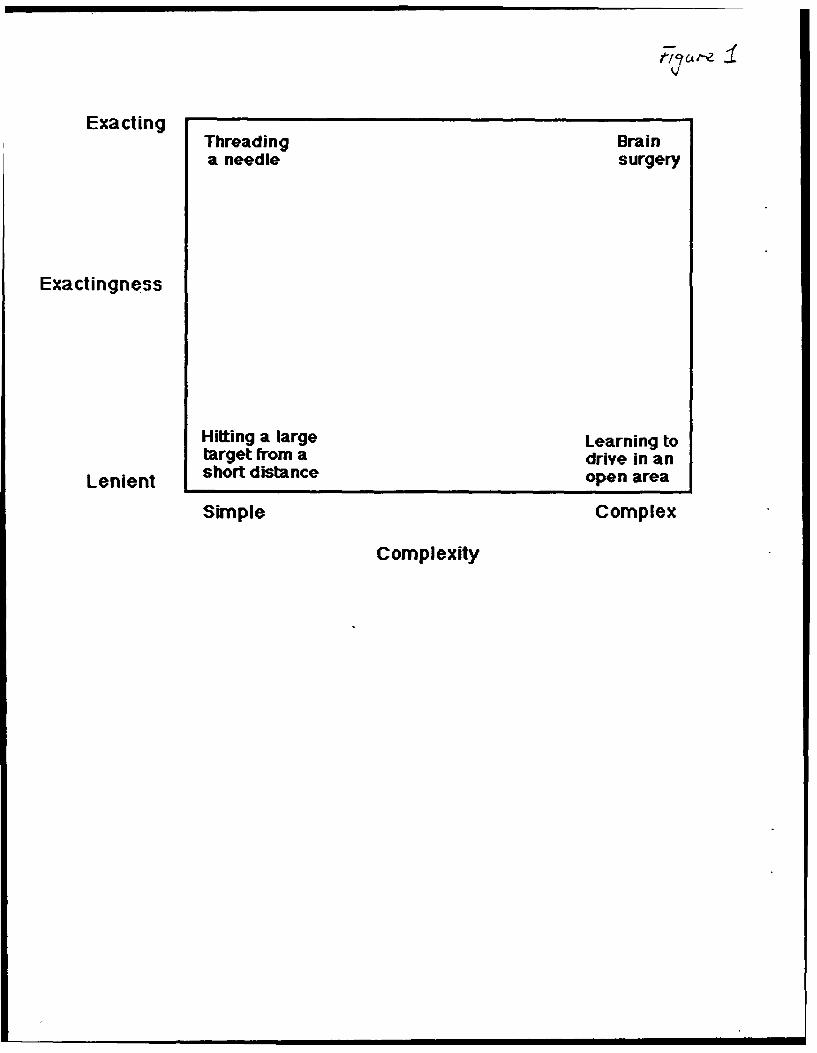
F/ca-eV
Excig Threading Braina needle surgery
Exactingness
Hitting a large Learning totarget from a drive in an
Lenient short distance open ae
Simple Complex
Complexity
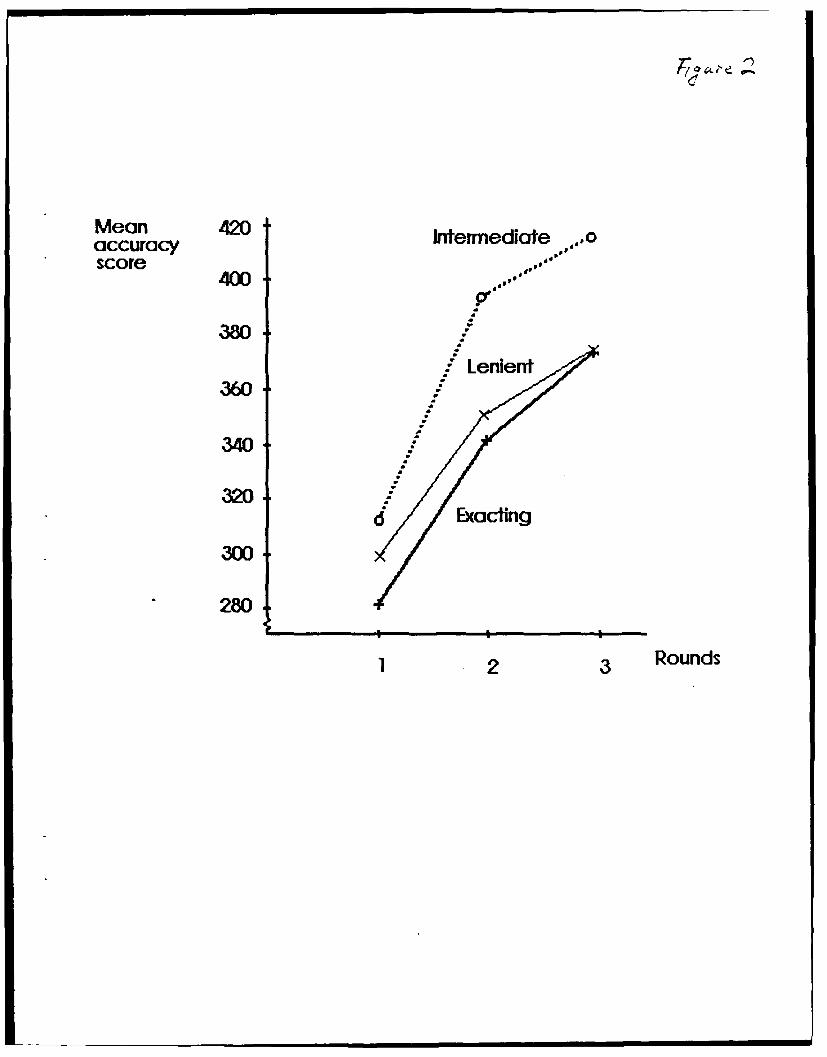
Mean 420accuracy Intermediate ,,,,,oscore 40040XJ yr"d"
iLenient360
340 a
320.6 Exacting
300
280
1 2 3 Rounds
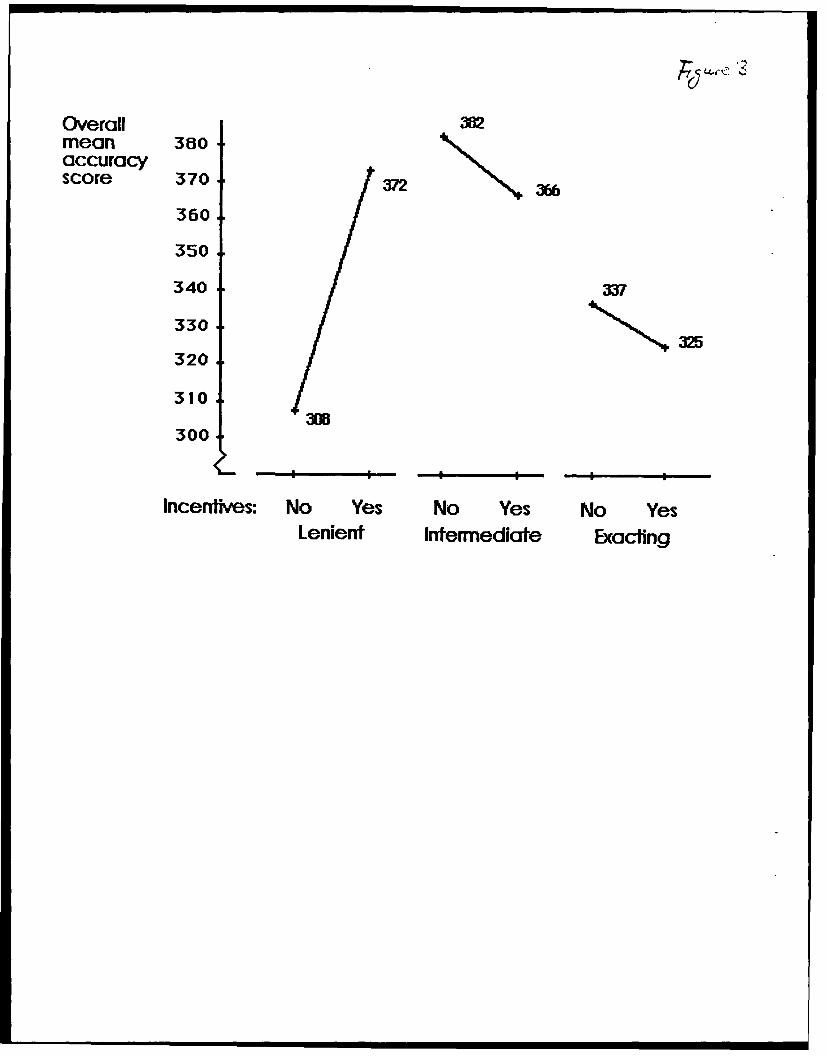
Overall 382mean 380accuracyscore 370 372 366
360
350
340 337
3303M5
3201
3103w
300
Incenltves: No Yes No Yes No YesLenient Intermediate Exacting
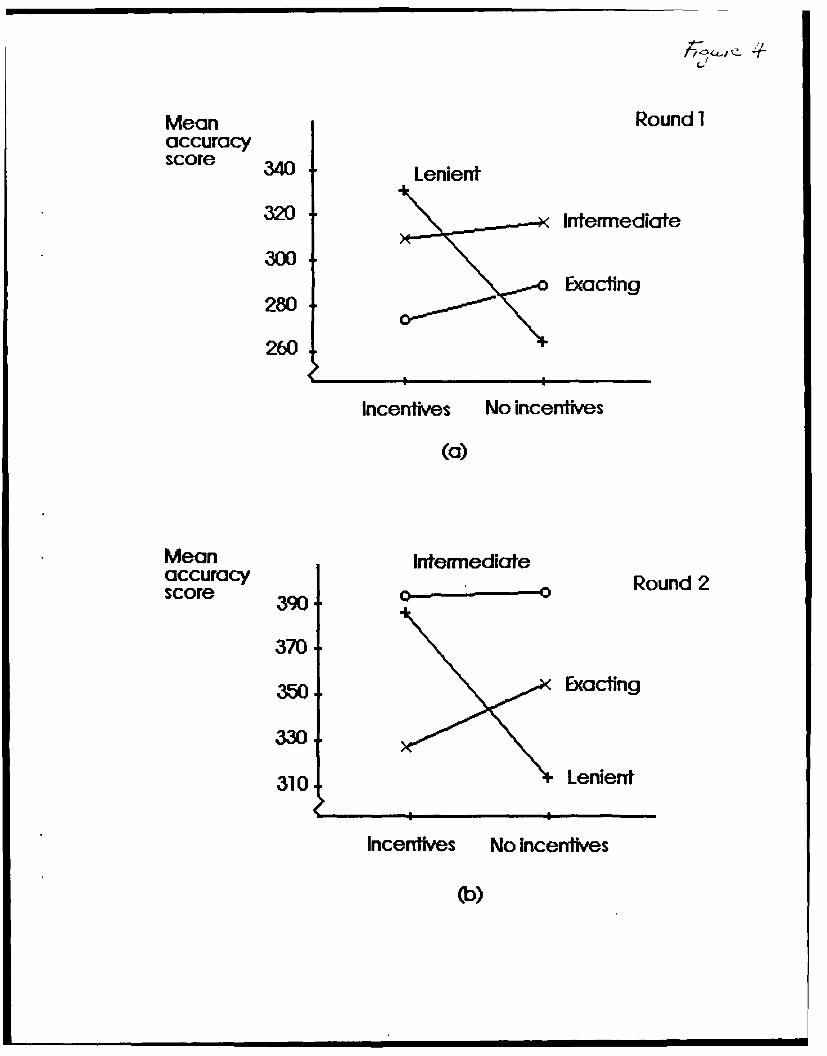
Mean Round 1accuracyscore 340 Lenient
320 -Intermediate
300Exacting
280
260
Incentives No incentives
(a)
Mean Intermediateaccuracy •_Round 2score 390
370
0 Exacting
310 Lenient
Incentives No incentives
(b)
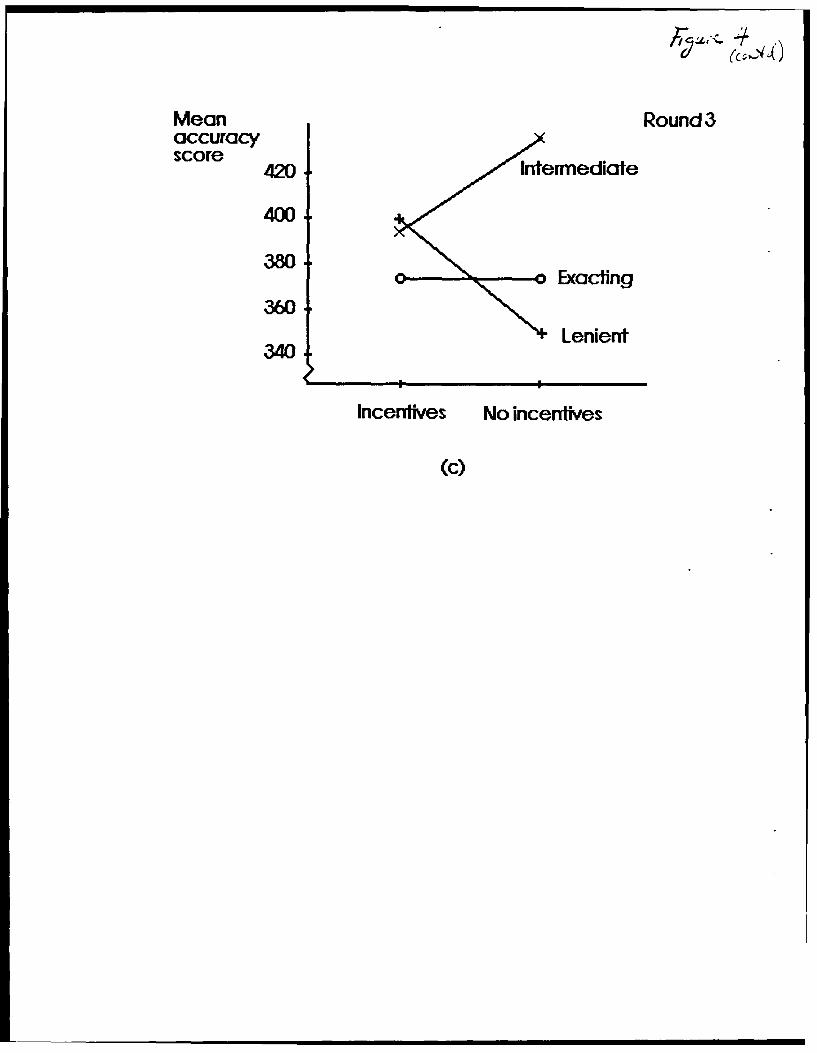
Mean Round3accuracyscore Intermediate
400
380.SExacting
360.Lenient
340
Incentives No incentives
(c)
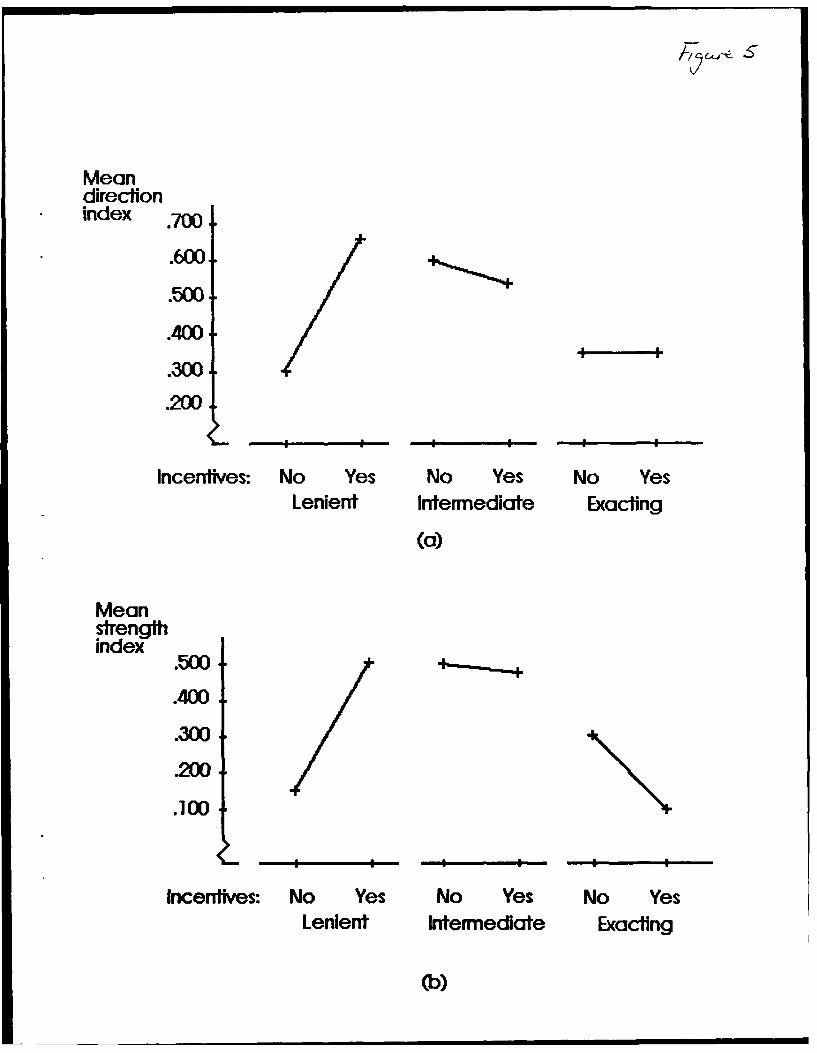
Meandirectionindex .7(X)
.500
.400
.300.200
I I I I" I I
Incentives: No Yes No Yes No YesLenient Intermediate Exacting
(a)
Meanstrengthindex
.500.400
.300
.200
.100
I i I I II
Incentives: No Yes No Yes No YesLenient Intermediate Exacting
(b)
ONR TECHNICAL REPORTS DISTRIBUTION LISTPerceptual Science Program
Dr. Earl A. Alluisi Dr. David Castanon
OUSDR (A)/R&A(E&LS) Alphatech, Inc.
Pentagon 3D129 111 Middlesex Turnpike
Washington, DC 20301-3080 Burlington, MA 01803
Dr. Michael Athans Dr. Marvin S. Cohen
Massachusetts Institute Dec. Sci. Consortium, Inc.
of Technology 1895 Preston White Drive
Lab for Information and Suite 300
Decision Systems Reston, VA 22091
Cambridge, MA 02139Dr. Stanley C. Collyer
Dr. Alan D. Baddeley Office of Naval Technology
Director, AppI. Psychol. Unit Code 222
Medical Research Council 800 N. Quincy Street
15 Chaucer Road Arlington, VA 22217-5000Cambridge CB2 2EFENGLAND Defense Tech. Info. Center
Cameron Station, Bldg 5
Dr. Bruce Barnes Alexandria, VA 22314
Program Director, Div. Info (2 copies)
Robotics, & Intell. SystemsNational Science Foundation Dr. Robert A. Fleming
1800 G Street, N.W. Naval Ocean Systems Center
Washington, DC 20550 Human Factors Support Grp.1411 South Fern Street
Mr. Charles Bates Arlington, VA 22202-2896
Director, HE DivisionUSAF AAMRL/HE Dr. Alfred R. Fregly
WPAFB, OH 45433 AF Office of Sci. Res.Life Sciences Directorate
Mr. Norman Beck Bldg. 410
Naval Underwater Systems Boiling AFB, DC 20332-6448
CenterCombat Control Systems Dr. Sherman Gee
Department Code 221 Office of Naval Technology
Newport, RI 02840 Command & Control Technol.Code 221
Dr. Kenneth R. Boff 800 N. Quincy Street
AAMRL/HE Arlington, VA 22217-5000
WPAFB, OH 45433Mr. Dan Greenwood
Mr. Luiz Cabral Netrologic, Inc.
Naval Underwater Sys. Ctr. 5080 Shoreham Place
Code 2212 Suite 201
Bldg. 1171/1 San Diego, CA 92122
Newport, RI 02841Jeffrey Grossman
Cdr. Robert C. Carter USN Naval Ocean Systems Center
Naval Research Laboratory Code 4403
Code 5532 Bldg. 334
Washington, DC 20375.500 San Diego, CA 92152-6800
ONR TECHNICAL REPORTS DISTRIBUTION LISTPerceptual Science Program
Prof. Donald D. Hoffman Prof. Alexander Levis
U. of California - Irvine Massachusetts Institute
School of Social Sciences of Technology
Irvine, CA 92717 Laboratory of Information& Decision Systems
Prof. Robert A. Hummel Cambridge, MA 02139
New York UniversityCourant Institute of Dr. Richard Loutitt
Mathematical Sciences National Science Foundation
251 Mercer Street Division of Behavioral &
New York, NY 10012 Neural Sciences1800 G Street, N. W.
Prof. Douglas E. Hunter Washington, DC 20550
Defense Intelligence CollegeWashington, DC 20374 Mr. Harold G. Miller
Technical Director, War
Dr. Edgar M. Johnson Gaming Department
Technical Director Naval War College
US Army Research Institute Newport, RI 02841
5001 Eisenhower AvenueAlexandria, VA 22333-5600 Capt. William Moroney, USN
Naval Air Development Ctr.
Capt T. E. Jones, MSC, USN Code 602
Aviation Medicine & Human Warminster, PA 18974
Performance (Code 404)Naval Medical R & D Cmd Dean of the Academic Dept.
National Capital Region U. S. Naval Academy
Bethesda, MD 21814-5044 Annapolis, MD 21402-5018
Dr. Michael Kaplan, Naval Aerospace Medical
Director, Office Basic Res Research Laboratory
US Army Research Institute Sensory Division Code 23
5001 Eisenhower Avenue Pensacola, FL 32508
Alexandria, VA 22333-5600Commanding Officer
Prof. David L. Kleinman Naval Air Systems Command
Electrical Engineering & Crew Station Design
Computer Science Dept. NAVAIR 5313
University of Connecticut Washington, DC 20361
Storrs, CT 06268Commanding Officer
Prof. John Lehoczky Naval Biodynamics Lab
Department of Statistics Michoud Station
Carnegie-Mellon University Box 29407
Pittsburgh, PA 15213 New Orleans, LA 70189
Mr. L Lemaire Commanding Officer
Naval Ocean Systems Center Navy Health Research Ctr.
Code 09 P.O. Box 85122
Engrg. & Computer Science San Diego, CA 92138
San Diego, CA 92152
. . . . I L
ONR TECHNICAL REPORTS DISTRIBUTION LISTPerceptual Science Program
Commanding Officer Office of Naval ResearchNavy Personnel R&D Center Perceptual Science ProgramSan Diego, CA 92152-6800 Code 1142PS
800 N. Quincy StreetDirector Arlington, VA 22217-5000Technical Information Div. (3 copies)Code 2627Naval Research Laboratory Dr. Jesse OrlanskyWashington, DC 20375-5000 Inst. for Defense Analyses
1801 N. Beauregard StreetUS Naval Test Center Alexandria, VA 22311Aircrew Systems BranchSystems Engineering Test Lt. Dennis McBride, USNDirectorate Pacific Missile Test CenterPatuxent River, MD 20670 Human Factors Branch
Pt. Mugu, CA 93042
Commanding OfficerNaval Weapons Center Prof. John W. PayneHuman Factors Branch Fuqua School of BusinessCode 3152 Ctr. for Decision StudiesChina Lake, CA 93555 Duke University
Durham, NC 27706Dr. Allen NewellDept. of Computer Science Dr. W. A. RizzoCarnegie-Mellon University Head, Human Factors Div.Schenley Park Naval Training Systems CtrPittsburgh, PA 15213 12350 Research Parkway
Orlando, FL 32826-3224Dr. David NobleEngineering Res. Associates Dr. William B. Rouse8616 Westwood Center Drive Search Technology, Inc.McLean, VA 22180 4725 Peachtree Comers Circle
Suite 200Dr. Michael Letsky Norcross, GA 30092Office of the Chief ofNaval Operations Dr. Walter SchneiderOP-01B7 University of PittsburghWashington, DC 20350 LRDC Bldg.
3939 O'Hara StreetOffice of the Chief of Pittsburgh, PA 15260Naval OperationsOP-933D3 Prof. Thomas B. SheridanWashington, DC 20350-2000 Massachusetts Institute of
TechnologyOffice of Naval Research Dept. of Mechanicai Engrg.Special Asst. for Marine Cambridge, MA 02139Corps MattersCode OOMC Dr. Randall P. Shumaker800 N. Quincy Street Naval Research LaboratoryArlington, VA 22217-5000 Code 5510
US Navy Center for ARAI
ONR TECHNICAL REPORTS DISTRIBUTION LISTPerceptual Science Program
Dr. H. Wallace Sinaiko Dr. Martin A. TolcottManpower Research & Decision Science ConsortiumAdvisory Services 1895 Preston White DriveSmithsonian Institution Suite 300801 N. Pitt St. Suite 120 Reston, VA 22091-4369Alexandria, VA 22314-1713
Dr. Douglas TowneLCdr. Timothy Singer, USN U. of Southern CaliforniaNaval Air Development Ctr. Behavioral Technology LabHuman Factors Engrg. Div. 1845 South Elena AvenueWarminster, PA 18974 Fourth Floor
Redondo Beach, CA 90277Dr. Paul SlovicDecision Research, Inc. Dr. Amos Tversky1201 Oak Street Stanford UniversityEugene, OR 97401 Dept. of Psychology
Bldg. 420Mr. James G. Smith Stanford, CA 94305Office of Naval ResearchCode 121 Dr. Harold P. Van Cott800 N. Quincy Street Committee on Human FactorsArlington, VA 22217-000 NAS-National Res. Council
2101 Constitution Ave, N.W.Mr. Yale Smith Washington, DC 20418Rome Air Development Ctr.RADC/COAD Dr. John WeiszGriffis AFB, NY 13441-5700 Technical Director
US Army Human EngineeringCapt. Frank Snyder, USN LaboratoryNaval War College Aberdeen P. G., MD 21005Operations DepartmentNewport, RI 02841 Prof. Christopher D. Wickens
Department of PsychologyCdr. S. Snyder University of IllinoisOffice of Naval Technology Urbana, IL 61801Code 222800 N. Quincy Street Dr. Dana YoergerArlington, VA 22217-5000 Woods Hole Oceanographic
InstitutionProf. Michael Sovereign Woods Hole, MA 02543Naval Postgraduate SchoolCode 74 Dr. Wayne ZacharyJoint C3 Curriculum CHI Systems, Inc.Monterey, CA 93943 Gwynedd Plaza II
Bethlehem PikeProf. Demosthenis Teneketzis Spring House, PA 19477Dept. of Electrical Engrg.& Computer ScienceUniversity of MichiganAnn Arbor, MI 48109-1109