Embed Size (px)
Citation preview

8/10/2019 Lnxsv00Troubleshooting Linux Guide
http://slidepdf.com/reader/full/lnxsv00troubleshooting-linux-guide 1/40
Linux on System z
Troubleshooting
Version 1 Release 1

8/10/2019 Lnxsv00Troubleshooting Linux Guide
http://slidepdf.com/reader/full/lnxsv00troubleshooting-linux-guide 2/40

8/10/2019 Lnxsv00Troubleshooting Linux Guide
http://slidepdf.com/reader/full/lnxsv00troubleshooting-linux-guide 3/40
Linux on System z
Troubleshooting
Version 1 Release 1

8/10/2019 Lnxsv00Troubleshooting Linux Guide
http://slidepdf.com/reader/full/lnxsv00troubleshooting-linux-guide 4/40
Note
Before using this information and the product it supports, read the information in “Notices” on page 27.
This edition applies to all Linux distributions that are supported on System z mainframes and to all subsequentreleases and modifications until otherwise indicated in new editions.
© Copyright IBM Corporation 2012.US Government Users Restricted Rights – Use, duplication or disclosure restricted by GSA ADP Schedule Contractwith IBM Corp.

8/10/2019 Lnxsv00Troubleshooting Linux Guide
http://slidepdf.com/reader/full/lnxsv00troubleshooting-linux-guide 5/40
Contents
Chapter 1. Troubleshooting and support for Linux on System z . . . . . . 1
Techniques for troubleshooting Linux on System z problems . . . . . . . . 1Troubleshooting checklist for Linux on System z . . . . . . . . . . . . . 3Collecting data for general Linux on System z problems . . . . . . . . . . 4
Collecting data for performance problems . . . . . . . . . . . . . . . 4Collecting data for network problems . . . . . . . . . . . . . . . . . 5Collecting data for hung system problems . . . . . . . . . . . . . . . 5Collecting data for middleware problems . . . . . . . . . . . . . . . . 5
Chapter 2. Tools for troubleshooting . . . . . . . . . . . . . . . . 7General tools . . . . . . . . . . . . . . . . . . . . . . . . . . 7
dbginfo - Collect information for debugging . . . . . . . . . . . . . . 7supportconfig - SUSE Linux Enterprise Server troubleshooting . . . . . . . 7
sosreport - Generate debugging information for Red Hat Enterprise Linuxsystems . . . . . . . . . . . . . . . . . . . . . . . . . . 8
Performance tools . . . . . . . . . . . . . . . . . . . . . . . . 9sadc - System activity data collector . . . . . . . . . . . . . . . . 9
iostat - Monitor input/output device load . . . . . . . . . . . . . . . 11z/VM MONWRITE - Collect CP *MONITOR data . . . . . . . . . . . 12Collecting data using DASD statistics . . . . . . . . . . . . . . . 13Collecting data using SCSI statistics . . . . . . . . . . . . . . . . 13
ziomon - Collect FCP performance data . . . . . . . . . . . . . . . 14Special tools . . . . . . . . . . . . . . . . . . . . . . . . . . 15
s390dbf traces - Use the kernel debug feature . . . . . . . . . . . . 16top - See resource usage . . . . . . . . . . . . . . . . . . . . 16
ps - Report a snapshot of the current processes . . . . . . . . . . . 17netstat - Show information about the Linux networking subsystem . . . . . 17tcpdump - Collect traffic information for a network interface . . . . . . . 18oprofile - profiling of all running code on Linux systems . . . . . . . . . 18
Dump tools . . . . . . . . . . . . . . . . . . . . . . . . . . 18
Chapter 3. Contacting IBM Support . . . . . . . . . . . . . . . . 21
Chapter 4. Exchanging information with IBM . . . . . . . . . . . . . 23Sending information to IBM Support . . . . . . . . . . . . . . . . . 23Receiving information from IBM Support . . . . . . . . . . . . . . . 23
Accessibility . . . . . . . . . . . . . . . . . . . . . . . . . 25
Notices . . . . . . . . . . . . . . . . . . . . . . . . . . . 27Trademarks . . . . . . . . . . . . . . . . . . . . . . . . . . 28
Index . . . . . . . . . . . . . . . . . . . . . . . . . . . . 29
© Copyright IBM Corp. 2012 iii

8/10/2019 Lnxsv00Troubleshooting Linux Guide
http://slidepdf.com/reader/full/lnxsv00troubleshooting-linux-guide 6/40
iv Linux on System z: Troubleshooting

8/10/2019 Lnxsv00Troubleshooting Linux Guide
http://slidepdf.com/reader/full/lnxsv00troubleshooting-linux-guide 7/40
Chapter 1. Troubleshooting and support for Linux on Systemz
To isolate and resolve problems with Linux on System z, you can use thetroubleshooting and support information. This information contains instructions forusing the problem-determination resources that are provided with Linux on System
z.
Techniques for troubleshooting Linux on System z ® problems
Troubleshooting is a systematic approach to solving a problem. The goal oftroubleshooting is to determine why something does not work as expected and howto resolve the problem. Certain common techniques can help with the task of
troubleshooting.
The first step in the troubleshooting process is to describe the problem completely.Problem descriptions help you and the IBM technical-support representative know
where to start to find the cause of the problem. This step includes asking yourself
basic questions:v What are the symptoms of the problem?
v Where does the problem occur?
v When does the problem occur?
v Under which conditions does the problem occur?
v Can the problem be reproduced?
The answers to these questions typically lead to a good description of the problem,which can then lead you to a problem resolution.
What are the symptoms of the problem?
When starting to describe a problem, the most obvious question is “What is theproblem?” This question might seem straightforward; however, you can break itdown into several more-focused questions that create a more descriptive picture of
the problem. These questions can include:
v Who, or what, is reporting the problem?
v What are the error codes and messages?
v How does the system fail? For example, is it a loop, hang, crash, performancedegradation, or incorrect result?
Where does the problem occur?
Determining where the problem originates is not always easy, but it is one of the
most important steps in resolving a problem. Many layers of technology can existbetween the reporting and failing components. Networks, disks, and drivers are onlya few of the components to consider when you are investigating problems.
The following questions help you to focus on where the problem occurs to isolatethe problem layer:
v Is the problem specific to one platform or operating system, or is it common
across multiple platforms or operating systems?
v Is the current environment and configuration supported?
v Do all users have the problem?
© Copyright IBM Corp. 2012 1
8/10/2019 Lnxsv00Troubleshooting Linux Guide
http://slidepdf.com/reader/full/lnxsv00troubleshooting-linux-guide 8/40
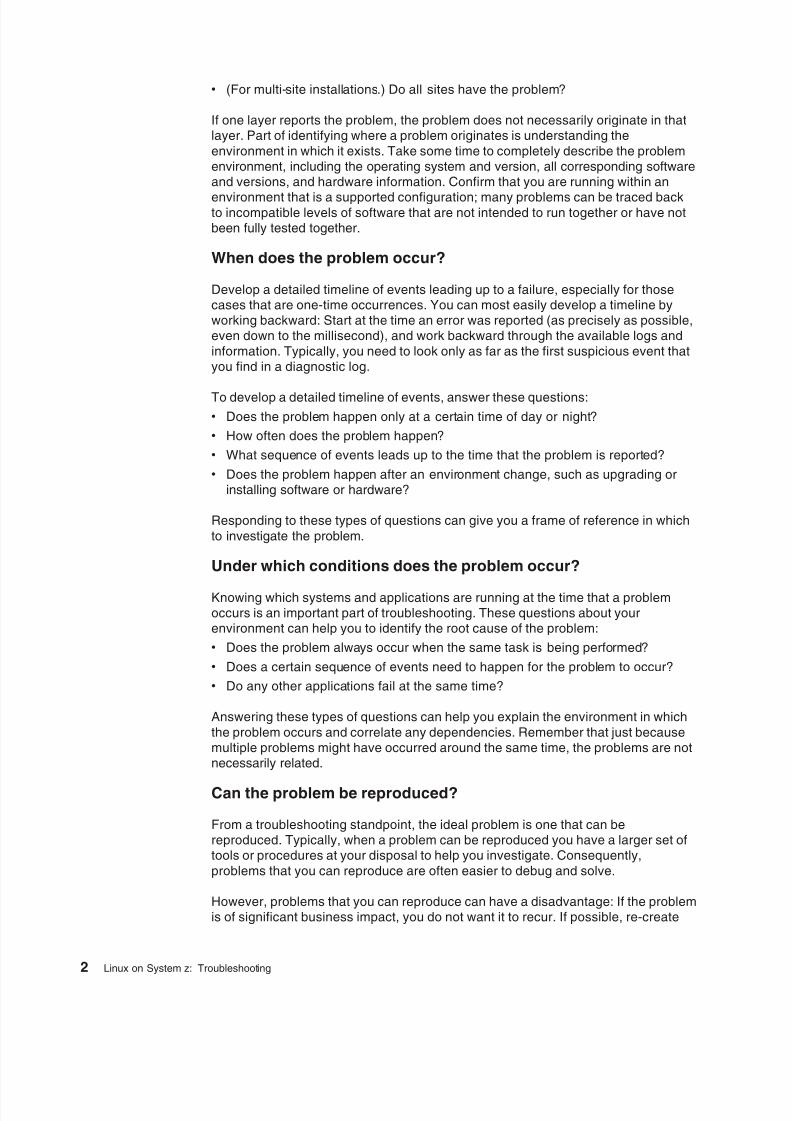
v (For multi-site installations.) Do all sites have the problem?
If one layer reports the problem, the problem does not necessarily originate in thatlayer. Part of identifying where a problem originates is understanding the
environment in which it exists. Take some time to completely describe the problemenvironment, including the operating system and version, all corresponding softwareand versions, and hardware information. Confirm that you are running within an
environment that is a supported configuration; many problems can be traced backto incompatible levels of software that are not intended to run together or have notbeen fully tested together.
When does the problem occur?
Develop a detailed timeline of events leading up to a failure, especially for thosecases that are one-time occurrences. You can most easily develop a timeline byworking backward: Start at the time an error was reported (as precisely as possible,even down to the millisecond), and work backward through the available logs and
information. Typically, you need to look only as far as the first suspicious event thatyou find in a diagnostic log.
To develop a detailed timeline of events, answer these questions:
v Does the problem happen only at a certain time of day or night?
v How often does the problem happen?
v What sequence of events leads up to the time that the problem is reported?
v Does the problem happen after an environment change, such as upgrading orinstalling software or hardware?
Responding to these types of questions can give you a frame of reference in which
to investigate the problem.
Under which conditions does the problem occur?
Knowing which systems and applications are running at the time that a problemoccurs is an important part of troubleshooting. These questions about yourenvironment can help you to identify the root cause of the problem:
v Does the problem always occur when the same task is being performed?
v Does a certain sequence of events need to happen for the problem to occur?
v Do any other applications fail at the same time?
Answering these types of questions can help you explain the environment in which
the problem occurs and correlate any dependencies. Remember that just becausemultiple problems might have occurred around the same time, the problems are notnecessarily related.
Can the problem be reproduced?
From a troubleshooting standpoint, the ideal problem is one that can bereproduced. Typically, when a problem can be reproduced you have a larger set oftools or procedures at your disposal to help you investigate. Consequently,
problems that you can reproduce are often easier to debug and solve.
However, problems that you can reproduce can have a disadvantage: If the problemis of significant business impact, you do not want it to recur. If possible, re-create
2 Linux on System z: Troubleshooting

8/10/2019 Lnxsv00Troubleshooting Linux Guide
http://slidepdf.com/reader/full/lnxsv00troubleshooting-linux-guide 9/40
the problem in a test or development environment, which typically offers you moreflexibility and control during your investigation.
v Can the problem be re-created on a test system?
v Are multiple users or applications encountering the same type of problem?
v Can the problem be re-created by running a single command, a set ofcommands, or a particular application?
Troubleshooting checklist for Linux on System z
When you open a problem, provide as much information as possible about the
circumstances.
Answering the following questions can help you or IBM ® support to determine thecause for problems that occur with Linux on System z:
1. How does the problem manifest itself? What are the symptoms?
v When this problem occurs, is a specific error message or error code issued?
v Is trace output of the operation available?
2. How long has the problem been occurring?
v Is it a first time occurrence? When did it happen? (Date and time help toanalyze the logs.)
v How frequently does it occur?
v Is there any pattern?
3. If the problem occurred subsequent to some period of normal operation, didanything change in the environment?
v Was an operating system patch applied?
v Did the network environment change? For example, was a server moved or adomain migrated?
v Did the system recently fail or abnormally terminate?
4. If you know (for example, based on message prefixes or error codes), wheredoes the problem occur? On one or more systems, production or testenvironment?
5. Can you reproduce the problem on a test system (so that you do not negatively
affect the production environment)? What steps are required to reproduce theproblem?
6. How many users are impacted?
v Is this problem affecting one, some, or all users?
v Is the problem occurring only for a user who was recently added to theenvironment, such as a new employee?
v Do differences exist between the users who are affected and the users whoare not affected?
7. How many applications or business processes are impacted?
v Is this problem affecting one, some, or all applications or businessprocesses?
v Is the problem occurring only for a new application or business process?
v Do differences exist between the applications or business processes that areaffected and the applications or business processes that are not affected bythe problem?
In your report, describe the server and storage infrastructure in as much detail aspossible:
Chapter 1. Troubleshooting and support for Linux on System z 3

8/10/2019 Lnxsv00Troubleshooting Linux Guide
http://slidepdf.com/reader/full/lnxsv00troubleshooting-linux-guide 10/40
v Machine setup (for example, z9 ® , or z10™?)
v Storage server (for example, DS8000 ® )
v Storage attachment (for example FICON ® , ESCON ® , or FCP?)
v Disk configuration
v Network (OSA (type, mode), HiperSockets™)
v Network topologies
v Middleware setup (databases, web servers, SAP, or TSM. Include version
information, if relevant)
You can now collect additional diagnostic data that is required for an IBMtechnical-support representative to effectively troubleshoot the problem.
Collecting data for general Linux on System z problems
Collect diagnostic data when a problem occurs. Then submit the diagnostic data toIBM Support. Whatever the problem, start with this general collection of data.
About this task
Collecting data before opening a problem management record (PMR) can help youto answer the following questions:
v Do the symptoms match any known problems? If so, has a fix or workaround
been published?
v Can the problem be identified and resolved without a code fix?
v When does the problem occur?
The diagnostic data that you collect, and the sources from which you collect thatdata, are dependent on the type of problem that you are investigating. A base set ofinformation is typically always required. For specific symptoms, you might need tocollect additional problem-specific data.
When you submit a problem to IBM Support, you must provide a base set ofinformation.
Procedure
To collect general diagnostic data:
1. Collect the base set of diagnostic information by using the dbginfo command.
2. Depending on your distribution, also collect distribution-specific information:
v On SUSE Linux Enterprise Server, run supportconfig.
v On Red Hat Enterprise Linux, run sosreport.
Collecting data for performance problems
If performance is a problem, collect diagnostic data that you can use to diagnoseand resolve the problem.
Procedure
To collect diagnostic data for performance diagnostics:
1. Start sadc (System Activity Data Collection) and provide sar files.
2. If running as guest under z/VM ® , collect z/VM MONWRITE data
4 Linux on System z: Troubleshooting

8/10/2019 Lnxsv00Troubleshooting Linux Guide
http://slidepdf.com/reader/full/lnxsv00troubleshooting-linux-guide 11/40

8/10/2019 Lnxsv00Troubleshooting Linux Guide
http://slidepdf.com/reader/full/lnxsv00troubleshooting-linux-guide 12/40
6 Linux on System z: Troubleshooting

8/10/2019 Lnxsv00Troubleshooting Linux Guide
http://slidepdf.com/reader/full/lnxsv00troubleshooting-linux-guide 13/40
Chapter 2. Tools for troubleshooting
A variety of troubleshooting tools are available to help you diagnose and resolveproduct problems for Linux on System z.
General toolsTools that can be used in most cases when debugging Linux on System zproblems.
dbginfo - Collect information for debuggingThe dbginfo.sh script collects various system-related files for debugging purposes. It
captures the current system environment and generates a tar file.
If the Linux system runs as z/VM guest operating system, dbginfo also collectsinformation about the z/VM guest setup.
The dbginfo.sh script is part of the s390-tools package in Novell SUSE distributions
and the s390-utils package in Red Hat distributions.
The service and development team continuously improve dbginfo.sh. You can
download the latest version from the developerWorks ® website athttp://www.ibm.com/developerworks/linux/linux390/s390-tools.html Thedbginfo.sh script is included in the s390-tools tar ball.
Authorization
v Running the script requires root authority.
v For z/VM guest operating systems you require privilege class B.
Syntax
dbginfo.sh
Example
To generate a diagnostic report with dbginfo, issue the command:
[root@system]# dbginfo.shCreate target directory /tmp/DBGINFO-2009-04-15-22-06-20-t6345057Change to target directory /tmp/DBGINFO-2009-04-15-22-06-20-t6345057[...]
supportconfig - SUSE Linux Enterprise Server troubleshootingThe supportconfig script gathers system troubleshooting information on SUSELinux Enterprise Server systems. It captures the current system environment andgenerates a tar-archive.
The script file collects complementary info to the dbginfo.sh script. Thesupportconfig script is part of the Supportutils package.
© Copyright IBM Corp. 2012 7

8/10/2019 Lnxsv00Troubleshooting Linux Guide
http://slidepdf.com/reader/full/lnxsv00troubleshooting-linux-guide 14/40
Authorization
Running the script requires root authority.
Syntax
See the supportconfig man page for more details.
supportconfig
Example
To run supportconfig, issue:
root@system:~ # supportconfig
Output
The script produces a tar ball. The location of the tar ball is given in the scriptoutput:
==================================================================Support Utilities - Supportconfig
Script Version: 2.25-96Script Date: 2009 02 24
==================================================================
Gathering system information
Basic Server Health Check... Done[...]Creating Tar Ball
[ DONE ]==================================================================Log file tar ball: /var/log/nts_h42lp42_100719_1431.tbzLog file size: 572KLog file md5sum: 1dfc98f3a3192771ad970ecc31b6e9d9
sosreport - Generate debugging information for Red Hat EnterpriseLinux systems
The sosreport script gathers system troubleshooting information. It captures the
current system environment and generates a tar file.
The script file collects complementary info to the dbginfo.sh script. The sosreportscript is part of the support-utils package.
Authorization
Running the script requires root authority.
Syntax
See the sosreport man page for details.
sosreport
8 Linux on System z: Troubleshooting
8/10/2019 Lnxsv00Troubleshooting Linux Guide
http://slidepdf.com/reader/full/lnxsv00troubleshooting-linux-guide 15/40
Example
To run sosreport, issue the command:
[root@system]# sosreport
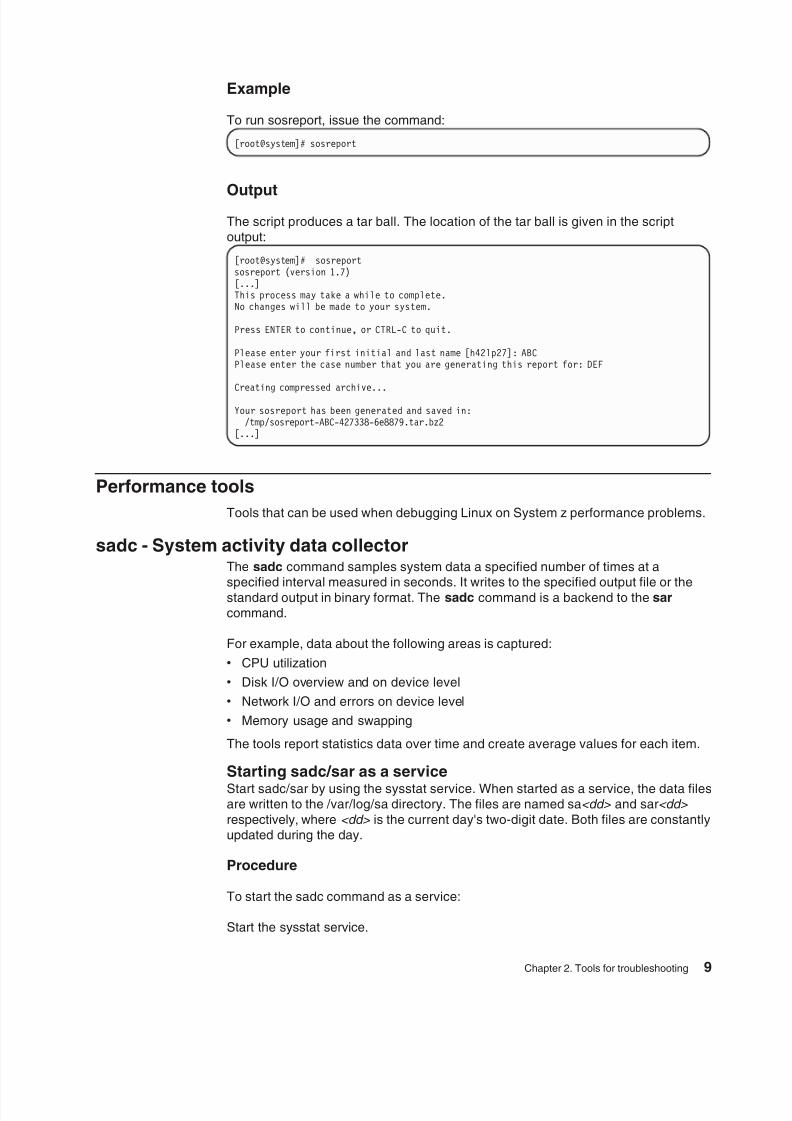
OutputThe script produces a tar ball. The location of the tar ball is given in the scriptoutput:
[root@system]# sosreportsosreport (version 1.7)[...]This process may take a while to complete.No changes will be made to your system.
Press ENTER to continue, or CTRL-C to quit.
Please enter your first initial and last name [h42lp27]: ABCPlease enter the case number that you are generating this report for: DEF
Creating compressed archive...Your sosreport has been generated and saved in:
/tmp/sosreport-ABC-427338-6e8879.tar.bz2[...]
Performance tools
Tools that can be used when debugging Linux on System z performance problems.
sadc - System activity data collectorThe sadc command samples system data a specified number of times at aspecified interval measured in seconds. It writes to the specified output file or the
standard output in binary format. The sadc command is a backend to the sar
command.
For example, data about the following areas is captured:
v CPU utilization
v Disk I/O overview and on device level
v Network I/O and errors on device level
v Memory usage and swapping
The tools report statistics data over time and create average values for each item.
Starting sadc/sar as a service
Start sadc/sar by using the sysstat service. When started as a service, the data filesare written to the /var/log/sa directory. The files are named sa<dd> and sar<dd>
respectively, where <dd> is the current day's two-digit date. Both files are constantlyupdated during the day.
Procedure
To start the sadc command as a service:
Start the sysstat service.
Chapter 2. Tools for troubleshooting 9

8/10/2019 Lnxsv00Troubleshooting Linux Guide
http://slidepdf.com/reader/full/lnxsv00troubleshooting-linux-guide 16/40
v To start the sysstat service with Red Hat distributions as a permanent servicethat persists across reboots, issue:
service sysstat start
To check the status of the service, issue:
chkconfig –list |grep sysstat
v To start the sysstat service using SLES 10 either configure the service usingYaST or use the following command:
chkconfig -s sysstat on|12345
To start the sysstat service only for the current session:
service sysstat start
On SLES 10 this is not persistent across reboots.v To start the sysstat service with SLES 11 you have to configure the service using
YaST in order to have data collection persistent across reboots.
To start the sysstat service directly, issue:
/etc/init.d/boot.sysstat start
This is not persistent across reboots.
To check the status of the sysstat service, issue:
/etc/init.d/boot.sysstat status
Results
To report performance data, include both the sadc and the sar data files with theproblem report.
What to do next
After you collect the appropriate diagnostic data, you can complete the following
tasks, as appropriate:
v Chapter 3, “Contacting IBM Support,” on page 21
v Chapter 4, “Exchanging information with IBM,” on page 23
Starting sadc/sar directlyIf your problem requires data collection that is not covered by the sar/sadc defaults,
you can start the tools manually. This may be the case when you need smallersampling interval than the default.
About this task
Depending on the time period during which performance problems are seen, eitheruse a default sampling interval of 10 minutes, or, if performance problems occur for
10 Linux on System z: Troubleshooting

8/10/2019 Lnxsv00Troubleshooting Linux Guide
http://slidepdf.com/reader/full/lnxsv00troubleshooting-linux-guide 17/40
a couple of minutes once in a while, shorten the sampling interval. An interval ofless than a minute is recommended.
Procedure
1. To start the sadc command directly, issue a command of the following form:
/usr/lib64/sa/sadc [options] [interval [count]] > <sadc_outfile>
See the sadc man page for details.
For example:
[root@system:]# /usr/lib64/sa/sadc 1 5 > sadc_outfile[root@system:]# /usr/lib64/sa/sadc -d 1 5 > sadc_outfile
Omit the count parameter to let sadc sample data until it is stopped.
Use the -d option to collect disk statistics. By default sadc does not report disksactivity to prevent data files from growing too large.
2. Extract data and write records using the sar command. Use a command of thefollowing form:
sar -A -f <sadc outfile> > <sar outfile>
For example:
[root@system:]# sar -A -f sadc_outfile > sar_outfile
where:
-A reports all the collected statistics.
-f specifies the binary input file.
The sar command creates a collection of performance reports from thecollected sadc data and writes these reports to an output file.
Results
To report performance data, include both the sadc and the sar data files with theproblem report.
What to do next
After you collect the appropriate diagnostic data, you can complete the following
tasks, as appropriate:
v Chapter 3, “Contacting IBM Support,” on page 21
v Chapter 4, “Exchanging information with IBM,” on page 23
iostat - Monitor input/output device loadThe iostat command monitors system input/output device load by observing thetime the devices are active in relation to their average transfer rates.
The iostat report shows:
v Throughput
Chapter 2. Tools for troubleshooting 11
8/10/2019 Lnxsv00Troubleshooting Linux Guide
http://slidepdf.com/reader/full/lnxsv00troubleshooting-linux-guide 18/40
v Device queue information
v Service time
Authorization
Root access is required on Linux operating systems.
Syntax
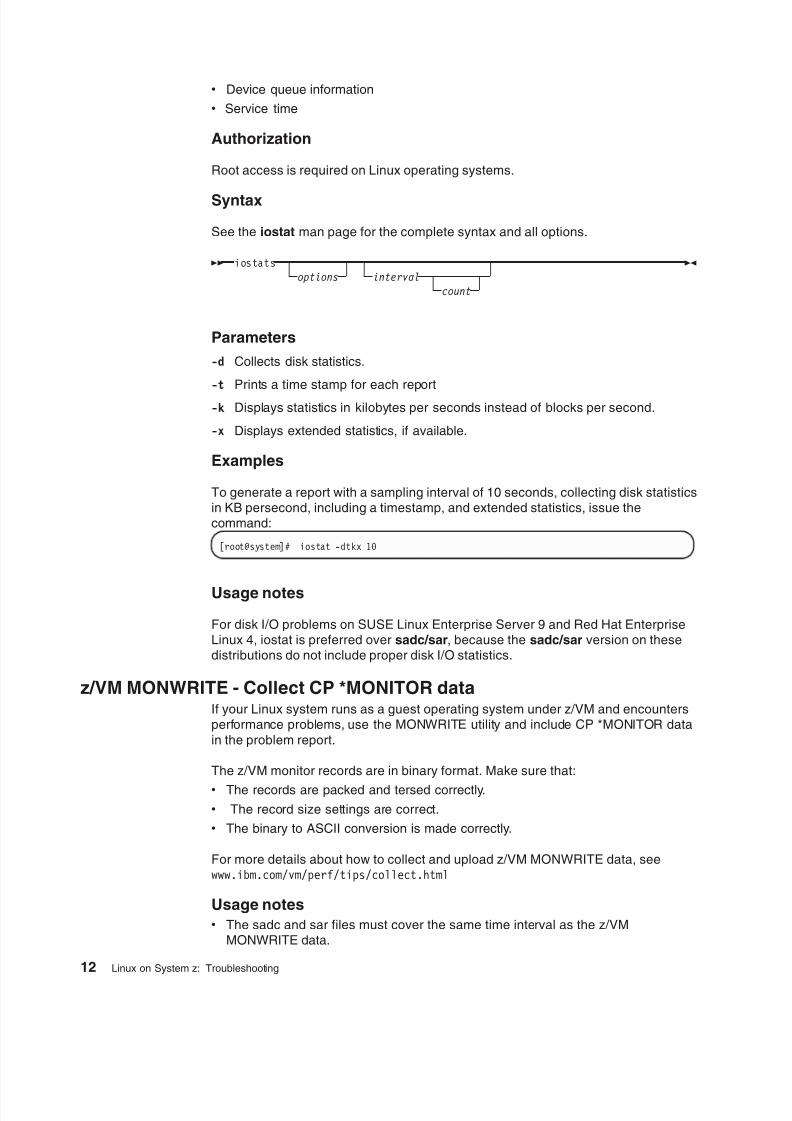
See the iostat man page for the complete syntax and all options.
iostatsoptions interval
count
Parameters
-d Collects disk statistics.
-t Prints a time stamp for each report
-k Displays statistics in kilobytes per seconds instead of blocks per second.
-x Displays extended statistics, if available.
Examples
To generate a report with a sampling interval of 10 seconds, collecting disk statisticsin KB persecond, including a timestamp, and extended statistics, issue thecommand:
[root@system]# iostat -dtkx 10
Usage notes
For disk I/O problems on SUSE Linux Enterprise Server 9 and Red Hat EnterpriseLinux 4, iostat is preferred over sadc/sar, because the sadc/sar version on thesedistributions do not include proper disk I/O statistics.
z/VM MONWRITE - Collect CP *MONITOR dataIf your Linux system runs as a guest operating system under z/VM and encountersperformance problems, use the MONWRITE utility and include CP *MONITOR data
in the problem report.
The z/VM monitor records are in binary format. Make sure that:
v The records are packed and tersed correctly.
v The record size settings are correct.
v The binary to ASCII conversion is made correctly.
For more details about how to collect and upload z/VM MONWRITE data, seewww.ibm.com/vm/perf/tips/collect.html
Usage notes
v The sadc and sar files must cover the same time interval as the z/VMMONWRITE data.
12 Linux on System z: Troubleshooting

8/10/2019 Lnxsv00Troubleshooting Linux Guide
http://slidepdf.com/reader/full/lnxsv00troubleshooting-linux-guide 19/40
v Use the default sampling time interval of 1 minute.
Collecting data using DASD statisticsThe DASD statistics kernel function monitors the activities of the DASD devicedriver and the storage subsystem. It mainly records processing time of I/Ooperations within a given time interval.
Procedure
To collect diagnostic data using DASD statistics:
1. Start DASD statistics with the following command:
# echo set on > /proc/dasd/statistics
2. Summarized histogram information is available in /proc/dasd/statistics, and
can be extracted with the following command:
# cat /proc/dasd/statistics
3. Stop DASD statistics with the following command:# echo set off > /proc/dasd/statistics
Results
DASD statistics creates a summary for all devices. An IOCTL interface is availableto collect the statistics for individual devices. To get DASD statistics for an individualDASD, use the tunedasd command:
# tunedasd -P /dev/dasd<xx>
What to do next
After you collect the appropriate diagnostic data, you can complete the followingtasks:
v Chapter 3, “Contacting IBM Support,” on page 21
v Chapter 4, “Exchanging information with IBM,” on page 23
Collecting data using SCSI statisticsThe SCSI statistics collect statistics of I/O operations on FCP devices on a requestbase, separately for read and write requests. It also gives detailed information aboutthe latency.
About this task
Statistical data on FCP devices can be collected using:
v SUSE Linux Enterprise Server 9 SP3 + maintenance (kernel version 2.6.5-7.283and higher)
v SUSE Linux Enterprise Server 10 GA (kernel version 2.6.16.21-0.8 and higher)
Chapter 2. Tools for troubleshooting 13

8/10/2019 Lnxsv00Troubleshooting Linux Guide
http://slidepdf.com/reader/full/lnxsv00troubleshooting-linux-guide 20/40
Procedure
By default, data gathering is turned off.
1. To switch on data gathering for the devices, enter:
echo on=1 > definition
2. To switch off data gathering for the devices, enter:
echo on=0 > definition
3. To reset the collected data to 0, enter:
echo data=reset > definition
Results
Depending on your distribution, the files for zfcp statistics can be found as follows:
v For SUSE Linux Enterprise Server 10 and later, depending on where debugfs is
mounted: <mount_point_debugfs>/statistics. For example, if debugfs ismounted at directory /sys/kernel/debug/, all the collected statistics data can befound at /sys/kernel/debug/statistics/.
v For SUSE Linux Enterprise Server 9, depending on where /proc is mounted(SUSE Linux Enterprise Server 9 does not use debugfs): <mount_point_proc>/statistics.
v For each device (adapter as well as LUN) a subdirectory is created whenmounting the device. The subdirectory is named:
– zfcp-<device-bus-id> for an adapter
– zfcp-<device-bus-id>-<WWPN>-<LUN> for a LUN
Each subdirectory contains two files, a data file and a definition file.
What to do next
After you collect the appropriate diagnostic data, you can complete the followingtasks:
v Chapter 3, “Contacting IBM Support,” on page 21
v Chapter 4, “Exchanging information with IBM,” on page 23
ziomon - Collect FCP performance dataFor SUSE Linux Enterprise Server 11, use the ziomon tool is used to gather FCPperformance data.
The monitor tool ziomon collects information and details about:v The FCP configuration
v The I/O workload
v The utilization of the FCP resources
Authorization
Root access is required on Linux operating systems.
14 Linux on System z: Troubleshooting
8/10/2019 Lnxsv00Troubleshooting Linux Guide
http://slidepdf.com/reader/full/lnxsv00troubleshooting-linux-guide 21/40
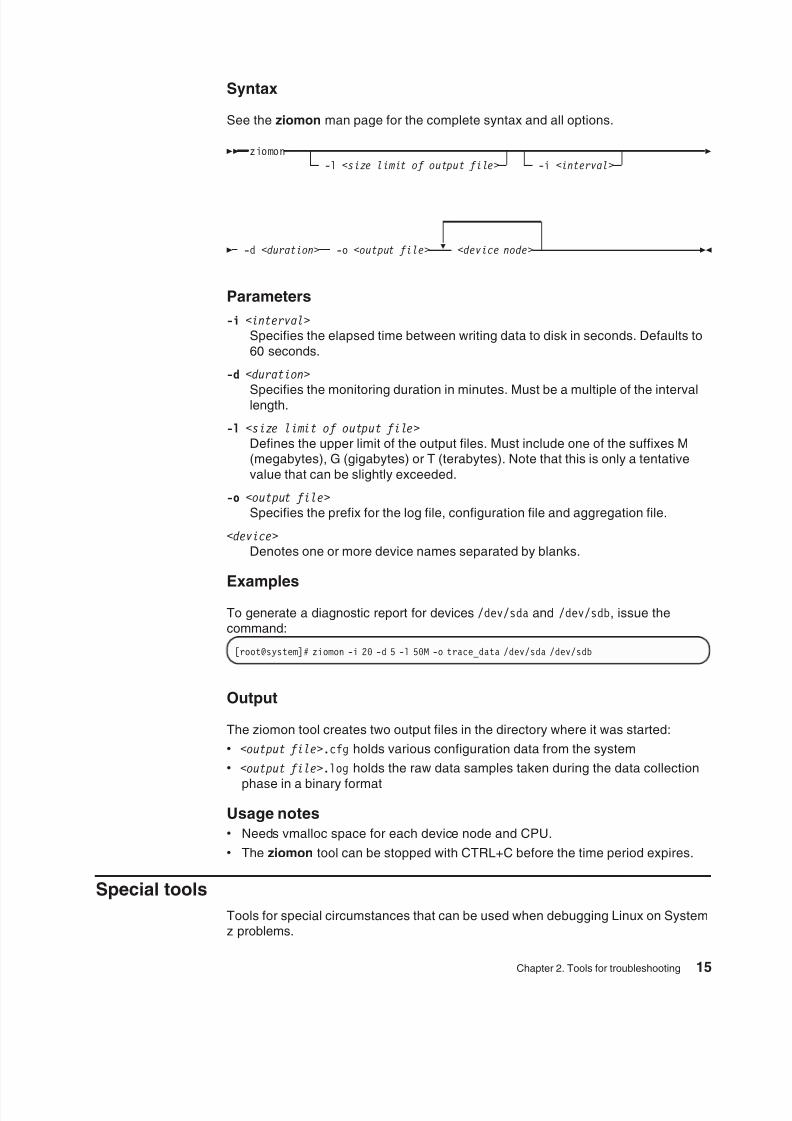
Syntax
See the ziomon man page for the complete syntax and all options.
ziomon-l <size limit of output file> -i <interval>
-d <duration> -o <output file> <device node>
Parameters
-i <interval>
Specifies the elapsed time between writing data to disk in seconds. Defaults to
60 seconds.
-d <duration>
Specifies the monitoring duration in minutes. Must be a multiple of the intervallength.
-l <size limit of output file>
Defines the upper limit of the output files. Must include one of the suffixes M(megabytes), G (gigabytes) or T (terabytes). Note that this is only a tentative
value that can be slightly exceeded.
-o <output file>
Specifies the prefix for the log file, configuration file and aggregation file.
<device>
Denotes one or more device names separated by blanks.
ExamplesTo generate a diagnostic report for devices /dev/sda and /dev/sdb, issue thecommand:
[root@system]# ziomon -i 20 -d 5 -l 50M -o trace_data /dev/sda /dev/sdb
Output
The ziomon tool creates two output files in the directory where it was started:
v <output file>.cfg holds various configuration data from the system
v <output file>.log holds the raw data samples taken during the data collection
phase in a binary format
Usage notes
v Needs vmalloc space for each device node and CPU.
v The ziomon tool can be stopped with CTRL+C before the time period expires.
Special tools
Tools for special circumstances that can be used when debugging Linux on Systemz problems.
Chapter 2. Tools for troubleshooting 15
8/10/2019 Lnxsv00Troubleshooting Linux Guide
http://slidepdf.com/reader/full/lnxsv00troubleshooting-linux-guide 22/40
s390dbf traces - Use the kernel debug featureAll device drivers and other kernel components write debug log records. Theserecords are available after a system crash. You can also read and save them on a
running system.
To look at these debug logs use the Linux file system debugfs, which must be
mounted. For example, to mount debugfs to /sys/kernel/debug, issue the followingcommand:
[root@system]# mount -t debugfs /sys/debug /sys/kernel/debug
Below the s390dbf directory each registered component is represented by asubdirectory with the name of that component. The subdirectories contain files thatrepresent different views of the debug log. Available views are: hex_ascii, sprintf,
flush, pages, and level.
The debug information written to the logs depends on the debug level set for thatlog. The debug level ranges from 0 for the least detail to 6 for the most detail. The
default level is 2. Only debug entries with a level that is lower or equal to the actuallevel are written to the log.
To set or change a debug level, from the s390dbf subdirectory for the componentyou want to work with, issue:
echo <value> > level
Examples
v To collect the maximum amount of debug information, issue:
echo 6 > level
v To flush the debug log buffer for the component, issue:
echo - > flush
v The kernel debug feature uses wraparound memory buffers. To increase thebuffer size, read it first and then enter a higher value with the followingcommand:
echo 10 > pages
top - See resource usageThe top command provides a dynamic real-time view of a running system andshows resource usage on a thread level. It can display, for example, CPU utilizationand detailed memory usage.
16 Linux on System z: Troubleshooting
8/10/2019 Lnxsv00Troubleshooting Linux Guide
http://slidepdf.com/reader/full/lnxsv00troubleshooting-linux-guide 23/40
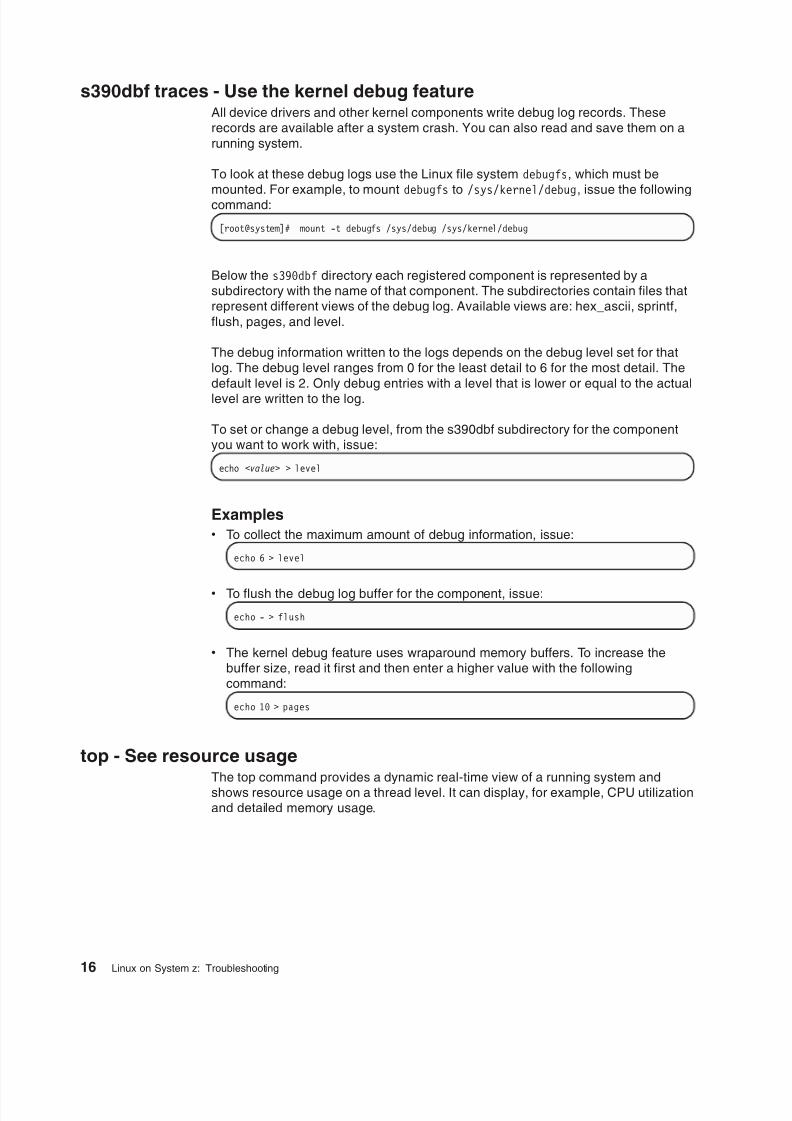
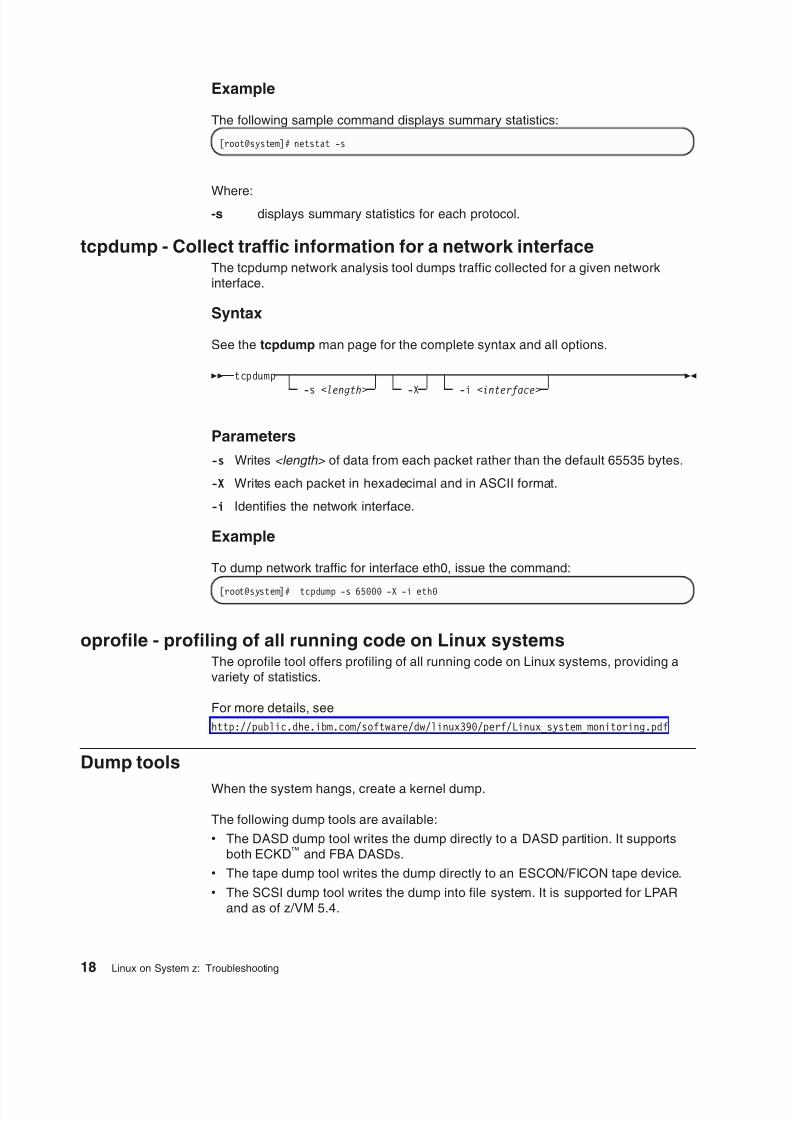
Syntax
See the top man page for the complete syntax and all options.
top-d delay -n iterations ,
-p pid
Parameters
-b Writes the output for each interval into a file.
-d Specifies the delay time interval in seconds.
-n Indicates the maximum number of iterations top should produce before ending.
-p Limits the output to the specified processes.
In the running top program, use the F key to configure displayed columns. Use theW key to write the current configuration to ~/.toprc This is the default directory.
Example
To write 180 iterations 1 second apart into a file, issue:
[root@system]# top -b -d 1 -n 180 >top.log 2>&1
ps - Report a snapshot of the current processesThe ps command gives very comprehensive statistics data on process level andreports a snapshot of the current processes.
See the top man page for the complete syntax and all options.
Example
The following sample command shows every process in an easily readable format:
[root@system]# ( DELAY=10; while [ true ]; do echo "*** "`date`;ps -eLo pid,user,%cpu,%mem,wchan:15,nwchan,stat,time,flags,etime,command:50;sleep $DELAY; done ) | tee psinfo.out
netstat - Show information about the Linux networking subsystemThe netstat command shows information about the Linux networking subsystem.
In particular netstat shows:
v Summary information of each protocol
v Number of incoming and outgoing packages
v Various error states, for example TCP segments retransmitted
See the netstat man page for the complete syntax and all options.
Chapter 2. Tools for troubleshooting 17
8/10/2019 Lnxsv00Troubleshooting Linux Guide
http://slidepdf.com/reader/full/lnxsv00troubleshooting-linux-guide 24/40
Example
The following sample command displays summary statistics:
[root@system]# netstat -s
Where:-s displays summary statistics for each protocol.
tcpdump - Collect traffic information for a network interfaceThe tcpdump network analysis tool dumps traffic collected for a given networkinterface.
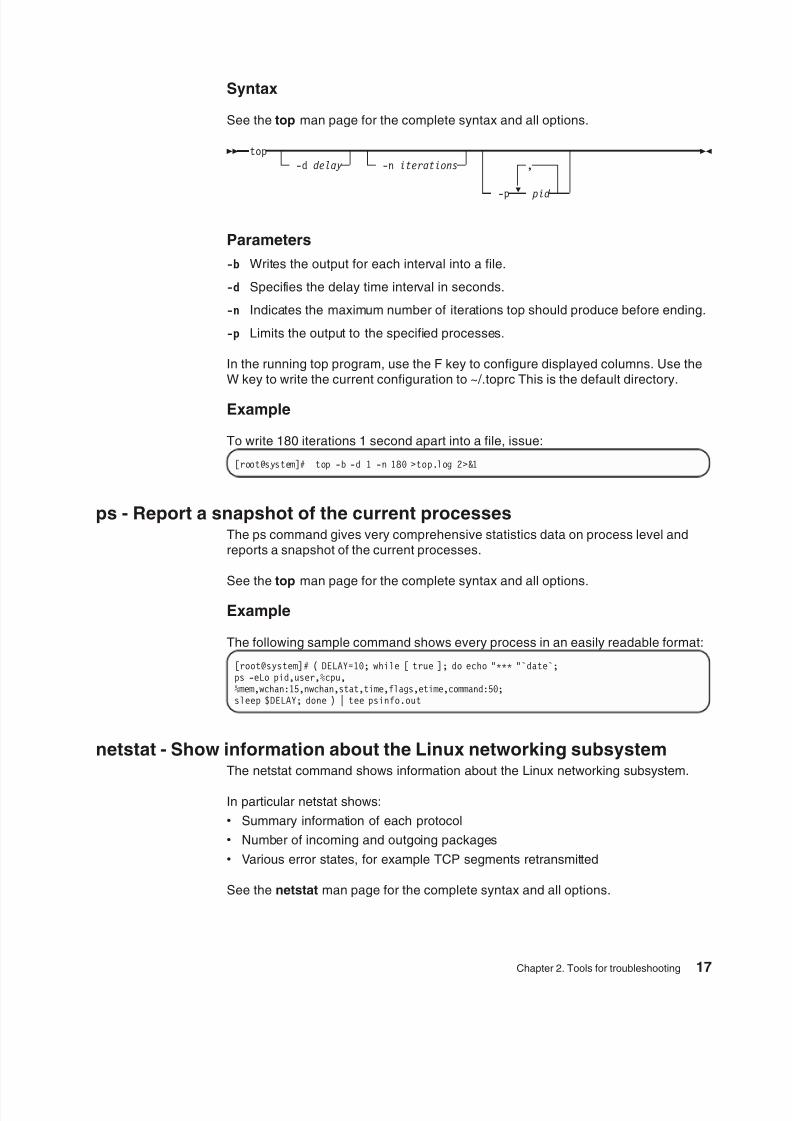
Syntax
See the tcpdump man page for the complete syntax and all options.
tcpdump
-s <length> -X -i <interface>
Parameters
-s Writes <length> of data from each packet rather than the default 65535 bytes.
-X Writes each packet in hexadecimal and in ASCII format.
-i Identifies the network interface.
Example
To dump network traffic for interface eth0, issue the command:
[root@system]# tcpdump -s 65000 -X -i eth0
oprofile - profiling of all running code on Linux systemsThe oprofile tool offers profiling of all running code on Linux systems, providing avariety of statistics.
For more details, see
http://public.dhe.ibm.com/software/dw/linux390/perf/Linux_system_monitoring.pdf
Dump tools
When the system hangs, create a kernel dump.
The following dump tools are available:
v The DASD dump tool writes the dump directly to a DASD partition. It supportsboth ECKD™ and FBA DASDs.
v The tape dump tool writes the dump directly to an ESCON/FICON tape device.
v The SCSI dump tool writes the dump into file system. It is supported for LPARand as of z/VM 5.4.
18 Linux on System z: Troubleshooting

8/10/2019 Lnxsv00Troubleshooting Linux Guide
http://slidepdf.com/reader/full/lnxsv00troubleshooting-linux-guide 25/40
v VMDUMP (for z/VM guest operating systems) writes the dump to z/VM spoolspace (VM reader). VMDUMP uses a dump format specific to z/VM, the dumpmust be converted. Do not use VMDUMP to dump large VM guests; the dumpprocess is very slow.
For more details, see
http://www.ibm.com/developerworks/linux/linux390/documentation_dev.html
Chapter 2. Tools for troubleshooting 19

8/10/2019 Lnxsv00Troubleshooting Linux Guide
http://slidepdf.com/reader/full/lnxsv00troubleshooting-linux-guide 26/40
20 Linux on System z: Troubleshooting

8/10/2019 Lnxsv00Troubleshooting Linux Guide
http://slidepdf.com/reader/full/lnxsv00troubleshooting-linux-guide 27/40

8/10/2019 Lnxsv00Troubleshooting Linux Guide
http://slidepdf.com/reader/full/lnxsv00troubleshooting-linux-guide 28/40
22 Linux on System z: Troubleshooting

8/10/2019 Lnxsv00Troubleshooting Linux Guide
http://slidepdf.com/reader/full/lnxsv00troubleshooting-linux-guide 29/40
Chapter 4. Exchanging information with IBM
To diagnose or identify a problem, you might need to provide IBM Support with dataand information from your system. In other cases, IBM Support might provide you
with tools or utilities to use for problem determination.
Sending information to IBM Support
To reduce the time that is required to resolve your problem, you can send trace anddiagnostic information to IBM Support.
Procedure
To submit diagnostic information to IBM Support:
1. Open a problem management record (PMR).
2. Collect the diagnostic data that you need. Diagnostic data helps reduce the timethat it takes to resolve your PMR. See the following topics:
v “Collecting data for general Linux on System z problems” on page 4
v “Collecting data for performance problems” on page 4
v “Collecting data for network problems” on page 5
v “Collecting data for hung system problems” on page 5
v “Collecting data for middleware problems” on page 5.
3. Compress the files by using the .zip or .tar file format.
4. Transfer the files to IBM. You can use one of the following methods to transferthe files to IBM:
v Standard data upload methods: FTP, HTTP
There are two servers available for uploading data:
– testcase.boulder.ibm.com (US only)
– ecurep.ibm.com (international)
For upload instructions, see http://www.ibm.com/de/support/ecurep/index.html.
v Secure data upload methods: FTPS, SFTP, HTTPS
v IBM Support Assistant
v The Service Request tool
All of these data exchange methods are explained on the IBM Support website.
Receiving information from IBM Support
Occasionally an IBM technical-support representative might ask you to download
diagnostic tools or other files. You can use FTP to download these files.
Before you begin
Ensure that your IBM technical-support representative provided you with thepreferred server to use for downloading the files and the exact directory and filenames to access.
Procedure
To download files from IBM Support:
© Copyright IBM Corp. 2012 23
8/10/2019 Lnxsv00Troubleshooting Linux Guide
http://slidepdf.com/reader/full/lnxsv00troubleshooting-linux-guide 30/40
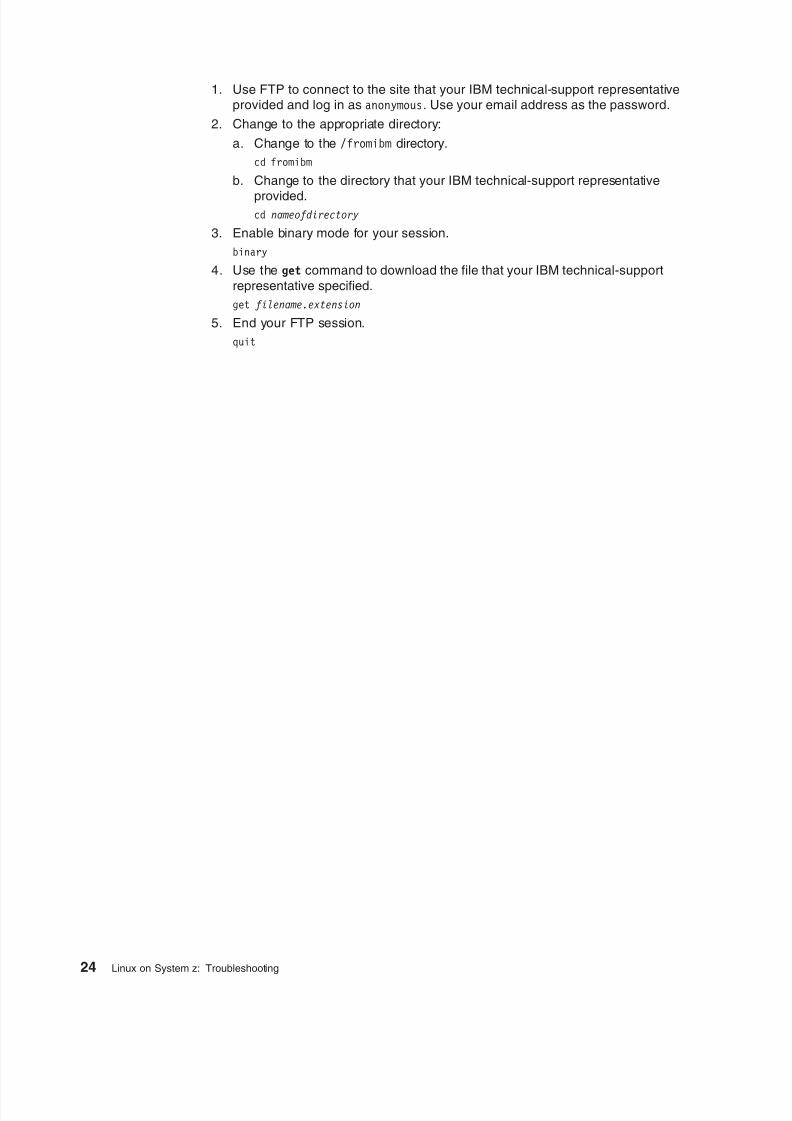
1. Use FTP to connect to the site that your IBM technical-support representativeprovided and log in as anonymous. Use your email address as the password.
2. Change to the appropriate directory:
a. Change to the /fromibm directory.
cd fromibm
b. Change to the directory that your IBM technical-support representative
provided.cd nameofdirectory
3. Enable binary mode for your session.
binary
4. Use the get command to download the file that your IBM technical-support
representative specified.
get filename.extension
5. End your FTP session.
quit
24 Linux on System z: Troubleshooting
8/10/2019 Lnxsv00Troubleshooting Linux Guide
http://slidepdf.com/reader/full/lnxsv00troubleshooting-linux-guide 31/40
Accessibility
Accessibility features help users who have a disability, such as restricted mobility orlimited vision, to use information technology products successfully.
Documentation accessibility
The Linux on System z publications are in Adobe Portable Document Format (PDF)and should be compliant with accessibility standards. If you experience difficultieswhen you use the PDF file and want to request a Web-based format for this
publication, use the Reader Comment Form in the back of this publication, send anemail to [email protected], or write to:
IBM Deutschland Research & Development GmbH
Information DevelopmentDepartment 3248Schoenaicher Strasse 22071032 Boeblingen
Germany
In the request, be sure to include the publication number and title.
When you send information to IBM, you grant IBM a nonexclusive right to use or
distribute the information in any way it believes appropriate without incurring anyobligation to you.
IBM and accessibility
See the IBM Human Ability and Accessibility Center for more information about thecommitment that IBM has to accessibility at
www.ibm.com/able
© Copyright IBM Corp. 2012 25

8/10/2019 Lnxsv00Troubleshooting Linux Guide
http://slidepdf.com/reader/full/lnxsv00troubleshooting-linux-guide 32/40
26 Linux on System z: Troubleshooting
8/10/2019 Lnxsv00Troubleshooting Linux Guide
http://slidepdf.com/reader/full/lnxsv00troubleshooting-linux-guide 33/40
Notices
This information was developed for products and services offered in the U.S.A. IBMmay not offer the products, services, or features discussed in this document in othercountries. Consult your local IBM representative for information on the products andservices currently available in your area. Any reference to an IBM product, program,
or service is not intended to state or imply that only that IBM product, program, orservice may be used. Any functionally equivalent product, program, or service thatdoes not infringe any IBM intellectual property right may be used instead. However,it is the user's responsibility to evaluate and verify the operation of any non-IBM
product, program, or service.
IBM may have patents or pending patent applications covering subject matterdescribed in this document. The furnishing of this document does not give you any
license to these patents. You can send license inquiries, in writing, to:
IBM Director of LicensingIBM Corporation
North Castle DriveArmonk, NY 10504-1785U.S.A.
The following paragraph does not apply to the United Kingdom or any other
country where such provisions are inconsistent with local law:INTERNATIONAL BUSINESS MACHINES CORPORATION PROVIDES THISPUBLICATION “AS IS” WITHOUT WARRANTY OF ANY KIND, EITHER EXPRESSOR IMPLIED, INCLUDING, BUT NOT LIMITED TO, THE IMPLIED WARRANTIES
OF NON-INFRINGEMENT, MERCHANTABILITY OR FITNESS FOR APARTICULAR PURPOSE. Some states do not allow disclaimer of express orimplied warranties in certain transactions, therefore, this statement may not apply toyou.
This information could include technical inaccuracies or typographical errors.Changes are periodically made to the information herein; these changes will beincorporated in new editions of the publication. IBM may make improvements and/orchanges in the product(s) and/or the program(s) described in this publication at any
time without notice.
Any references in this information to non-IBM Web sites are provided forconvenience only and do not in any manner serve as an endorsement of those
Web sites. The materials at those Web sites are not part of the materials for thisIBM product and use of those Web sites is at your own risk.
IBM may use or distribute any of the information you supply in any way it believes
appropriate without incurring any obligation to you.
The licensed program described in this information and all licensed materialavailable for it are provided by IBM under terms of the IBM Customer Agreement,
IBM International Program License Agreement, or any equivalent agreementbetween us.
All statements regarding IBM's future direction or intent are subject to change or
withdrawal without notice, and represent goals and objectives only.
© Copyright IBM Corp. 2012 27
8/10/2019 Lnxsv00Troubleshooting Linux Guide
http://slidepdf.com/reader/full/lnxsv00troubleshooting-linux-guide 34/40
This information is for planning purposes only. The information herein is subject tochange before the products described become available.
Trademarks
IBM, the IBM logo, and ibm.com are trademarks or registered trademarks of
International Business Machines Corp., registered in many jurisdictions worldwide.Other product and service names might be trademarks of IBM or other companies.A current list of IBM trademarks is available on the Web at "Copyright and
trademark information" at
www.ibm.com/legal/copytrade.shtml
Adobe is either a registered trademark or trademark of Adobe Systems Incorporatedin the United States, and/or other countries.
Linux is a registered trademark of Linus Torvalds in the United States, othercountries, or both.
28 Linux on System z: Troubleshooting

8/10/2019 Lnxsv00Troubleshooting Linux Guide
http://slidepdf.com/reader/full/lnxsv00troubleshooting-linux-guide 35/40
Index
Aaccessibility 25
Cchecklists
troubleshooting
Linux on System z 3
collecting data for general Linux on System z
problems 4
DDASD statistics 13
dbginfo 7
diagnostic data
collecting for hung system problems 5
collecting for middleware problems 5collecting for network problems 5
collecting for performance problems 9
starting sadc/sar directly 10
dump tools 18
Ggeneral Linux on System z problems
collecting data for 4
Hhung system
troubleshootingcollecting diagnostic data 5
Iiostats 11
LLinux on System z
troubleshooting checklist 3
Mmiddleware
troubleshooting
collecting diagnostic data 5
MONWRITE 12
Nnetwork
troubleshooting
collecting diagnostic data 5
Ooprofile 18
Pperformance problems
collecting diagnostic data 9
problem determination
exchanging information with IBM Support 23
ps 17
Ss390dbf 16
sadc
starting as service 9
sar
starting as service 9SCSI statistics 13
starting sadc/sar directly
troubleshooting
collecting diagnostic data 10
supportconfig 7, 8
Ttcpdump 18
top 17
troubleshooting
checklist
Linux on System z 3
collecting data for general Linux on System zproblems 4
collecting data for hung system problems 5
collecting data for middleware problems 5
collecting data for network problems 5
collecting data for performance problems 9
starting sadc/sar directly 10
general tools 7
identifying problems, techniques for 1
Linux on System z 1
performance tools 9
special tools 16
tools 7
troubleshooting and support
contacting IBM Support 21exchanging information with IBM Support 23
troubleshooting techniques 1
troubleshooting tools
DASD statistics 13
dbginfo 7
dump tools 18
iostats 11
MONWRITE 12
oprofile 18
ps 17
s390dbf 16
© Copyright IBM Corp. 2012 29

8/10/2019 Lnxsv00Troubleshooting Linux Guide
http://slidepdf.com/reader/full/lnxsv00troubleshooting-linux-guide 36/40
troubleshooting tools (continued)
SCSI statistics 13
supportconfig 7, 8
tcpdump 18
top 17
ziomon 14
Zziomon 14
30 Linux on System z: Troubleshooting

8/10/2019 Lnxsv00Troubleshooting Linux Guide
http://slidepdf.com/reader/full/lnxsv00troubleshooting-linux-guide 37/40

8/10/2019 Lnxsv00Troubleshooting Linux Guide
http://slidepdf.com/reader/full/lnxsv00troubleshooting-linux-guide 38/40
Readers’ Comments — We'd Like to Hear from You
Cut or FoAlong Lin
Cut or FoAlong Lin
Fold and Tape Please do not staple Fold and Tape
Fold and Tape Please do not staple Fold and Tape
PLACE
POSTAGE
STAMP
HERE
IBM Deutschland Research & Development GmbHInformation DevelopmentDepartment 3248Schoenaicher Strasse 22071032 Boeblingen
Germany
_ _ _ _ _ _ _ _ _ _ _ _ _ _ _ _ _ _ _ _ _ _ _ _ _ _ _ _ _ _ _ _ _ _ _ _ _ _ _ _ _ _ _ _ _ _ _ _ _ _ _ _ _ _ _ _ _ _ _ _ _ _ _ _ _ _ _ _ _ _ _ _ _ _ _ _ _ _ _ _ _ _ _ _ _
_ _ _ _ _ _ _ _ _ _ _ _ _ _ _ _ _ _ _ _ _ _ _ _ _ _ _ _ _ _ _ _ _ _ _ _ _ _ _ _ _ _ _ _ _ _ _ _ _ _ _ _ _ _ _ _ _ _ _ _ _ _ _ _ _ _ _ _ _ _ _ _ _ _ _ _ _ _ _ _ _ _ _ _ _
_ _ _ _ _ _ _ _ _ _ _ _ _ _ _ _ _ _ _ _ _ _ _ _ _ _ _ _ _ _ _ _ _ _ _ _ _ _
_ _ _ _ _ _ _ _ _ _ _ _ _ _ _ _ _ _ _
_ _ _ _ _ _ _ _ _ _ _ _ _ _ _ _ _ _ _
_ _ _ _ _ _ _ _ _ _ _ _ _ _ _ _ _ _ _
_ _ _ _

8/10/2019 Lnxsv00Troubleshooting Linux Guide
http://slidepdf.com/reader/full/lnxsv00troubleshooting-linux-guide 39/40

8/10/2019 Lnxsv00Troubleshooting Linux Guide
http://slidepdf.com/reader/full/lnxsv00troubleshooting-linux-guide 40/40