Embed Size (px)
Citation preview
German Institute for Economic Research
LNG and Natural Gas Perspectives -Competition – Contracts – Cartel
Christian von HirschhausenTogether with Steven A. Gabriel, Ruud Egging (University of Maryland),
Franziska Holz, Daniel Huppmann (DIW Berlin),Sophia Rüster, Anne Neumann (TU Dresden)
Add picture on dark green area(see slide 9 for an example)
32nd IAEE International ConferenceSan Francisco, CA, June 23, 2009
Picture: Roar Lindefjeld, StatoilHydro – Arctic Discoverer docked at Cove Point – commons.wikimedia.org

- 2 -
Background: EE2 / DIW Program“The Globalization of Natural Gas Markets”
- Jointly between Dresden University of Technology, Chair of Energy Economics and Public Sector Management, and DIW Berlin
- Research and advice to policy makers and the corporate sector, three modules:1) Computational model of the European (and trans-Atlantic) natural gas market
- Competition/oligopoly, effect on prices, quantities- Infrastructure bottlenecks (pipelines, LNG-terminals)- Role of Russia …
2) Institutional economic modeling on governance structures and contracts- Nexus between regulation and contracts- Changing role of long-term contracts- Vertical integration along the LNG value added chain
3) Econometric analysis of energy price developments- Relation between North American, European, Asian gas and oil prices- Cointegration and/or convergence of trans-Atlantic natural gas prices ?
globalgas.ee2.biz

- 3 -
Agenda
1. Introduction
2. Competition – Competition for LNG in the Atlantic Basin
3. Contracts – Vertical Integration and Investments
4. Cartel and Other Scenarios – A Modeling Analysis
5. Conclusions

- 4 -
1. Introduction: Is Global Natural Gas Trade Still Relevant?The (Short-Term) Future of LNG Looks Unpromising
• EIA International Energy Outlook LNG Imports: 2007 versus 2008
• Recent forecasts expect:- Lower net imports from Canada- Increasing domestic production, Alaska, but mainly shale gas- “Oversupply” of LNG due to economic crisis
Significantly lower imports in the form of LNG
1,000 bcm ~ 35 Tcf
$ 100 tcm ~ 3.5$/Mcf

- 5 -
Will We Need Natural Gas in 2050?POLES – 2050: Yes (~20% of World Primary Energy Demand)
Source: EC (2006) WETO H2
Carbon-Constraint Case
- Although “CO2-intensive”, natural gas has a role to play in the “transition” to whatever the new energy system will look like
- Natural gas is needed as back-up for a super-smart-grid (combining large-scaledistributed resources, concentrating solar power, wind, etc.)

- 6 -
Agenda
1. Introduction
2. Competition – Competition for LNG in the Atlantic Basin
3. Contracts – Vertical Integration and Investments
4. Cartel and Other Scenarios – A Modeling Analysis
5. Conclusions
- 7 -
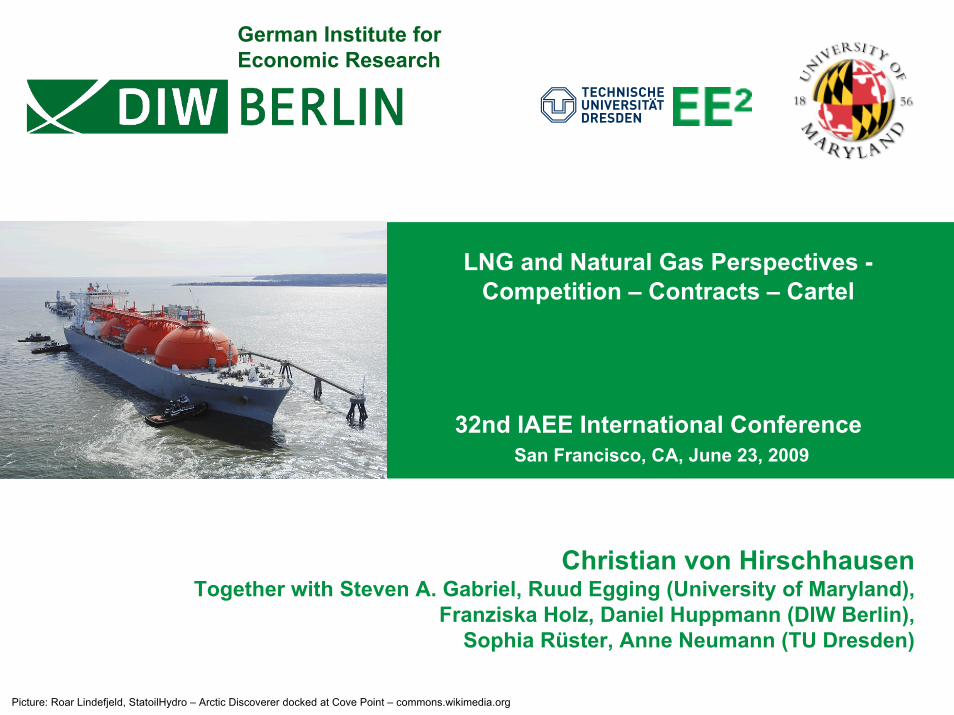
4 Hypotheses
As international markets are increasingly integrated, and regional markets are restructured, competition on natural gas markets is intensifying
Contract structures are also evolving towards more flexible arrangements; corporate structures depend upon specific strategy options
Upstream markets tend to be more oligopolistic in nature, but the risk of a “GECF cartel” or Russian dominance seem to be manageable
The integration of “unconventional” natural gas reserves (mainly shale gas, but also coalbed-methane, tight gas) may change the medium-term outlook of international LNG-trade, in particular the role of the U.S., significantly

- 8 -
Price Relations in the Atlantic Basin
Published in:
• Anne Neumann (2009): Is LNG Doing Its Job? The Energy Journal, Vol. 30, Special Issue “World Natural Gas Markets and Trade: A Multi-ModelingPerspective”, pp. 187-199.
• Boriss Siliverstovs, Anne Neumann, Guillaume L'Hegaret, and Christian von Hirschhausen (2005): International Market Integration for Natural Gas? A Cointegration Analysis of Gas Prices in Europe, North America and Japan. Energy Economics, Vol. 27, No. 4, pp. 603-615.
• Also as Discussion Papers: www.ee2.biz

- 9 -
Natural Gas Trade Flows 2006 / 2030
Source: IEA World Energy Outlook 2008
1,000 bcm ~ 35 Tcf
$ 100 kcm ~ 3.5$/Mcf

- 10 -
Infrastructure Investment is Forthcoming, but is it Efficient?Comparison of the three Main Regions
U.S. Europe
Highly diversified Concentrated, butdiversificationpossible
Quasi-verticalintegration
National regulation, little European coordination
National prices, fewhubs, low liquidity
RoR based, Art. 22, TPA exemptions, etc.
Unbundled
Truly integratedinter-state market, FERC regulation
Nodal pricing, ~ 25 market centers(U.S. and Canada)
RoR based, TPA exemptionspossible for LNG-terminals(Hackberry)
Asia(Japan/Korea)
Supply structure Highly importdependent
Monopolistic
Regulated prices
Includes high riskpremium
Long-term planningapproach
Market structure
Regulatory structure
Pricing
Investment incentives

- 11 -
North America: Coordinated Spot Market:Bid-Based, Security-Constrained, Economic Dispatch with Nodal Prices

- 12 -
… But the Pricing System Allows Efficient Decisions on Investment Financing: Example of the Rockies Express Pipeline Project
• I ~ 5 bn. USD, 2,700 km, 15-18 bcm
• FERC-filing, open season, nodal pricing, etc. identification of bottlenecks
• TPA with „regulated“ ROR, secondary trading, etc. efficient capacity allocation
Source map:: IEA Natural Gas Market Review 2008

- 13 -
Europe: The Main Obstacles to the Internal Market are intra-EuropeanGasmod Results
France→ Spain
UK ↔Continent
Norway→Europe
Between BL, NL, GER and Fr

- 14 -
European LNG Import Capacities are Rapidly Expanding
Existing
Planned /underdiscussion
Under construction
• Money (rate-of-return) is no object
• UK and Spain examples show that investments in LNG terminals are forthcoming
• This holds most likely for other countries/terminals as well

- 15 -
Asia: Sustained, though Uncertain (LNG) Demand, andGradually More Competitive Markets
• Japan and South Korea:- Remain the backbone of intenational LNG demand- Gradually moving towards more gas-to-gas competition
• China: LNG boom not yet materialized, but growth is likely
• India/Indonesia: Depends upon price of coal/carbon policy
Asia will remain a major competitor for LNG

- 16 -
Towards LNG Competition in the Atlantic Basin
3
4
5
6
7
8
9
10
11
12
Jan-
05
Mar
-05
May
-05
Jul-0
5
Sep
-05
Nov
-05
Jan-
06
Mar
-06
May
-06
Jul-0
6
Sep
-06
Nov
-06
$/MbtuLNG from Algeria to SpainLNG from Qatar to SpainHenry Hub
LNG cargoes to USLNG cargoes to Europe
- 17 -
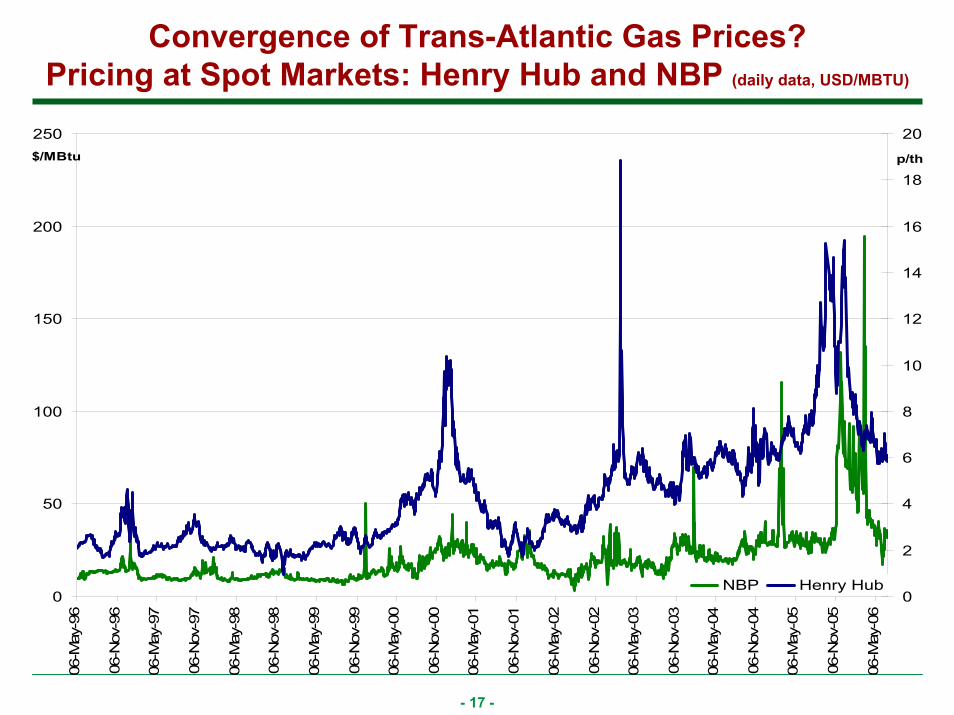
Convergence of Trans-Atlantic Gas Prices?Pricing at Spot Markets: Henry Hub and NBP (daily data, USD/MBTU)
0
50
100
150
200
250
06-M
ay-9
6
06-N
ov-9
6
06-M
ay-9
7
06-N
ov-9
7
06-M
ay-9
8
06-N
ov-9
8
06-M
ay-9
9
06-N
ov-9
9
06-M
ay-0
0
06-N
ov-0
0
06-M
ay-0
1
06-N
ov-0
1
06-M
ay-0
2
06-N
ov-0
2
06-M
ay-0
3
06-N
ov-0
3
06-M
ay-0
4
06-N
ov-0
4
06-M
ay-0
5
06-N
ov-0
5
06-M
ay-0
6
$/MBtu
0
2
4
6
8
10
12
14
16
18
20
p/th
NBP Henry Hub
- 18 -
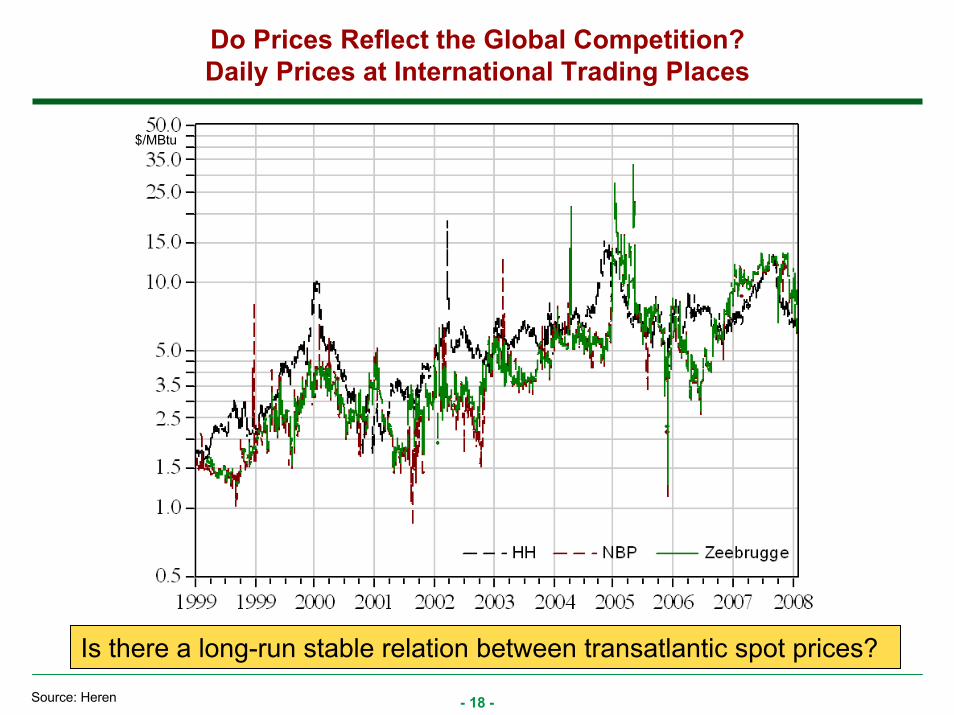
Do Prices Reflect the Global Competition?Daily Prices at International Trading Places
Source: Heren
Is there a long-run stable relation between transatlantic spot prices?
$/MBtu

- 19 -
• No stable cointegration relation between prices (yet?)
• Market integration understood as dynamic concept, hence movingtowards price integration
- Restructured natural gas markets in North America and Europe- High proportion of spot trading - Increasing integration of former regional unconnected natural gas markets - Active LNG arbitrage in the Atlantic Basin
• Kalman Filter - dynamic structural change, time-varying coefficient models- βt contains information on price relationship
β = 0 no market integrationβ = 1 LOP holds; markets are fully integratedβ 1 increasing market integration over time
Methodological Approach: Price Convergence
lnp1t = α + βt*lnp2t + et
βt = βt-1 + ut

- 20 -
Estimated Beta-Coefficient for Transatlantic Prices
- Results indicate increasing convergence over time
- Including more recent data supports the existing trend
- Seasonal trend: higher coefficient in winter (~ January)
- Confirmed by anecdotal evidence (~$22/MBTu in Japan)

- 21 -
Agenda
1. Introduction
2. Competition – Competition for LNG in the Atlantic Basin
3. Contracts – Vertical Integration and Investments
4. Cartel and Other Scenarios – A Modeling Analysis
5. Conclusions

- 22 -
Contracts and Vertical Integration in the LNG Value Chain
Published in:
• Christian von Hirschhausen and Anne Neumann (2008): Long-Term Contracts and Asset Specificity Revisited: An Empirical Analysis of Producer-Importer Relations in the Natural Gas Industry. Review of Industrial Organization, Vol. 32, No. 2, pp. 131-143.
• Sophia Rüster and Anne Neumann (2009): Linking Alternative Theories of the Firm – A First Empirical Application to the Liquefied Natural Gas Industry. Journal of Institutional Economics, Vol. 5, No. 1, pp. 47-64.
• Sophia Rüster (2009): Relational Contracting in the LNG Industry – An Empirical Analysis. Presented at 32nd IAEE Conference.
• Also as Discussion Papers: www.ee2.biz

- 23 -
Existing Literature
Transaction cost economics and agency theory:- Long-term contracts minimize transaction cost when significant specific assets are required
- Overcome the hold-up problem without vertical integration (Klein, Crawford, and Alchian, 1978, Williamson, 1979)
- Asset-specificity, uncertainty, opportunism, bounded rationality (Williamson, 1975, 1985)
- Sufficient investment incentives and inexpensive ex- post renegotiation
Incomplete contracts:- Reduce inefficiencies in ex-ante investments or ex-post exchange (Grossmann / Hart,
1986, Hart / Moore, 1988)
Empirical evidence:- Work by Joskow (1987) on contract duration and asset-specificity in American coal industry
- Masten / Crocker (1985) and Crocker / Masten (1988) focus on the US natural gas industry, contractual take-obligations relate negatively with contract duration
- Influence of US governmental regulation on long-term contracts in natural gas sector (Mulherin, 1986, Hubbard / Weiner, 1986, Doane / Spulber, 1994)
- Flexibility and price trends in contract negotiations (Parsons, 1986); increasing use of spot transactions in LNG industry (Hartley / Brito, 2002)

- 24 -
Structural Changes in the International Natural Gas Industry
- Relative cost reduction in the LNG value-added chain- Economies of scale in liquefaction- Lower costs for shipping- Economies of scale in regas
- Diminishing asset specificity of investments- Formerly: field-specific contracts- Nowadays: infrastructure developed, less hold-up risk, more general country-
focused contracts- More players on both sides (producers, traders, importers)
- Development of spot markets and shorter-term trading
- Increased number of market participants- Producers- Buyers
Less need for long-term contracts to overcome the hold-up problem

- 25 -
Data – Sample Size
All contracts
European contracts
Number of contracts
Number of contracts Contract duration (in years)
Contract duration (in years)
0
4
8
12
16
20
5 10 15 20 25 30 35 40
Series: CDSample 1 135Observations 135
Mean 18.95926Median 20.00000Maximum 39.00000Minimum 2.000000Std. Dev. 8.170079Skewness 0.165087Kurtosis 2.697388
Jarque-Bera 1.128311Probability 0.568840
0
10
20
30
40
50
60
5 10 15 20 25 30 35 40
Series: CDSample 1 262Observations 262
Mean 19.28435Median 20.00000Maximum 39.00000Minimum 2.000000Std. Dev. 6.678600Skewness -0.084494Kurtosis 3.464052
Jarque-Bera 2.662583Probability 0.264136
- 26 -
Con
tract
Dur
atio
n(in
yea
rs)
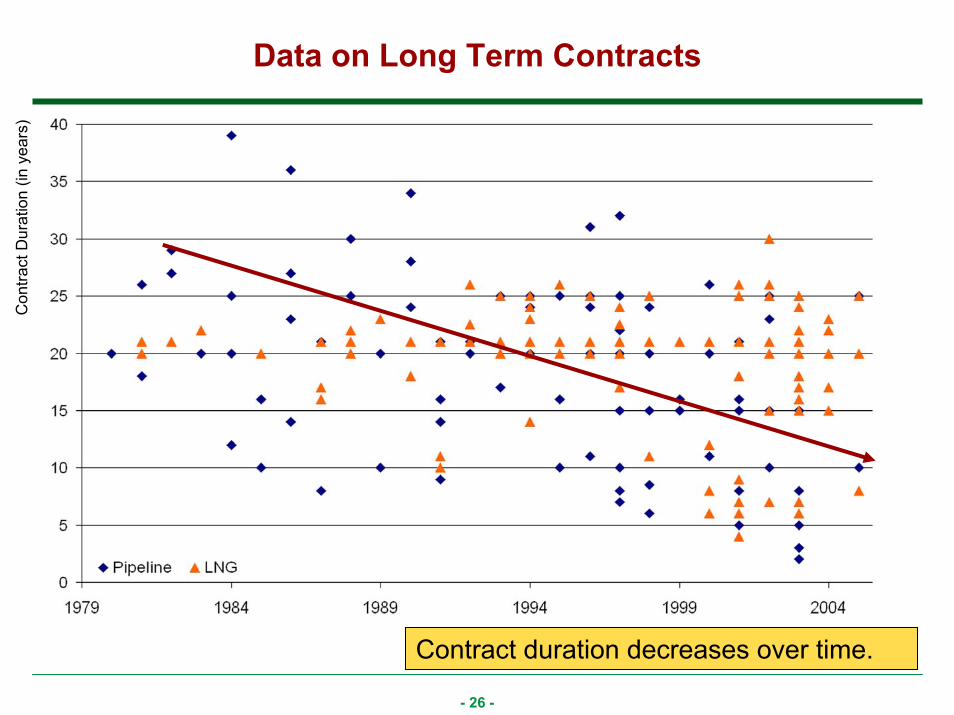
Data on Long Term Contracts
Contract duration decreases over time.

- 27 -
An Econometric Specification ...... Taking into Account Project Specificity
Contract Duration = c + β1TVol + β2PROJECT + β3ENTRANT
+ β4RENEGO + β5EU_post98 + β6C_US_UK + β7P_AFRICA
+ β8P_Eurasia + β9P_Russia + β10P_ME + β11P_Oceania + εi
CD – contract duration RENEGO – extension/renegotiationTVOL – total contracted volume EU_post98 – deliveries to Europe since 1998 PROJECT – related to investments in a concrete project C_US_UK - exports to competitive marketsENTRANT – importing incumbent companies P_Eurasia –gas producing regions
H1: Market restructuring and emergence of a global natural gas marketreduces the duration of long-term contracts;
H2: Other things being equal, contracts that imply large-scale, asset-specific investments will have longer contract duration than do othercontracts.

- 28 -
Results (311 observations, as of 2006)
Reported are estimated coefficients and p-values. ***, **,* indicate significance at 1%, 5%, and 10% level
Specification Level
C 20.54***(0.0000)
TVOL 0.04***(0.0000)
PROJECT 3.09***(0.0000)
ENTRANT -3.09***(0.0001)
RENEGO -4.36***(0.0000)
EU_post98 -1.50**(0.0416)
C_US_UK -2.42**(0.0502)
P_regions Negative, significant
R2 0.326
Adjusted R2 0.301
H1: Contract duration negatively related with variablesrepresenting market restructuring.
H2: Positive relation between contract duration and asset-specificity of the investments linked to a particular contract.
- 29 -
Agenda
1. Introduction
2. Competition – Competition for LNG in the Atlantic Basin
3. Contracts – Vertical Integration and Investments
4. Cartel and Other Scenarios – A Modeling Analysis1. The World Gas Model (WGM), Model & Data2. „Upstream Withholding“3. „Eastern Promises“4. „Barnett Shale“
5. Conclusions

- 30 -
References
• Egging, Ruud, Franziska Holz, Christian von Hirschhausen, Steven A. Gabriel (2009):Representing GASPEC With the World Gas Model. The Energy Journal, Vol. 30, Special Issue “World Natural Gas Markets and Trade: A Multi-Modeling Perspective”, pp. 97-117.
• Egging, Ruud, Franziska Holz, and Daniel Huppmann (2009): Pretty Coast California: Implications of an LNG Import Terminal Ban for the US Pacific Coast Up To 2030. Presented at 28th USAEE conference, Dec 5, 2008 New Orleans, LA
• Egging, Ruud, Steven A. Gabriel, Franziska Holz and Jifang Zhuang: A Complementarity Model for the European Natural Gas Market. Energy Policy, Vol. 36(7), 2385-2414, July 2008.
• Holz, Franziska, Christian von Hirschhausen, and Claudia Kemfert (2009): International Gas Markets: Modeling Results with the GASMOD-Model. The Energy Journal, Vol. 30, Special Issue “World Natural Gas Markets and Trade: A Multi-Modeling Perspective”.
• Franziska Holz, Christian von Hirschhausen, and Claudia Kemfert (2008): GASMOD –A Model for the European Natural Gas Market. Energy Economics, Vol. 32, No. 3.
• Holz, Franziska, Christian von Hirschhausen, Daniel Huppmann, Sophia Ruester, Steven Gabriel, and Ruud Egging (2008): The World Gas Market in 2030: Policy Scenario Analysis Using the World Gas Model. Presentation at the 8th Infraday, Berlin.
• Also as Discussion Papers: www.ee2.biz

- 31 -
The World Gas Model (WGM)University of Maryland – TU Dresden – DIW Berlin
• WGM is a simulation model of the global natural gas market- Partial market equilibrium model with optimization problems for individual players- Mixed complementarity problem
• Features:- More than 70 countries, 95% of world natural gas production and consumption- Time horizon until 2030 in 5-year intervals, with three seasons per period- Market power for traders in pipeline market and regasifiers- Limited capacities in production, storage, pipeline and LNG transport- Endogenous investments in pipeline, storage and LNG capacity- LNG contract database, not just spot market
• Calibration to projections of energy markets (PRIMES, POLES)- POLES projections include a worldwide increase in natural gas production and
consumption by 70% until 2030, followed by stagnation in demand- PRIMES price forecast of an annual increase by 3%

- 32 -
The World Gas Model – Countries in the Model
Countries included in the WGM (light green: consumption only)

- 33 -
The World Gas Model – Structure
Players and natural gas flows in the WGM

- 34 -
The World Gas Model – Players
• Producer
• Trader- one trader per producer- in charge of exports via pipeline
• Liquefier
• Regasifier
• Storage Operator- arbitrageur between low, high and peak demand seasons
• (Pipeline Operator)- to allocate pipeline capacity to traders- „Third Party Access“
• (Marketer)- represented by inverse demand function of final consumers (industry,
households/commercial, electricity)- players in brackets are modelled implicitely

- 35 -
Base Case – Global Natural Gas Market Development
Global natural gas volumes and world average wholesale price, in bcm/y and $/kcm
1,000 bcm ~ 35 Tcf
$ 100 tcm ~ 3.5$/Mcf

- 36 -
Base Case – Global Natural Gas Flows in 2030Natural gas flows in 2030 by region, in bcm/y
Truly integrated, globalized natural gas markets
Middle East and Russia/Turkmenistan as “swing suppliers”
Values not yet “updated” with economic crisis, shale gas, etc.
1,000 bcm ~ 35 Tcf
$ 100 tcm ~ 3.5$/Mcf

- 37 -
4 Hypotheses
As international markets are increasingly integrated, and regional markets are restructured, competition on natural gas markets is intensifying
Contract structures are also evolving towards more flexible arrangements; corporate structures depend upon specific strategy options
Upstream markets tend to be more oligopolistic in nature, but the risk of a “GECF cartel” or Russian dominance seem to be manageable
The integration of “unconventional” natural gas reserves (mainly shale gas, but also coalbed-methane, tight gas) may change the medium-term outlook of international LNG-trade, in particular the role of the U.S., significantly
- 38 -
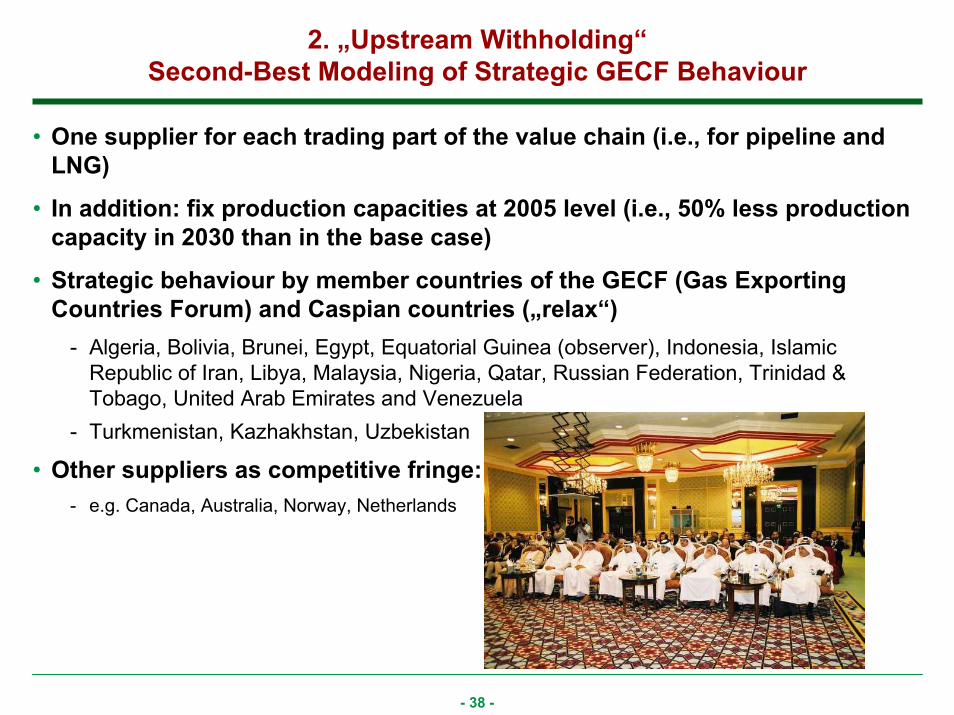
2. „Upstream Withholding“Second-Best Modeling of Strategic GECF Behaviour
• One supplier for each trading part of the value chain (i.e., for pipeline and LNG)
• In addition: fix production capacities at 2005 level (i.e., 50% less productioncapacity in 2030 than in the base case)
• Strategic behaviour by member countries of the GECF (Gas ExportingCountries Forum) and Caspian countries („relax“)
- Algeria, Bolivia, Brunei, Egypt, Equatorial Guinea (observer), Indonesia, Islamic Republic of Iran, Libya, Malaysia, Nigeria, Qatar, Russian Federation, Trinidad & Tobago, United Arab Emirates and Venezuela
- Turkmenistan, Kazhakhstan, Uzbekistan
• Other suppliers as competitive fringe:- e.g. Canada, Australia, Norway, Netherlands

- 39 -
„Upstream Withholding“: Scenario Results
• Total world production lower than in base case, despite compensation of withheld capacities by competitive fringe
• However, quite some resilience in the global system (i.e., failing suppliescan to a large extend be replaced), constrained in some cases by lackingtransport infrastructure
0
500
1000
1500
2000
2500
3000
3500
4000
4500
CC+ BC CC+ BC CC+ BC
2010 2020 2030
year
ly p
rodu
ctio
n (b
cm)
OtherGEC

- 40 -
„Upstream Withholding“: Significant Price Markups
• Price increase is significant, increases over time due to withholding in capacities (less investments)
$-
$100
$200
$300
$400
$500
$600
2005 2010 2015 2020 2025 2030
pric
e (2
005$
/kcm
)
BCCCCC+

- 41 -
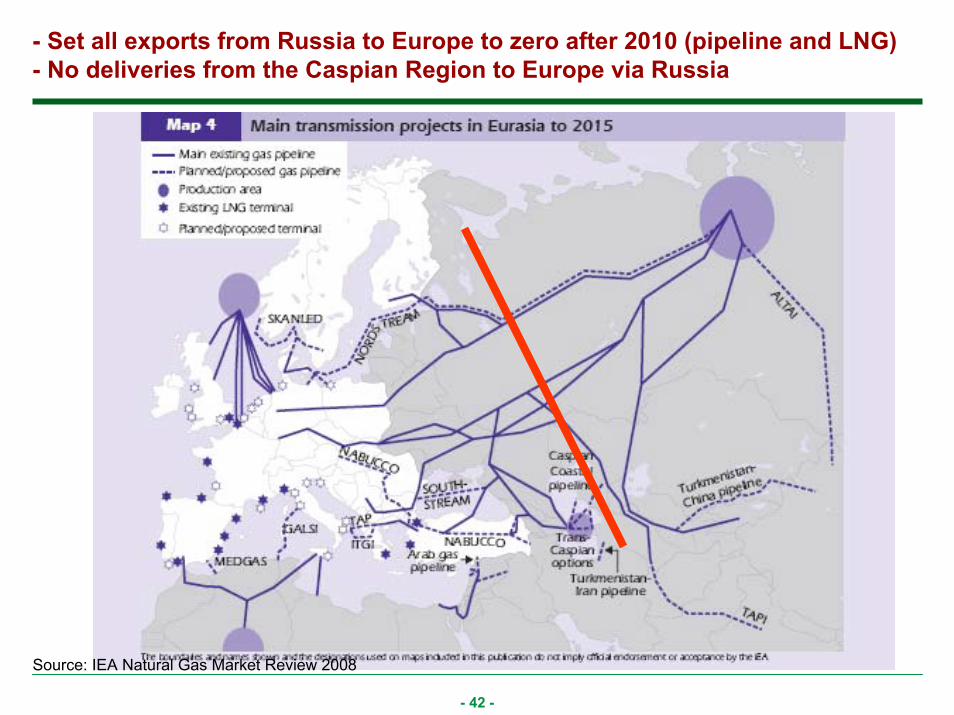
3. „Eastern Promises“ –Russian Embargo towards Europe
Source: APwww.mosnews.com
- 42 -
- Set all exports from Russia to Europe to zero after 2010 (pipeline and LNG)- No deliveries from the Caspian Region to Europe via Russia
Source: IEA Natural Gas Market Review 2008

- 43 -
„Eastern Promises“ – Russian Exports
Russian Natural Gas Distribution, in bcm/y, (Base Case/Scenario)
- 44 -
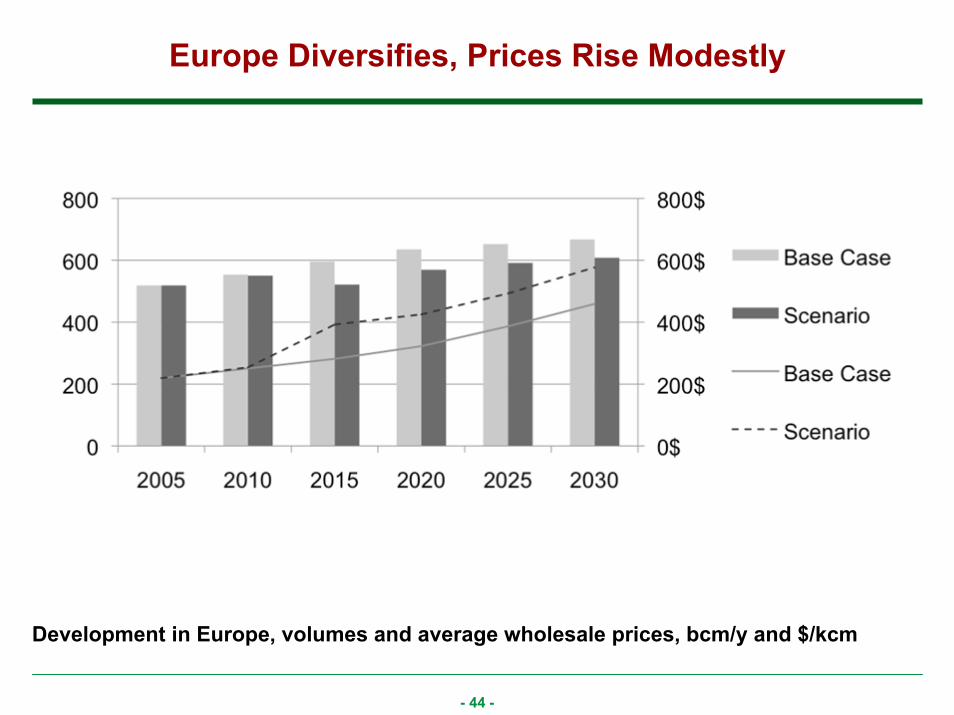
Europe Diversifies, Prices Rise Modestly
Development in Europe, volumes and average wholesale prices, bcm/y and $/kcm

- 45 -
Diversification of the European Natural Gas Supplies (incl. with LNG) Reduces the Dominance of Individual Suppliers such as Russia
• Expected increase of natural gas exports over time comes with anincreasing diversification of supplies, in favor of LNG
• High demand for LNG: mainly comes from North Africa, Africa, partly also from the Caribbean
0
100
200
300
400
500
600
2003 2010 2015 2020 2025
Exp
orts
to E
urop
e in
bcm
per
yea
r
Venezuela
Trinidad
Nigeria
UK
Netherlands
Norway
Russia
Middle East
Iran
Iraq
Egypt
Lybia
Algeria
EMF Reference Scenario, calculated with GASMOD

- 46 -
4 Hypotheses
As international markets are increasingly integrated, and regional markets are restructured, competition on natural gas markets is intensifying
Contract structures are also evolving towards more flexible arrangements; corporate structures depend upon specific strategy options
Upstream markets tend to be more oligopolistic in nature, but the risk of a “GECF cartel” or Russian dominance seem to be manageable
The integration of “unconventional” natural gas reserves (mainly shale gas, but also coalbed-methane, tight gas) may change the medium-term outlook of international LNG-trade, in particular the role of the U.S., significantly

- 47 -
4. „Barnett Shale“:Significant Increase in the Use of Shale Gas Across the Country
Source: IEA Natural Gas Market Review 2008
BarnetShale

- 48 -
Base Case – Global Natural Gas Flows in 2030Natural gas flows in 2030 by region, in bcm/y
Truly integrated, globalized natural gas markets
Middle East and Russia/Turkmenistan as “swing suppliers”
Values not yet “updated” with economic crisis, shale gas, etc.
1,000 bcm ~ 35 Tcf
$ 100 tcm ~ 3.5$/Mcf

- 49 -
„Barnett Shale“ and the Global LNG Market:Include unconventional reserves in the U.S. and Canada in production capacity
-12
-13 -10-34
-38
-49

- 50 -
„Barnett Shale“: Price Effects
• Price effects are mainly local:- in North America - in the Middle East (source of a major share of the U.S. LNG imports in the base
case)

- 51 -

- 52 -
Agenda
1. Introduction
2. Competition – Competition for LNG in the Atlantic Basin
3. Contracts – Vertical Integration and Investments
4. Cartel and Other Scenarios – A Modeling Analysis
5. Conclusions

- 53 -
4 Hypotheses
As international markets are increasingly integrated, and regional markets are restructured, competition on natural gas markets is intensifying
Contract structures are also evolving towards more flexible arrangements; corporate structures depend upon specific strategy options
Upstream markets tend to be more oligopolistic in nature, but the risk of a “GECF cartel” or Russian dominance seem to be manageable
The integration of “unconventional” natural gas reserves (mainly shale gas, but also coalbed-methane, tight gas) may change the medium-term outlook of international LNG-trade, in particular the role of the U.S., significantly