Embed Size (px)
Citation preview
Y. Luo (Ed.): CDVE 2006, LNCS 4101, pp. 275 – 286, 2006. © Springer-Verlag Berlin Heidelberg 2006
An Ambient Workplace for Raising Awareness of Internet-Based Cooperation
Benoît Otjacques, Rod McCall1, and Fernand Feltz
Public Research Center – Gabriel Lippmann Department ISC – Informatics, Systems and Collaboration
41, Rue du Brill L-4422 Belvaux, Luxembourg
[email protected], [email protected], [email protected]
Abstract. This paper discusses a prototype desktop ambient display system known as the Ambient Workplace (AW) that is used to visualise some aspects of cooperation among a group of co-workers. The AW draws on the ambient technology paradigm by providing a visualisation that represents the interactions of the co-workers (either individuals or groups) in their peripheral attention zone. The paper discusses the development of a prototype system based on a series of indices and uses a maritime flags metaphor. The paper also presents some early results from a user study.
1 Introduction
The Internet has had a substantial impact on many areas of computing, including computer supported cooperative work (CSCW) and many software applications have been adapted or developed to harness its potential. The result has been a change in the nature of communication and work, from one where people communicated in closed-network groups to one where people can be working on the same project anywhere in the world. The change in working patterns has altered way that relationships start, develop and end among people in professional and private contexts. Software applications such as instant messaging, web mail, web-based videoconferencing, appeared at an impressive rate. More recently, new forms of Internet-based cooperation have appeared supported by emerging technologies, such as ‘Wiki’ for collaborative editing, ‘Blog’ for easy publishing or ‘Skype’ for voice communications. The combination of information technology and social aspects such as co-operation has resulted in substantial interest within the scientific community, with researchers focussing on issues such as design methodologies, user testing and social aspects. In contrast this paper explores how to visualise co-operation within a group of co-workers.
The paper begins with an explanation of the motivations and background of the Ambient Workplace and continues with an outline of the metaphors used, a description of the system, results from a user study and finally some conclusions and future directions. 1 This work was carried out during the tenure of an ERCIM fellowship.

276 B. Otjacques, R. McCall, and F. Feltz
2 Motivation of the Research
Prior work in the field of CSCW stresses the importance of awareness. Gutwin and Greenberg [6] explain that ‘it is becoming more and more apparent that being able to stay aware of others plays an important role in the fluidity and naturalness of collaboration’. Dourish and Belloti [3] introduced the concept of awareness that they defined as ‘an understanding of the activities of others, which provides a context for your own activity’. Ellis [4] argued that ‘the philosophy of groupware is to encourage cooperation by making it known and instantly apparent to all who is sharing what with whom’. Humphries et al. [9] define activity awareness as ‘knowing what has happened, what is happening and what will likely happen in the future over extended periods of time’. Greenberg [6] indicates that there are many forms of awareness:
• Informal awareness of a work community is the general sense of who is around and what they are up to.
• Social awareness is the information that a person maintains about others in a social or conversational context. For example, whether another person is paying attention, their emotional state, or their level of interest.
• Group-structural awareness involves covers aspects such as the roles and responsibilities of the participants, their views on certain issues, their status and the processes within the group.
• Workspace awareness includes information about the identity of those in the workplace, their location, their activity, and the immediacy of changes with which others’ activities are communicated.
This paper deals with workspace awareness in an Internet-based collaboration platform. It is acknowledged that being kept informed of what is happening in a shared environment is a crucial aspect of collaboration; it is therefore important to explore which techniques can be used to enhance awareness. Several solutions have been developed including: update notifications via email and displays indicating the number of people reading the same webpage [13]. Other methods make use of graphics for example: the icons indicating who is online in MSN Messenger, avatars [11], representing users as abstract shapes [2], visualisations on mobile phones [1] and representing the other users actions in virtual environment [12]. In many cases awareness cues are only provided when the client (CSCW) application is running. In the other cases, the user is not given any feedback on the interactions that are occurring in the collaborative environment
Ambient displays that provide unobtrusive awareness information could be seen as one way to avoid the problem of having to make people log in. Furthermore, displaying workspace awareness information in everyday tools such as email, wallpaper or an IM client provides an elegant way to make sure the information is always available. The purpose of ambient displays is to convey information in the user’s peripheral attention and visual zone in a way that does not require their specific attention. This approach builds on the idea introduced by Heath and Luff [8] of
An Ambient Workplace for Raising Awareness of Internet-Based Cooperation 277
peripheral or ‘out of the corner of the eye’ awareness, i.e. awareness present in the periphery of people’s attention.
3 Ambient Workplace Concept
3.1 Workspace Awareness: Refining the Concept
A collaborative environment is composed of people and resources (e.g. shared calendars, shared virtual objects in industrial design and documents etc.). We group these people and resources under the term ‘entities’. When the entities interact with each other interactions occur. Interactions among the entities include: connections to the collaborative environment, interpersonal communications and creating or updating resources. The research presented here is concerned with providing workspace awareness information which keeps people informed of these types of interactions.
One approach is to notify the user of information relating to specific entities within the workspace, we refer to this as, Workspace Individual Awareness (WIA). This is where information about a specific resource or user is provided. Examples include notification via email that a resource has been updated, or displaying an icon about the presence status of an entity (e.g. online, away, busy).
Another approach is to represent aggregated or anonymous information, we refer to this as Workspace Global Awareness (WGA). Aggregated information refers to the general level of activities in the workplace. In other words, it concerns some information that results from processing a set of individual information elements, but information about each individual element is not displayed. For instance, the number of users connected to the workspace is displayed but not their names. Anonymous information gives the user some feedback on what happens in the collaborative environment but does not explicitly indicate which entities it relates to. For instance, an icon is displayed when the user receives a message but the icon does not indicate the name of the sender or the subject of this message.
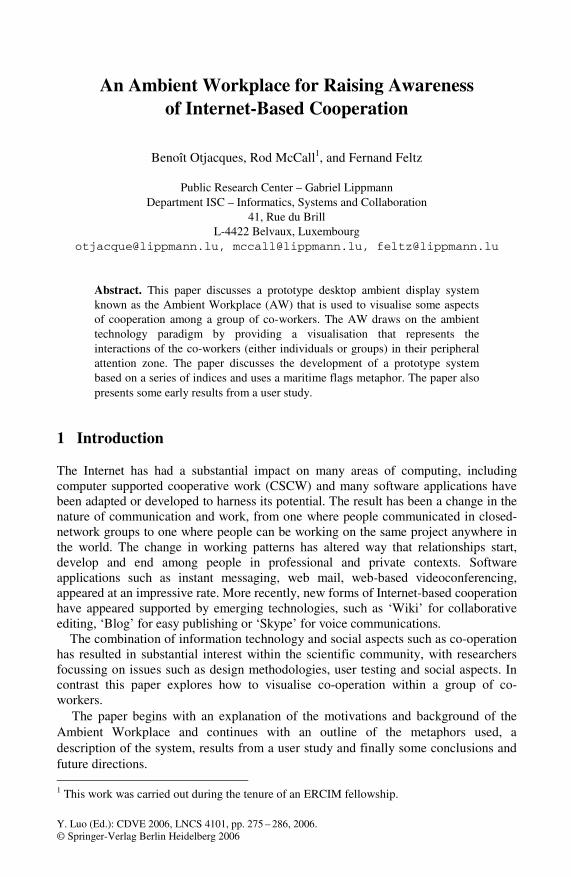
3.2 Information Being Visualized: What?
With respect to global awareness (WGA), we have chosen to focus on aggregated information that makes the user aware of the level of activities on the collaborative platform. At this level, basic statistics are used, such as the number of connected users or the number of new documents since their last visit. This kind of information helps to communicate the volume of activity in the collaborative environment but gives little feedback on the quality of the collaboration. However, it is proposed that WGA should be expanded to include aspects about the quantity and quantity of interactions. The composite indexes proposed by Otjacques et al. [10] provide a starting point in the visualization of WGA and are outlined on the following page.
• Coopadex (electronic Cooperation Activity Composite Index) index is defined as the mean number of computer-mediated interactions by a member of the group for a given period. It represents the quantity of interactions.
278 B. Otjacques, R. McCall, and F. Feltz
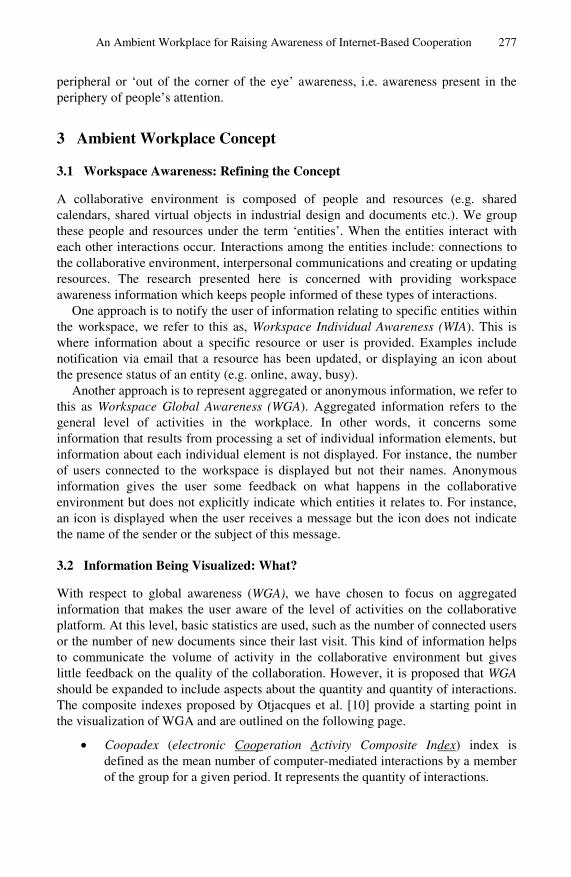
• N-Coopidex (Normalized electronic Cooperation Implication Composite Index) is defined as the normalized weighted combination of the number of interactions according to their cooperative nature. It is intended to be an indicator of the mean quality of the interactions from a collaborative viewpoint.
• Glocoopex (Global electronic Cooperation Composite Index) is defined as the product of Coopadex and N-Coopidex. It provides a global metric of the cooperation from a quantitative and qualitative point of view.
The Glocoopex index provides one measure of WGA, however a visualization is more useful if it also provides information about individual entities (i.e. WIA). For this the system has focussed on monitoring the actions of individual users and not the modification of resources. In order to address this we have chosen to display the number of interactions that a given person has undertaken during a recent time period (e.g. last week). This allows users to see if the entities they have chosen to monitor have created many and/or interesting interactions during the selected time period. Another important aspect that supports WIA is the ability of people to communicate with others and to view the resultant interactions within a visualization.
3.3 Metaphors Used in the Visualization: How?
The technique described in this paper makes use of simple, easy to understand representations. Furthermore, the visualization exists out with the users main attention zone. In order that the visualization remains easy to understand, the same class of metaphor is applied to the elements used to display both global and individual awareness. Moreover, as Internet based cooperation frequently involves people from a variety of cultures it was decided to choose a metaphor that people from most countries would be able to understand. The maritime navigational metaphor fulfils this requirement as the basic concept is familiar to people from a variety of cultures and backgrounds.
The Glocoopex value provides an overall indication as to the level of activities within the group. We have chosen a beach flag as the metaphor to represent Glocoopex. Beach flags make use of a colour code to indicate whether it is safe to swim, they are clear, easy to understand and always present. The design of such a flag appears to lend itself to representing global information such as Glocoopex, as the intention is that such information should always be present and should be easy to understand.
WIA cannot be rendered by a unique graphical element. Any monitored entity must be associated with a specific representation. In the marine context, beacons show where dangerous places are located. They are mentally associated with specific information (e.g. location of a specific wreck). Beacons seem therefore appropriate to visualize the individual activities. In our design one beacon corresponds to one entity (e.g. a work sub-group or individual). The beacons use colour to convey information such as the level of activity and online status of a particular entity.
An Ambient Workplace for Raising Awareness of Internet-Based Cooperation 279
4 Use Case
The Ambient Workplace is being developed for and tested on a large European Union funded Network of Excellence (NoE). A NoE is essentially a group of research, academic and commercial organizations that join together to form a virtual-research community. A NoE is an ideal case study as it consists of a wide range of organizations, in this case around thirteen and in turn a diverse group of participants, such as professors, research assistants, students, administrators and technical staff. The main outputs are reports, academic papers and other printed or online materials, the members also meet regularly.
The NoE discussed here also trains new scientists in the field, this is achieved by arranging a number of PhD schools. These are organized on a regular basis throughout the lifetime of the NoE. Moreover, the NoE has a website that aims to bring people together and encourage communication and the creation of ideas. It is this website which forms the basis of the development of the AW and an ongoing study.
The NoE website contains a number of key features, such as the ability for people to submit information or files, a news page as well as a mailing list. Despite the range of features, the website and mailing list do not appear to be acting as a catalyst for new ideas or discussion. As a result there is a study being conducted into the nature of the interactions which people undertake, as well as with whom they undertake them with. Although the study is ongoing, anecdotal evidence would suggest there is a need to develop new tools or technologies that support interaction. It is this need to increase the level of interaction which has driven the development of the Ambient Workplace.
A database is used to store information about the range of participants, interactions and values for the Glocoopex, N-Coopidex and Coopadex. Information about the interactions consists of whether they are mandatory or optional and active or passive. The system outlined later makes use of the information in the database to generate the visualisation.
5 Ambient Workplace Prototype
5.1 Features
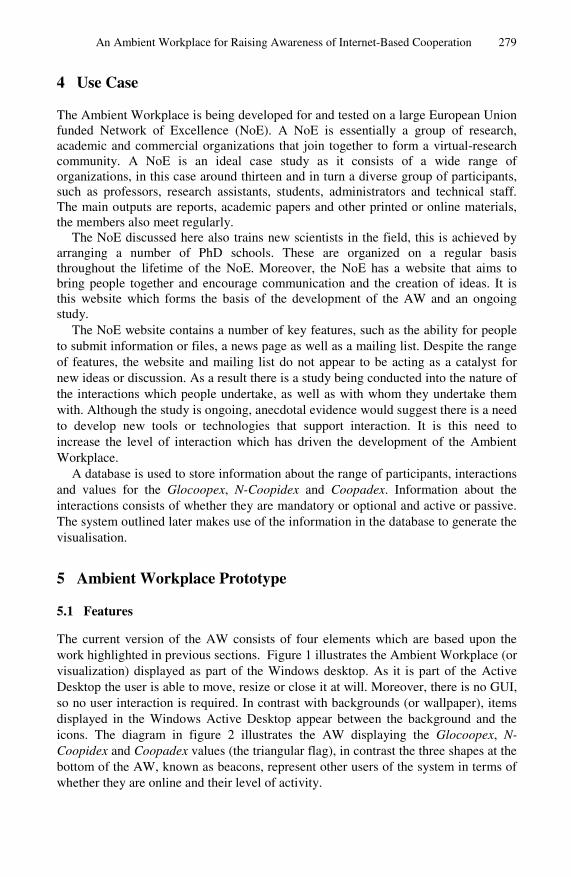
The current version of the AW consists of four elements which are based upon the work highlighted in previous sections. Figure 1 illustrates the Ambient Workplace (or visualization) displayed as part of the Windows desktop. As it is part of the Active Desktop the user is able to move, resize or close it at will. Moreover, there is no GUI, so no user interaction is required. In contrast with backgrounds (or wallpaper), items displayed in the Windows Active Desktop appear between the background and the icons. The diagram in figure 2 illustrates the AW displaying the Glocoopex, N-Coopidex and Coopadex values (the triangular flag), in contrast the three shapes at the bottom of the AW, known as beacons, represent other users of the system in terms of whether they are online and their level of activity.
280 B. Otjacques, R. McCall, and F. Feltz
Fig. 1. A screenshot illustrating the Ambient Workplace (lower left), the GAIM client is pictured in the top right
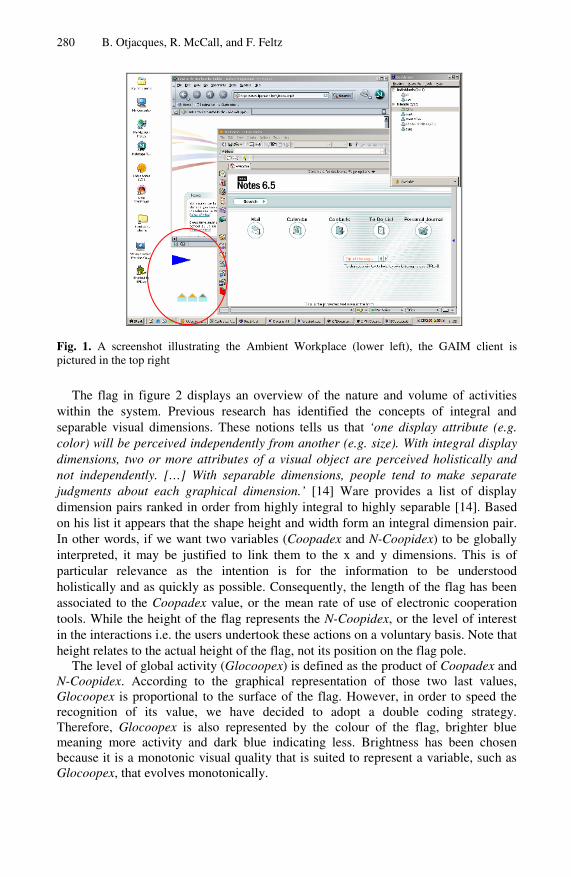
The flag in figure 2 displays an overview of the nature and volume of activities within the system. Previous research has identified the concepts of integral and separable visual dimensions. These notions tells us that ‘one display attribute (e.g. color) will be perceived independently from another (e.g. size). With integral display dimensions, two or more attributes of a visual object are perceived holistically and not independently. […] With separable dimensions, people tend to make separate judgments about each graphical dimension.’ [14] Ware provides a list of display dimension pairs ranked in order from highly integral to highly separable [14]. Based on his list it appears that the shape height and width form an integral dimension pair. In other words, if we want two variables (Coopadex and N-Coopidex) to be globally interpreted, it may be justified to link them to the x and y dimensions. This is of particular relevance as the intention is for the information to be understood holistically and as quickly as possible. Consequently, the length of the flag has been associated to the Coopadex value, or the mean rate of use of electronic cooperation tools. While the height of the flag represents the N-Coopidex, or the level of interest in the interactions i.e. the users undertook these actions on a voluntary basis. Note that height relates to the actual height of the flag, not its position on the flag pole.
The level of global activity (Glocoopex) is defined as the product of Coopadex and N-Coopidex. According to the graphical representation of those two last values, Glocoopex is proportional to the surface of the flag. However, in order to speed the recognition of its value, we have decided to adopt a double coding strategy. Therefore, Glocoopex is also represented by the colour of the flag, brighter blue meaning more activity and dark blue indicating less. Brightness has been chosen because it is a monotonic visual quality that is suited to represent a variable, such as Glocoopex, that evolves monotonically.
An Ambient Workplace for Raising Awareness of Internet-Based Cooperation 281
Fig. 2. A picture of the Ambient Workplace. From the top left, the Glocopex flag, the three beacons illustrating entities using the system.
The dimensions of the flag are calculated using means based on a 14-day time period (although it has also been tested using a 7-day period). Hence rather than using absolute values the flag is rendered relative to these mean values, this results in there always being some base point with which the flag be can related to. In order to prevent the graphics becoming too large, or the colours going beyond the range available certain limits are placed on the maximum and minimum values.
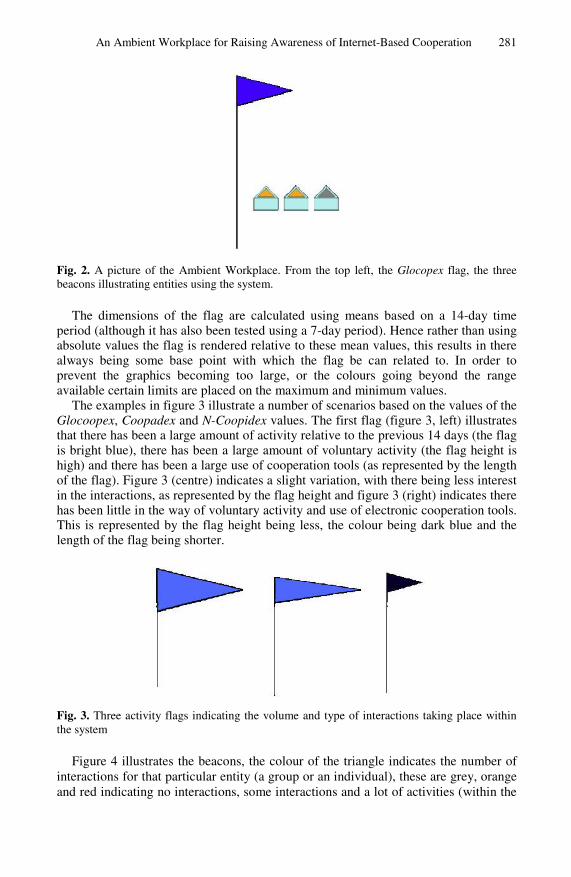
The examples in figure 3 illustrate a number of scenarios based on the values of the Glocoopex, Coopadex and N-Coopidex values. The first flag (figure 3, left) illustrates that there has been a large amount of activity relative to the previous 14 days (the flag is bright blue), there has been a large amount of voluntary activity (the flag height is high) and there has been a large use of cooperation tools (as represented by the length of the flag). Figure 3 (centre) indicates a slight variation, with there being less interest in the interactions, as represented by the flag height and figure 3 (right) indicates there has been little in the way of voluntary activity and use of electronic cooperation tools. This is represented by the flag height being less, the colour being dark blue and the length of the flag being shorter.
Fig. 3. Three activity flags indicating the volume and type of interactions taking place within the system
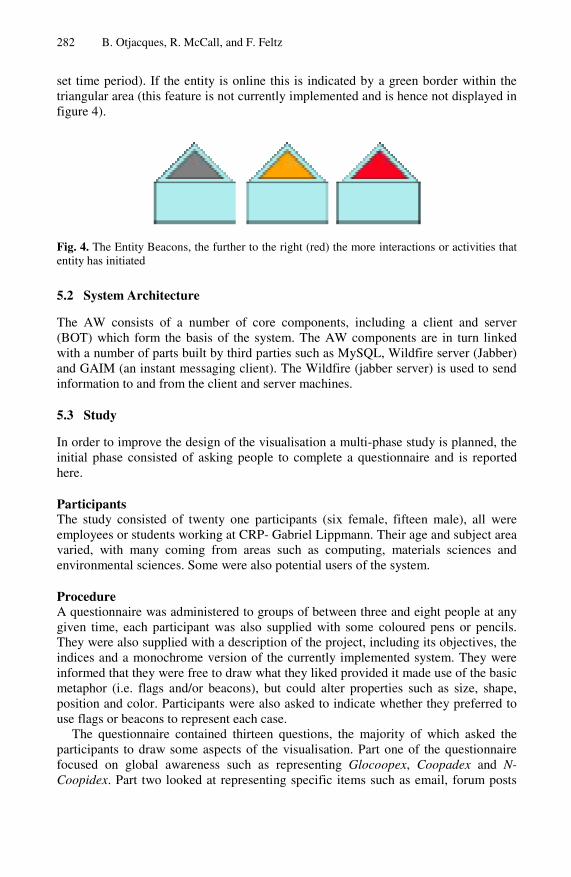
Figure 4 illustrates the beacons, the colour of the triangle indicates the number of interactions for that particular entity (a group or an individual), these are grey, orange and red indicating no interactions, some interactions and a lot of activities (within the
282 B. Otjacques, R. McCall, and F. Feltz
set time period). If the entity is online this is indicated by a green border within the triangular area (this feature is not currently implemented and is hence not displayed in figure 4).
Fig. 4. The Entity Beacons, the further to the right (red) the more interactions or activities that entity has initiated
5.2 System Architecture
The AW consists of a number of core components, including a client and server (BOT) which form the basis of the system. The AW components are in turn linked with a number of parts built by third parties such as MySQL, Wildfire server (Jabber) and GAIM (an instant messaging client). The Wildfire (jabber server) is used to send information to and from the client and server machines.
5.3 Study
In order to improve the design of the visualisation a multi-phase study is planned, the initial phase consisted of asking people to complete a questionnaire and is reported here.
Participants The study consisted of twenty one participants (six female, fifteen male), all were employees or students working at CRP- Gabriel Lippmann. Their age and subject area varied, with many coming from areas such as computing, materials sciences and environmental sciences. Some were also potential users of the system.
Procedure A questionnaire was administered to groups of between three and eight people at any given time, each participant was also supplied with some coloured pens or pencils. They were also supplied with a description of the project, including its objectives, the indices and a monochrome version of the currently implemented system. They were informed that they were free to draw what they liked provided it made use of the basic metaphor (i.e. flags and/or beacons), but could alter properties such as size, shape, position and color. Participants were also asked to indicate whether they preferred to use flags or beacons to represent each case.
The questionnaire contained thirteen questions, the majority of which asked the participants to draw some aspects of the visualisation. Part one of the questionnaire focused on global awareness such as representing Glocoopex, Coopadex and N-Coopidex. Part two looked at representing specific items such as email, forum posts
An Ambient Workplace for Raising Awareness of Internet-Based Cooperation 283
and news articles. Part three looked at representing users and their interactions. The final section drew all this together by asking the participants to draw a complete visualization, they were free to base this on the previous representations or draw something completely new. This step by step approach was adopted so that participants would become familiar with representing the various concepts prior to drawing an entire visualization. It also permits us to provide subjects in later parts of the study with many more design options.
Results In this section we will focus on the results which directly relate to the aspects of the prototype visualization illustrated earlier (see figures 1 and 2). In particular the preferences people had for visualizing the indices and user presence. It should be noted that this part of the study is not intended to provide any decisions; rather it is to obtain series of design options which can then be provided to the focus group(s) who will be asked to provide a series of designs. In the following discussion f=number who chose flags b=number who chose beacons.
When asked to draw flags or beacons representing the indices the results were mixed. For example, when asked to draw individual flags the participants indicated a preference for having a flag which represented all three values (f=10 b=4). This would appear to back up our earlier design decision, however when asked to draw a complete visualization they preferred a flag which contained the Glocoopex value (f=8 b=3). However in both cases the number of responses is less than half the total number of participants.
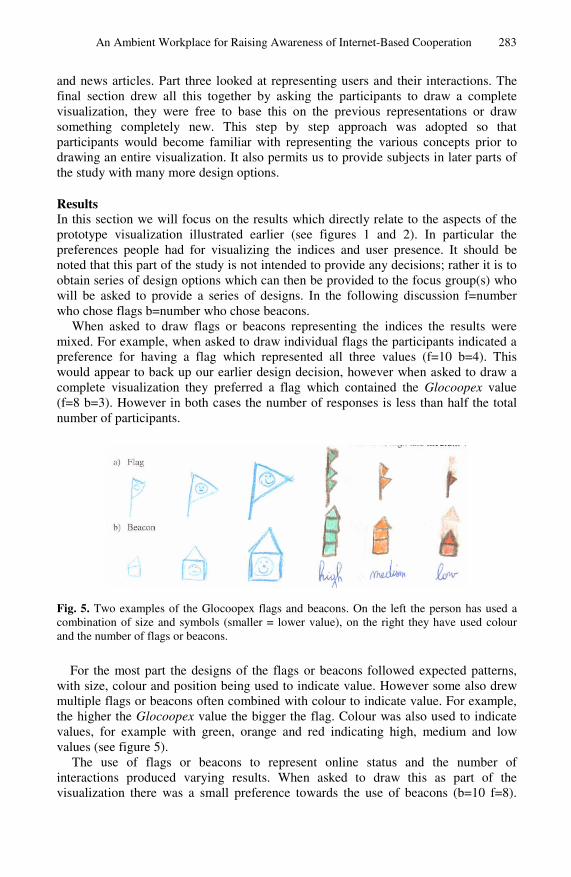
Fig. 5. Two examples of the Glocoopex flags and beacons. On the left the person has used a combination of size and symbols (smaller = lower value), on the right they have used colour and the number of flags or beacons.
For the most part the designs of the flags or beacons followed expected patterns, with size, colour and position being used to indicate value. However some also drew multiple flags or beacons often combined with colour to indicate value. For example, the higher the Glocoopex value the bigger the flag. Colour was also used to indicate values, for example with green, orange and red indicating high, medium and low values (see figure 5).
The use of flags or beacons to represent online status and the number of interactions produced varying results. When asked to draw this as part of the visualization there was a small preference towards the use of beacons (b=10 f=8).
284 B. Otjacques, R. McCall, and F. Feltz
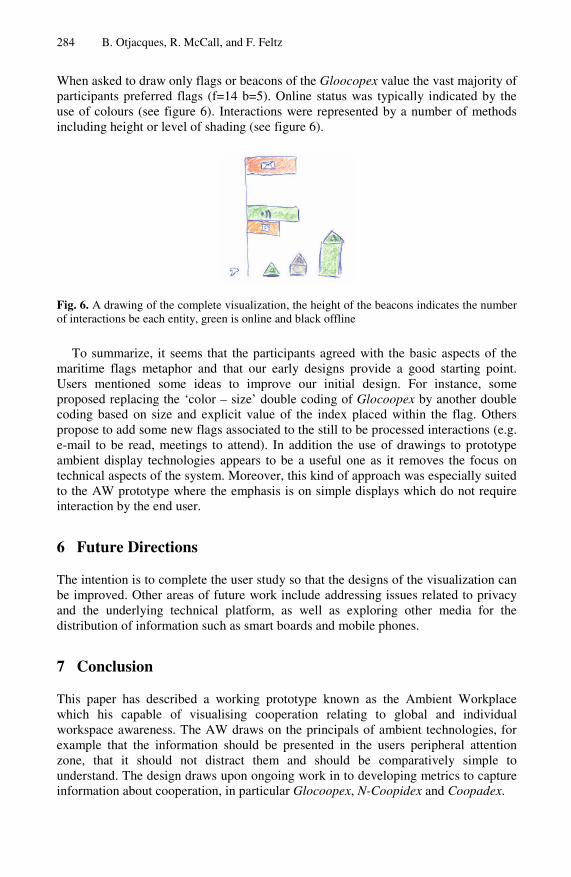
When asked to draw only flags or beacons of the Gloocopex value the vast majority of participants preferred flags (f=14 b=5). Online status was typically indicated by the use of colours (see figure 6). Interactions were represented by a number of methods including height or level of shading (see figure 6).
Fig. 6. A drawing of the complete visualization, the height of the beacons indicates the number of interactions be each entity, green is online and black offline
To summarize, it seems that the participants agreed with the basic aspects of the maritime flags metaphor and that our early designs provide a good starting point. Users mentioned some ideas to improve our initial design. For instance, some proposed replacing the ‘color – size’ double coding of Glocoopex by another double coding based on size and explicit value of the index placed within the flag. Others propose to add some new flags associated to the still to be processed interactions (e.g. e-mail to be read, meetings to attend). In addition the use of drawings to prototype ambient display technologies appears to be a useful one as it removes the focus on technical aspects of the system. Moreover, this kind of approach was especially suited to the AW prototype where the emphasis is on simple displays which do not require interaction by the end user.
6 Future Directions
The intention is to complete the user study so that the designs of the visualization can be improved. Other areas of future work include addressing issues related to privacy and the underlying technical platform, as well as exploring other media for the distribution of information such as smart boards and mobile phones.
7 Conclusion
This paper has described a working prototype known as the Ambient Workplace which his capable of visualising cooperation relating to global and individual workspace awareness. The AW draws on the principals of ambient technologies, for example that the information should be presented in the users peripheral attention zone, that it should not distract them and should be comparatively simple to understand. The design draws upon ongoing work in to developing metrics to capture information about cooperation, in particular Glocoopex, N-Coopidex and Coopadex.
An Ambient Workplace for Raising Awareness of Internet-Based Cooperation 285
Although the Ambient Workplace is in the early stages of development it is currently in a usable form. Also it makes use of lightweight and several pre-exiting technologies, therefore making it easy to improve or display on other platforms such as smart boards.
Acknowledgements
The research conducted in this paper was funded by a grant from the Fonds National de la Recherche (FNR), Luxembourg. We also acknowledge the assistance of those involved in the NoE and other members of staff at CRP- Gabriel Lippmann.
References
1. Bardram, J.E. and Hansen T.R. The AWARE Architecture: Supporting Context-Mediated Social Awareness in Mobile Cooperation. In Proceeding of the ACM Conference on Computer-Supported Cooperative Work (CSCW’04) (Chicago, Illinois, November 6-10, 2004). 192-201.
2. Donath, J., Karahalios, K., and Viegas, F., Visualizing Conversation. In Proceedings of 32th Hawaï International Conference on System Sciences (HICSS-32), (Maui, Hawaii, January 5-8, 1999).
3. Dourish, P. and Belloti, V. Awareness and coordination in shared workspaces. In Proceedings of the ACM Conference on Computer-Supported Cooperative Work (CSCW’92) (Toronto, Canada, October 31 - November 4, 1992). 107-114.
4. Ellis, C. Keepers, Synchronizers, Communicators and Agents. In ACM SIGOIS Bulletin, April 1995, Vol. 15, N° 3, 10-14. Special issue: workshop write-ups and positions papers from CSCW'94.
5. Gaim Instant Messaging Software, http://gaim.sourceforge.net/, accessed 24 March 2006. 6. Greenberg, S., Gutwin, C., and Cockburn, A. Awareness Through Fisheye Views in
Relaxed-WYSIWIS Groupware. In Proceedings of the Graphics Interface 1996 Conference (Toronto, Canada, May 22-24, 1996).
7. Gutwin, C. and Greenberg, S. The effects of Workspace Awareness Support on the Usability of Real-Time Distributed Groupware. ACM Transactions on Computer-Human Interaction, Vol. 6, N° 3, September 1999, 243-281.
8. Heath, C. and Luff, P. Collaborative activity and technological design: task coordination in London Underground control rooms. In L. Bannon, M. Robinson and K. Schmidt (eds.) Proceedings of the 2nd European Conference on Computer-Supported Cooperative Work (ECSCW’91) (Amsterdam, The Netherlands, September 24-27, 1991). 65-80.
9. Humphries, W. D., Neale, D., and McCrickard D. S. Laboratory Simulation Methods for Studying Complex Collaborative Tasks. In Proceedings of the 48th Annual Meeting of the Human Factors and Ergonomics Society (HFES’05) (New Orleans, Louisiana, September 20-24, 2004). 2451-2455.
10. Otjacques, B., Noirhomme M., Figueiredo, J., and Feltz, F. (2006), Composite Indexes as Metrics of Cooperative Activity. In 11ème Conférence de l’Association Information & Management (AIM 2006), (11th French-speaking Conference on Management of Information Systems) (Luxembourg, June 7-9, 2006).
286 B. Otjacques, R. McCall, and F. Feltz
11. The Palace User Software Guide for Windows, version 3.5, http://www.palacechat.us/ documentation.php, accessed 24 March 2005.
12. Pinho, M.S., Bowman, D.A., and Freitas C.M.D.S. Cooperative Object Manipulation in Immersive Virtual Environments: Framework and Techniques. In Proceedings of the ACM symposium on Virtual Reality Software and Technology (VRST’02). (Hong Kong, China, November 11-13, 2002). 171-178.
13. Robinson, M., Pekkola, S., Korhonen, J., Hujula, S., Toivonen, T. and Saarinen M.-J. O. Extending the Limits of Collaborative Virtual Environments, in Churchill, E.F., Snowdon D. N. and Munro A. J. (eds): Collaborative Virtual Environments, London, UK, Springer, 2001.
14. Ware, C. Information Visualization, Perception for Design. Morgan Kaufman Publishers, 2004, 176-183.