Embed Size (px)
Citation preview
1
1
LNAPL Training Part 2:
LNAPL Characterization and Recoverability – Improved Analysis
Welcome – Thanks for joining us.ITRC’s Internet-based Training Program
Do you know where the LNAPL is and can you recover it?
Sponsored by: Interstate Technology and Regulatory Council (www.itrcweb.org) Hosted by: US EPA Clean Up Information Network (www.cluin.org)
Light non-aqueous phase liquids (LNAPLs) are organic liquids such as gasoline, diesel, and other petroleum hydrocarbon products that are immiscible with water and less dense than water. LNAPLs are important because they are present in the subsurface at thousands of remediation sites across the country, and are frequently the focus of assessment and remediation efforts. A sound LNAPL understanding is necessary to effectively characterize and assess LNAPL conditions and potential risks, as well as to evaluate potential remedial technologies or alternatives. Unfortunately, many environmental professionals have a faulty understanding of LNAPL conditions based on outdated paradigms. The ITRC LNAPLs Team is providing Internet-based training to improve the general understanding of LNAPLs. Better understanding leads to better decision making. Additionally, this training provides a necessary technical foundation to foster effective use of the forthcoming ITRC LNAPLs Team Technical Regulatory Guidance Document: Evaluating LNAPL Remedial Technologies for Achieving Project Goals (to be published in 2009). This training course is relevant for new and veteran regulators, environmental consultants, and technically-inclined site owners and public stakeholders. The training course is divided into two parts: LNAPL Training Part 1: An Improved Understanding of LNAPL Behavior in the Subsurface - State of Science vs. State of Practice - Part 1 explains how LNAPLs behave in the subsurface and examines what controls their behavior. Part 1 also explains what LNAPL data can tell you about the LNAPL and site conditions. Relevant and practical examples are used to illustrate key concepts. LNAPL Training Part 2: LNAPL Characterization and Recoverability – Improved Analysis - Do you know where the LNAPL is and can you recover it? Part 2 addresses LNAPL characterization and site conceptual model development as well as LNAPL recovery evaluation and remedial considerations. Specifically, Part 2 discusses key LNAPL and site data, when and why those data may be important, and how to get those data. Part 2 also discusses how to evaluate LNAPL recoverability.LNAPL Training Part 3: Evaluating LNAPL Remedial Technologies for Achieving Project Goals - uses the LNAPL conceptual site model (LCSM) approach to identify the LNAPL concerns or risks and set proper LNAPL remedial objectives and technology-specific remediation goals and performance metrics. The training course also provides an overview of the LNAPL remedial technology selection framework. The framework uses a series of tools to screen the seventeen remedial technologies based on site and LNAPL conditions and other important factors.
ITRC (Interstate Technology and Regulatory Council) www.itrcweb.orgTraining Co-Sponsored by: US EPA Technology Innovation and Field Services Division (TIFSD) (www.clu-in.org) ITRC Training Program: [email protected]; Phone: 402-201-2419
2
2
Housekeeping
Course time is 2¼ hoursQuestion & Answer breaks• Phone - unmute *6 to ask
question out loud• Simulcast - ? icon at top to
type in a questionTurn off any pop-up blockers
Move through slides• Arrow icons at top of screen• List of slides on left
Feedback form available from last slide – please complete before leavingThis event is being recorded
Go to slide 1
Move back 1 slide
Download slides as PPT or PDF
Move forward 1 slide
Go to seminar
homepage
Submit comment or question
Report technical problems
Go to last slide
Copyright 2013 Interstate Technology & Regulatory Council, 50 F Street, NW, Suite 350, Washington, DC 20001
Although I’m sure that some of you are familiar with these rules from previous CLU-IN events, let’s run through them quickly for our new participants.
We have started the seminar with all phone lines muted to prevent background noise. Please keep your phone lines muted during the seminar to minimize disruption and background noise. During the question and answer break, press *6 to unmute your lines to ask a question (note: *6 to mute again). Also, please do NOT put this call on hold as this may bring unwanted background music over the lines and interrupt the seminar.
You should note that throughout the seminar, we will ask for your feedback. You do not need to wait for Q&A breaks to ask questions or provide comments using the ? icon. To submit comments/questions and report technical problems, please use the ? icon at the top of your screen. You can move forward/backward in the slides by using the single arrow buttons (left moves back 1 slide, right moves advances 1 slide). The double arrowed buttons will take you to 1st and last slides respectively. You may also advance to any slide using the numbered links that appear on the left side of your screen. The button with a house icon will take you back to main seminar page which displays our presentation overview, instructor bios, links to the slides and additional resources. Lastly, the button with a computer disc can be used to download and save today’s presentation slides.
3
3
ITRC Disclaimer
This material was sponsored by an agency of the United States Government. The views and opinions of authors expressed herein do not necessarily state or reflect those of the United States Government or any agency thereof and no official endorsement should be inferred.The information in ITRC Products was formulated to be reliable and accurate. However, the information is provided "as is" and use of this information is at the users’ own risk. Information in ITRC Products is for general reference only; it should not be construed as definitive guidance for any specific site and is not a substitute for consultation with qualified professional advisors.ITRC Product content may be revised or withdrawn at any time without prior notice.ITRC, ERIS, and ECOS make no representations or warranties with respect to information in its Products. ITRC, ERIS, and ECOS will not accept liability for damages of any kind that result from acting upon or using this information. ITRC, ERIS, and ECOS do not endorse or recommend the use of specific technology or technology provider through ITRC Products.
This material was prepared as an account of work sponsored by an agency of the United States Government. Neither the United States Government nor any agency thereof, nor any of their employees, makes any warranty, express or implied, or assumes any legal liability or responsibility for the accuracy, completeness, or usefulness of any information, apparatus, product, or process disclosed, or represents that its use would not infringe privately owned rights. Reference herein to any specific commercial product, process, or service by trade name, trademark, manufacturer, or otherwise does not necessarily constitute or imply its endorsement, recommendation, or favoring by the United States Government or any agency thereof. The views and opinions of authors expressed herein do not necessarily state or reflect those of the United States Government or any agency thereof and no official endorsement should be inferred.The information provided in documents, training curricula, and other print or electronic materials created by the Interstate Technology and Regulatory Council (“ITRC” and such materials are referred to as “ITRC Materials”) is intended as a general reference to help regulators and others develop a consistent approach to their evaluation, regulatory approval, and deployment of environmental technologies. The information in ITRC Materials was formulated to be reliable and accurate. However, the information is provided "as is" and use of this information is at the users’ own risk. ITRC Materials do not necessarily address all applicable health and safety risks and precautions with respect to particular materials, conditions, or procedures in specific applications of any technology. Consequently, ITRC recommends consulting applicable standards, laws, regulations, suppliers of materials, and material safety data sheets for information concerning safety and health risks and precautions and compliance with then-applicable laws and regulations. ITRC, ERIS and ECOS shall not be liable in the event of any conflict between information in ITRC Materials and such laws, regulations, and/or other ordinances. The content in ITRC Materials may be revised or withdrawn at any time without prior notice.ITRC, ERIS, and ECOS make no representations or warranties, express or implied, with respect to information in ITRC Materials and specifically disclaim all warranties to the fullest extent permitted by law (including, but not limited to, merchantability or fitness for a particular purpose). ITRC, ERIS, and ECOS will not accept liability for damages of any kind that result from acting upon or using this information.ITRC, ERIS, and ECOS do not endorse or recommend the use of specific technology or technology provider through ITRC Materials. Reference to technologies, products, or services offered by other parties does not constitute a guarantee by ITRC, ERIS, and ECOS of the quality or value of those technologies, products, or services. Information in ITRC Materials is for general reference only; it should not be construed as definitive guidance for any specific site and is not a substitute for consultation with qualified professional advisors.
4
4 ITRC (www.itrcweb.org) – Shaping the Future of Regulatory Acceptance
Host organizationNetwork• State regulators
All 50 states, PR, DC• Federal partners
• ITRC Industry Affiliates Program
• Academia• Community stakeholders
Wide variety of topics• Technologies• Approaches• Contaminants• Sites
Products• Technical and regulatory
guidance documents• Internet-based and
classroom training
DOE DOD EPA
The Interstate Technology and Regulatory Council (ITRC) is a state-led coalition of regulators, industry experts, citizen stakeholders, academia and federal partners that work to achieve regulatory acceptance of environmental technologies and innovative approaches. ITRC consists of all 50 states (and Puerto Rico and the District of Columbia) that work to break down barriers and reduce compliance costs, making it easier to use new technologies and helping states maximize resources. ITRC brings together a diverse mix of environmental experts and stakeholders from both the public and private sectors to broaden and deepen technical knowledge and advance the regulatory acceptance of environmental technologies. Together, we’re building the environmental community’s ability to expedite quality decision making while protecting human health and the environment. With our network of organizations and individuals throughout the environmental community, ITRC is a unique catalyst for dialogue between regulators and the regulated community.For a state to be a member of ITRC their environmental agency must designate a State Point of Contact. To find out who your State POC is check out the “contacts” section at www.itrcweb.org. Also, click on “membership” to learn how you can become a member of an ITRC Technical Team.

55
5ITRC Course Topics Planned for 2013 –More information at www.itrcweb.org
Decision Framework for Applying Attenuation Processes to Metals and RadionuclidesDevelopment of Performance Specifications for Solidification/StabilizationGreen and Sustainable RemediationIntegrated DNAPL Site Strategy LNAPL 1: An Improved Understanding of LNAPL Behavior in the Subsurface LNAPL 2: LNAPL Characterization and Recoverability - Improved AnalysisLNAPL 3: Evaluating LNAPL Remedial Technologies for Achieving Project GoalsMine Waste Treatment Technology SelectionProject Risk Management for Site RemediationUse and Measurement of Mass Flux and Mass DischargeUse of Risk Assessment in Management of Contaminated SitesSoil Sampling and Decision Making Using Incremental Sampling Methodology (2 parts)Bioavailability Considerations for Contaminated Sediment SitesBiofuels: Release Prevention, Environmental Behavior, and Remediation
New in 2013Popular courses from 2012Environmental Molecular DiagnosticsBiochemical Reactors for Mining-Influenced Water Groundwater Statistics and Monitoring Compliance
2-Day Classroom Training on Light Nonaqueous-Phase
Liquids (LNAPLs)April 9-10 in King of Prussia, PAJune 4-5 in Springfield, IL(tentative) October in Southern CA
More details and schedules are available from www.itrcweb.org.
6
6
Meet the ITRC Trainers
Derek W. Tomlinson, PE, PEng, LSRPGeosyntec Consultants, Inc.Blue Bell, PA267-464-2800 [email protected]
Pamela S. Trowbridge, P.G.Pennsylvania Department of Environmental ProtectionHarrisburg, [email protected]
Steven Ueland, P.E.Langan Engineering & Environmental ServicesDoylestown, [email protected]
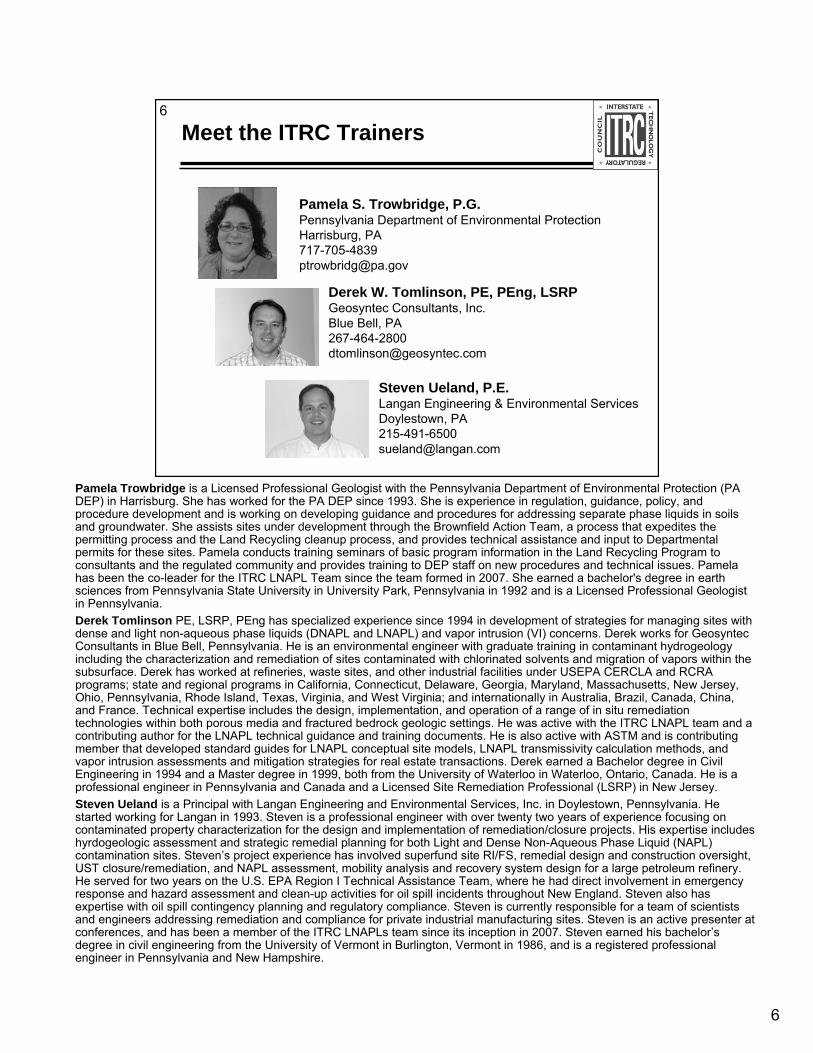
Pamela Trowbridge is a Licensed Professional Geologist with the Pennsylvania Department of Environmental Protection (PA DEP) in Harrisburg. She has worked for the PA DEP since 1993. She is experience in regulation, guidance, policy, and procedure development and is working on developing guidance and procedures for addressing separate phase liquids in soils and groundwater. She assists sites under development through the Brownfield Action Team, a process that expedites the permitting process and the Land Recycling cleanup process, and provides technical assistance and input to Departmental permits for these sites. Pamela conducts training seminars of basic program information in the Land Recycling Program to consultants and the regulated community and provides training to DEP staff on new procedures and technical issues. Pamela has been the co-leader for the ITRC LNAPL Team since the team formed in 2007. She earned a bachelor's degree in earth sciences from Pennsylvania State University in University Park, Pennsylvania in 1992 and is a Licensed Professional Geologist in Pennsylvania. Derek Tomlinson PE, LSRP, PEng has specialized experience since 1994 in development of strategies for managing sites with dense and light non-aqueous phase liquids (DNAPL and LNAPL) and vapor intrusion (VI) concerns. Derek works for Geosyntec Consultants in Blue Bell, Pennsylvania. He is an environmental engineer with graduate training in contaminant hydrogeology including the characterization and remediation of sites contaminated with chlorinated solvents and migration of vapors within the subsurface. Derek has worked at refineries, waste sites, and other industrial facilities under USEPA CERCLA and RCRA programs; state and regional programs in California, Connecticut, Delaware, Georgia, Maryland, Massachusetts, New Jersey, Ohio, Pennsylvania, Rhode Island, Texas, Virginia, and West Virginia; and internationally in Australia, Brazil, Canada, China, and France. Technical expertise includes the design, implementation, and operation of a range of in situ remediation technologies within both porous media and fractured bedrock geologic settings. He was active with the ITRC LNAPL team and a contributing author for the LNAPL technical guidance and training documents. He is also active with ASTM and is contributing member that developed standard guides for LNAPL conceptual site models, LNAPL transmissivity calculation methods, and vapor intrusion assessments and mitigation strategies for real estate transactions. Derek earned a Bachelor degree in Civil Engineering in 1994 and a Master degree in 1999, both from the University of Waterloo in Waterloo, Ontario, Canada. He is a professional engineer in Pennsylvania and Canada and a Licensed Site Remediation Professional (LSRP) in New Jersey. Steven Ueland is a Principal with Langan Engineering and Environmental Services, Inc. in Doylestown, Pennsylvania. He started working for Langan in 1993. Steven is a professional engineer with over twenty two years of experience focusing on contaminated property characterization for the design and implementation of remediation/closure projects. His expertise includeshyrdogeologic assessment and strategic remedial planning for both Light and Dense Non-Aqueous Phase Liquid (NAPL) contamination sites. Steven’s project experience has involved superfund site RI/FS, remedial design and construction oversight, UST closure/remediation, and NAPL assessment, mobility analysis and recovery system design for a large petroleum refinery. He served for two years on the U.S. EPA Region I Technical Assistance Team, where he had direct involvement in emergency response and hazard assessment and clean-up activities for oil spill incidents throughout New England. Steven also has expertise with oil spill contingency planning and regulatory compliance. Steven is currently responsible for a team of scientists and engineers addressing remediation and compliance for private industrial manufacturing sites. Steven is an active presenter atconferences, and has been a member of the ITRC LNAPLs team since its inception in 2007. Steven earned his bachelor’s degree in civil engineering from the University of Vermont in Burlington, Vermont in 1986, and is a registered professional engineer in Pennsylvania and New Hampshire.

7
7
LNAPL Training Part 2
Introduction and Part 1 summaryLNAPL conceptual site modelLNAPL site characterizationQ&AHydraulic recovery evaluation and limitsLNAPL management objectives and goalsIntroduction to LNAPL remedial technologiesQ&A
8
8
LNAPL Training Part 2
Introduction and Part 1 summaryLNAPL conceptual site modelLNAPL site characterizationQ&AHydraulic recovery evaluation and limitsLNAPL management objectives and goalsIntroduction to LNAPL remedial technologiesQ&A
999
9
Part 1 Summary of LNAPL Basics
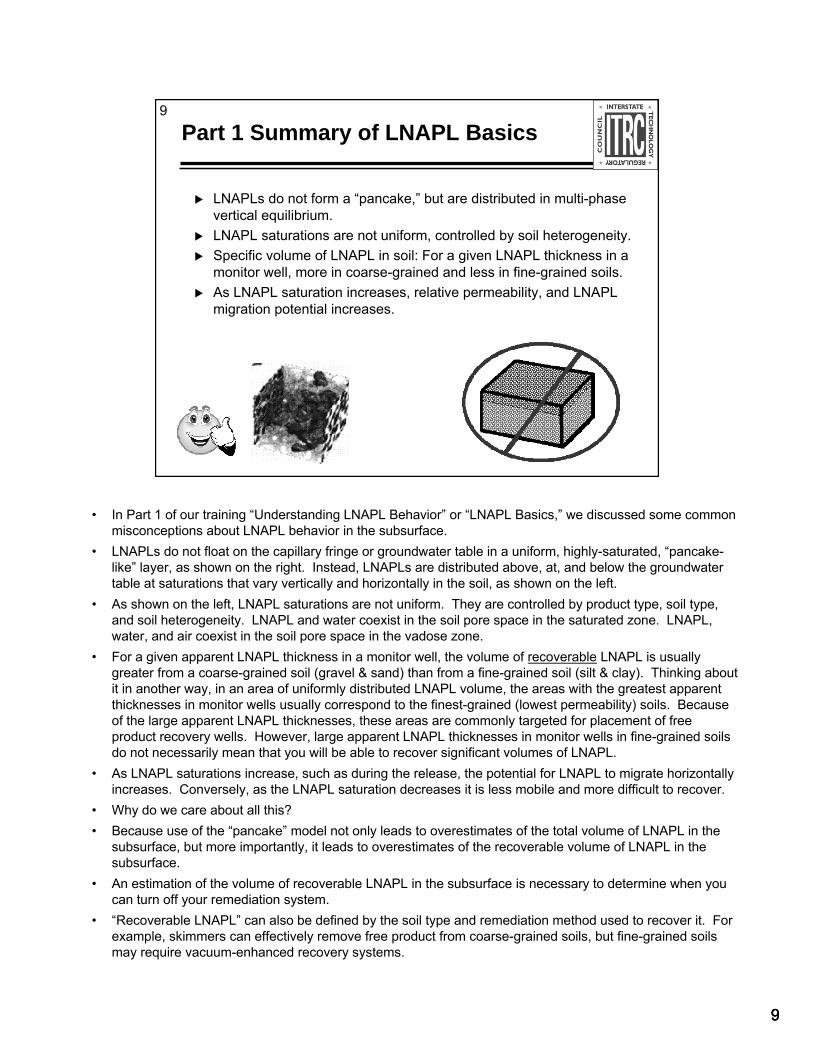
LNAPLs do not form a “pancake,” but are distributed in multi-phase vertical equilibrium.LNAPL saturations are not uniform, controlled by soil heterogeneity.Specific volume of LNAPL in soil: For a given LNAPL thickness in a monitor well, more in coarse-grained and less in fine-grained soils.As LNAPL saturation increases, relative permeability, and LNAPL migration potential increases.
• In Part 1 of our training “Understanding LNAPL Behavior” or “LNAPL Basics,” we discussed some common misconceptions about LNAPL behavior in the subsurface.
• LNAPLs do not float on the capillary fringe or groundwater table in a uniform, highly-saturated, “pancake-like” layer, as shown on the right. Instead, LNAPLs are distributed above, at, and below the groundwater table at saturations that vary vertically and horizontally in the soil, as shown on the left.
• As shown on the left, LNAPL saturations are not uniform. They are controlled by product type, soil type, and soil heterogeneity. LNAPL and water coexist in the soil pore space in the saturated zone. LNAPL, water, and air coexist in the soil pore space in the vadose zone.
• For a given apparent LNAPL thickness in a monitor well, the volume of recoverable LNAPL is usually greater from a coarse-grained soil (gravel & sand) than from a fine-grained soil (silt & clay). Thinking about it in another way, in an area of uniformly distributed LNAPL volume, the areas with the greatest apparent thicknesses in monitor wells usually correspond to the finest-grained (lowest permeability) soils. Because of the large apparent LNAPL thicknesses, these areas are commonly targeted for placement of free product recovery wells. However, large apparent LNAPL thicknesses in monitor wells in fine-grained soils do not necessarily mean that you will be able to recover significant volumes of LNAPL.
• As LNAPL saturations increase, such as during the release, the potential for LNAPL to migrate horizontally increases. Conversely, as the LNAPL saturation decreases it is less mobile and more difficult to recover.
• Why do we care about all this?• Because use of the “pancake” model not only leads to overestimates of the total volume of LNAPL in the
subsurface, but more importantly, it leads to overestimates of the recoverable volume of LNAPL in the subsurface.
• An estimation of the volume of recoverable LNAPL in the subsurface is necessary to determine when you can turn off your remediation system.
• “Recoverable LNAPL” can also be defined by the soil type and remediation method used to recover it. For example, skimmers can effectively remove free product from coarse-grained soils, but fine-grained soils may require vacuum-enhanced recovery systems.
101010
10 Part 1 Summary of LNAPL Basics (continued)
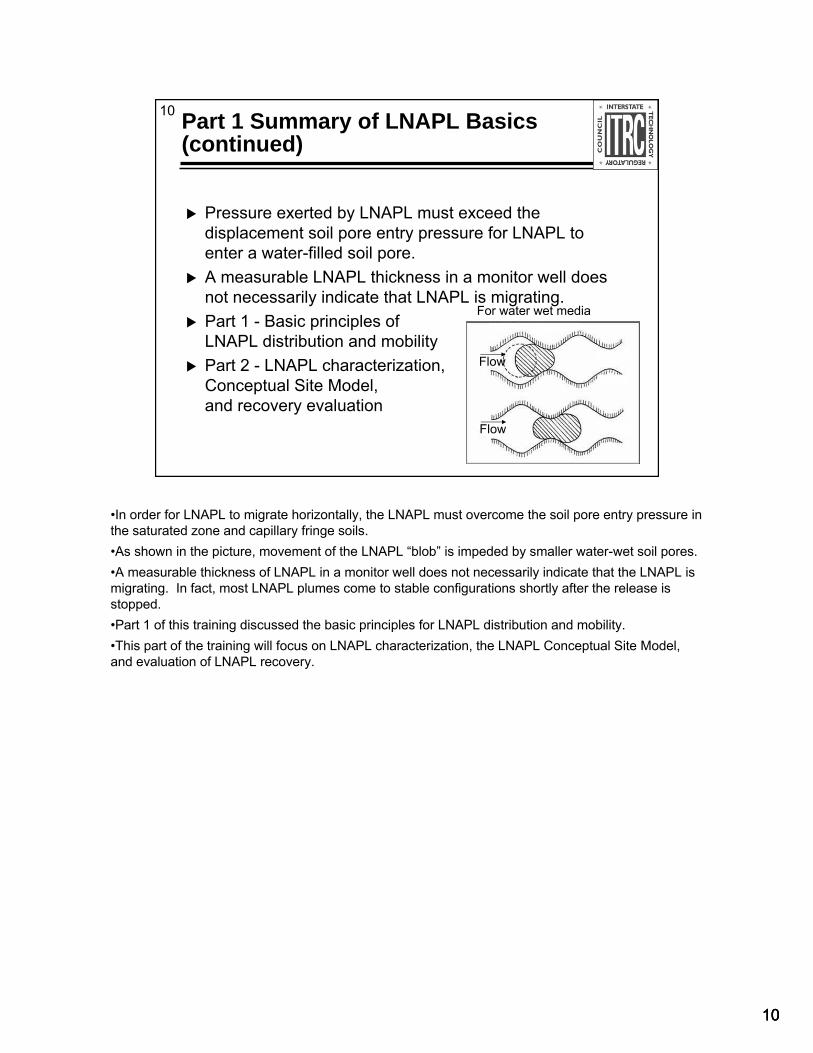
Pressure exerted by LNAPL must exceed the displacement soil pore entry pressure for LNAPL to enter a water-filled soil pore.A measurable LNAPL thickness in a monitor well does not necessarily indicate that LNAPL is migrating.Part 1 - Basic principles of LNAPL distribution and mobilityPart 2 - LNAPL characterization,Conceptual Site Model,and recovery evaluation
Flow
Flow
For water wet media
•In order for LNAPL to migrate horizontally, the LNAPL must overcome the soil pore entry pressure in the saturated zone and capillary fringe soils.•As shown in the picture, movement of the LNAPL “blob” is impeded by smaller water-wet soil pores.•A measurable thickness of LNAPL in a monitor well does not necessarily indicate that the LNAPL is migrating. In fact, most LNAPL plumes come to stable configurations shortly after the release is stopped.•Part 1 of this training discussed the basic principles for LNAPL distribution and mobility.•This part of the training will focus on LNAPL characterization, the LNAPL Conceptual Site Model, and evaluation of LNAPL recovery.

1111
11
Purpose of Today’s Training Event
Identify relevant LNAPL and site characterization data (what, how, why).Demonstrate use of Part 1 concepts in evaluating LNAPL recoverability.Discuss factors used to matchremedial objectives withLNAPL remedialtechnologies.
Better Understanding, Better Decisions
•The purpose of today’s training is to:•Discuss LNAPL site characterization.•Demonstrate how the concepts presented in the Part 1 training can be used to evaluate LNAPL recoverability.•Discuss matching remedial technologies with remedial goals.
12
12 Simplified Subsurface LNAPL Processes
Release Source
Vadose Zone
Capillary Fringe
Vapor Phase
Modified from Huntley and Beckett, 2002
DissolvedPhase
LNAPL
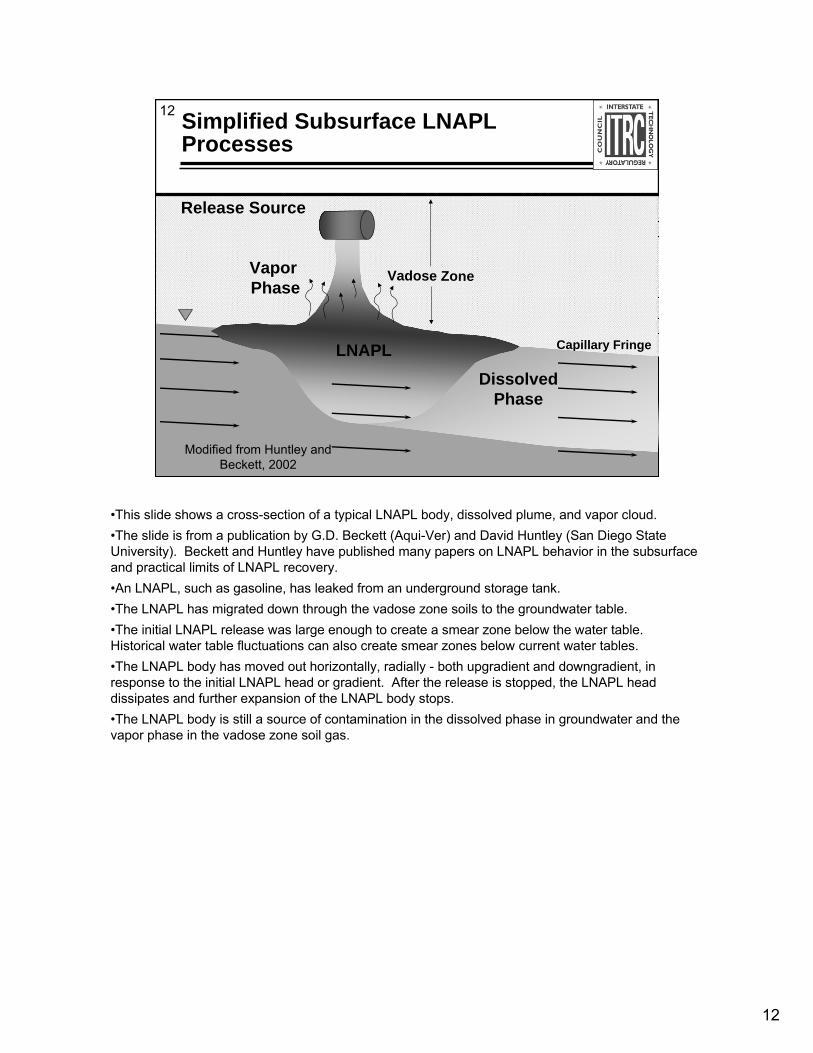
•This slide shows a cross-section of a typical LNAPL body, dissolved plume, and vapor cloud.•The slide is from a publication by G.D. Beckett (Aqui-Ver) and David Huntley (San Diego State University). Beckett and Huntley have published many papers on LNAPL behavior in the subsurface and practical limits of LNAPL recovery.•An LNAPL, such as gasoline, has leaked from an underground storage tank.•The LNAPL has migrated down through the vadose zone soils to the groundwater table.•The initial LNAPL release was large enough to create a smear zone below the water table. Historical water table fluctuations can also create smear zones below current water tables.•The LNAPL body has moved out horizontally, radially - both upgradient and downgradient, in response to the initial LNAPL head or gradient. After the release is stopped, the LNAPL head dissipates and further expansion of the LNAPL body stops.•The LNAPL body is still a source of contamination in the dissolved phase in groundwater and the vapor phase in the vadose zone soil gas.
1313
13 The Three Basic LNAPL Site Scenarios
Condition: LNAPL in wells, mobile
Driver: LNAPL saturation
Covered in this training
Condition: No LNAPL in wells Driver: LNAPL composition
Condition: LNAPL in wells, mobile, not migrating
Driver: LNAPL composition, saturation
LNAPL sat < residual
3
LNAPL sat > residual
2
LNAPL sat > residual
1
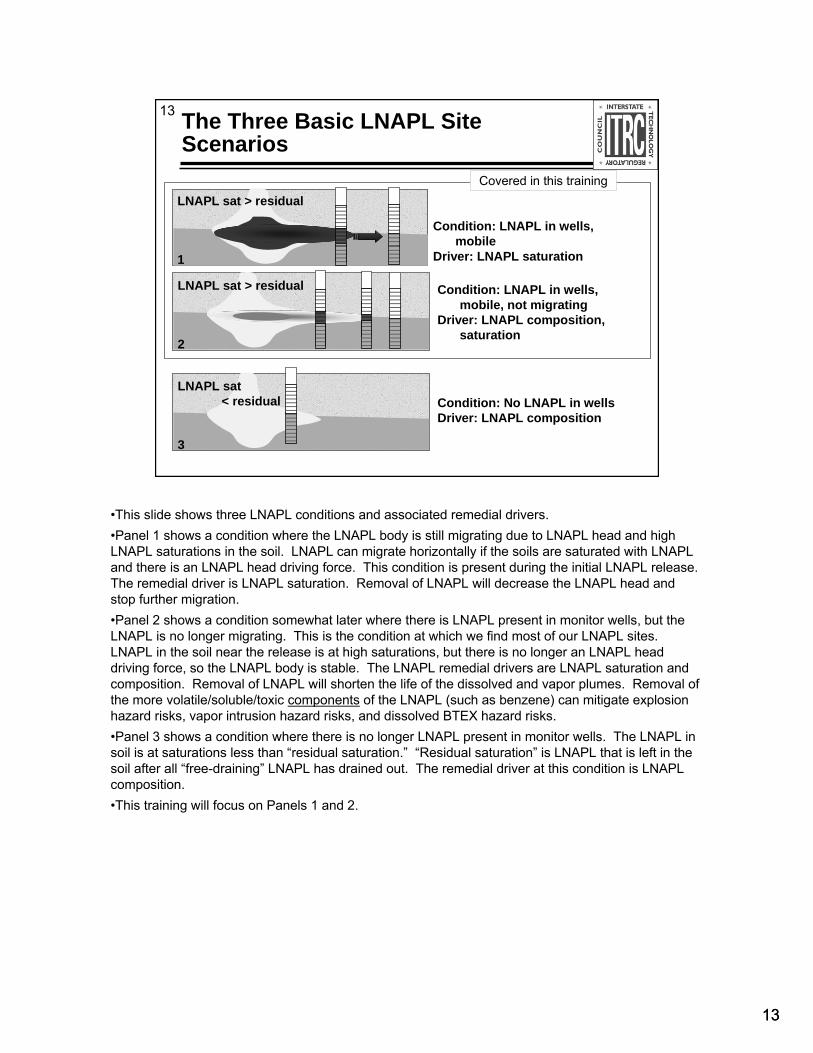
•This slide shows three LNAPL conditions and associated remedial drivers. •Panel 1 shows a condition where the LNAPL body is still migrating due to LNAPL head and high LNAPL saturations in the soil. LNAPL can migrate horizontally if the soils are saturated with LNAPL and there is an LNAPL head driving force. This condition is present during the initial LNAPL release. The remedial driver is LNAPL saturation. Removal of LNAPL will decrease the LNAPL head and stop further migration.•Panel 2 shows a condition somewhat later where there is LNAPL present in monitor wells, but the LNAPL is no longer migrating. This is the condition at which we find most of our LNAPL sites. LNAPL in the soil near the release is at high saturations, but there is no longer an LNAPL head driving force, so the LNAPL body is stable. The LNAPL remedial drivers are LNAPL saturation and composition. Removal of LNAPL will shorten the life of the dissolved and vapor plumes. Removal of the more volatile/soluble/toxic components of the LNAPL (such as benzene) can mitigate explosion hazard risks, vapor intrusion hazard risks, and dissolved BTEX hazard risks.•Panel 3 shows a condition where there is no longer LNAPL present in monitor wells. The LNAPL in soil is at saturations less than “residual saturation.” “Residual saturation” is LNAPL that is left in the soil after all “free-draining” LNAPL has drained out. The remedial driver at this condition is LNAPL composition.•This training will focus on Panels 1 and 2.
141414
14
LNAPL Concerns and Drivers
Explosive hazardsDissolved-phase concentrationVapor-phase concentrationDirect contact or ingestion
Mobility (spreads and creates new or increased risk)Visible aesthetics
LNAPL Concerns:
LNAPL Composition
LNAPL Saturation
LNAPL driver:
Regulatory driver: “recover to maximum extent practicable” – State’s interpretation?
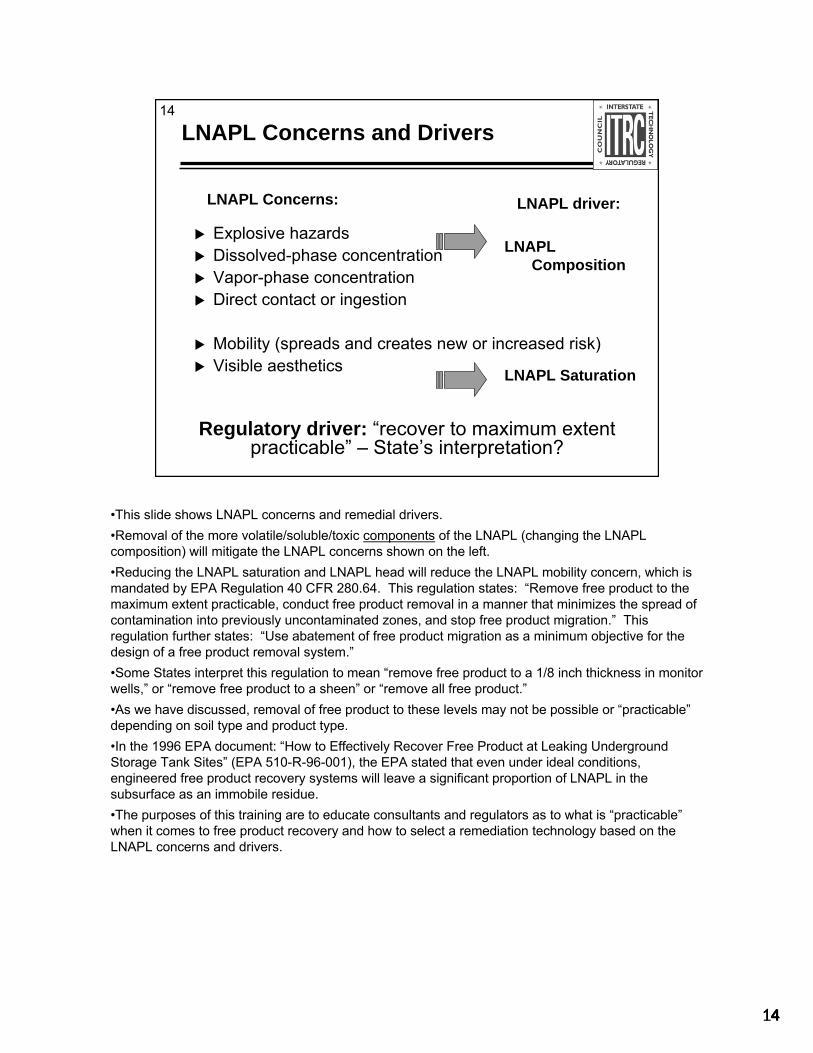
•This slide shows LNAPL concerns and remedial drivers.•Removal of the more volatile/soluble/toxic components of the LNAPL (changing the LNAPL composition) will mitigate the LNAPL concerns shown on the left.•Reducing the LNAPL saturation and LNAPL head will reduce the LNAPL mobility concern, which is mandated by EPA Regulation 40 CFR 280.64. This regulation states: “Remove free product to the maximum extent practicable, conduct free product removal in a manner that minimizes the spread of contamination into previously uncontaminated zones, and stop free product migration.” This regulation further states: “Use abatement of free product migration as a minimum objective for the design of a free product removal system.”•Some States interpret this regulation to mean “remove free product to a 1/8 inch thickness in monitor wells,” or “remove free product to a sheen” or “remove all free product.”•As we have discussed, removal of free product to these levels may not be possible or “practicable”depending on soil type and product type.•In the 1996 EPA document: “How to Effectively Recover Free Product at Leaking Underground Storage Tank Sites” (EPA 510-R-96-001), the EPA stated that even under ideal conditions, engineered free product recovery systems will leave a significant proportion of LNAPL in the subsurface as an immobile residue.•The purposes of this training are to educate consultants and regulators as to what is “practicable”when it comes to free product recovery and how to select a remediation technology based on the LNAPL concerns and drivers.
151515
15 LNAPL Understanding is an Iterative Process
LNAPL CharacterizationLNAPL compositionLNAPL saturationLNAPL location
LNAPL Conceptual Site Model
LNAPL ManagementMaximum extent practicable?Drivers: mobility and future riskRemedial objectives and end pointsRemedial action selection
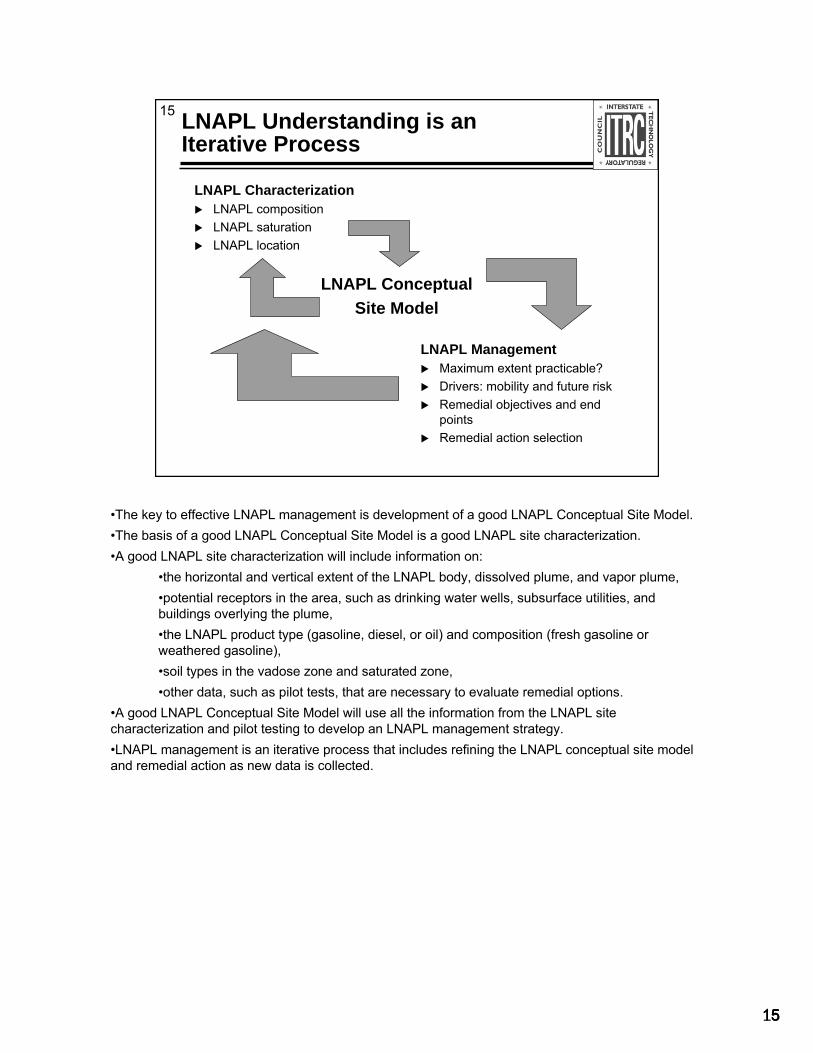
•The key to effective LNAPL management is development of a good LNAPL Conceptual Site Model.•The basis of a good LNAPL Conceptual Site Model is a good LNAPL site characterization.•A good LNAPL site characterization will include information on:
•the horizontal and vertical extent of the LNAPL body, dissolved plume, and vapor plume,•potential receptors in the area, such as drinking water wells, subsurface utilities, and buildings overlying the plume,•the LNAPL product type (gasoline, diesel, or oil) and composition (fresh gasoline or weathered gasoline),•soil types in the vadose zone and saturated zone,•other data, such as pilot tests, that are necessary to evaluate remedial options.
•A good LNAPL Conceptual Site Model will use all the information from the LNAPL site characterization and pilot testing to develop an LNAPL management strategy.•LNAPL management is an iterative process that includes refining the LNAPL conceptual site model and remedial action as new data is collected.
16
16
LNAPL Training Part 2
Introduction and Part 1 summaryLNAPL conceptual site modelLNAPL site characterizationQ&AHydraulic recovery evaluation and limitsLNAPL management objectives and goalsIntroduction to LNAPL remedial technologiesQ&A
•Introduce Derek Tomlinson.
17
17
LNAPL Conceptual Site Model (LCSM)
Site characterization andmanagement link Description and interpretation of physical and chemical state of the LNAPL bodyFacilitates understanding of the LNAPL conditions, site risks, and how best to remediateScaled to the LNAPL impacts and associated issues that require managementIterative process to increase the understanding of the LNAPL body and site risksSufficient when additional information likely would not lead to a different decision
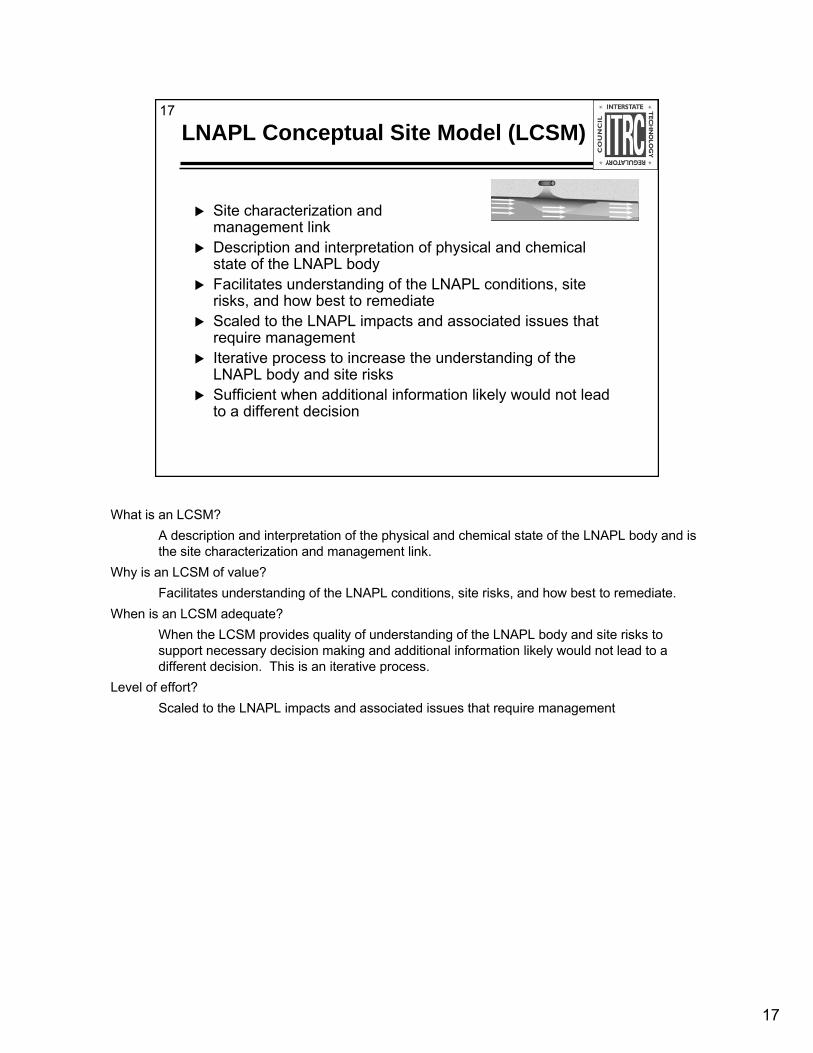
What is an LCSM?A description and interpretation of the physical and chemical state of the LNAPL body and is the site characterization and management link.
Why is an LCSM of value?Facilitates understanding of the LNAPL conditions, site risks, and how best to remediate.
When is an LCSM adequate?When the LCSM provides quality of understanding of the LNAPL body and site risks to support necessary decision making and additional information likely would not lead to a different decision. This is an iterative process.
Level of effort?Scaled to the LNAPL impacts and associated issues that require management
18
18
LNAPL Conceptual Site Model (LCSM)
LCSM used to understand• Delineation (horizontal and vertical)• Age and Chemical/Physical Character• Volume• Mobility (or Stability)• Longevity• Recoverability• Source / Pathway / Receptors
LCSM used to help make management decisions
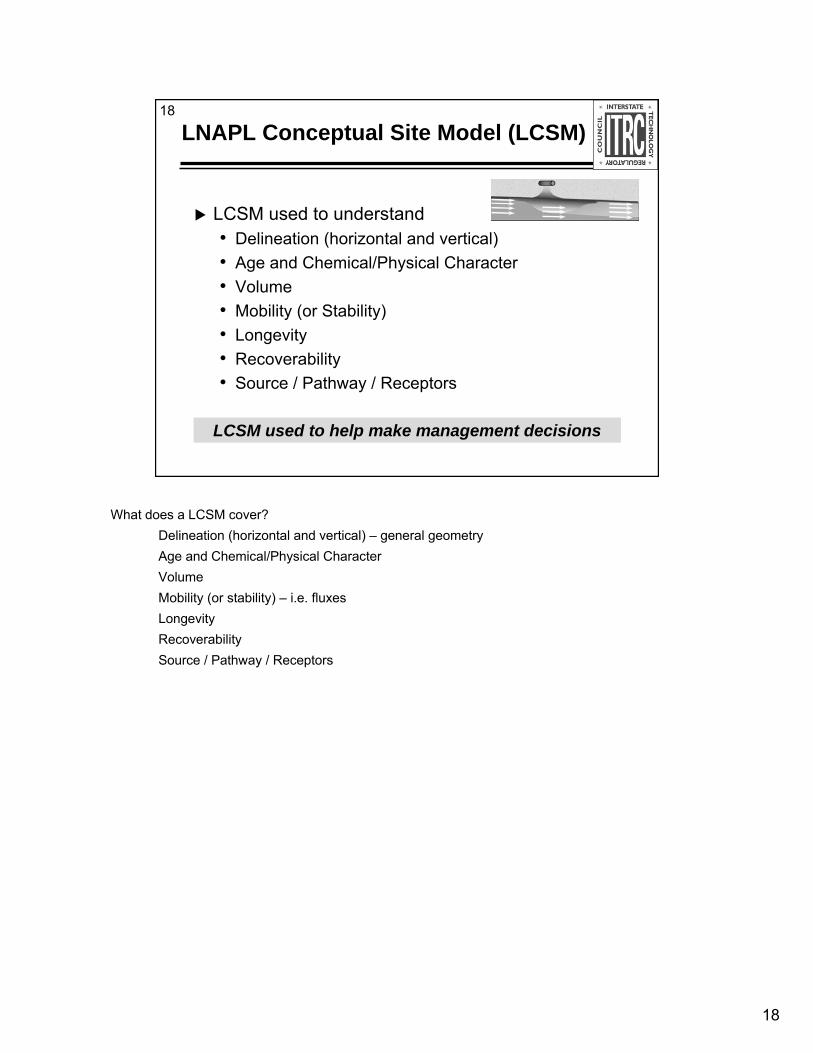
What does a LCSM cover?Delineation (horizontal and vertical) – general geometryAge and Chemical/Physical CharacterVolume Mobility (or stability) – i.e. fluxesLongevityRecoverabilitySource / Pathway / Receptors
19
19
LCSM (Major) Components
LNAPL emergency issues when LNAPL in the ground
LNAPL Risk when LNAPL in the ground (evaluated using RCBA)
Additional LNAPL Risks when LNAPL in wells (not evaluated using RCBA)
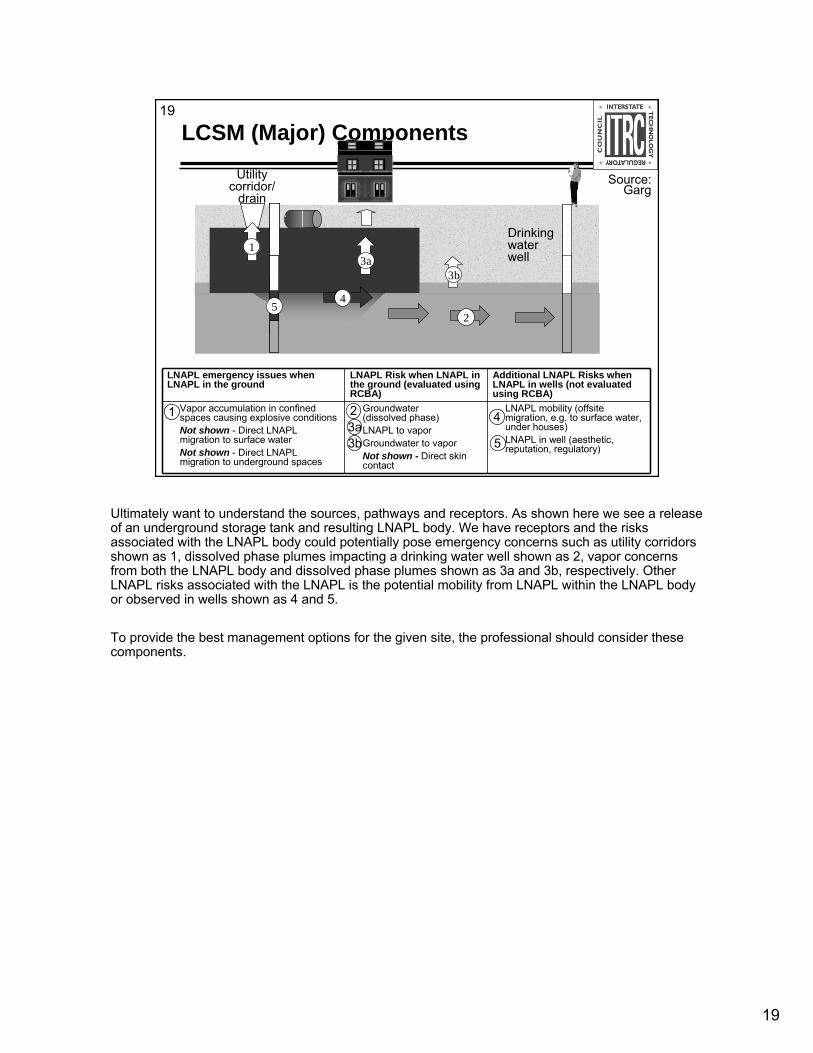
Vapor accumulation in confined spaces causing explosive conditionsNot shown - Direct LNAPL migration to surface waterNot shown - Direct LNAPL migration to underground spaces
Groundwater(dissolved phase)LNAPL to vaporGroundwater to vaporNot shown - Direct skin contact
LNAPL mobility (offsite migration, e.g. to surface water, under houses)LNAPL in well (aesthetic, reputation, regulatory)
11 2223a23b
14
15
Source: Garg
Utility corridor/
drain
3a
2
3b
45
13a
2
3b
45
1Drinking water well
Ultimately want to understand the sources, pathways and receptors. As shown here we see a release of an underground storage tank and resulting LNAPL body. We have receptors and the risks associated with the LNAPL body could potentially pose emergency concerns such as utility corridors shown as 1, dissolved phase plumes impacting a drinking water well shown as 2, vapor concerns from both the LNAPL body and dissolved phase plumes shown as 3a and 3b, respectively. Other LNAPL risks associated with the LNAPL is the potential mobility from LNAPL within the LNAPL body or observed in wells shown as 4 and 5.
To provide the best management options for the given site, the professional should consider these components.
20
20
Factors Affecting LCSM Complexity
Potential Risk Factors
Hyd
roge
olog
ic&
Plu
me
Fact
ors Toxicity/Pathway Magnitude/GW use
Offsite Plume/Sensitive Receptors
Mobility & mass in place/longevity
Business & Community Issues
Low
-deg
rada
bilit
y/
pers
iste
nt c
ompo
unds
Geo
logi
c/tra
nspo
rt co
mpl
exity
Toxi
city
/Che
mic
al m
obilit
y
Hyd
rolo
gic
Var
iabi
lity
Example factors affecting LCSM Complexity. Note, this is an example only, the boundary between Tiers is subjective based on user judgment
.
ASTM E2531, 2006
Tier 2 SitesTier 3 Sites
Increa
sing n
eed &
/or dr
ivers
for cl
eanu
p
Increas
ing Value o
f LCSM
Increa
sing c
ost &
chall
enge
of
clean
ups u
ncert
ainty
in co
st &
feasib
ility
Tier 1 Sites
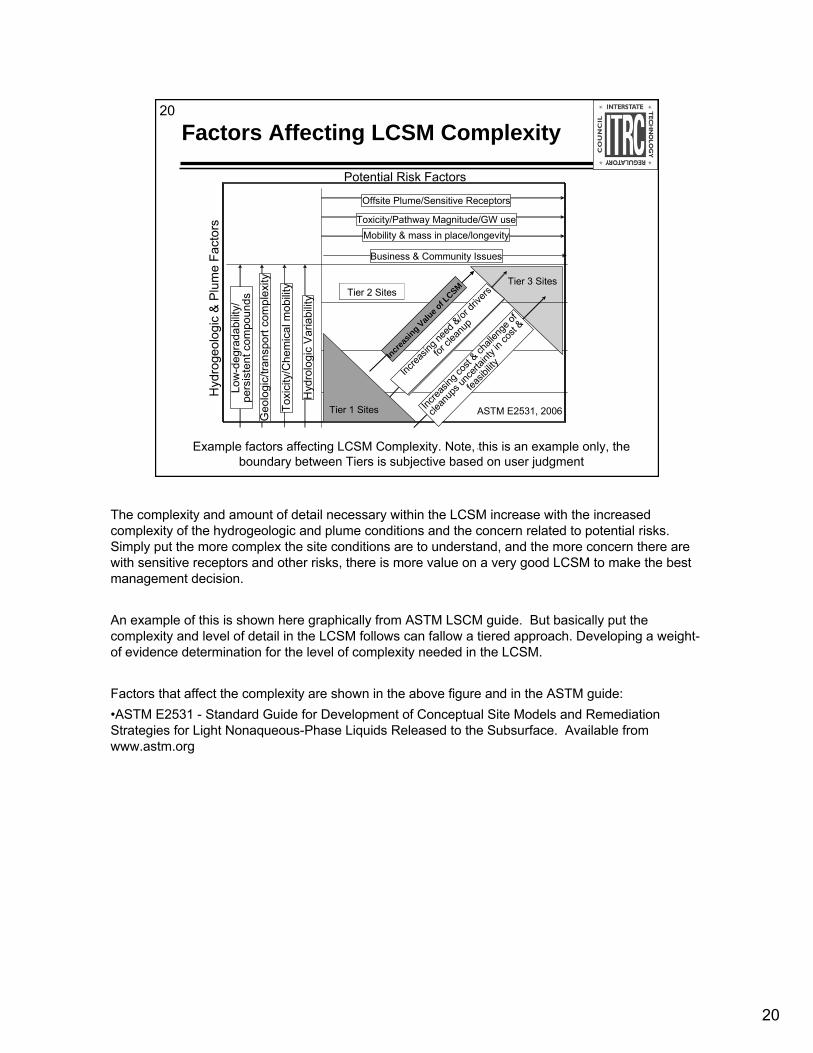
The complexity and amount of detail necessary within the LCSM increase with the increased complexity of the hydrogeologic and plume conditions and the concern related to potential risks. Simply put the more complex the site conditions are to understand, and the more concern there are with sensitive receptors and other risks, there is more value on a very good LCSM to make the best management decision.
An example of this is shown here graphically from ASTM LSCM guide. But basically put the complexity and level of detail in the LCSM follows can fallow a tiered approach. Developing a weight-of evidence determination for the level of complexity needed in the LCSM.
Factors that affect the complexity are shown in the above figure and in the ASTM guide:•ASTM E2531 - Standard Guide for Development of Conceptual Site Models and Remediation Strategies for Light Nonaqueous-Phase Liquids Released to the Subsurface. Available from www.astm.org

21
21
LNAPL Training Part 2
Introduction and Part 1 summaryLNAPL conceptual site modelLNAPL site characterizationQ&AHydraulic recovery evaluation and limitsLNAPL management objectives and goalsIntroduction to LNAPL remedial technologiesQ&A
No associated notes.
22
22 LNAPL Site CharacterizationBuilding the LCSM
Existing dataDirect methods/conventional assessmentIndirect methodsLaboratory methodsDatabase/empirical values
Remember: Not all of these data may be necessary
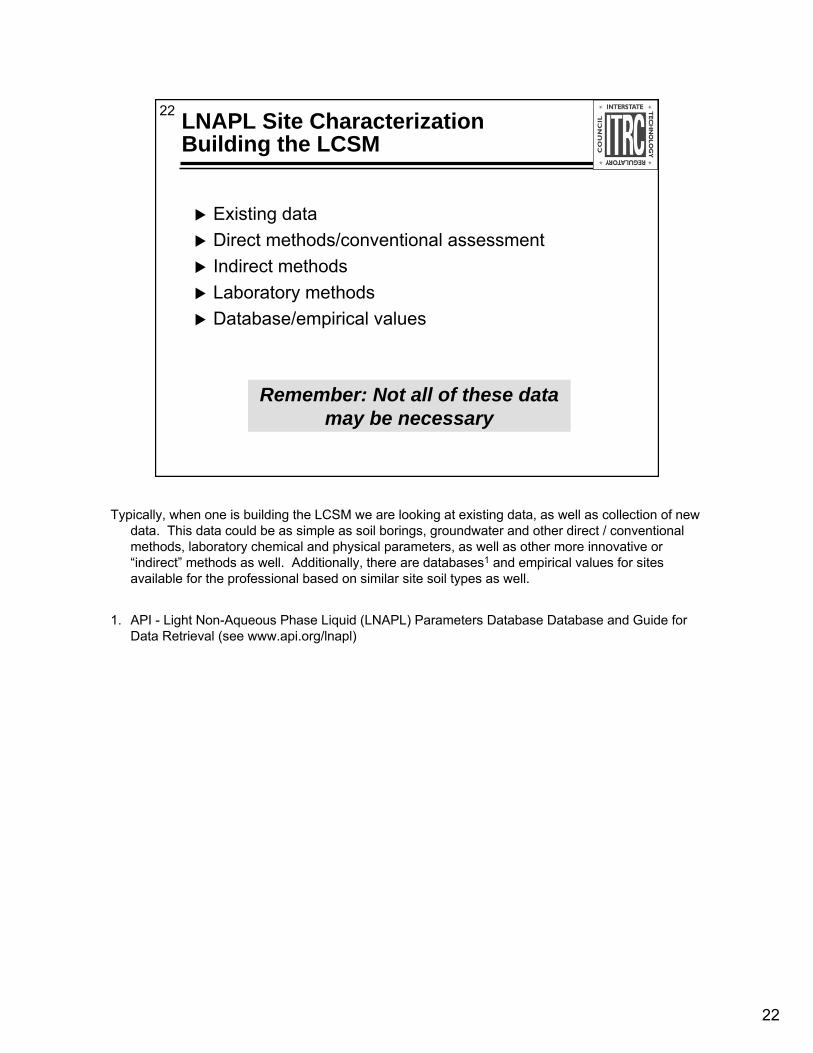
Typically, when one is building the LCSM we are looking at existing data, as well as collection of new data. This data could be as simple as soil borings, groundwater and other direct / conventional methods, laboratory chemical and physical parameters, as well as other more innovative or “indirect” methods as well. Additionally, there are databases1 and empirical values for sites available for the professional based on similar site soil types as well.
1. API - Light Non-Aqueous Phase Liquid (LNAPL) Parameters Database Database and Guide for Data Retrieval (see www.api.org/lnapl)
23
23
Example LNAPL Indicators
1. Known LNAPL release2. Observed LNAPL (for example, in wells or other
discharges)3. Visible LNAPL or other direct indicator in samples4. Fluorescence response in LNAPL range5. Near effective solubility or volatility limits in dissolved or
vapor phases6. Dissolved plume persistence and center-of mass stability7. TPH concentrations in soil or groundwater indicative of
LNAPL presence8. Organic vapor analyzer (OVA) and other field
observations9. Field screening tests positive (for example, paint filter test,
dye test, shake test)
Modified from: ASTM E2531 Table 1
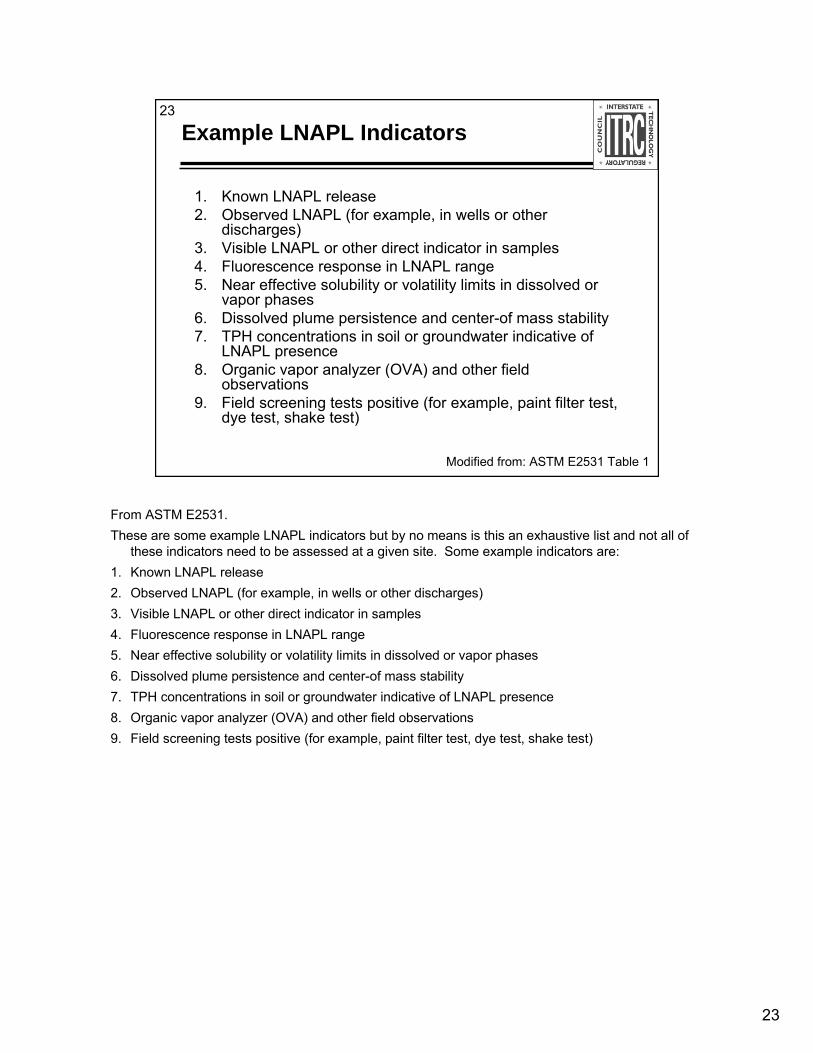
From ASTM E2531.These are some example LNAPL indicators but by no means is this an exhaustive list and not all of
these indicators need to be assessed at a given site. Some example indicators are:1. Known LNAPL release2. Observed LNAPL (for example, in wells or other discharges)3. Visible LNAPL or other direct indicator in samples4. Fluorescence response in LNAPL range5. Near effective solubility or volatility limits in dissolved or vapor phases6. Dissolved plume persistence and center-of mass stability7. TPH concentrations in soil or groundwater indicative of LNAPL presence8. Organic vapor analyzer (OVA) and other field observations9. Field screening tests positive (for example, paint filter test, dye test, shake test)
24
24 Considerations for Assessing LNAPL Presence Based on Observation
River
Creek
River
Creek
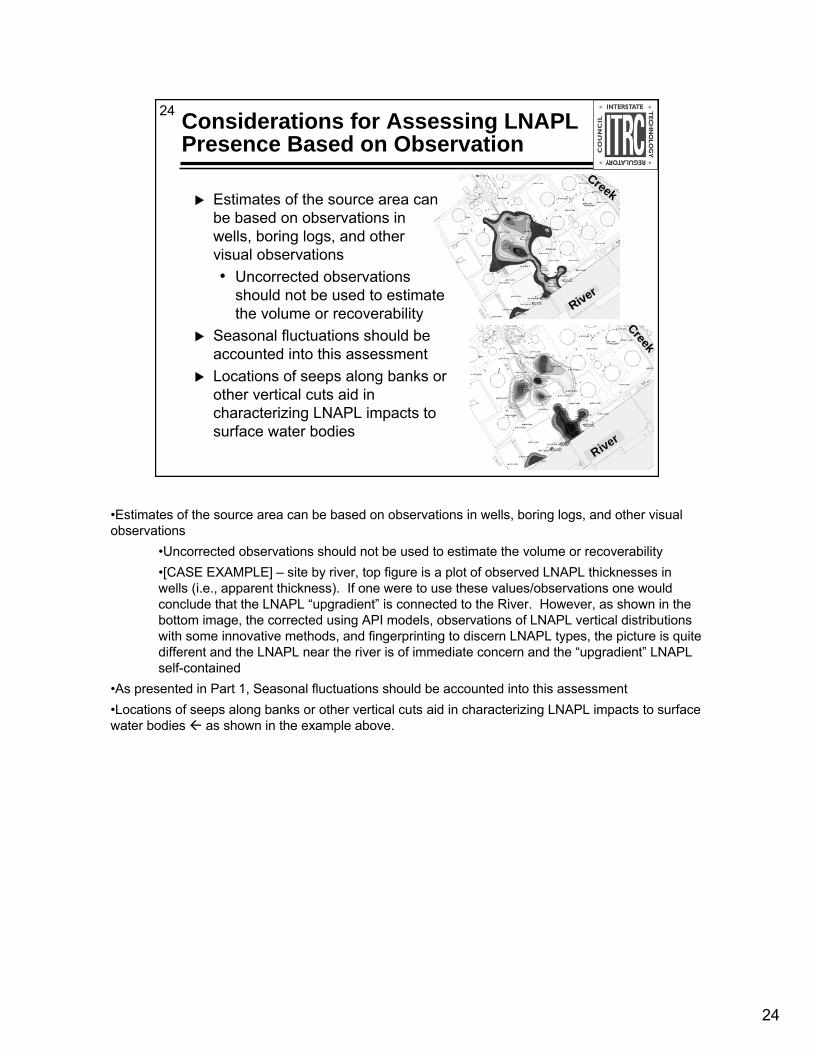
Estimates of the source area can be based on observations in wells, boring logs, and other visual observations• Uncorrected observations
should not be used to estimate the volume or recoverability
Seasonal fluctuations should be accounted into this assessmentLocations of seeps along banks or other vertical cuts aid in characterizing LNAPL impacts to surface water bodies
•Estimates of the source area can be based on observations in wells, boring logs, and other visual observations
•Uncorrected observations should not be used to estimate the volume or recoverability•[CASE EXAMPLE] – site by river, top figure is a plot of observed LNAPL thicknesses in wells (i.e., apparent thickness). If one were to use these values/observations one would conclude that the LNAPL “upgradient” is connected to the River. However, as shown in the bottom image, the corrected using API models, observations of LNAPL vertical distributions with some innovative methods, and fingerprinting to discern LNAPL types, the picture is quite different and the LNAPL near the river is of immediate concern and the “upgradient” LNAPL self-contained
•As presented in Part 1, Seasonal fluctuations should be accounted into this assessment•Locations of seeps along banks or other vertical cuts aid in characterizing LNAPL impacts to surface water bodies as shown in the example above.
25
25
Existing Soil Data
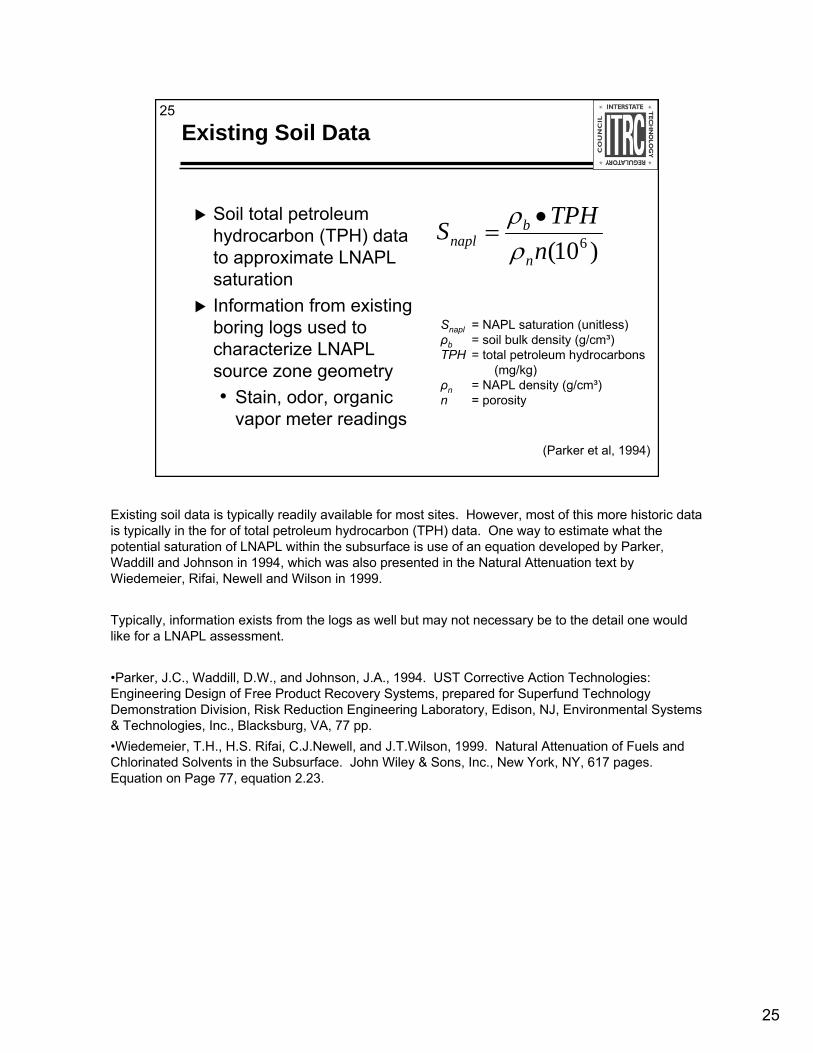
Soil total petroleum hydrocarbon (TPH) data to approximate LNAPL saturationInformation from existing boring logs used to characterize LNAPL source zone geometry• Stain, odor, organic
vapor meter readings
)10( 6nTPHS
n
bnapl ρ
ρ •=
Snapl = NAPL saturation (unitless)ρb = soil bulk density (g/cm³)TPH = total petroleum hydrocarbons
(mg/kg)ρn = NAPL density (g/cm³)n = porosity
(Parker et al, 1994)
Existing soil data is typically readily available for most sites. However, most of this more historic data is typically in the for of total petroleum hydrocarbon (TPH) data. One way to estimate what the potential saturation of LNAPL within the subsurface is use of an equation developed by Parker, Waddill and Johnson in 1994, which was also presented in the Natural Attenuation text by Wiedemeier, Rifai, Newell and Wilson in 1999.
Typically, information exists from the logs as well but may not necessary be to the detail one would like for a LNAPL assessment.
•Parker, J.C., Waddill, D.W., and Johnson, J.A., 1994. UST Corrective Action Technologies: Engineering Design of Free Product Recovery Systems, prepared for Superfund Technology Demonstration Division, Risk Reduction Engineering Laboratory, Edison, NJ, Environmental Systems & Technologies, Inc., Blacksburg, VA, 77 pp.•Wiedemeier, T.H., H.S. Rifai, C.J.Newell, and J.T.Wilson, 1999. Natural Attenuation of Fuels and Chlorinated Solvents in the Subsurface. John Wiley & Sons, Inc., New York, NY, 617 pages. Equation on Page 77, equation 2.23.
26
26
Existing Groundwater Data
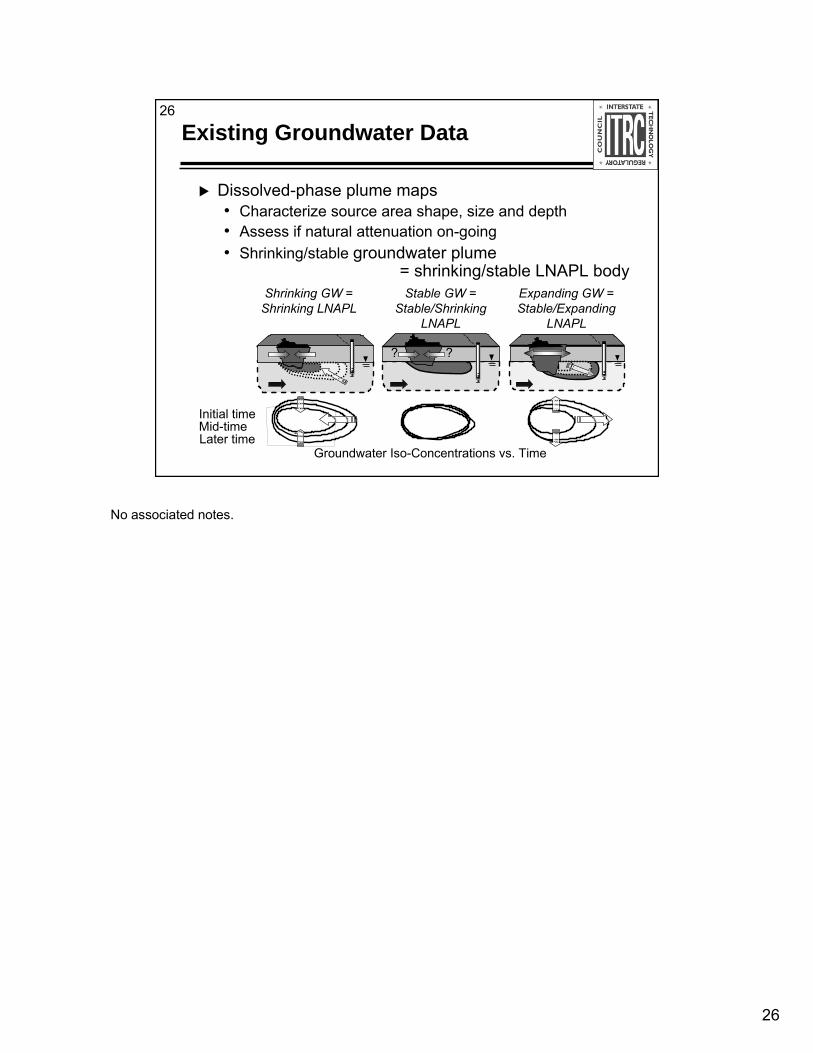
Dissolved-phase plume maps• Characterize source area shape, size and depth• Assess if natural attenuation on-going• Shrinking/stable groundwater plume
= shrinking/stable LNAPL body
Later timeMid-timeInitial time
Expanding GW = Stable/Expanding
LNAPL
Stable GW = Stable/Shrinking
LNAPL
Shrinking GW = Shrinking LNAPL
??
Groundwater Iso-Concentrations vs. Time
No associated notes.
27
27
Existing LNAPL Data
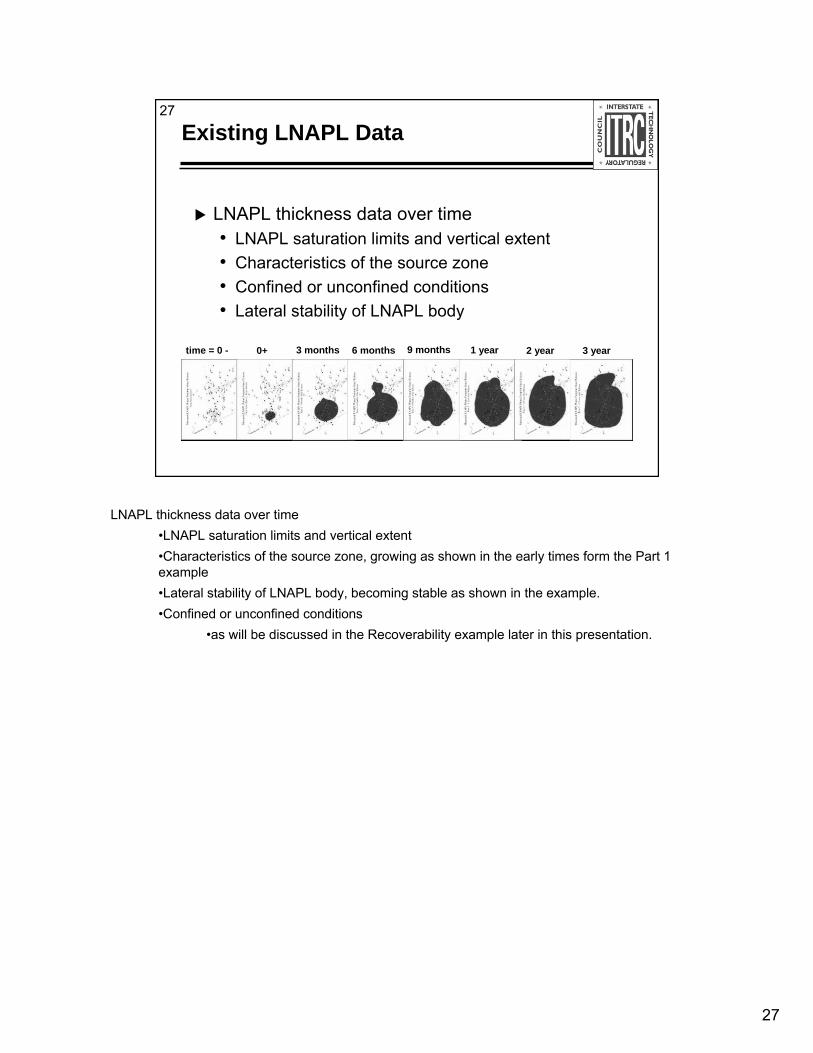
LNAPL thickness data over time• LNAPL saturation limits and vertical extent• Characteristics of the source zone• Confined or unconfined conditions• Lateral stability of LNAPL body
time = 0 - 0+ 3 months 6 months 9 months 1 year 2 year 3 year
LNAPL thickness data over time•LNAPL saturation limits and vertical extent•Characteristics of the source zone, growing as shown in the early times form the Part 1 example•Lateral stability of LNAPL body, becoming stable as shown in the example.•Confined or unconfined conditions
•as will be discussed in the Recoverability example later in this presentation.
28
28
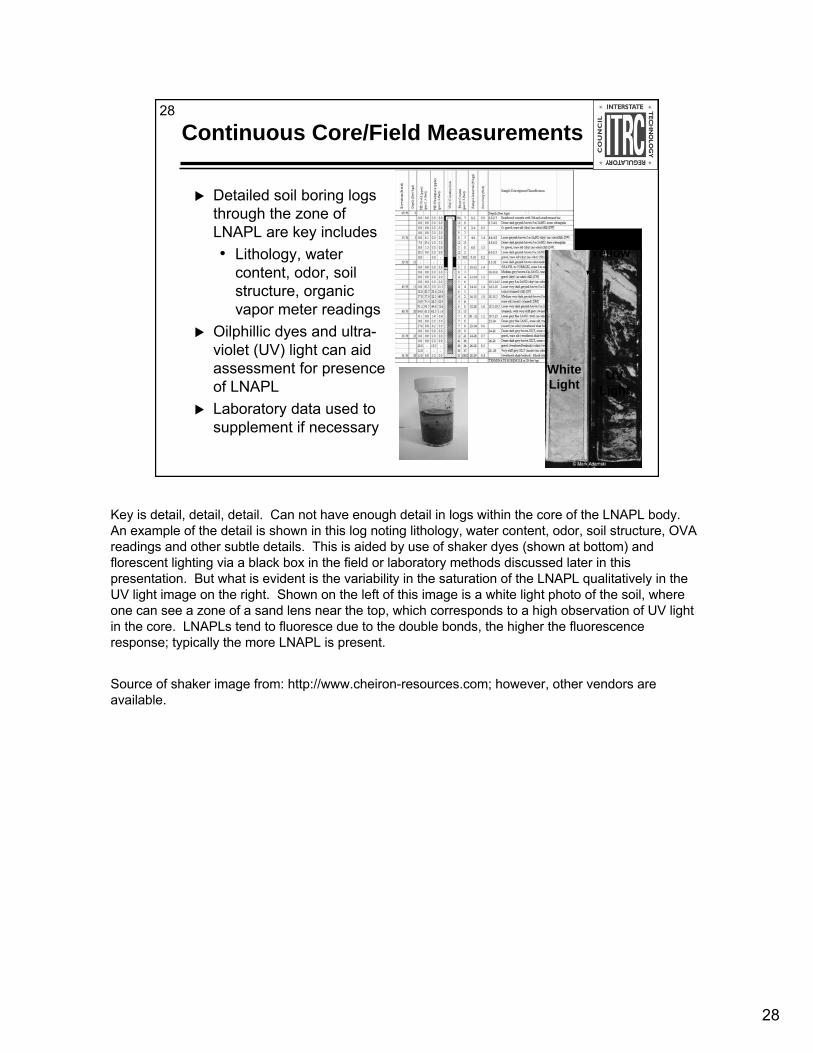
Continuous Core/Field Measurements
Detailed soil boring logs through the zone of LNAPL are key includes• Lithology, water
content, odor, soil structure, organic vapor meter readings
Oilphillic dyes and ultra-violet (UV) light can aid assessment for presence of LNAPLLaboratory data used to supplement if necessary
White Light
UV Light
LNAPL in Yellow
Key is detail, detail, detail. Can not have enough detail in logs within the core of the LNAPL body. An example of the detail is shown in this log noting lithology, water content, odor, soil structure, OVA readings and other subtle details. This is aided by use of shaker dyes (shown at bottom) and florescent lighting via a black box in the field or laboratory methods discussed later in this presentation. But what is evident is the variability in the saturation of the LNAPL qualitatively in the UV light image on the right. Shown on the left of this image is a white light photo of the soil, where one can see a zone of a sand lens near the top, which corresponds to a high observation of UV light in the core. LNAPLs tend to fluoresce due to the double bonds, the higher the fluorescence response; typically the more LNAPL is present.
Source of shaker image from: http://www.cheiron-resources.com; however, other vendors are available.
2929
29
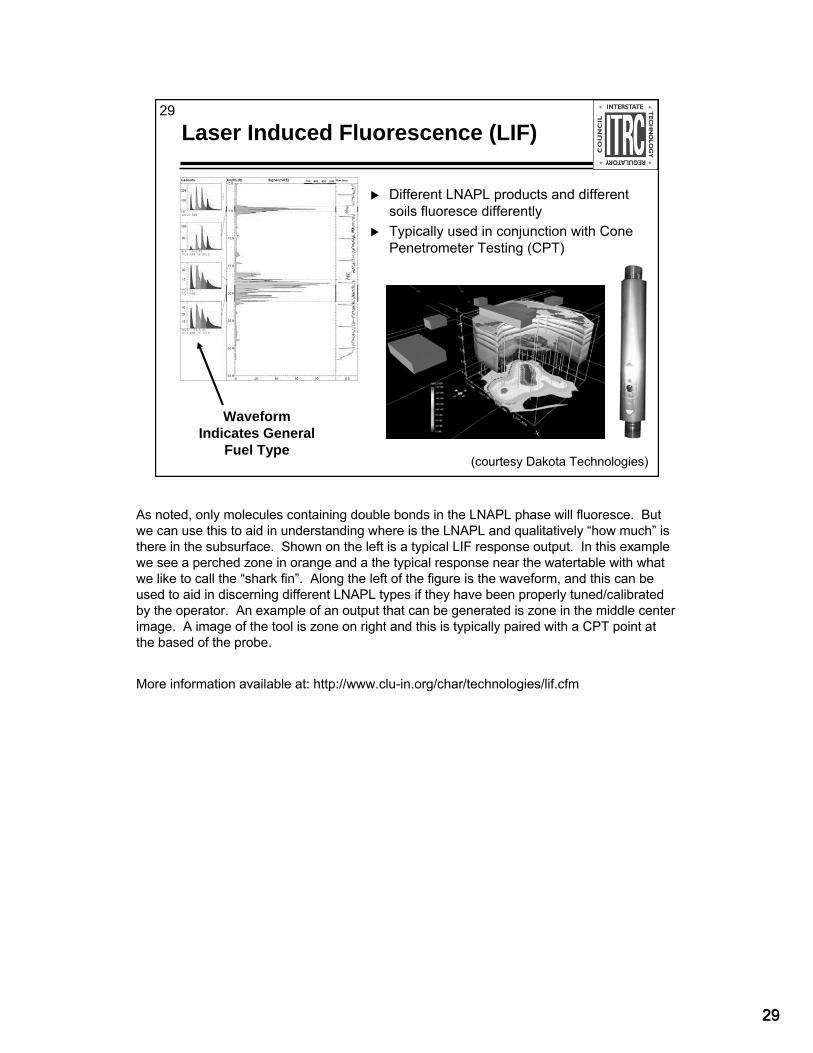
Laser Induced Fluorescence (LIF)
Different LNAPL products and different soils fluoresce differentlyTypically used in conjunction with Cone Penetrometer Testing (CPT)
Waveform Indicates General
Fuel Type(courtesy Dakota Technologies)
As noted, only molecules containing double bonds in the LNAPL phase will fluoresce. But we can use this to aid in understanding where is the LNAPL and qualitatively “how much” is there in the subsurface. Shown on the left is a typical LIF response output. In this example we see a perched zone in orange and a the typical response near the watertable with what we like to call the “shark fin”. Along the left of the figure is the waveform, and this can beused to aid in discerning different LNAPL types if they have been properly tuned/calibrated by the operator. An example of an output that can be generated is zone in the middle center image. A image of the tool is zone on right and this is typically paired with a CPT point at the based of the probe.
More information available at: http://www.clu-in.org/char/technologies/lif.cfm
30
30
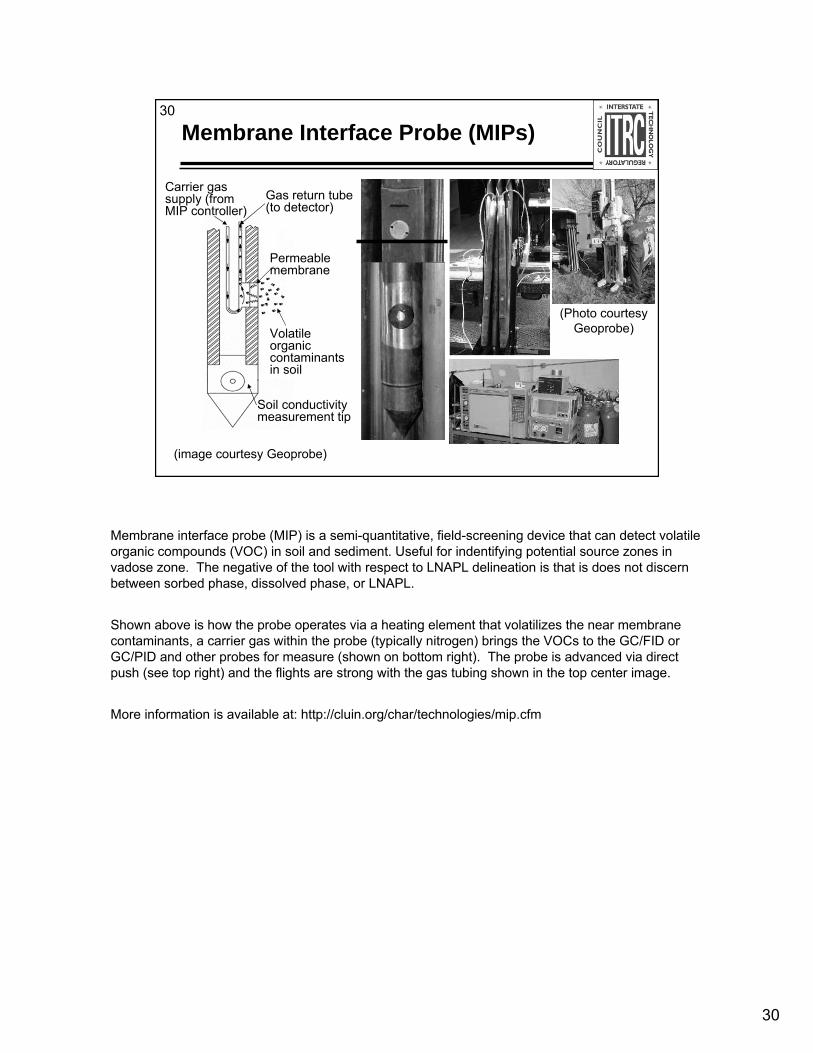
Membrane Interface Probe (MIPs)
(Photo courtesy Geoprobe)
(image courtesy Geoprobe)
Carrier gas supply (from MIP controller)
Gas return tube (to detector)
Permeable membrane
Volatile organic contaminants in soil
Soil conductivity measurement tip
Membrane interface probe (MIP) is a semi-quantitative, field-screening device that can detect volatile organic compounds (VOC) in soil and sediment. Useful for indentifying potential source zones in vadose zone. The negative of the tool with respect to LNAPL delineation is that is does not discern between sorbed phase, dissolved phase, or LNAPL.
Shown above is how the probe operates via a heating element that volatilizes the near membrane contaminants, a carrier gas within the probe (typically nitrogen) brings the VOCs to the GC/FID or GC/PID and other probes for measure (shown on bottom right). The probe is advanced via direct push (see top right) and the flights are strong with the gas tubing shown in the top center image.
More information is available at: http://cluin.org/char/technologies/mip.cfm
31
31
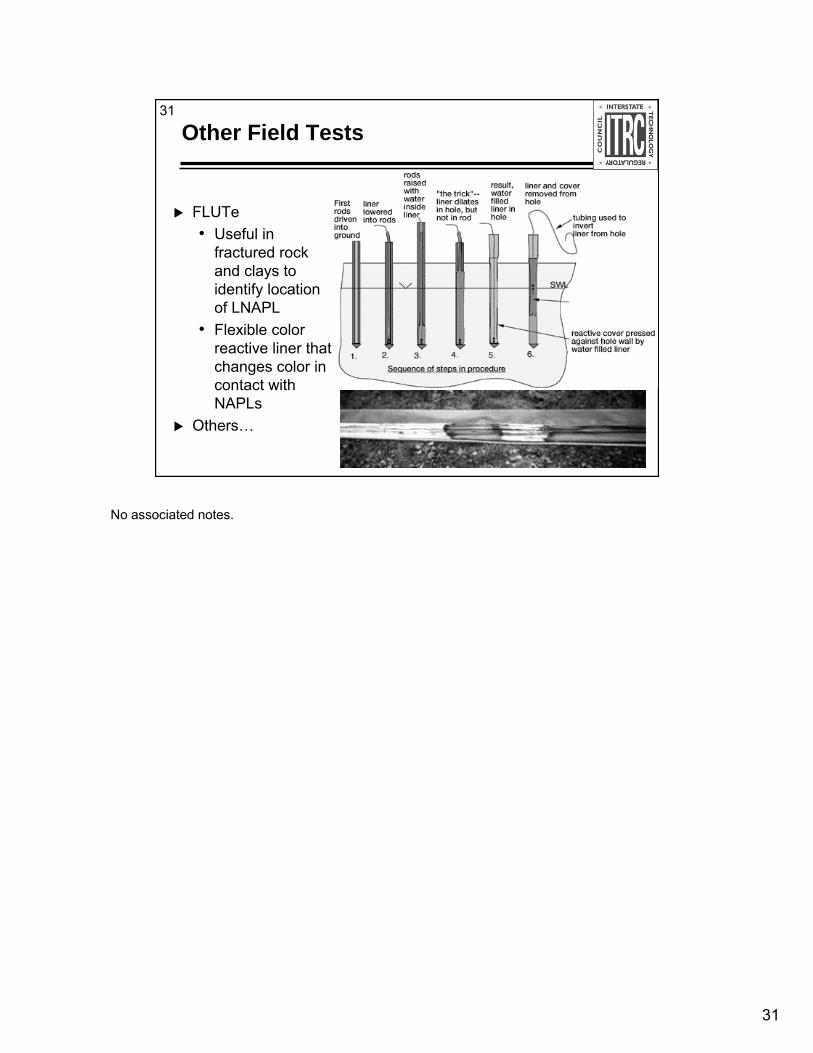
Other Field Tests
FLUTe• Useful in
fractured rock and clays to identify location of LNAPL
• Flexible color reactive liner that changes color in contact with NAPLs
Others…
No associated notes.
32
32
Laboratory Analysis
Common laboratory methods• Soil, groundwater and vapor concentrations• Basic soil properties (e.g., grain size, bulk
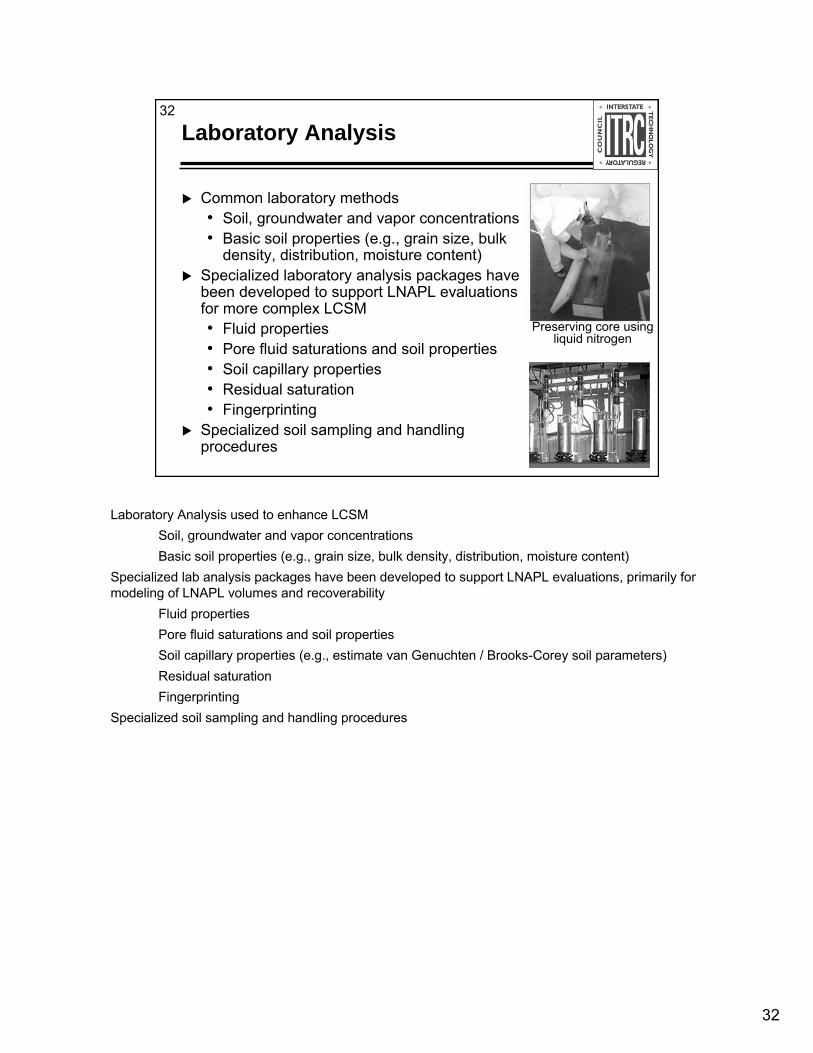
density, distribution, moisture content)Specialized laboratory analysis packages have been developed to support LNAPL evaluations for more complex LCSM• Fluid properties• Pore fluid saturations and soil properties• Soil capillary properties• Residual saturation• Fingerprinting
Specialized soil sampling and handling procedures
Preserving core using liquid nitrogen
Laboratory Analysis used to enhance LCSMSoil, groundwater and vapor concentrationsBasic soil properties (e.g., grain size, bulk density, distribution, moisture content)
Specialized lab analysis packages have been developed to support LNAPL evaluations, primarily for modeling of LNAPL volumes and recoverability
Fluid propertiesPore fluid saturations and soil propertiesSoil capillary properties (e.g., estimate van Genuchten / Brooks-Corey soil parameters)Residual saturationFingerprinting
Specialized soil sampling and handling procedures
33
33 Specialized Laboratory Packages for LNAPL Characterization
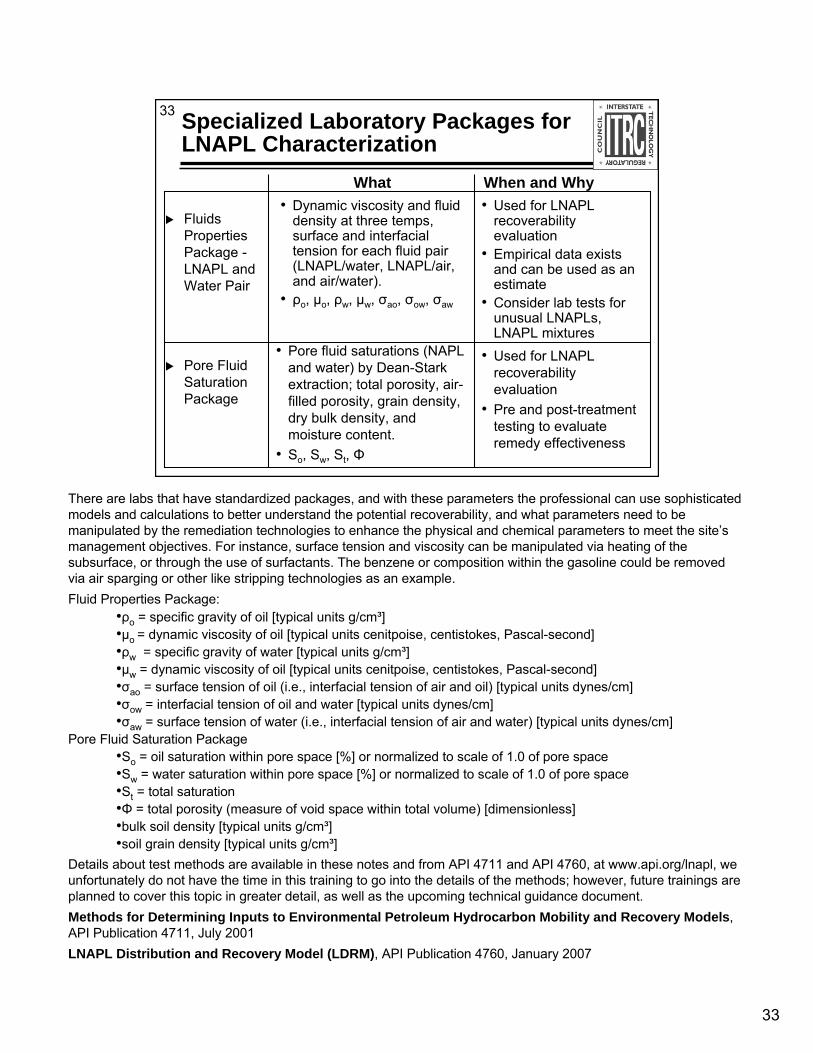
Fluids Properties Package -LNAPL and Water Pair
• Dynamic viscosity and fluid density at three temps, surface and interfacial tension for each fluid pair (LNAPL/water, LNAPL/air, and air/water).
• ρo, μo, ρw, μw, σao, σow, σaw
• Pore fluid saturations (NAPL and water) by Dean-Stark extraction; total porosity, air-filled porosity, grain density, dry bulk density, and moisture content.
• So, Sw, St, Φ
Pore Fluid Saturation Package
What When and Why• Used for LNAPL
recoverability evaluation
• Empirical data exists and can be used as an estimate
• Consider lab tests for unusual LNAPLs, LNAPL mixtures
• Used for LNAPL recoverability evaluation
• Pre and post-treatment testing to evaluate remedy effectiveness
There are labs that have standardized packages, and with these parameters the professional can use sophisticated models and calculations to better understand the potential recoverability, and what parameters need to be manipulated by the remediation technologies to enhance the physical and chemical parameters to meet the site’s management objectives. For instance, surface tension and viscosity can be manipulated via heating of the subsurface, or through the use of surfactants. The benzene or composition within the gasoline could be removed via air sparging or other like stripping technologies as an example.Fluid Properties Package:
•ρo = specific gravity of oil [typical units g/cm³]•μo = dynamic viscosity of oil [typical units cenitpoise, centistokes, Pascal-second]•ρw = specific gravity of water [typical units g/cm³]•μw = dynamic viscosity of oil [typical units cenitpoise, centistokes, Pascal-second]•σao = surface tension of oil (i.e., interfacial tension of air and oil) [typical units dynes/cm]•σow = interfacial tension of oil and water [typical units dynes/cm]•σaw = surface tension of water (i.e., interfacial tension of air and water) [typical units dynes/cm]
Pore Fluid Saturation Package•So = oil saturation within pore space [%] or normalized to scale of 1.0 of pore space•Sw = water saturation within pore space [%] or normalized to scale of 1.0 of pore space•St = total saturation•Φ = total porosity (measure of void space within total volume) [dimensionless]•bulk soil density [typical units g/cm³]•soil grain density [typical units g/cm³]
Details about test methods are available in these notes and from API 4711 and API 4760, at www.api.org/lnapl, we unfortunately do not have the time in this training to go into the details of the methods; however, future trainings are planned to cover this topic in greater detail, as well as the upcoming technical guidance document.Methods for Determining Inputs to Environmental Petroleum Hydrocarbon Mobility and Recovery Models, API Publication 4711, July 2001 LNAPL Distribution and Recovery Model (LDRM), API Publication 4760, January 2007
34
34 Specialized Laboratory Packages for LNAPL Characterization (continued)
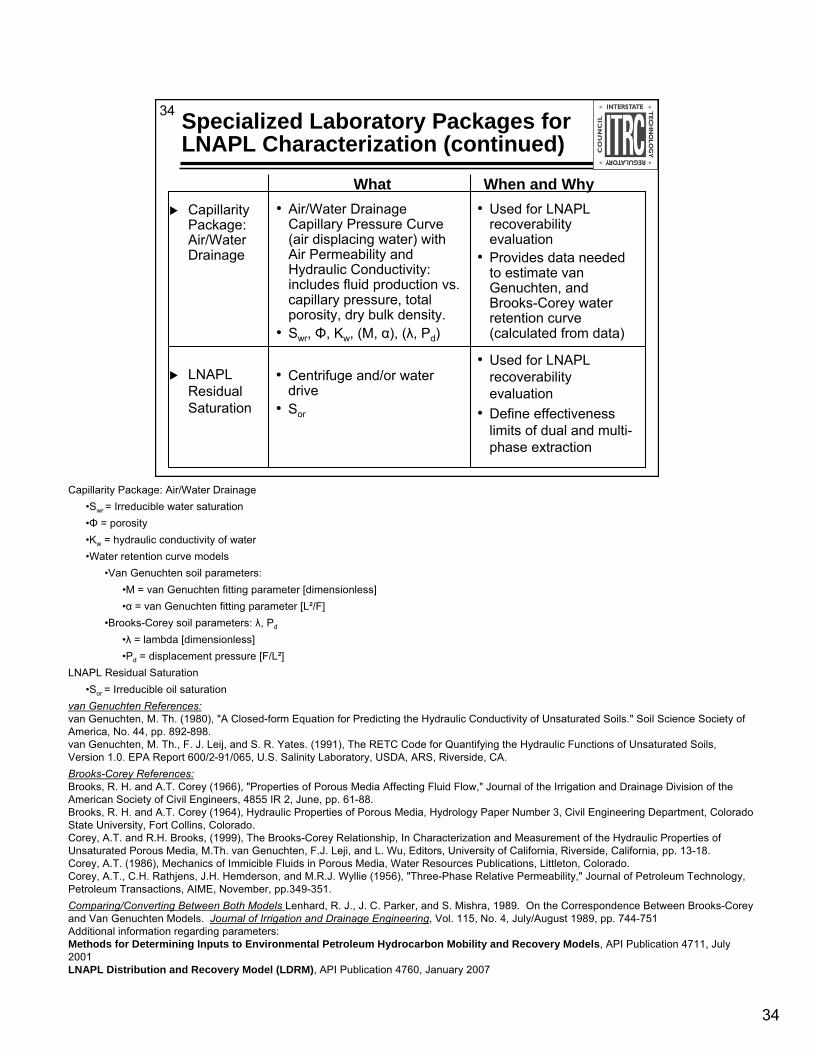
Capillarity Package: Air/Water Drainage
• Air/Water Drainage Capillary Pressure Curve (air displacing water) with Air Permeability and Hydraulic Conductivity: includes fluid production vs. capillary pressure, total porosity, dry bulk density.
• Swr, Φ, Kw, (M, α), (λ, Pd)
• Centrifuge and/or water drive
• Sor
LNAPL Residual Saturation
What When and Why• Used for LNAPL
recoverability evaluation
• Provides data needed to estimate van Genuchten, and Brooks-Corey water retention curve (calculated from data)
• Used for LNAPL recoverability evaluation
• Define effectiveness limits of dual and multi-phase extraction
Capillarity Package: Air/Water Drainage•Swr = Irreducible water saturation•Φ = porosity•Kw = hydraulic conductivity of water•Water retention curve models
•Van Genuchten soil parameters: •M = van Genuchten fitting parameter [dimensionless]•α = van Genuchten fitting parameter [L²/F]
•Brooks-Corey soil parameters: λ, Pd
•λ = lambda [dimensionless]•Pd = displacement pressure [F/L²]
LNAPL Residual Saturation•Sor = Irreducible oil saturation
van Genuchten References:van Genuchten, M. Th. (1980), "A Closed-form Equation for Predicting the Hydraulic Conductivity of Unsaturated Soils." Soil Science Society of America, No. 44, pp. 892-898.van Genuchten, M. Th., F. J. Leij, and S. R. Yates. (1991), The RETC Code for Quantifying the Hydraulic Functions of Unsaturated Soils, Version 1.0. EPA Report 600/2-91/065, U.S. Salinity Laboratory, USDA, ARS, Riverside, CA.Brooks-Corey References:Brooks, R. H. and A.T. Corey (1966), "Properties of Porous Media Affecting Fluid Flow," Journal of the Irrigation and Drainage Division of the American Society of Civil Engineers, 4855 IR 2, June, pp. 61-88.Brooks, R. H. and A.T. Corey (1964), Hydraulic Properties of Porous Media, Hydrology Paper Number 3, Civil Engineering Department, Colorado State University, Fort Collins, Colorado.Corey, A.T. and R.H. Brooks, (1999), The Brooks-Corey Relationship, In Characterization and Measurement of the Hydraulic Properties of Unsaturated Porous Media, M.Th. van Genuchten, F.J. Leji, and L. Wu, Editors, University of California, Riverside, California, pp. 13-18.Corey, A.T. (1986), Mechanics of Immicible Fluids in Porous Media, Water Resources Publications, Littleton, Colorado.Corey, A.T., C.H. Rathjens, J.H. Hemderson, and M.R.J. Wyllie (1956), "Three-Phase Relative Permeability," Journal of Petroleum Technology, Petroleum Transactions, AIME, November, pp.349-351.Comparing/Converting Between Both Models Lenhard, R. J., J. C. Parker, and S. Mishra, 1989. On the Correspondence Between Brooks-Corey and Van Genuchten Models. Journal of Irrigation and Drainage Engineering, Vol. 115, No. 4, July/August 1989, pp. 744-751Additional information regarding parameters:Methods for Determining Inputs to Environmental Petroleum Hydrocarbon Mobility and Recovery Models, API Publication 4711, July 2001 LNAPL Distribution and Recovery Model (LDRM), API Publication 4760, January 2007
35
35
Estimated/Empirical Values
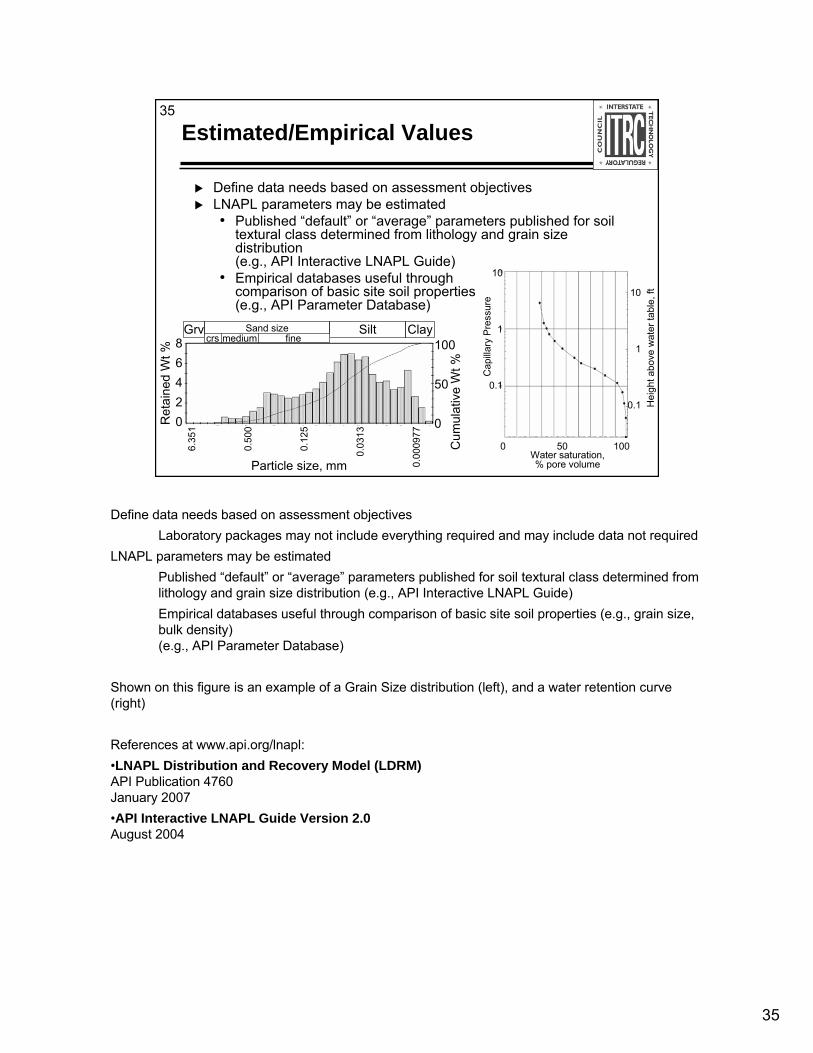
Define data needs based on assessment objectivesLNAPL parameters may be estimated• Published “default” or “average” parameters published for soil
textural class determined from lithology and grain size distribution(e.g., API Interactive LNAPL Guide)
• Empirical databases useful through comparison of basic site soil properties (e.g., API Parameter Database)
Particle size, mm
Ret
aine
d W
t %
86420
Cum
ulat
ive
Wt %
100
50
0
Silt ClayGrv Sand sizecrs finemedium
6.35
1
0.50
0
0.12
5
0.03
13
0.00
0977
Cap
illary
Pre
ssur
e
10
1
0.1
Hei
ght a
bove
wat
er ta
ble,
ft
Water saturation, % pore volume
0 50 100
10
1
0.1
Define data needs based on assessment objectivesLaboratory packages may not include everything required and may include data not required
LNAPL parameters may be estimatedPublished “default” or “average” parameters published for soil textural class determined from lithology and grain size distribution (e.g., API Interactive LNAPL Guide)Empirical databases useful through comparison of basic site soil properties (e.g., grain size, bulk density)(e.g., API Parameter Database)
Shown on this figure is an example of a Grain Size distribution (left), and a water retention curve (right)
References at www.api.org/lnapl:•LNAPL Distribution and Recovery Model (LDRM)API Publication 4760January 2007 •API Interactive LNAPL Guide Version 2.0August 2004

36
36
Why Not Just Use Estimated Values?
Estimated values versus laboratory measurements• Consider accuracy versus cost • Is reduction in uncertainty likely to impact management
decision?• Not all information is needed for every site
Typical process for characterization• Use estimated values and existing data first • Conduct sensitivity analysis• Site-specific analyses
Tiered data collectionMore useful at complex sites based on geology, composition, risk, receptors
No associated notes.
37
37 Summary of LCSM and LNAPL Characterization
LCSM helps to understand LNAPL site conditions, risks, if/why a remedy is needed and supports management decisionsSite characterization methods and comprehensiveness are a function of the complexity of the LNAPL site conditionsLNAPL distribution is not as simple as we thought• Not distributed as a pancake• Vertical equilibrium • LNAPL saturation is not uniform
No associated notes.
38
38
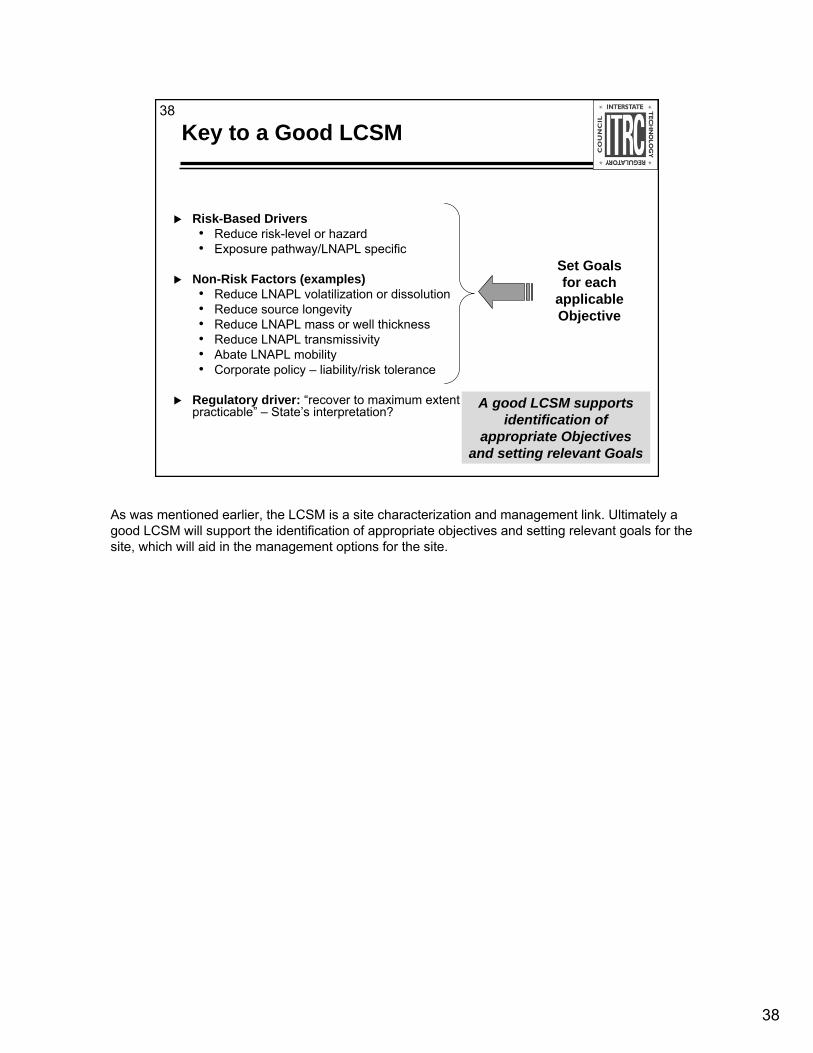
Key to a Good LCSM
Risk-Based Drivers• Reduce risk-level or hazard• Exposure pathway/LNAPL specific
Non-Risk Factors (examples)• Reduce LNAPL volatilization or dissolution• Reduce source longevity• Reduce LNAPL mass or well thickness• Reduce LNAPL transmissivity• Abate LNAPL mobility• Corporate policy – liability/risk tolerance
Regulatory driver: “recover to maximum extent practicable” – State’s interpretation?
Set Goals for each
applicable Objective
A good LCSM supports identification of
appropriate Objectives and setting relevant Goals
As was mentioned earlier, the LCSM is a site characterization and management link. Ultimately a good LCSM will support the identification of appropriate objectives and setting relevant goals for the site, which will aid in the management options for the site.

39
39
LNAPL Training Part 2
Introduction and Part 1 summaryLNAPL conceptual site modelLNAPL site characterizationQ&AHydraulic recovery evaluation and limitsLNAPL management objectives and goalsIntroduction to LNAPL remedial technologiesQ&A
Building on the concepts presented in the Part 1 training, this section will continue to build out the LNAPL Conceptual Site Model with the hydraulic recovery evaluation
40
40
LNAPL Training Part 2
Introduction and Part 1 summaryLNAPL conceptual site modelLNAPL site characterizationQ&AHydraulic recovery evaluation and limitsLNAPL management objectives and goalsIntroduction to LNAPL remedial technologiesQ&A
Building on the concepts presented in the Part 1 training, this section will continue to build out the LNAPL Conceptual Site Model with the hydraulic recovery evaluation
41
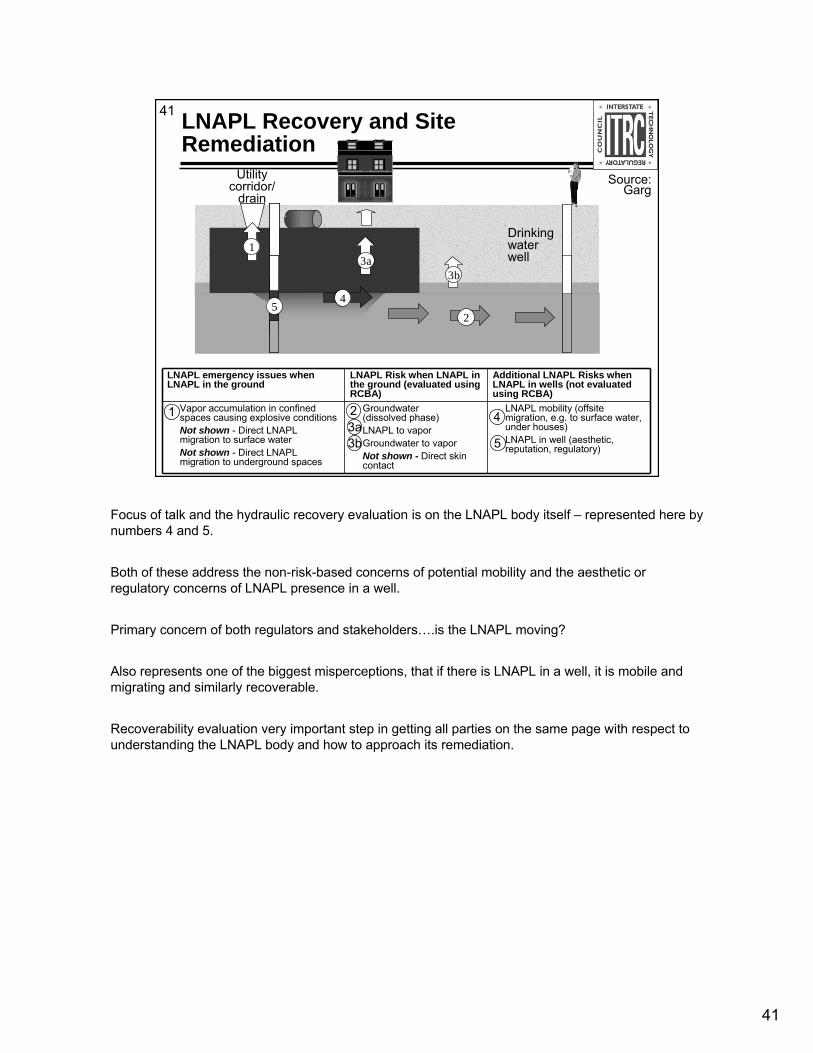
41 LNAPL Recovery and Site Remediation
LNAPL emergency issues when LNAPL in the ground
LNAPL Risk when LNAPL in the ground (evaluated using RCBA)
Additional LNAPL Risks when LNAPL in wells (not evaluated using RCBA)
Vapor accumulation in confined spaces causing explosive conditionsNot shown - Direct LNAPL migration to surface waterNot shown - Direct LNAPL migration to underground spaces
Groundwater(dissolved phase)LNAPL to vaporGroundwater to vaporNot shown - Direct skin contact
LNAPL mobility (offsite migration, e.g. to surface water, under houses)LNAPL in well (aesthetic, reputation, regulatory)
11 2223a23b
14
15
Source: Garg
Utility corridor/
drain
3a
2
3b
45
13a
2
3b
45
1Drinking water well
Focus of talk and the hydraulic recovery evaluation is on the LNAPL body itself – represented here by numbers 4 and 5.
Both of these address the non-risk-based concerns of potential mobility and the aesthetic or regulatory concerns of LNAPL presence in a well.
Primary concern of both regulators and stakeholders….is the LNAPL moving?
Also represents one of the biggest misperceptions, that if there is LNAPL in a well, it is mobile and migrating and similarly recoverable.
Recoverability evaluation very important step in getting all parties on the same page with respect to understanding the LNAPL body and how to approach its remediation.
4242
42
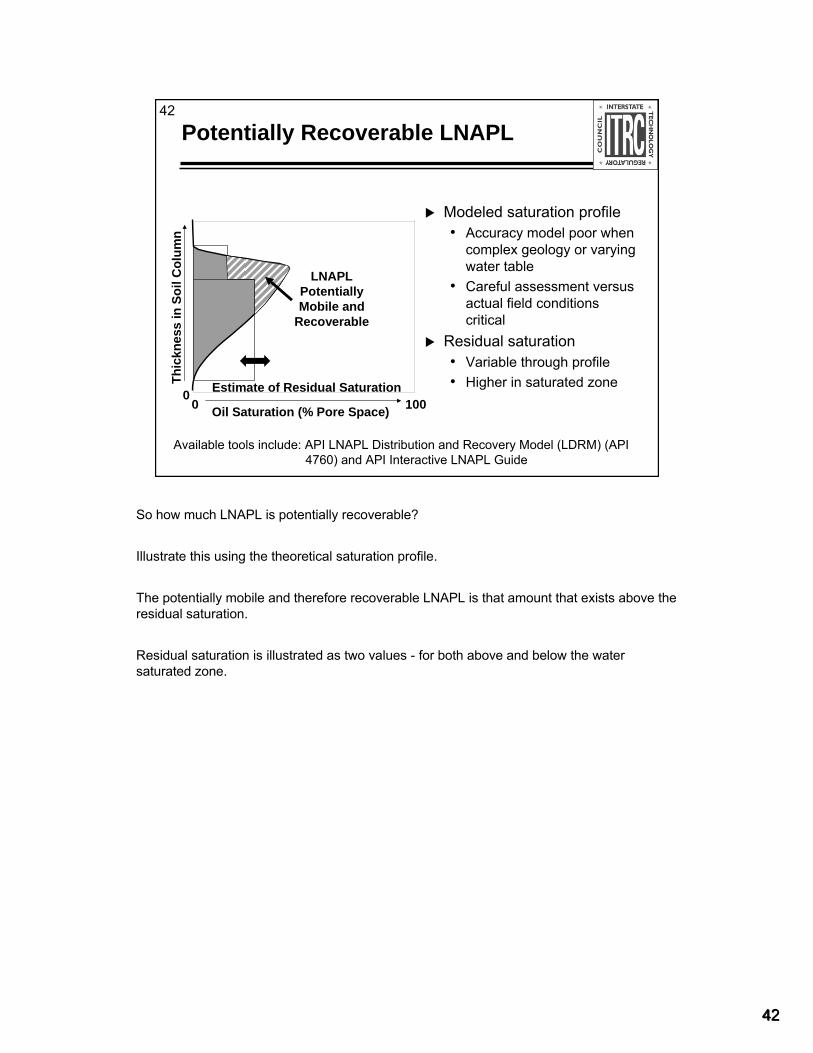
Potentially Recoverable LNAPL
Modeled saturation profile• Accuracy model poor when
complex geology or varying water table
• Careful assessment versus actual field conditions critical
Residual saturation• Variable through profile• Higher in saturated zone
Oil Saturation (% Pore Space)
Thic
knes
s i n
Soi
l Col
umn
00
100
LNAPL Potentially Mobile and
Recoverable
Available tools include: API LNAPL Distribution and Recovery Model (LDRM) (API 4760) and API Interactive LNAPL Guide
Estimate of Residual Saturation
So how much LNAPL is potentially recoverable?
Illustrate this using the theoretical saturation profile.
The potentially mobile and therefore recoverable LNAPL is that amount that exists above the residual saturation.
Residual saturation is illustrated as two values - for both above and below the water saturated zone.
43431
43 Why Do We Need to Evaluate LNAPL Recoverability for LCSM
Determine site wide recoverability distribution• Can interpolate Tn values to generate isopleths
Determine if LNAPL can be recovered• In meaningful quantities • Sustained
Determine where LNAPL can be recovered Assist with LNAPL recovery system management• Seasonal fluctuation may dictate that you only
recover in certain period for exampleDetermine when LNAPL recovery is complete
The objectives of recovery predictions are to design efficient free product recovery systems using trenches, skimmer wells and single and dual-pump wells, to provide estimates of recovery performance, to provide estimates of recovery time, and to provide a means of establishing practical endpoints. Over the next few slides, recovery predictions using analytical models will be described, so the relationship between the soil and fluid properties and the understanding developed earlier becomes clear.
Based on the complexities of LNAPL occurrence and behavior, and the misconceptions, LNAPL volumes and recovery are typically over-estimated.
Important point to remember, however, is that LNAPL recovery is limited and finite. As you recover the LNAPL, its saturation is being decreased, and therefore, its mobility and recoverability is diminishing.
44
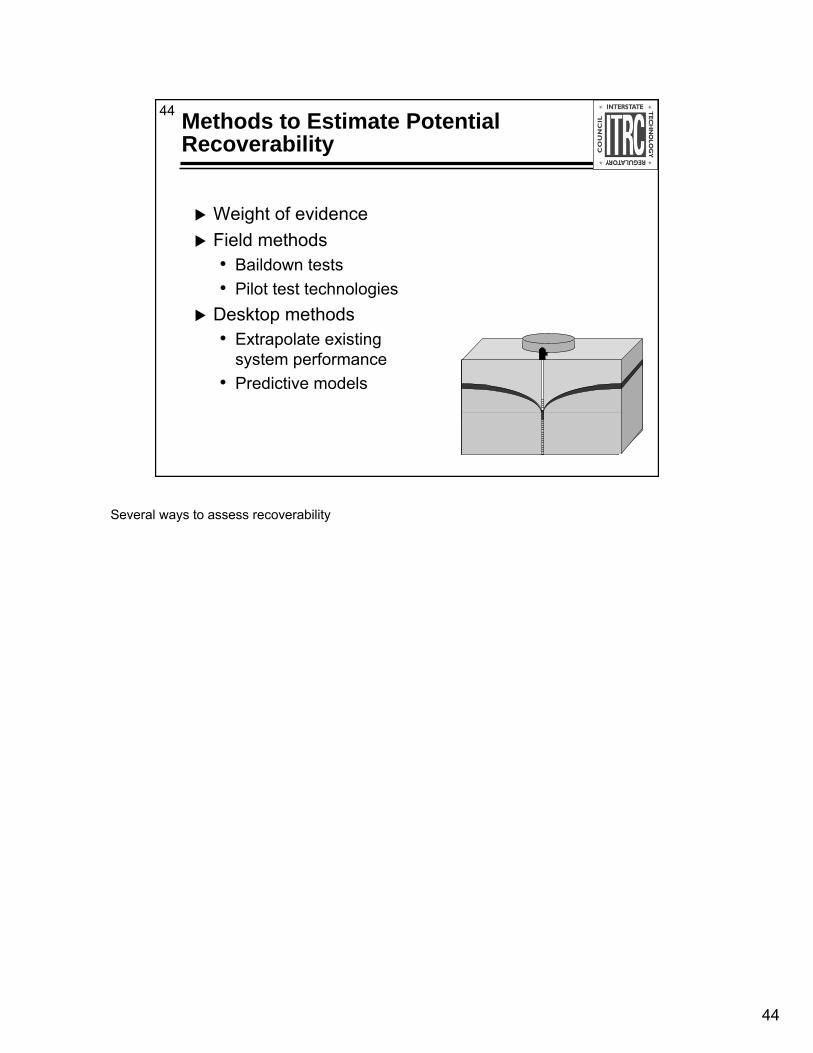
44 Methods to Estimate Potential Recoverability
Weight of evidenceField methods• Baildown tests• Pilot test technologies
Desktop methods• Extrapolate existing
system performance• Predictive models
Several ways to assess recoverability
45
45
Lines of Evidence to Assess Mobility
LNAPL typeLNAPL release dateLNAPL release volumeSoil typePlume stability
The weight of evidence approach can be very useful for evaluating mobility.
This topic is discussed in relatively new documents from the Massachusetts Licensed Site Professionals, as well as a recent guidance document from the Wisconsin Department of Commerce and Natural Resources.Wisconsin Department of Commerce & Wisconsin Department of Natural Resources Assessment Guidance for Sites with Residual Weathered Product (PUB-RR-787): http://prodoasext.dnr.wi.gov/inter1/pk_rr_doc_public$doc.QueryViewByKey?P_DOCUMENT_SEQ_NO=8990&Z_CHK=8923.Massachusetts Licensed Site Professionals LNAPLs and the Massachusetts Contingency Plan Part I:http://www.mass.gov/dep/cleanup/lnaplwg.htmMassachusetts Licensed Site Professionals LNAPLs and the Massachusetts Contingency Plan Part II:http://www.mass.gov/dep/cleanup/lnaplwg.htm
A spill of heavier oil such as No. 6 fuel is a simple example, where we know that this material is not mobile under typical subsurface temperatures.
A known release date or volume are also very useful indicators for potential recoverability, as it is generally well understood that LNAPL spills spread out relatively quickly, and reach of point of stability within a short period of time.
Plume stability can demonstrated fairly easily using historic monitoring data that has been collected consistently over time.
4646
46
Field Method – LNAPL Baildown Test
Huntley, 2000A Field Measurement Method For LNAPL Conductivity/Recovery
-100 0 100 200 300 400
Elapsed Time (minutes)
0123456789
101112
Elev
atio
n of
Sur
face
(ft)
Water
Piezometric Surface
Oil
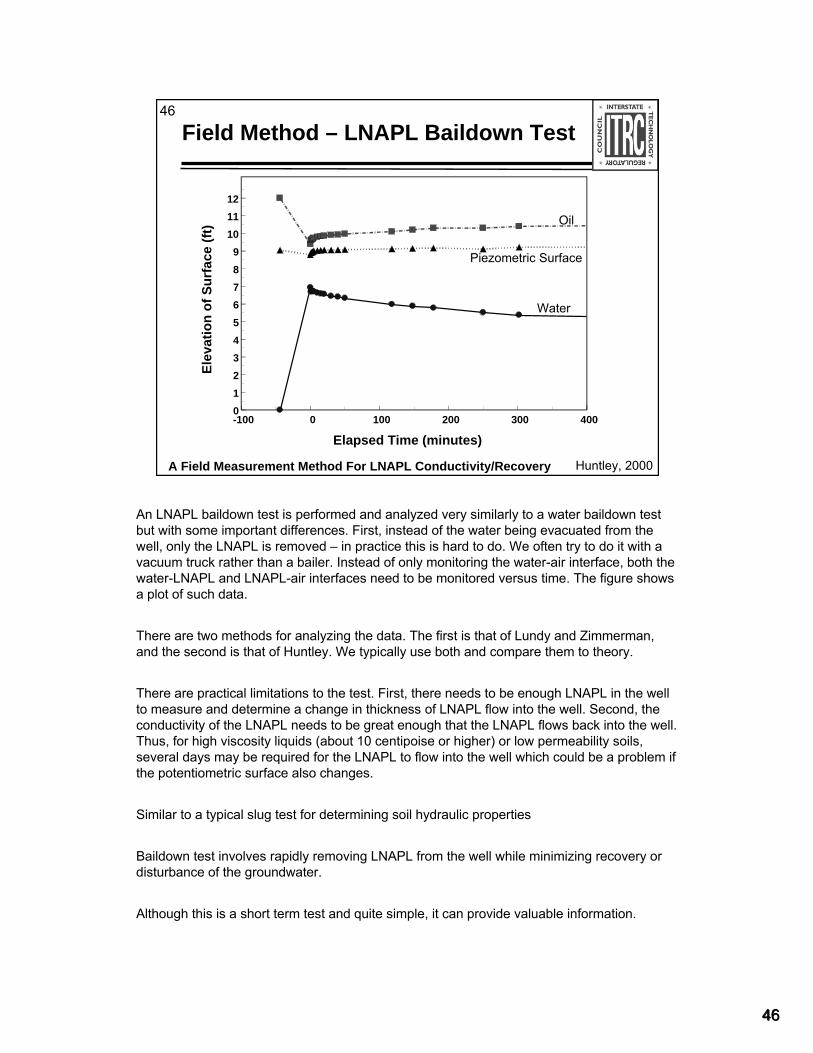
An LNAPL baildown test is performed and analyzed very similarly to a water baildown test but with some important differences. First, instead of the water being evacuated from the well, only the LNAPL is removed – in practice this is hard to do. We often try to do it with a vacuum truck rather than a bailer. Instead of only monitoring the water-air interface, both the water-LNAPL and LNAPL-air interfaces need to be monitored versus time. The figure shows a plot of such data.
There are two methods for analyzing the data. The first is that of Lundy and Zimmerman, and the second is that of Huntley. We typically use both and compare them to theory.
There are practical limitations to the test. First, there needs to be enough LNAPL in the well to measure and determine a change in thickness of LNAPL flow into the well. Second, the conductivity of the LNAPL needs to be great enough that the LNAPL flows back into the well. Thus, for high viscosity liquids (about 10 centipoise or higher) or low permeability soils, several days may be required for the LNAPL to flow into the well which could be a problem if the potentiometric surface also changes.
Similar to a typical slug test for determining soil hydraulic properties
Baildown test involves rapidly removing LNAPL from the well while minimizing recovery or disturbance of the groundwater.
Although this is a short term test and quite simple, it can provide valuable information.
47
47 Field Method – Baildown Test Solution
LNAPL Baildown Test Example; MW-6
K=0.001874 ft/minY0=0.43 ft
1.
Dis
plac
emen
t (ft)
0.1
Time (min)0. 90.4 180.8 Beckett and
Lyverse, 2002
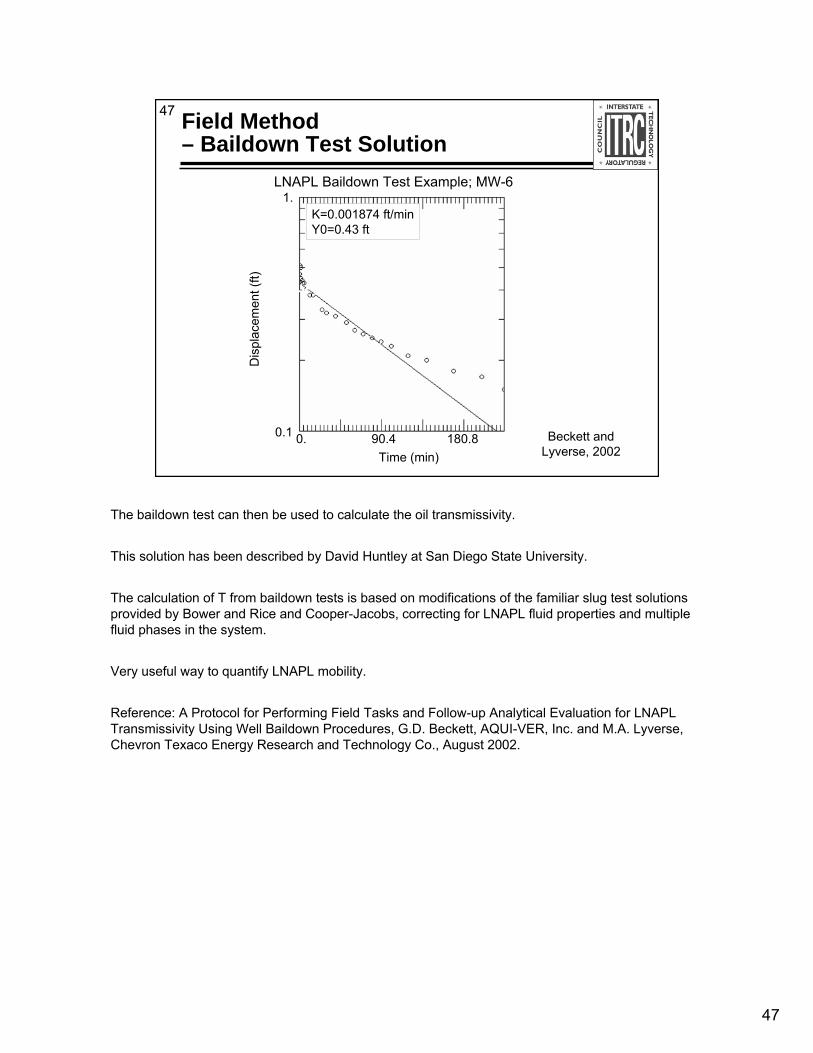
The baildown test can then be used to calculate the oil transmissivity.
This solution has been described by David Huntley at San Diego State University.
The calculation of T from baildown tests is based on modifications of the familiar slug test solutions provided by Bower and Rice and Cooper-Jacobs, correcting for LNAPL fluid properties and multiple fluid phases in the system.
Very useful way to quantify LNAPL mobility.
Reference: A Protocol for Performing Field Tasks and Follow-up Analytical Evaluation for LNAPL Transmissivity Using Well Baildown Procedures, G.D. Beckett, AQUI-VER, Inc. and M.A. Lyverse, Chevron Texaco Energy Research and Technology Co., August 2002.
48
48
Field Methods – Pilot/Pumping Tests
0.00
50.00
100.00
150.00
200.00
250.00
300.00
MW-1 MW-2 MW-3 MW-4 MW-5 MW-6 MW-7 MW-8 MW-9 MW-10 MW-11 MW-12 MW-13 MW-14 MW-15
Volu
me
Rec
over
ed (g
allo
ns)
0.0
1.0
2.0
3.0
4.0
5.0
6.0
7.0
8.0
9.0
10.0
Initi
al P
rodu
ct T
hick
ness
(fee
t)
Volume RecoveredInitial Product Thickness
48 Hour Product Skimming Test
Weathered Stoddard Weathered Middle DistillateWeathered Gasoline Gas/Naphtha Toluene
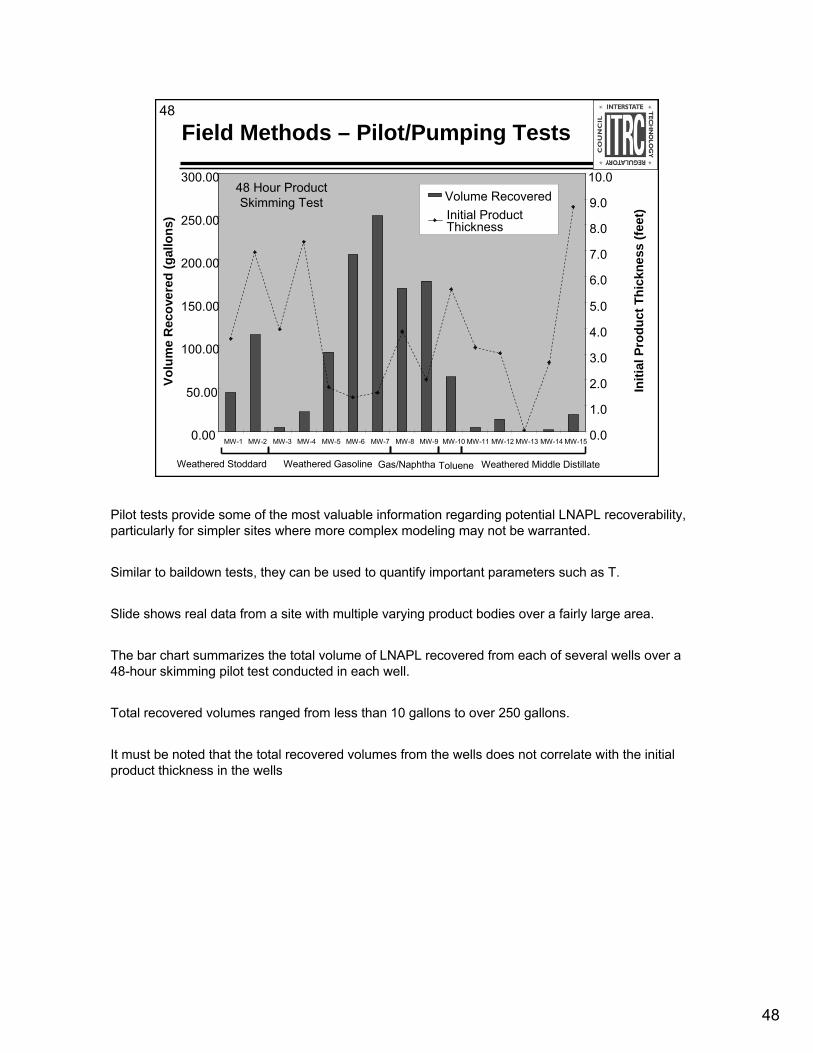
Pilot tests provide some of the most valuable information regarding potential LNAPL recoverability, particularly for simpler sites where more complex modeling may not be warranted.
Similar to baildown tests, they can be used to quantify important parameters such as T.
Slide shows real data from a site with multiple varying product bodies over a fairly large area.
The bar chart summarizes the total volume of LNAPL recovered from each of several wells over a 48-hour skimming pilot test conducted in each well.
Total recovered volumes ranged from less than 10 gallons to over 250 gallons.
It must be noted that the total recovered volumes from the wells does not correlate with the initial product thickness in the wells
49
49
LNAPL Saturation / Transmissivity
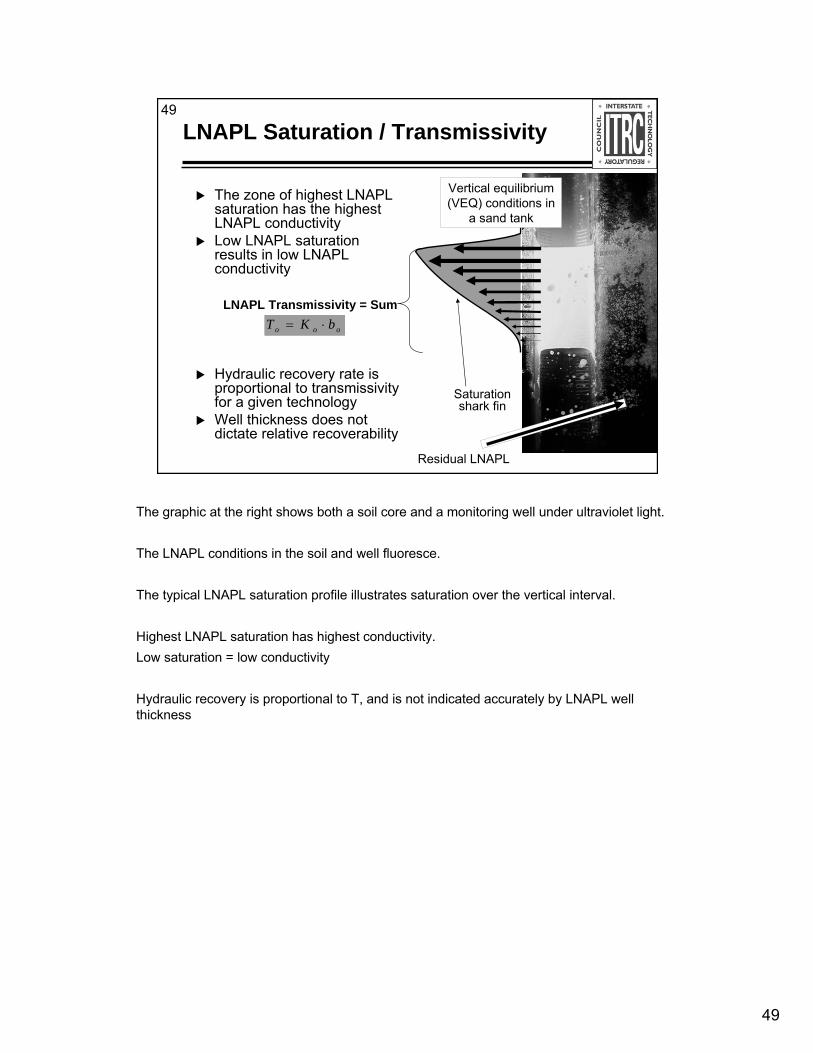
The zone of highest LNAPL saturation has the highest LNAPL conductivityLow LNAPL saturation results in low LNAPL conductivity
Hydraulic recovery rate is proportional to transmissivityfor a given technology Well thickness does not dictate relative recoverability
LNAPL Transmissivity = Sum
ooo bKT ⋅=
Saturation shark fin
Residual LNAPL
Vertical equilibrium (VEQ) conditions in
a sand tank
The graphic at the right shows both a soil core and a monitoring well under ultraviolet light.
The LNAPL conditions in the soil and well fluoresce.
The typical LNAPL saturation profile illustrates saturation over the vertical interval.
Highest LNAPL saturation has highest conductivity.Low saturation = low conductivity
Hydraulic recovery is proportional to T, and is not indicated accurately by LNAPL well thickness
50
50
LNAPL Thickness and Recovery Time
Still Recovering, expected to ultimately reach ~30 ft due to confined LNAPL(Atlantic Richfield Corporation, 2008)
0
5
10
15
20
25
30
35
1 10 100 1,000 10,000 100,000 1,000,000Elapsed Time (Minutes)
Rec
over
ed L
NA
PL T
hick
ness
(ft)
AMR/200-D
AMR/185-6
AMR/606-D
1 day 6 months2 weeks
1 year
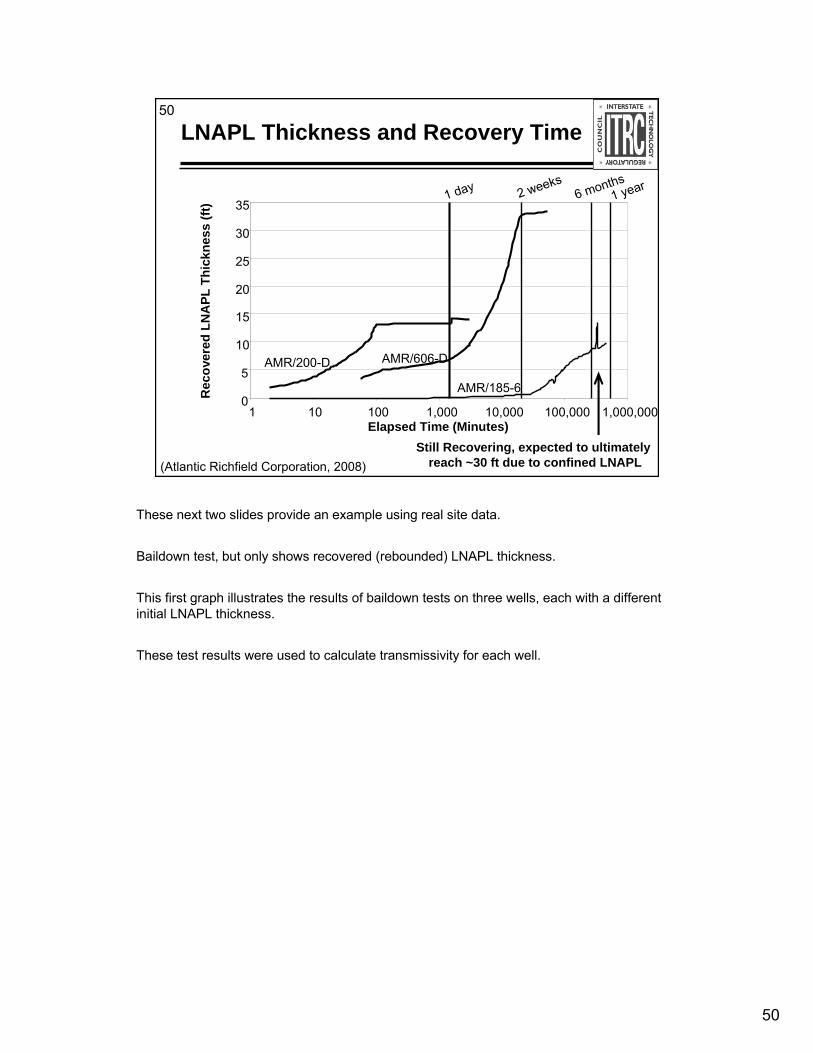
These next two slides provide an example using real site data.
Baildown test, but only shows recovered (rebounded) LNAPL thickness.
This first graph illustrates the results of baildown tests on three wells, each with a different initial LNAPL thickness.
These test results were used to calculate transmissivity for each well.
51
51 LNAPL Transmissivities and Thicknesses (in a Well)
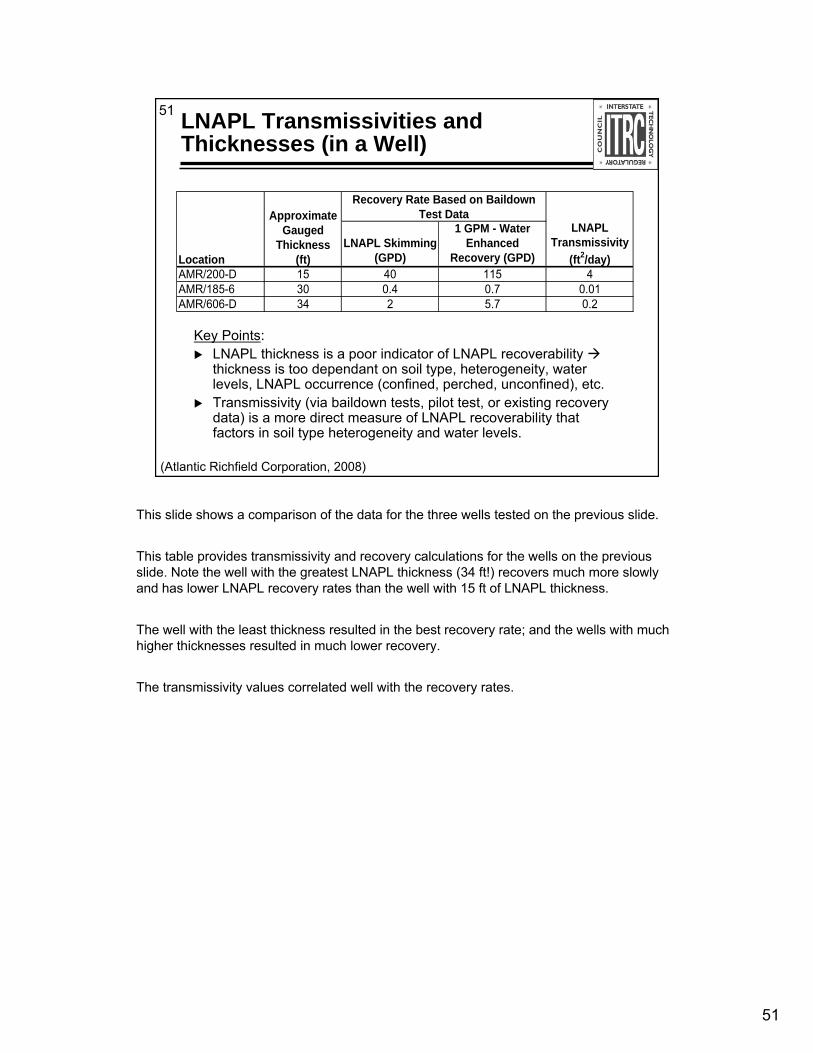
Key Points: LNAPL thickness is a poor indicator of LNAPL recoverability thickness is too dependant on soil type, heterogeneity, water levels, LNAPL occurrence (confined, perched, unconfined), etc.Transmissivity (via baildown tests, pilot test, or existing recovery data) is a more direct measure of LNAPL recoverability that factors in soil type heterogeneity and water levels.
LNAPL Skimming (GPD)
1 GPM - Water Enhanced
Recovery (GPD)AMR/200-D 15 40 115 4AMR/185-6 30 0.4 0.7 0.01AMR/606-D 34 2 5.7 0.2
Approximate Gauged
Thickness(ft)Location
Recovery Rate Based on Baildown Test Data
LNAPL Transmissivity
(ft2/day)
(Atlantic Richfield Corporation, 2008)
This slide shows a comparison of the data for the three wells tested on the previous slide.
This table provides transmissivity and recovery calculations for the wells on the previous slide. Note the well with the greatest LNAPL thickness (34 ft!) recovers much more slowly and has lower LNAPL recovery rates than the well with 15 ft of LNAPL thickness.
The well with the least thickness resulted in the best recovery rate; and the wells with much higher thicknesses resulted in much lower recovery.
The transmissivity values correlated well with the recovery rates.
52
52Desktop MethodsExtrapolate Existing System Performance
Example Cumulative Production Curve
Cum
ulat
ive
Prod
uctio
n (g
allo
ns)
1985 1989 1993 1997Time (Year)
0
100000
200000
300000
400000
500000
Decline Curve ModelProduction Data
(Sale, 1997; API, 2003)
Example Recovery Decline Curve
Cumulative Production (gallons)R
ecov
ery
rate
(gal
lons
/day
) 600
500
400
300
200
100
00 200,000 400,000
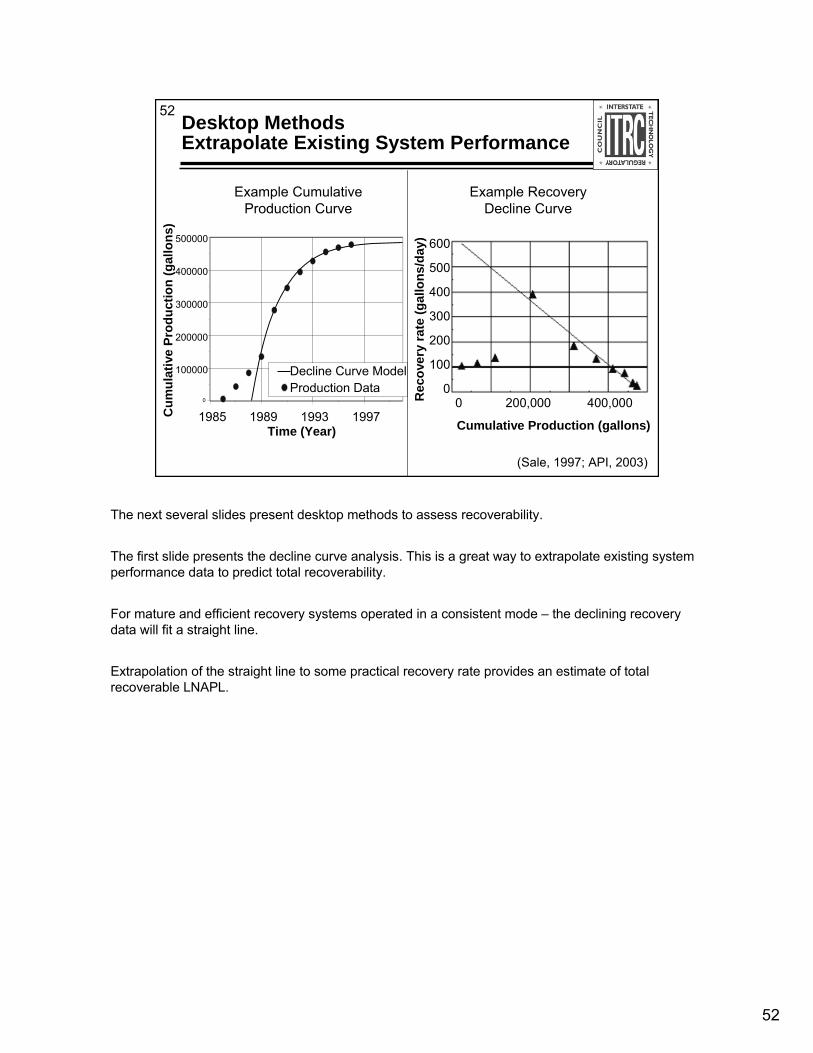
The next several slides present desktop methods to assess recoverability.
The first slide presents the decline curve analysis. This is a great way to extrapolate existing system performance data to predict total recoverability.
For mature and efficient recovery systems operated in a consistent mode – the declining recovery data will fit a straight line.
Extrapolation of the straight line to some practical recovery rate provides an estimate of total recoverable LNAPL.
53
53Desktop MethodsExtrapolate Existing System Performance
LNAPL recovery rate and cumulative recovery
Operating Time (days)
LNA
PL R
ecov
ery
Rat
e (g
allo
ns p
er d
ay)
0
20
40
60
80
100
120
0 20 40 60 80 100
120
140
160
180
200
2200
5001,0001,5002,000
2,5003,0003,5004,000
Cum
ulat
ive
LNA
PL R
ecov
ery
(gal
lons
)
Recovery RateCumulative Recovery
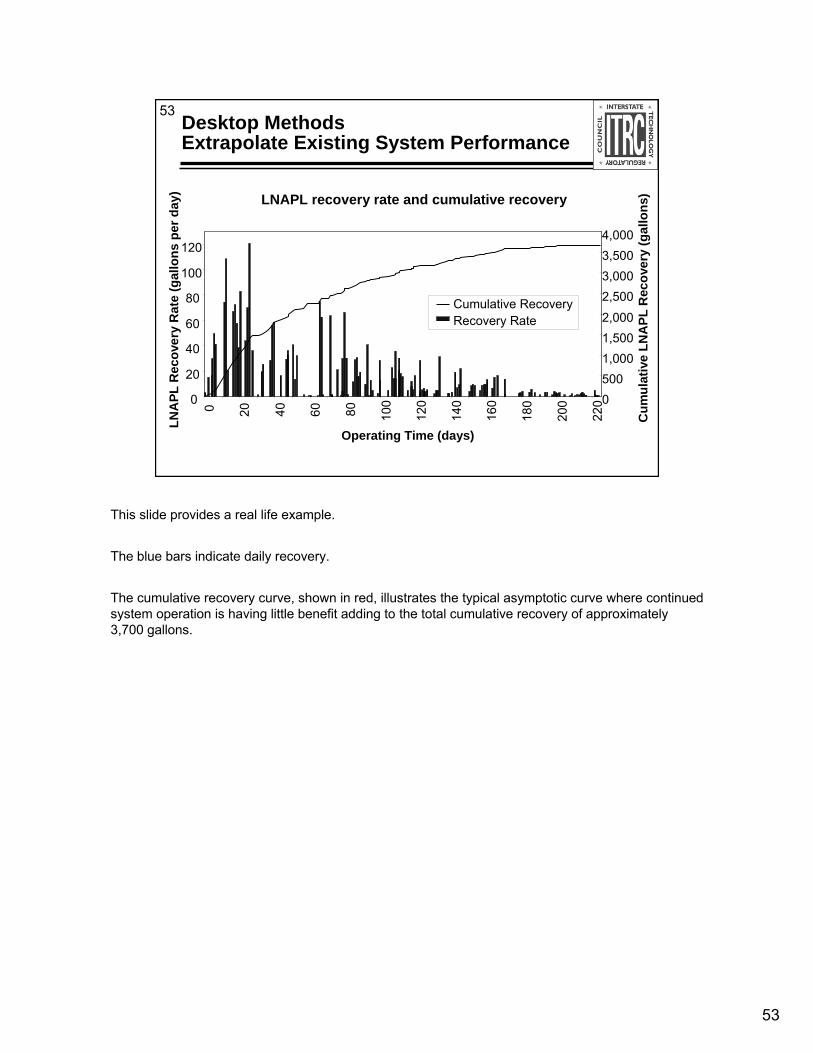
This slide provides a real life example.
The blue bars indicate daily recovery.
The cumulative recovery curve, shown in red, illustrates the typical asymptotic curve where continued system operation is having little benefit adding to the total cumulative recovery of approximately 3,700 gallons.
54
54Desktop MethodsExtrapolate Existing System Performance
LNAPL recovery decline curve analysis
y = -0.0213x + 79.007R2= 0.8767
0
10
20
30
40
50
600
500
1,00
0
1,50
0
2,00
0
2,50
0
3,00
0
3,50
0
4,00
0
Cumulative LNAPL Recovery (gallons)
LNA
PL R
ecov
ery
Rat
e (g
allo
ns p
er d
ay)
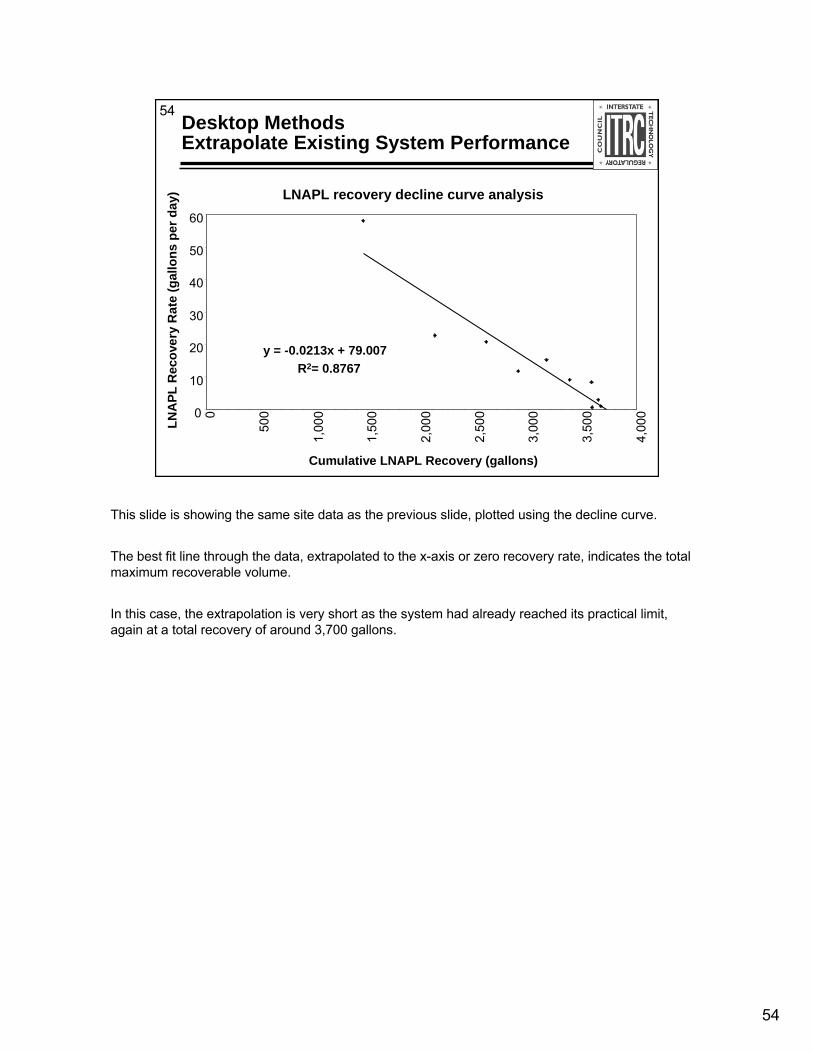
This slide is showing the same site data as the previous slide, plotted using the decline curve.
The best fit line through the data, extrapolated to the x-axis or zero recovery rate, indicates the total maximum recoverable volume.
In this case, the extrapolation is very short as the system had already reached its practical limit, again at a total recovery of around 3,700 gallons.
55
55Desktop MethodsPredictive Models for LNAPL Recovery
Analytical models (e.g., API LNAPL Distribution and Recovery Model (LDRM), and API Interactive LNAPL Guide)• 1-D analytical• Relatively easy to use and inexpensive• Good estimates (if properly applied)• API LNAPL parameters database
Numerical models (e.g., ARMOS, BIOSLURP, MAGNAS3, MARS, MOTRANS, MOVER)• 2-D, 3-D; consider need!• Can be headaches and expensive• May be, but not necessarily, more accurate
Links to these API resources are provided in the end of this training.
American Petroleum Institute Light Non-Aqueous Phase Liquid Resource Center:http://www.api.org/ehs/groundwater/lnapl/index.cfm. The LNAPL Resource Center contains manuals, software and other technical material to help you address cleanup of free-phase petroleum hydrocarbons in the shallow subsurface.
56
56Desktop MethodsPredictive Models for LNAPL Recovery
Models typically are based on vertical equilibrium (VEQ) model and utilize in well LNAPL thicknessesIf there is recovery or transmissivity measurement data, can try to “calibrate” model to match recoveriesModeling may be appropriate on more complex sites, may be useful as what-if predictor to evaluate different scenariosAdditional site specific data generally required as complexity of model increases
It is important to remember the underlying assumptions behind these model solutions.
As you learned in the Part 1 training, these are typically based on the vertical equilibrium (VEQ) model and utilize in well LNAPL thickness for an unconfined aquifer.
These models are typically appropriate for more complex sites and can be very useful to predict and help assess different recovery scenarios.
57
57 LNAPL Recovery – Model Predicted and Actual (5.2 years)
(Atlantic Richfield Corporation, 2008)
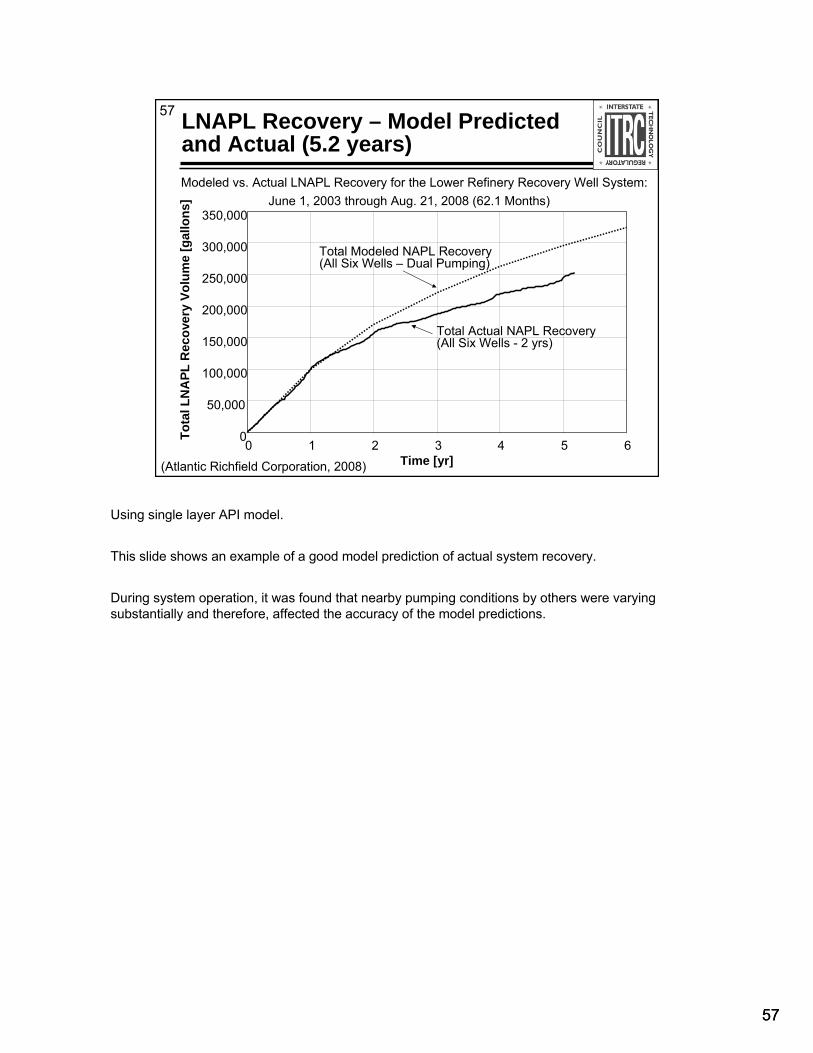
Modeled vs. Actual LNAPL Recovery for the Lower Refinery Recovery Well System: June 1, 2003 through Aug. 21, 2008 (62.1 Months)
0
50,000
100,000
150,000
200,000
250,000
300,000
350,000
0 1 2 3 4 5 6Time [yr]
Tota
l LN
APL
Rec
over
y Vo
lum
e [g
allo
ns]
Total Modeled NAPL Recovery (All Six Wells – Dual Pumping)
Total Actual NAPL Recovery (All Six Wells - 2 yrs)
Using single layer API model.
This slide shows an example of a good model prediction of actual system recovery.
During system operation, it was found that nearby pumping conditions by others were varying substantially and therefore, affected the accuracy of the model predictions.
57
58
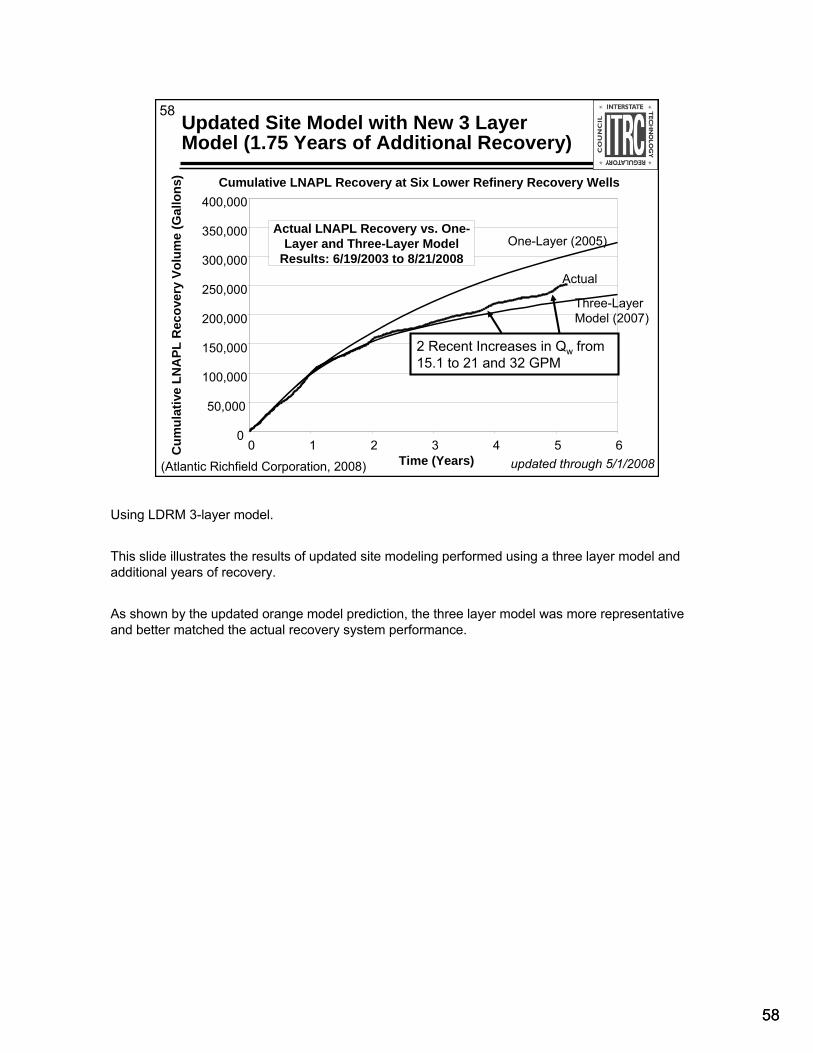
58Updated Site Model with New 3 Layer Model (1.75 Years of Additional Recovery)
(Atlantic Richfield Corporation, 2008)
Cumulative LNAPL Recovery at Six Lower Refinery Recovery Wells
Actual LNAPL Recovery vs. One-Layer and Three-Layer Model
Results: 6/19/2003 to 8/21/2008
0
50,000
100,000
150,000
200,000
250,000
300,000
350,000
400,000
0 1 2 3 4 5 6Time (Years)
Cum
ulat
ive
LNA
PL R
ecov
ery
Volu
me
(Gal
lons
)
One-Layer (2005)
Three-Layer Model (2007)
Actual
updated through 5/1/2008
2 Recent Increases in Qw from 15.1 to 21 and 32 GPM
Using LDRM 3-layer model.
This slide illustrates the results of updated site modeling performed using a three layer model and additional years of recovery.
As shown by the updated orange model prediction, the three layer model was more representative and better matched the actual recovery system performance.
58
59
59
Predictive Models – Caution Warning
What is the uncertainty in the predictive models?• Vertical equilibrium?• Hydrogeologic properties• Spatial and vertical heterogeneity
GeologicTexture/capillary propertiesFluid properties
• Residual saturation• Radii of capture and influence• Ideal versus real wells
Key Point: Many of these lead to overestimating volume and recovery rate, and underestimating time of recovery
The user must assess the uncertainty behind the modeled solutions.
Even when done very carefully, models should be considered approximations
6060
60 Case Study:Recoverability Analysis Overview
Closed refinery RCRA site• 250 acres underlain by hydrocarbons
180 acres of LNAPL with potential to migrate (evaluate with modeling)Remedy decision: LNAPL recovery is required• Where LNAPL with the potential to migrate exists within 300
ft of downgradient boundary• Where LNAPL is a source of benzene to groundwater
Hydraulic conductivities 240-350 feet/dayDTW 8-12 feetGasoline, diesel, lube oil, and compositeCurrently, 300,000 gallons per year of recovery
Case 4 is the development of a recovery plan for LNAPL at a closed refinery that has reuse potential. It is a RCRA site of 250 acres underlain by LNAPL some of which has a very low conductivity and some of it is at residual saturation. There are about 180 acres of LNAPL that may have the potential to migrate.
The question was how to define “potential to migrate”.
The Remedy Decision for the site is that LNAPL recovery is required when: LNAPL with the potential to migrate exists within 300 ft of downgradient boundary – the question is how to define “potential to migrate”. This will be explored using our new understanding. The other Remedy Decision is when LNAPL is a source of benzene to groundwater; this will not be explored here because the subject is beyond this training.
6161
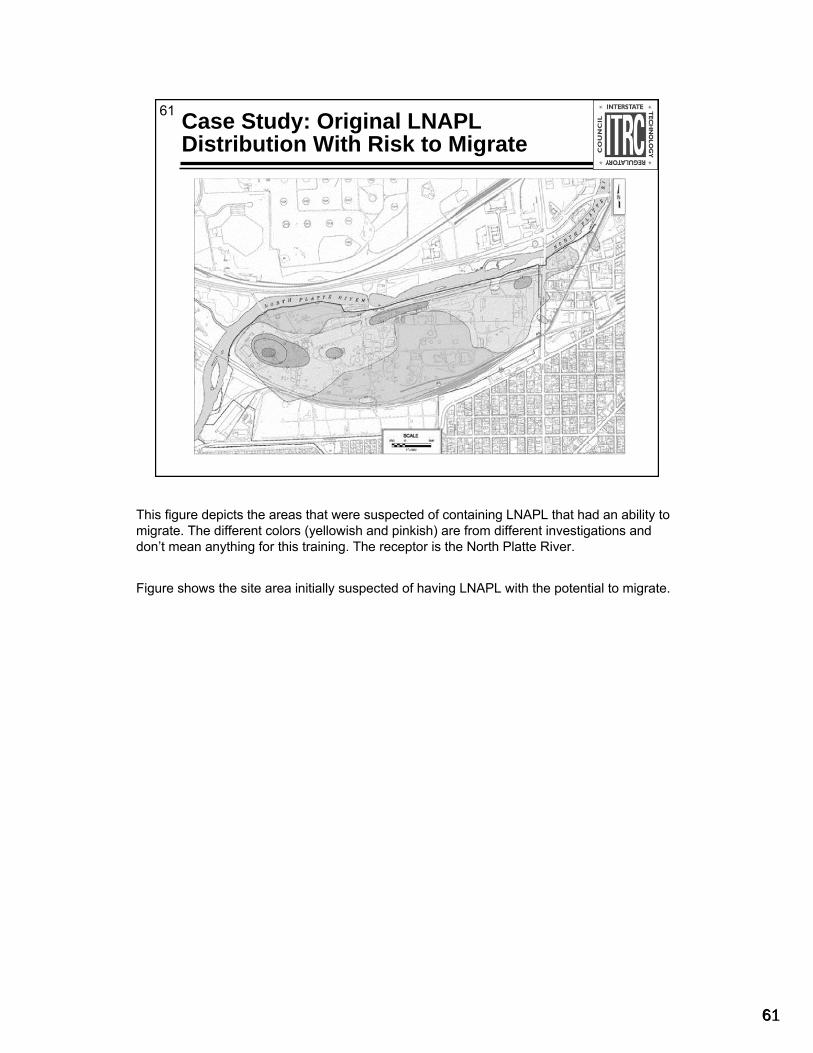
61 Case Study: Original LNAPL Distribution With Risk to Migrate
This figure depicts the areas that were suspected of containing LNAPL that had an ability to migrate. The different colors (yellowish and pinkish) are from different investigations and don’t mean anything for this training. The receptor is the North Platte River.
Figure shows the site area initially suspected of having LNAPL with the potential to migrate.
6262
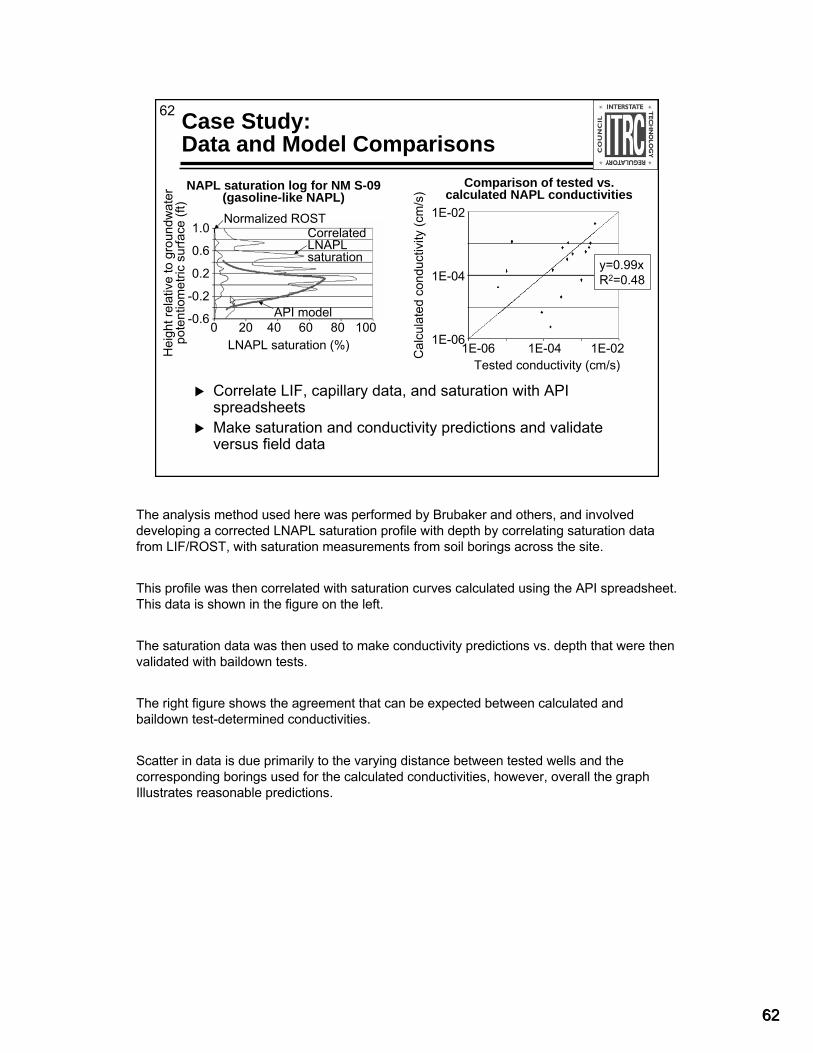
62 Case Study:Data and Model Comparisons
Correlate LIF, capillary data, and saturation with API spreadsheetsMake saturation and conductivity predictions and validate versus field data
NAPL saturation log for NM S-09 (gasoline-like NAPL)
Comparison of tested vs. calculated NAPL conductivities
Hei
ght r
elat
ive
to g
roun
dwat
er
pote
ntio
met
ricsu
rface
(ft)
LNAPL saturation (%)0 20 40 60 80 100
1.0
0.6
0.2
-0.2
-0.6 API model
Correlated LNAPL saturation
Normalized ROST
Tested conductivity (cm/s)
Cal
cula
ted
cond
uctiv
ity (c
m/s
)
y=0.99xR2=0.48
1E-02
1E-04
1E-061E-06 1E-04 1E-02
The analysis method used here was performed by Brubaker and others, and involved developing a corrected LNAPL saturation profile with depth by correlating saturation data from LIF/ROST, with saturation measurements from soil borings across the site.
This profile was then correlated with saturation curves calculated using the API spreadsheet. This data is shown in the figure on the left.
The saturation data was then used to make conductivity predictions vs. depth that were then validated with baildown tests.
The right figure shows the agreement that can be expected between calculated and baildown test-determined conductivities.
Scatter in data is due primarily to the varying distance between tested wells and the corresponding borings used for the calculated conductivities, however, overall the graph Illustrates reasonable predictions.
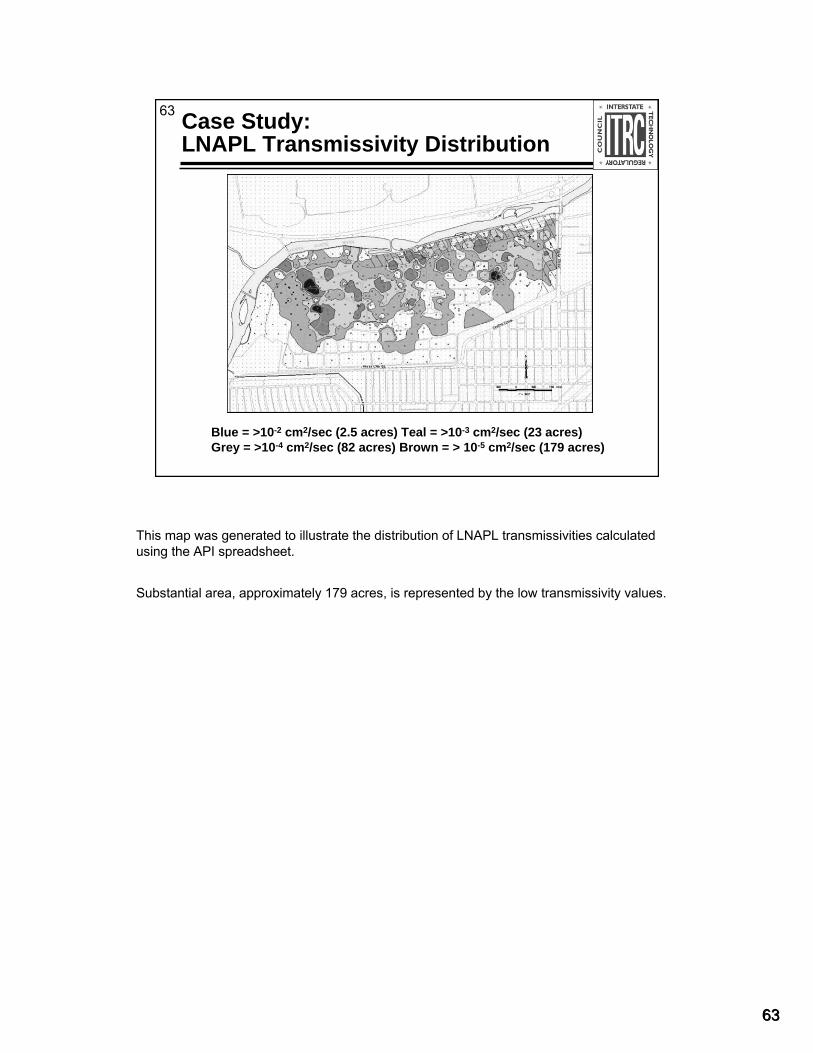
6363
63 Case Study:LNAPL Transmissivity Distribution
Blue = >10-2 cm2/sec (2.5 acres) Teal = >10-3 cm2/sec (23 acres)Grey = >10-4 cm2/sec (82 acres) Brown = > 10-5 cm2/sec (179 acres)
This map was generated to illustrate the distribution of LNAPL transmissivities calculated using the API spreadsheet.
Substantial area, approximately 179 acres, is represented by the low transmissivity values.
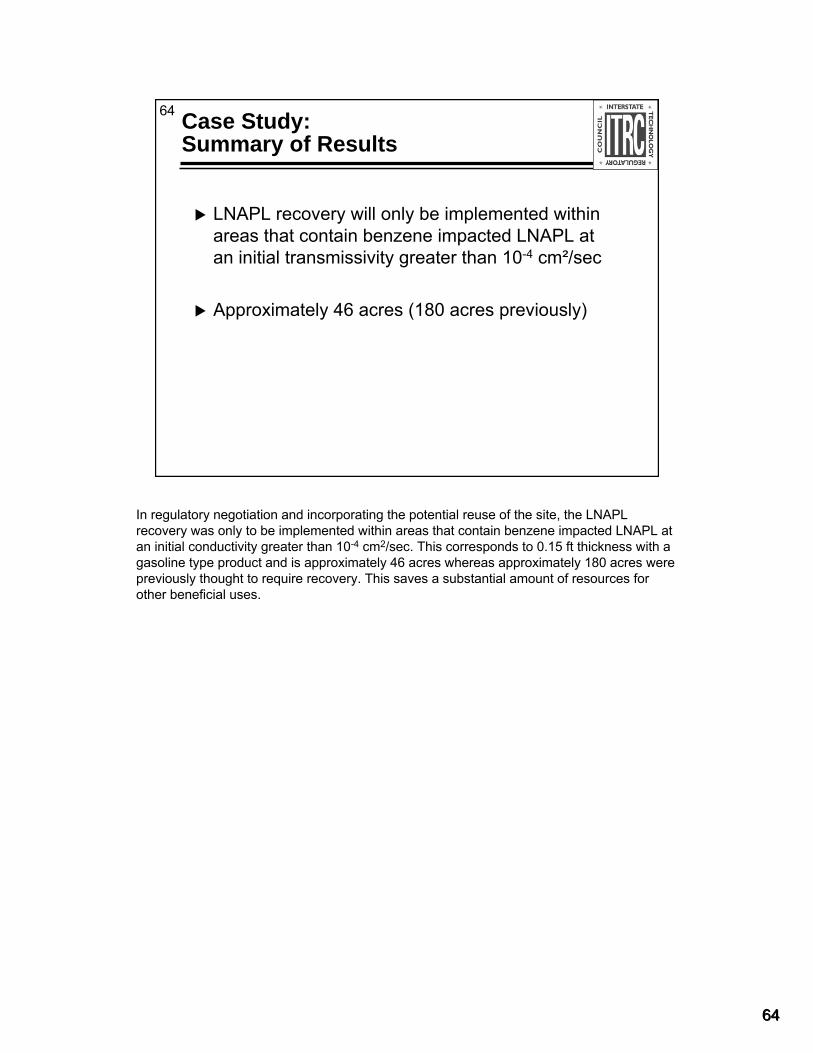
6464
64 Case Study: Summary of Results
LNAPL recovery will only be implemented within areas that contain benzene impacted LNAPL at an initial transmissivity greater than 10-4 cm²/sec
Approximately 46 acres (180 acres previously)
In regulatory negotiation and incorporating the potential reuse of the site, the LNAPL recovery was only to be implemented within areas that contain benzene impacted LNAPL at an initial conductivity greater than 10-4 cm2/sec. This corresponds to 0.15 ft thickness with a gasoline type product and is approximately 46 acres whereas approximately 180 acres were previously thought to require recovery. This saves a substantial amount of resources for other beneficial uses.
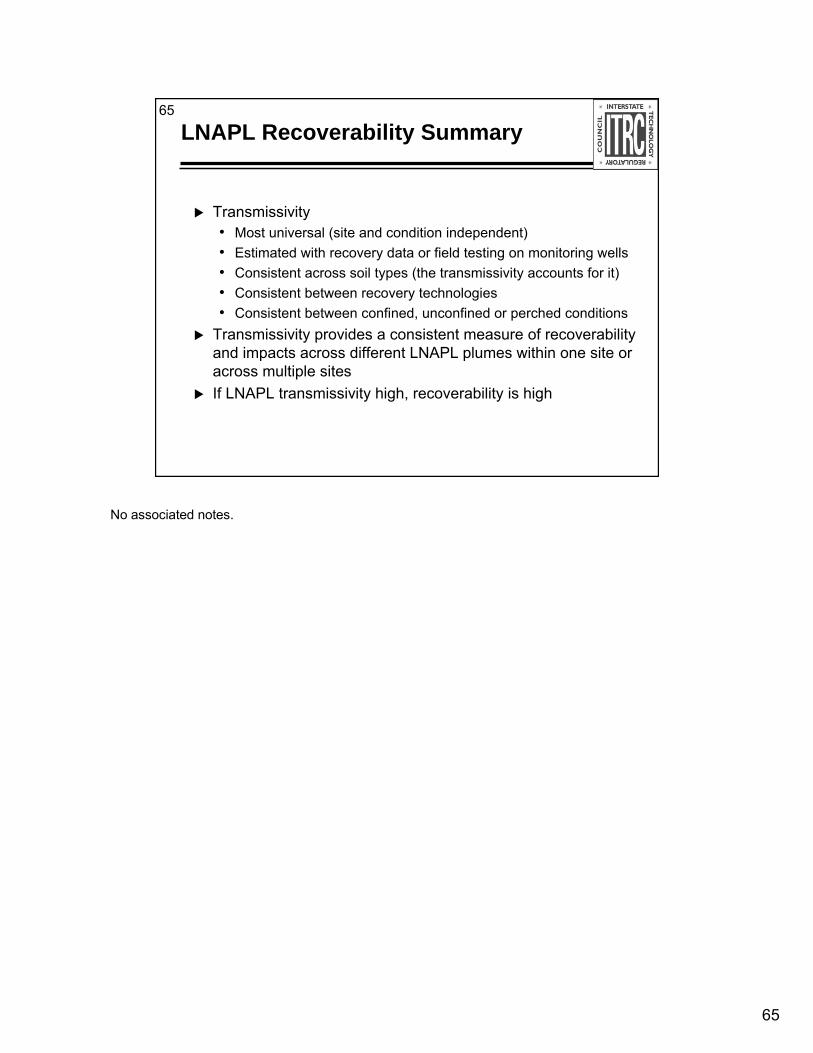
65
65
LNAPL Recoverability Summary
Transmissivity• Most universal (site and condition independent) • Estimated with recovery data or field testing on monitoring wells• Consistent across soil types (the transmissivity accounts for it)• Consistent between recovery technologies • Consistent between confined, unconfined or perched conditions
Transmissivity provides a consistent measure of recoverability and impacts across different LNAPL plumes within one site or across multiple sitesIf LNAPL transmissivity high, recoverability is high
No associated notes.
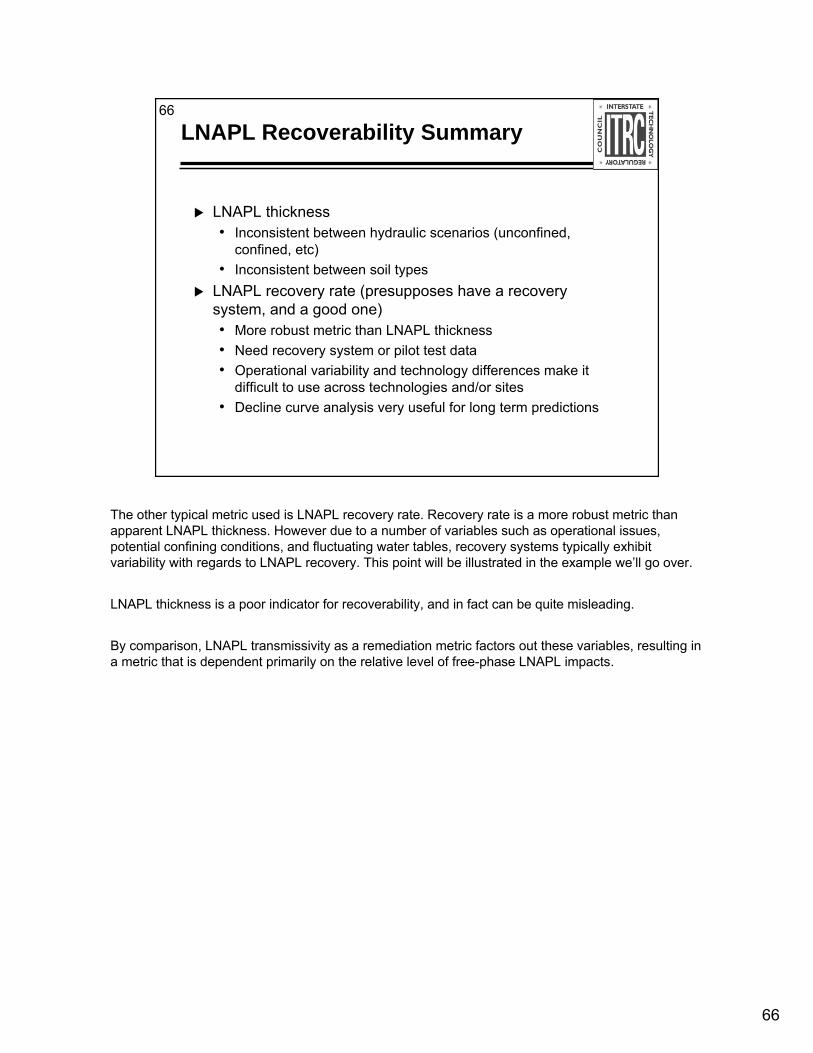
66
66
LNAPL Recoverability Summary
LNAPL thickness • Inconsistent between hydraulic scenarios (unconfined,
confined, etc)• Inconsistent between soil types
LNAPL recovery rate (presupposes have a recovery system, and a good one)• More robust metric than LNAPL thickness• Need recovery system or pilot test data • Operational variability and technology differences make it
difficult to use across technologies and/or sites• Decline curve analysis very useful for long term predictions
The other typical metric used is LNAPL recovery rate. Recovery rate is a more robust metric than apparent LNAPL thickness. However due to a number of variables such as operational issues, potential confining conditions, and fluctuating water tables, recovery systems typically exhibit variability with regards to LNAPL recovery. This point will be illustrated in the example we’ll go over.
LNAPL thickness is a poor indicator for recoverability, and in fact can be quite misleading.
By comparison, LNAPL transmissivity as a remediation metric factors out these variables, resulting in a metric that is dependent primarily on the relative level of free-phase LNAPL impacts.
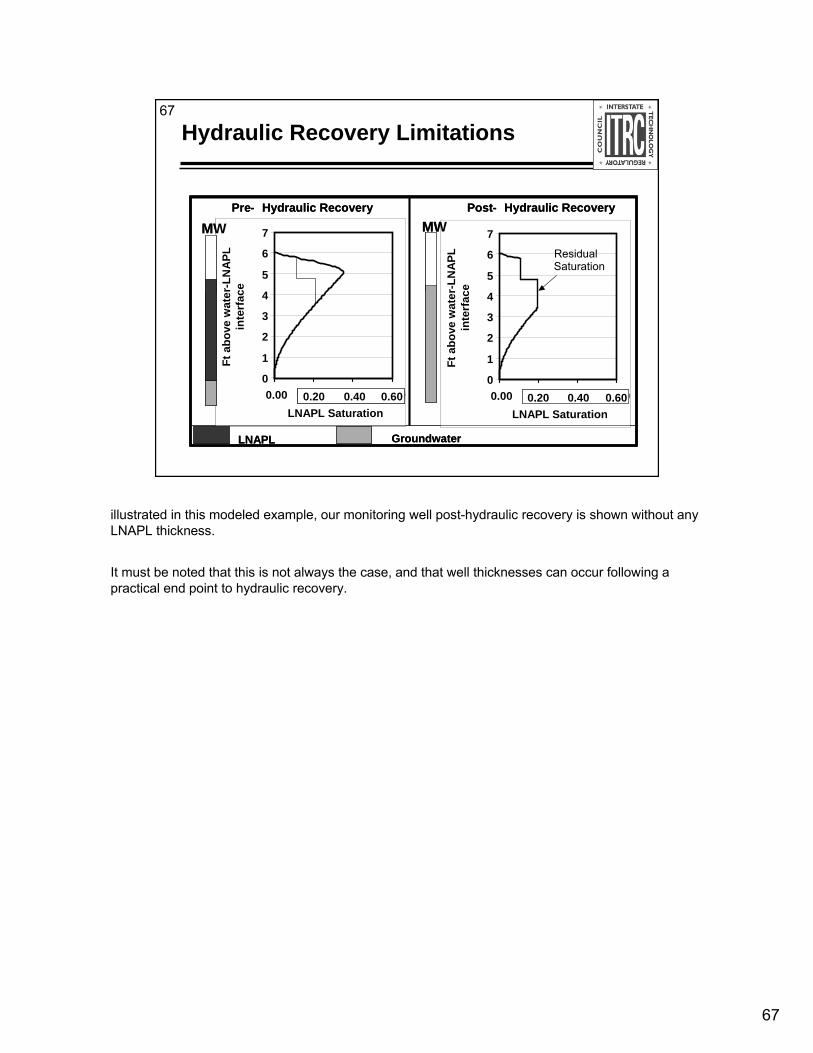
67
67
m m
0.3
0.6
0.9
1.2
1.5
1.8
2.1
0.00.3
0.6
0.9
1.2
1.5
1.8
2.1
0.0
Hydraulic Recovery Limitations
0
1
2
3
4
5
6
7
0.00 0.10 0.20 0.30LNAPL Saturation
Ft a
bove
wat
er-L
NAP
L in
terf
ace
0.20 0.40 0.600
1
2
3
4
5
6
7
0.00 0.10 0.20 0.30LNAPL Saturation
Ft a
bove
wat
er-L
NAP
L in
terf
ace
0.20 0.40 0.60
MW MW
LNAPL Groundwater
Pre- Hydraulic Recovery Post- Hydraulic Recovery
Residual Saturation
0
1
2
3
4
5
6
7
0.00 0.10 0.20 0.30LNAPL Saturation
Ft a
bove
wat
er-L
NAP
L in
terf
ace
0.20 0.40 0.600
1
2
3
4
5
6
7
0.00 0.10 0.20 0.30LNAPL Saturation
Ft a
bove
wat
er-L
NAP
L in
terf
ace
0.20 0.40 0.600.20 0.40 0.600
1
2
3
4
5
6
7
0.00 0.10 0.20 0.30LNAPL Saturation
Ft a
bove
wat
er-L
NAP
L in
terf
ace
0.20 0.40 0.600.20 0.40 0.60
MW MW
LNAPL Groundwater
Pre- Hydraulic Recovery Post- Hydraulic Recovery
Residual Saturation
illustrated in this modeled example, our monitoring well post-hydraulic recovery is shown without any LNAPL thickness.
It must be noted that this is not always the case, and that well thicknesses can occur following a practical end point to hydraulic recovery.
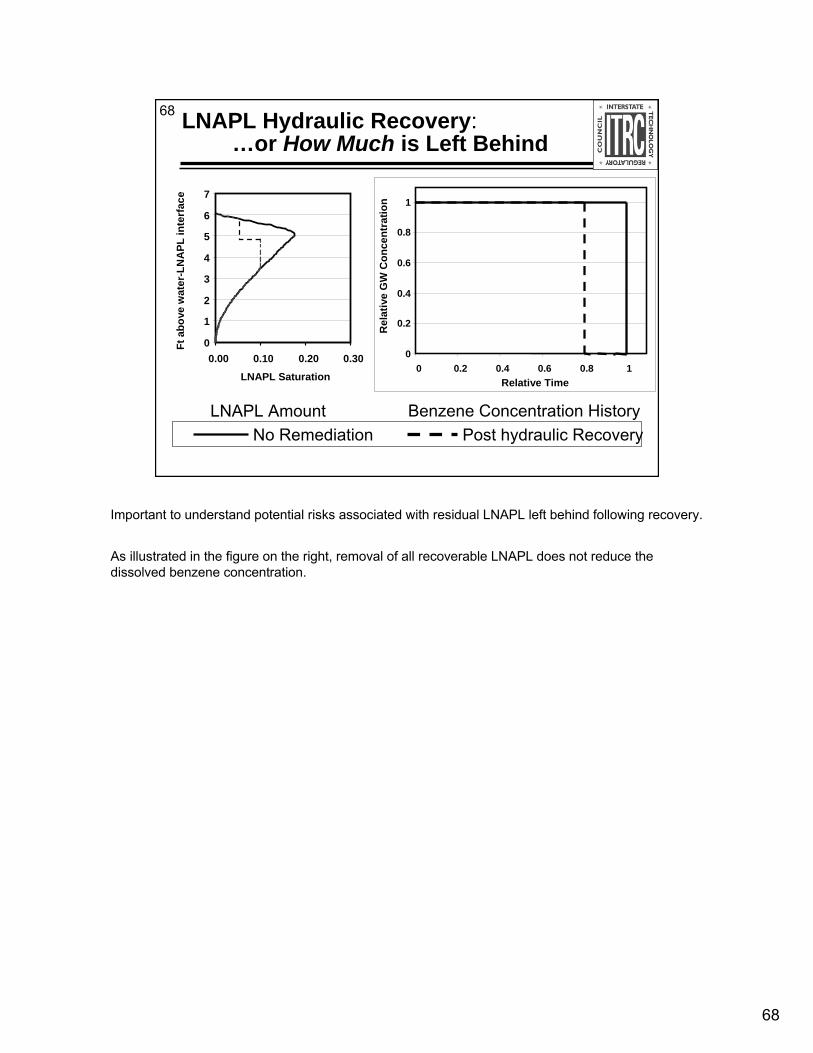
68
68 LNAPL Hydraulic Recovery: …or How Much is Left Behind
LNAPL Amount Benzene Concentration HistoryPost hydraulic RecoveryNo Remediation
0
0.2
0.4
0.6
0.8
1
0 0.2 0.4 0.6 0.8 1Relative Time
Rel
ativ
e G
W C
once
ntra
tion
0
1
2
3
4
5
6
7
0.00 0.10 0.20 0.30
LNAPL Saturation
Ft a
bove
wat
er-L
NA
PL in
terf
ace
Important to understand potential risks associated with residual LNAPL left behind following recovery.
As illustrated in the figure on the right, removal of all recoverable LNAPL does not reduce the dissolved benzene concentration.
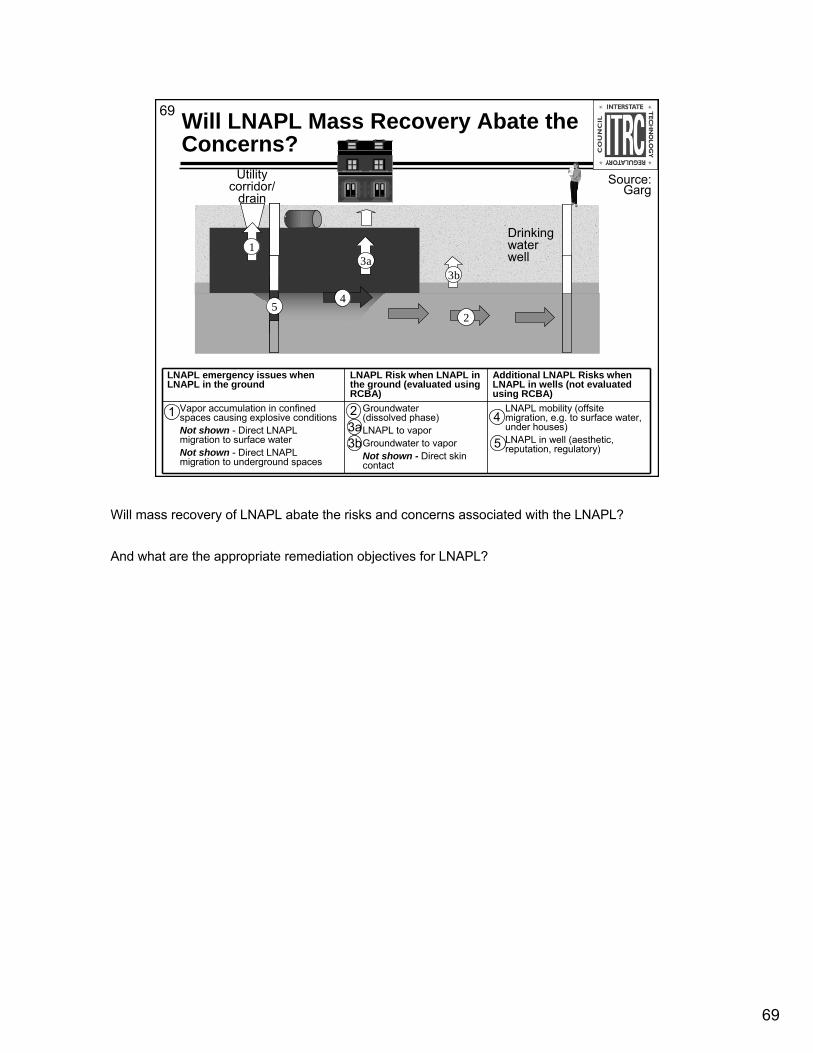
69
69 Will LNAPL Mass Recovery Abate the Concerns?
LNAPL emergency issues when LNAPL in the ground
LNAPL Risk when LNAPL in the ground (evaluated using RCBA)
Additional LNAPL Risks when LNAPL in wells (not evaluated using RCBA)
Vapor accumulation in confined spaces causing explosive conditionsNot shown - Direct LNAPL migration to surface waterNot shown - Direct LNAPL migration to underground spaces
Groundwater(dissolved phase)LNAPL to vaporGroundwater to vaporNot shown - Direct skin contact
LNAPL mobility (offsite migration, e.g. to surface water, under houses)LNAPL in well (aesthetic, reputation, regulatory)
11 2223a23b
14
15
Source: Garg
Utility corridor/
drain
3a
2
3b
45
13a
2
3b
45
1Drinking water well
Will mass recovery of LNAPL abate the risks and concerns associated with the LNAPL?
And what are the appropriate remediation objectives for LNAPL?
70
70
LNAPL Training Part 2
Introduction and Part 1 summaryLNAPL conceptual site modelLNAPL site characterizationQ&AHydraulic recovery evaluation and limitsLNAPL remedial objectives and goalsIntroduction to LNAPL remedial technologiesQ&A
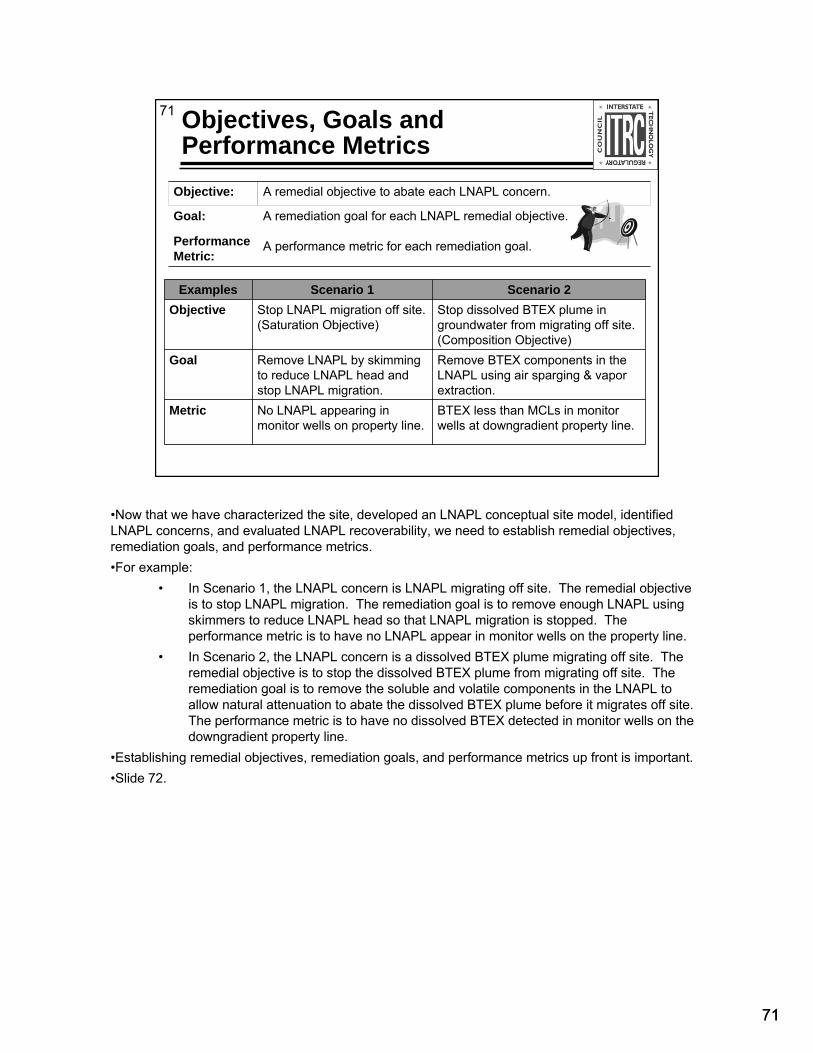
71
71 Objectives, Goals and Performance Metrics
Objective: A remedial objective to abate each LNAPL concern.
Goal:
Performance Metric:
A remediation goal for each LNAPL remedial objective.
A performance metric for each remediation goal.
Examples Scenario 1 Scenario 2Objective Stop LNAPL migration off site.
(Saturation Objective)Stop dissolved BTEX plume in groundwater from migrating off site.(Composition Objective)
Goal Remove LNAPL by skimming to reduce LNAPL head and stop LNAPL migration.
Remove BTEX components in the LNAPL using air sparging & vapor extraction.
Metric No LNAPL appearing in monitor wells on property line.
BTEX less than MCLs in monitor wells at downgradient property line.
•Now that we have characterized the site, developed an LNAPL conceptual site model, identified LNAPL concerns, and evaluated LNAPL recoverability, we need to establish remedial objectives, remediation goals, and performance metrics.•For example:
• In Scenario 1, the LNAPL concern is LNAPL migrating off site. The remedial objective is to stop LNAPL migration. The remediation goal is to remove enough LNAPL using skimmers to reduce LNAPL head so that LNAPL migration is stopped. The performance metric is to have no LNAPL appear in monitor wells on the property line.
• In Scenario 2, the LNAPL concern is a dissolved BTEX plume migrating off site. The remedial objective is to stop the dissolved BTEX plume from migrating off site. The remediation goal is to remove the soluble and volatile components in the LNAPL to allow natural attenuation to abate the dissolved BTEX plume before it migrates off site. The performance metric is to have no dissolved BTEX detected in monitor wells on the downgradient property line.
•Establishing remedial objectives, remediation goals, and performance metrics up front is important.•Slide 72.
71

72
72 The Importance of Establishing a Long-Term Vision and Goals
Start with the end in mindGet stakeholders on the same pageGet stakeholders to agree on what is realistically achievableDiscuss remedial objectives and remediation goalsLong-term vision may be revised if goals are later found not to be achievableEPA, March 2005, “A Decision-Making Framework for Cleanup of Sites Impacted with LNAPL” (EPA 542-R-04-011)
No associated notes.
72
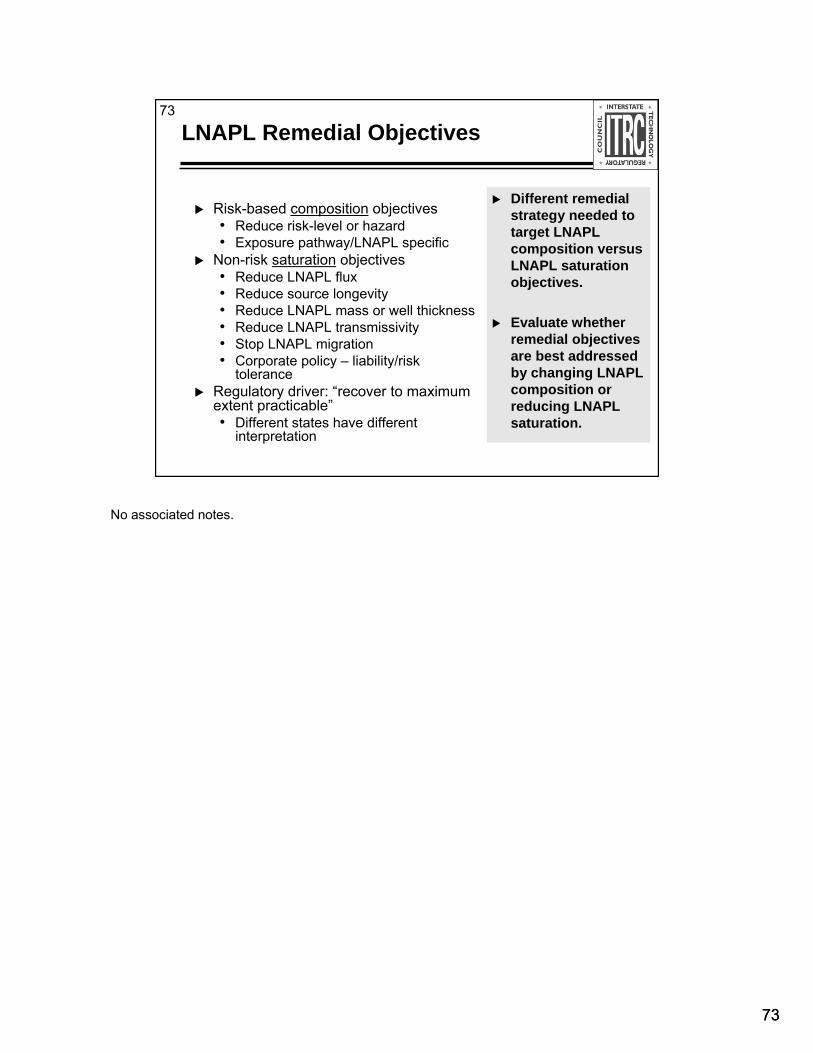
7373
73
LNAPL Remedial Objectives
Risk-based composition objectives • Reduce risk-level or hazard• Exposure pathway/LNAPL specific
Non-risk saturation objectives• Reduce LNAPL flux• Reduce source longevity• Reduce LNAPL mass or well thickness• Reduce LNAPL transmissivity• Stop LNAPL migration• Corporate policy – liability/risk
toleranceRegulatory driver: “recover to maximum extent practicable”• Different states have different
interpretation
Different remedial strategy needed to target LNAPL composition versus LNAPL saturation objectives.
Evaluate whether remedial objectives are best addressed by changing LNAPL composition or reducing LNAPL saturation.
No associated notes.

74
74Remediation Goals Provide the Measure ofPerformance
Remediation Goals:Restate the remedial objective in terms of an LNAPL remedial technologyEstablish endpoints at which active remediation systems can be shut downMatch remediation goals to performance metrics to measure the progress ofthe remedial technologySite and project specific
No associated notes.
74
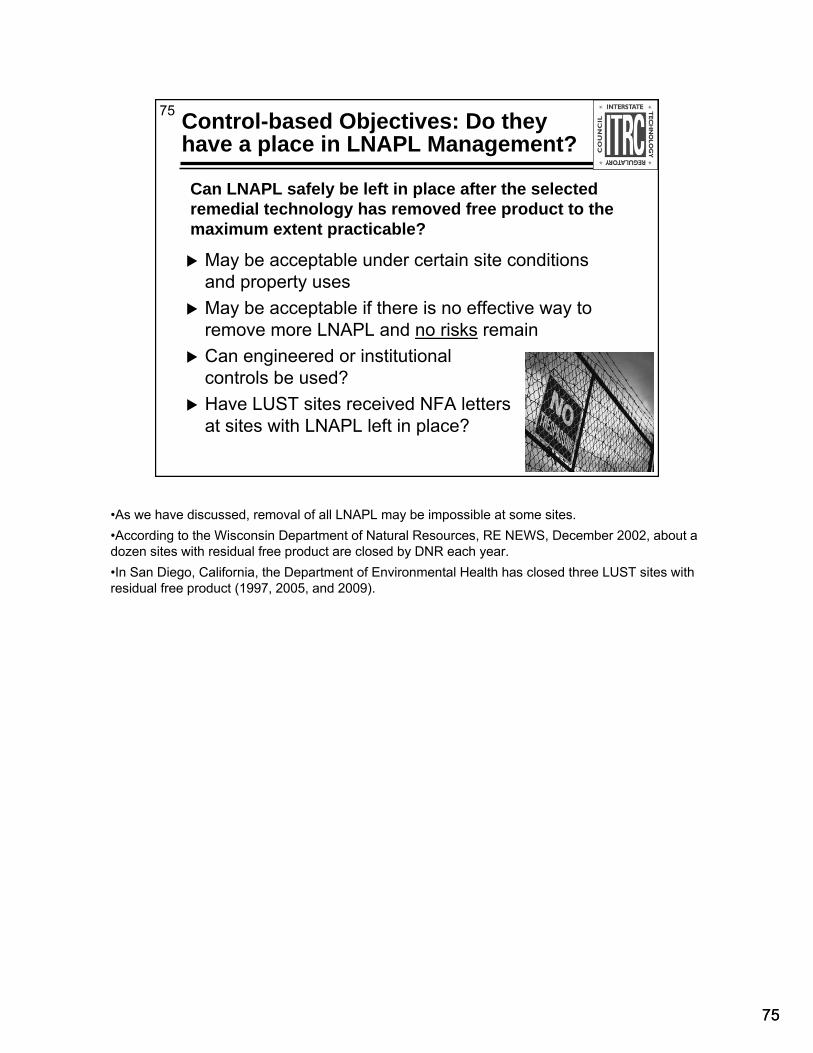
75
75 Control-based Objectives: Do they have a place in LNAPL Management?
May be acceptable under certain site conditions and property usesMay be acceptable if there is no effective way toremove more LNAPL and no risks remainCan engineered or institutionalcontrols be used?Have LUST sites received NFA lettersat sites with LNAPL left in place?
Can LNAPL safely be left in place after the selected remedial technology has removed free product to the maximum extent practicable?
•As we have discussed, removal of all LNAPL may be impossible at some sites.•According to the Wisconsin Department of Natural Resources, RE NEWS, December 2002, about a dozen sites with residual free product are closed by DNR each year.•In San Diego, California, the Department of Environmental Health has closed three LUST sites with residual free product (1997, 2005, and 2009).
75
76
76 Pioneering: Examples of Setting Objectives and Goals
ITRC: Evaluating LNAPL Remedial Technologies for Achieving Project Goals (December 2009)ITRC: Evaluating Natural Source Zone Depletion at Sites with LNAPL (April 2009)Risk-Based NAPL Management, TCEQ RG-366/ TRRP-32 (2008)Standard Guide for Development of Conceptual Site Models and Remediation Strategies for Light Nonaqueous-Phase Liquids Release to the Subsurface, ASTM E 2531-06 (2007)A Decision-Making Framework for Cleanup of Sites Impacted with Light Non-Aqueous Phase Liquids (LNAPL), USEPA OSWER 542-R-04-011 (2005)
ASTM – American Society for Testing and Materials OSWER – Office of Solid Waste and Emergency Response TCEQ – Texas Commission on Environmental Quality
No associated notes.
76

77
77
LNAPL Training Part 2
Introduction and Part 1 summaryLNAPL conceptual site modelLNAPL site characterizationQ&AHydraulic recovery evaluation and limitsLNAPL management objectives and goalsIntroduction to LNAPL remedial technologiesQ&A
No associated notes.
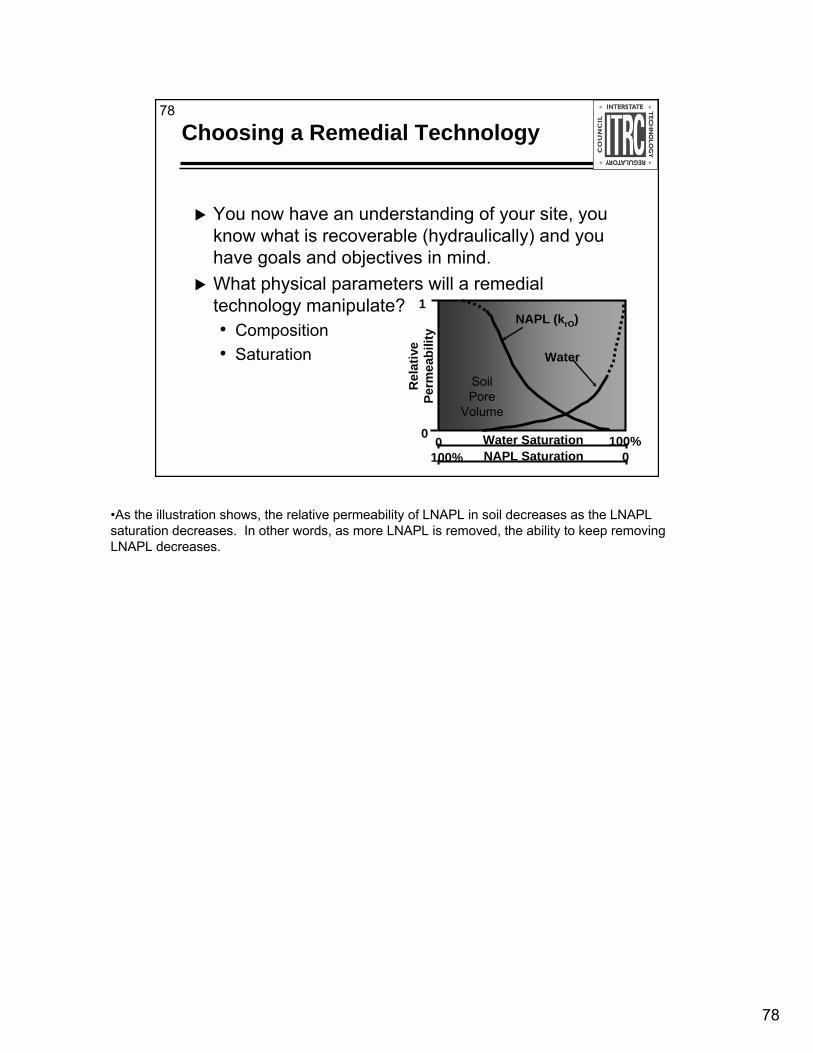
78
78
Choosing a Remedial Technology
You now have an understanding of your site, you know what is recoverable (hydraulically) and you have goals and objectives in mind. What physical parameters will a remedial technology manipulate?• Composition • Saturation
1
0
00
100%Water SaturationNAPL Saturation
Rel
ativ
e Pe
rmea
bilit
y
NAPL (krO)
Water
Soil Pore
Volume
100%
•As the illustration shows, the relative permeability of LNAPL in soil decreases as the LNAPL saturation decreases. In other words, as more LNAPL is removed, the ability to keep removing LNAPL decreases.
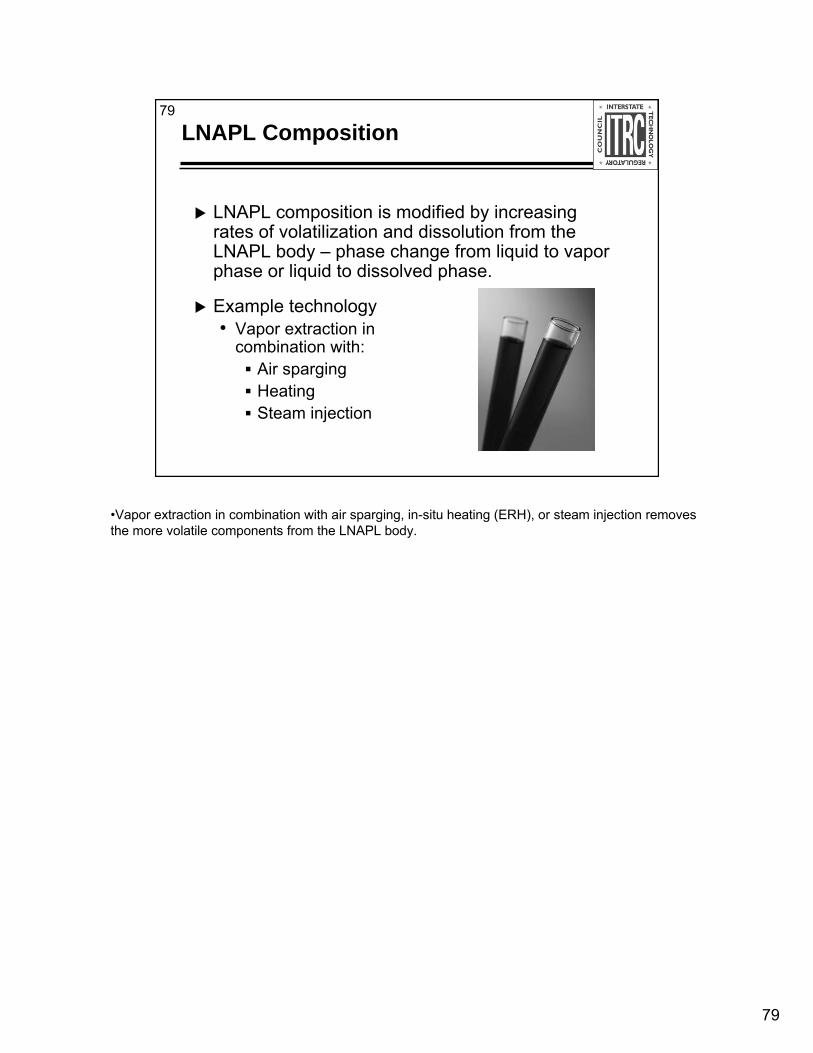
79
79
LNAPL Composition
LNAPL composition is modified by increasing rates of volatilization and dissolution from the LNAPL body – phase change from liquid to vapor phase or liquid to dissolved phase.
Example technology• Vapor extraction in
combination with:Air spargingHeatingSteam injection
•Vapor extraction in combination with air sparging, in-situ heating (ERH), or steam injection removes the more volatile components from the LNAPL body.
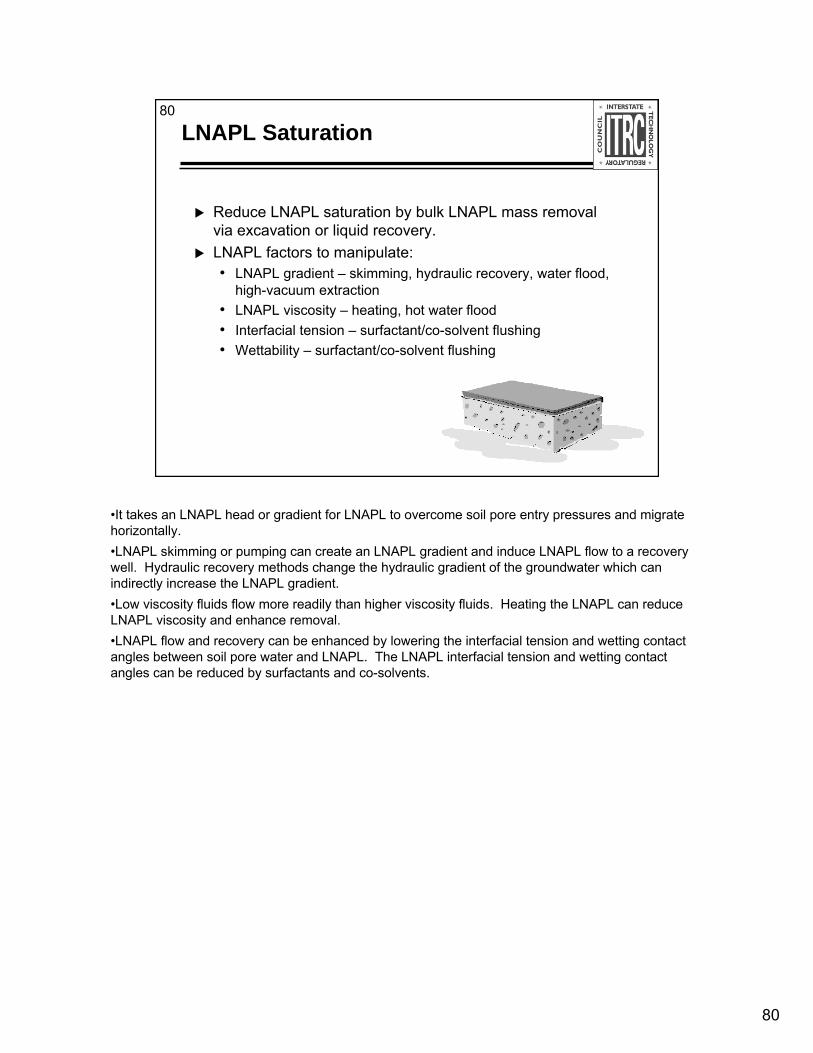
80
80
LNAPL Saturation
Reduce LNAPL saturation by bulk LNAPL mass removal via excavation or liquid recovery.LNAPL factors to manipulate:• LNAPL gradient – skimming, hydraulic recovery, water flood,
high-vacuum extraction• LNAPL viscosity – heating, hot water flood• Interfacial tension – surfactant/co-solvent flushing• Wettability – surfactant/co-solvent flushing
•It takes an LNAPL head or gradient for LNAPL to overcome soil pore entry pressures and migrate horizontally.•LNAPL skimming or pumping can create an LNAPL gradient and induce LNAPL flow to a recovery well. Hydraulic recovery methods change the hydraulic gradient of the groundwater which can indirectly increase the LNAPL gradient.•Low viscosity fluids flow more readily than higher viscosity fluids. Heating the LNAPL can reduce LNAPL viscosity and enhance removal.•LNAPL flow and recovery can be enhanced by lowering the interfacial tension and wetting contact angles between soil pore water and LNAPL. The LNAPL interfacial tension and wetting contact angles can be reduced by surfactants and co-solvents.
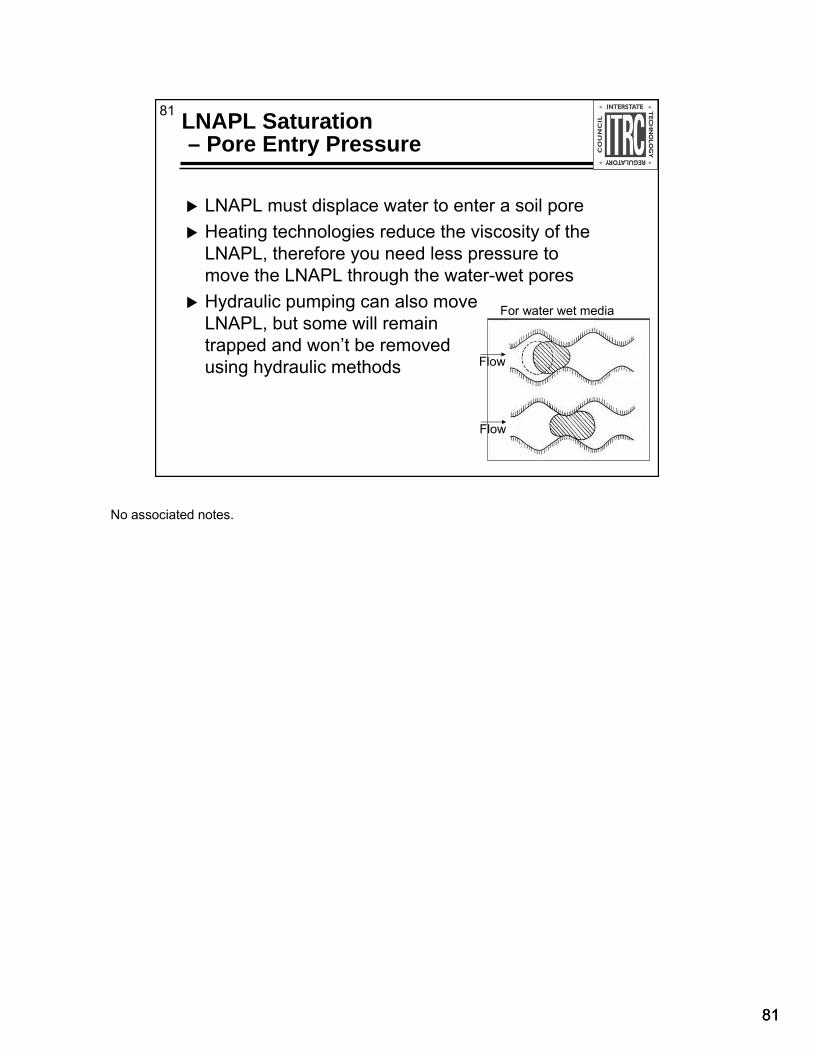
81
81 LNAPL Saturation– Pore Entry Pressure
LNAPL must displace water to enter a soil poreHeating technologies reduce the viscosity of the LNAPL, therefore you need less pressure to move the LNAPL through the water-wet poresHydraulic pumping can also moveLNAPL, but some will remain trapped and won’t be removedusing hydraulic methods Flow
Flow
For water wet media
No associated notes.
81
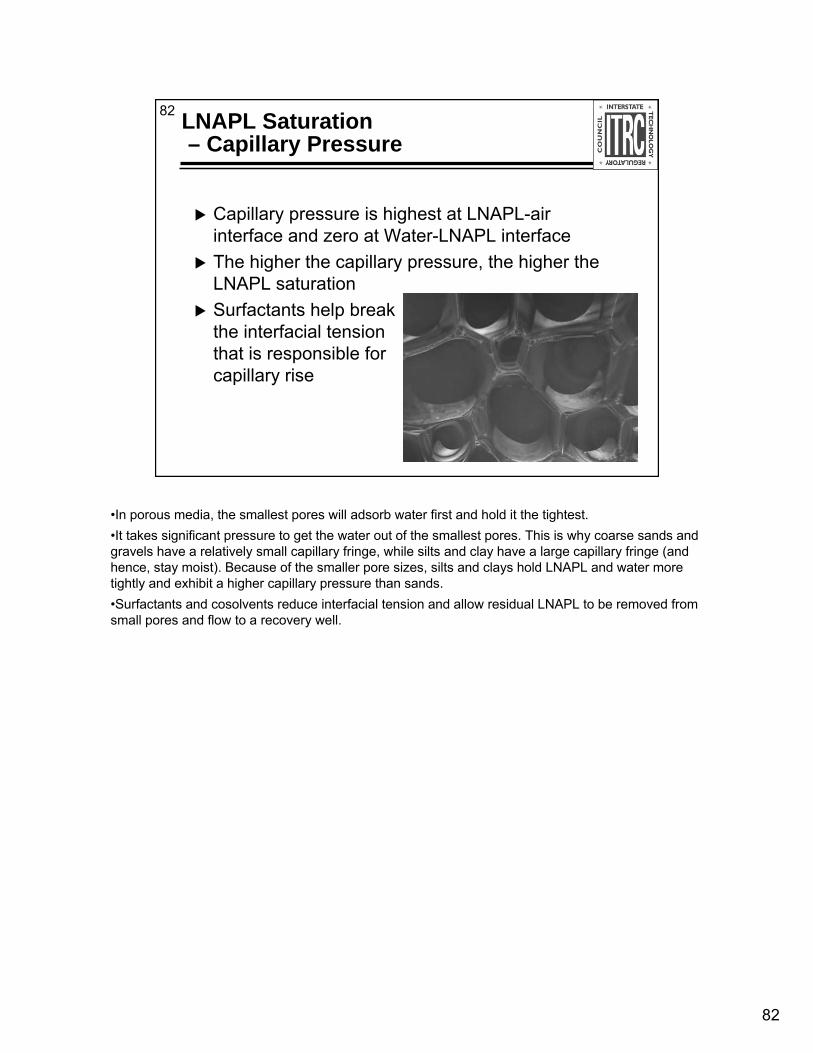
82
82 LNAPL Saturation– Capillary Pressure
Capillary pressure is highest at LNAPL-air interface and zero at Water-LNAPL interfaceThe higher the capillary pressure, the higher the LNAPL saturationSurfactants help break the interfacial tension that is responsible for capillary rise
•In porous media, the smallest pores will adsorb water first and hold it the tightest.•It takes significant pressure to get the water out of the smallest pores. This is why coarse sands and gravels have a relatively small capillary fringe, while silts and clay have a large capillary fringe (and hence, stay moist). Because of the smaller pore sizes, silts and clays hold LNAPL and water more tightly and exhibit a higher capillary pressure than sands.•Surfactants and cosolvents reduce interfacial tension and allow residual LNAPL to be removed from small pores and flow to a recovery well.
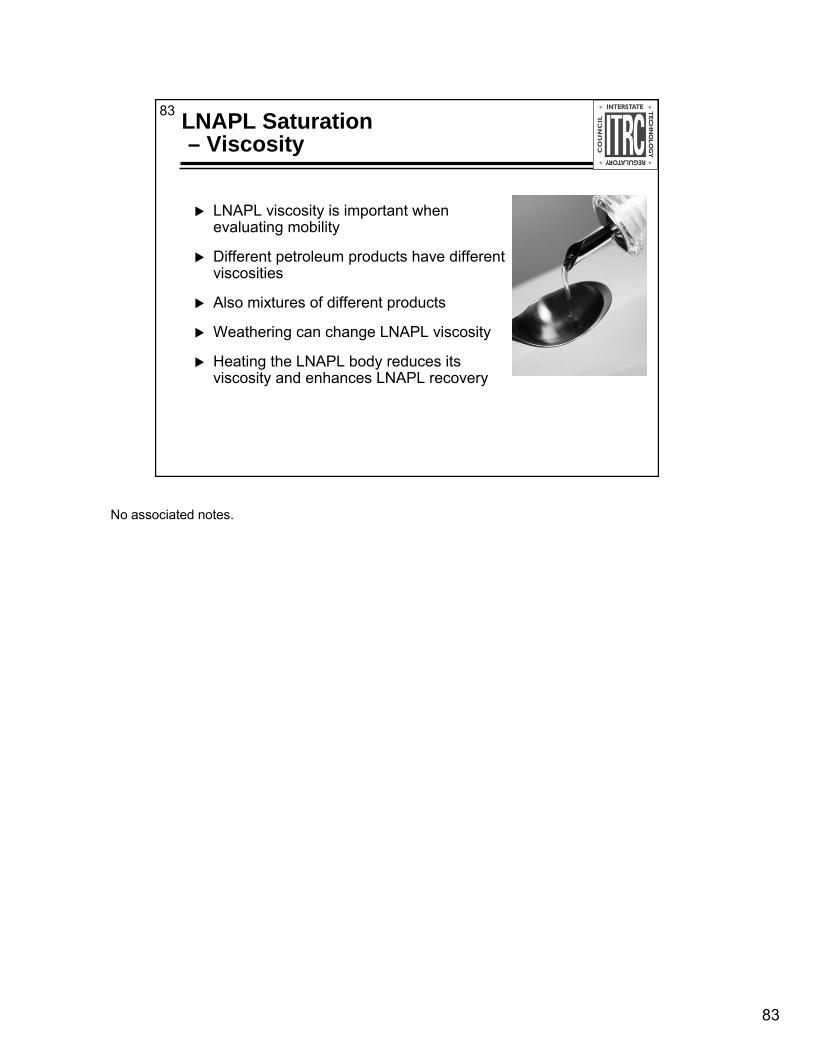
83
83 LNAPL Saturation – Viscosity
LNAPL viscosity is important when evaluating mobility
Different petroleum products have different viscosities
Also mixtures of different products
Weathering can change LNAPL viscosity
Heating the LNAPL body reduces its viscosity and enhances LNAPL recovery
No associated notes.
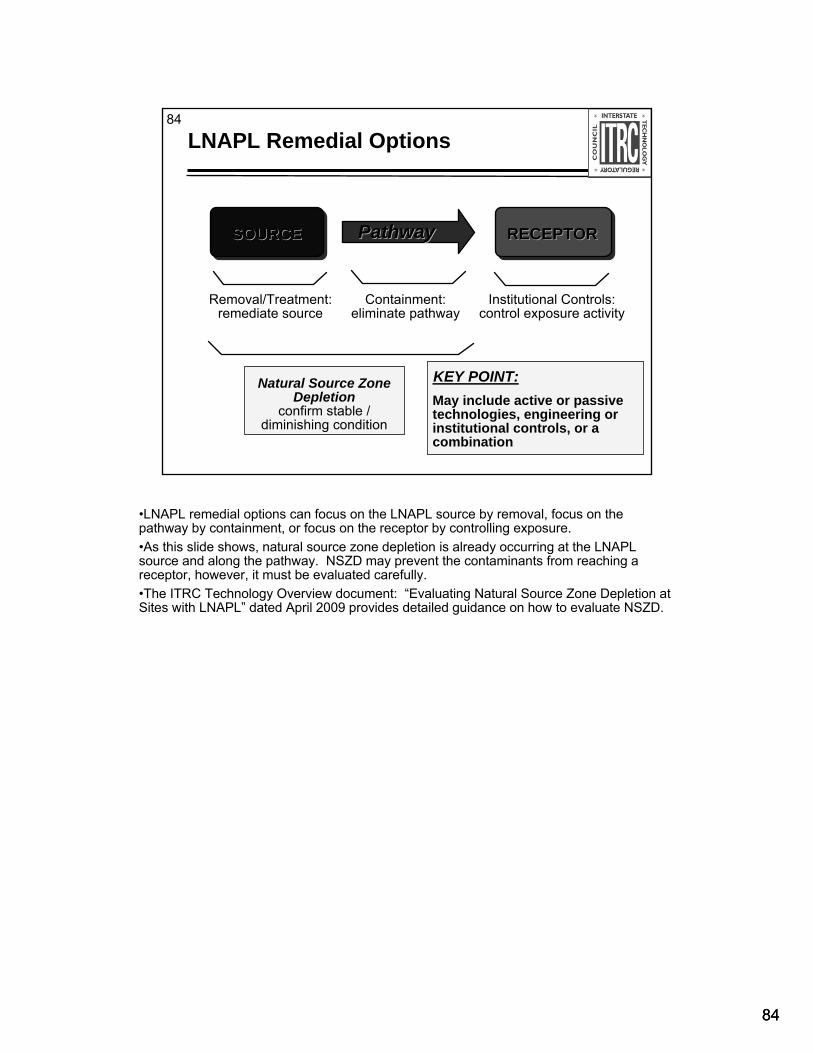
8484
84
Natural Source Zone Depletion
confirm stable / diminishing condition
KEY POINT:May include active or passive technologies, engineering or institutional controls, or a combination
Removal/Treatment:remediate source
RECEPTORRECEPTORSOURCESOURCE
Containment:eliminate pathway
Institutional Controls:control exposure activity
PathwayPathway
LNAPL Remedial Options
•LNAPL remedial options can focus on the LNAPL source by removal, focus on the pathway by containment, or focus on the receptor by controlling exposure.•As this slide shows, natural source zone depletion is already occurring at the LNAPL source and along the pathway. NSZD may prevent the contaminants from reaching a receptor, however, it must be evaluated carefully.•The ITRC Technology Overview document: “Evaluating Natural Source Zone Depletion at Sites with LNAPL” dated April 2009 provides detailed guidance on how to evaluate NSZD.
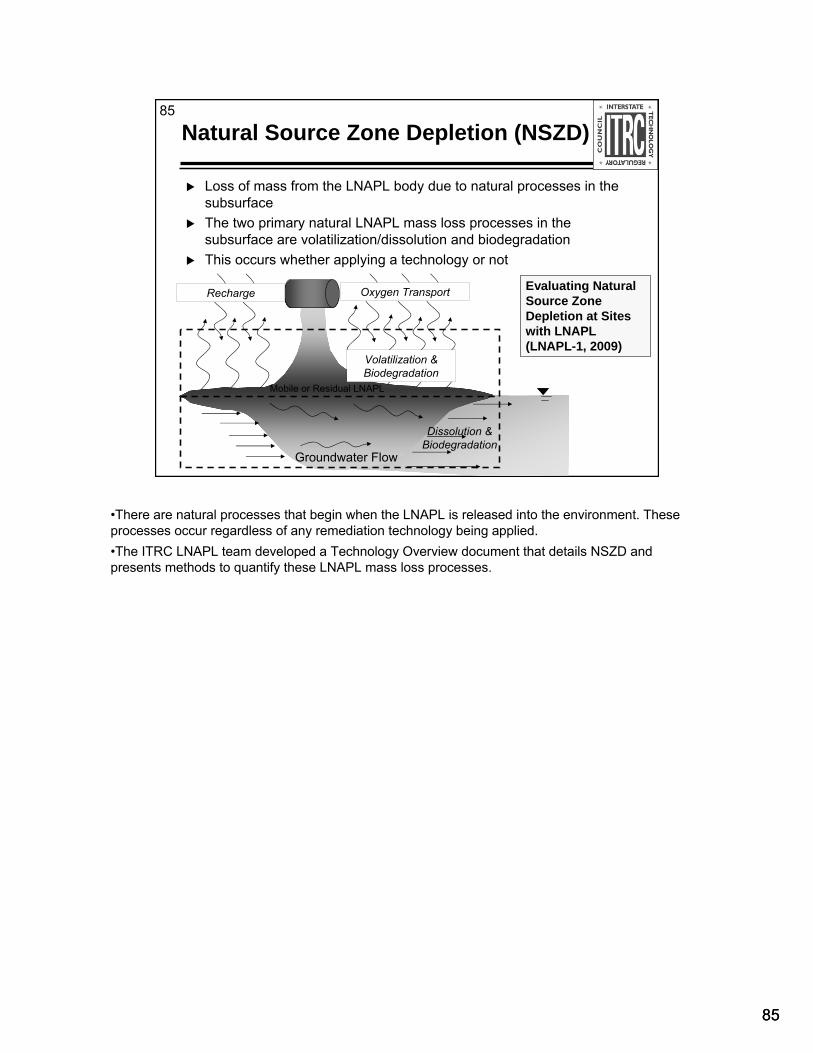
85
85
Natural Source Zone Depletion (NSZD)
Loss of mass from the LNAPL body due to natural processes in thesubsurfaceThe two primary natural LNAPL mass loss processes in the subsurface are volatilization/dissolution and biodegradationThis occurs whether applying a technology or not
Groundwater Flow
Mobile or Residual LNAPL
Dissolution & Biodegradation
Oxygen Transport
Volatilization & Biodegradation
Recharge Evaluating Natural Source Zone Depletion at Sites with LNAPL (LNAPL-1, 2009)
•There are natural processes that begin when the LNAPL is released into the environment. These processes occur regardless of any remediation technology being applied.•The ITRC LNAPL team developed a Technology Overview document that details NSZD and presents methods to quantify these LNAPL mass loss processes.
85

8686
86
1. Excavation2. Physical Containment3. In-situ Soil Mixing4. Natural Source Zone Depletion (NSZD)5. Air Sparging/Soil Vapor Extraction
(AS/SVE)6. LNAPL Skimming7. Bioslurping/Enhanced Fluid Recovery8. Dual Pump Liquid Extraction (DPLE)9. Multiphase Extraction (Dual Pump)10. Multiphase Extraction (Single Pump)11. Water Flooding12. In-situ Chemical Oxidation13. Surfactant-Enhanced Subsurface
Remediation (SESR)14. Cosolvent Flushing15. Steam/Hot-Air Injection16. Radio Frequency Heating17. Three and Six-Phase Electrical
Resistance Heating
KEY POINT:Remediation technology selection criteria are presented in the ITRC LNAPL Tech/Reg Guidance.
LNAPL Technical Regulatory Guidance Document
ITRC LNAPL Team Tech/RegGuidance facilitates the selection of appropriate LNAPL remedial technologies:
LNAPL site conditionsLNAPL propertiesLNAPL remedial objectiveLNAPL remediation goals (tech specific)LNAPL performance metrics (tech specific)
Internet-based Tech-RegTraining in 2010
•The ITRC Tech/Reg Guidance document facilitates the selection of appropriate remedial technologies based on site conditions and remediation goals.
87
87
LNAPLs Training Part 2 Summary
LNAPL behavior in the subsurface is more complex than previously thoughtDevelop an LNAPL CSMLNAPL characterization should be commensurate with the LNAPL site complexity and risksLNAPL recovery addresses mobility – potential recovery is limited – LNAPL concerns are saturation or composition drivenMatch LNAPL concerns with remediation objectives
No associated notes.
8888
88
Thank You for Participating
2nd question and answer break Links to additional resources• http://www.clu-in.org/conf/itrc/LNAPLcr/resource.cfm
Feedback form – please complete• http://www.clu-in.org/conf/itrc/LNAPLcr/feedback.cfm
Need confirmation of your participation today?
Fill out the feedback form and check box for confirmation email.
Links to additional resources: http://www.clu-in.org/conf/itrc/LNAPLcr/resource.cfm
Your feedback is important – please fill out the form at: http://www.clu-in.org/conf/itrc/LNAPLcr/feedback.cfm
The benefits that ITRC offers to state regulators and technology developers, vendors, and consultants include:
Helping regulators build their knowledge base and raise their confidence about new environmental technologies
Helping regulators save time and money when evaluating environmental technologiesGuiding technology developers in the collection of performance data to satisfy the
requirements of multiple statesHelping technology vendors avoid the time and expense of conducting duplicative and
costly demonstrationsProviding a reliable network among members of the environmental community to focus on
innovative environmental technologies
How you can get involved with ITRC:Join an ITRC Team – with just 10% of your time you can have a positive impact on the
regulatory process and acceptance of innovative technologies and approachesSponsor ITRC’s technical team and other activitiesUse ITRC products and attend training coursesSubmit proposals for new technical teams and projects