Embed Size (px)
Citation preview
@LMaccherone
Agile metrics at scale: Gaining InSITe
Larry Maccherone
Data visualization is like photography. Impact is a function of perspective, illumination, and focus.
@LMaccherone
@LMaccherone
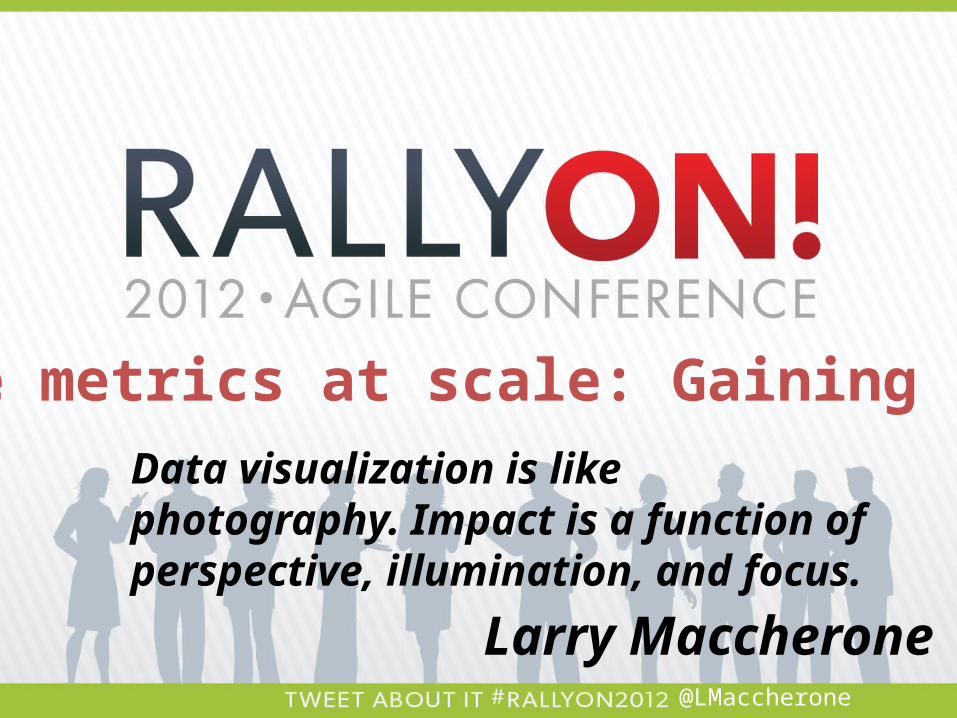
Strategy fails one small decision at a time
@LMaccherone
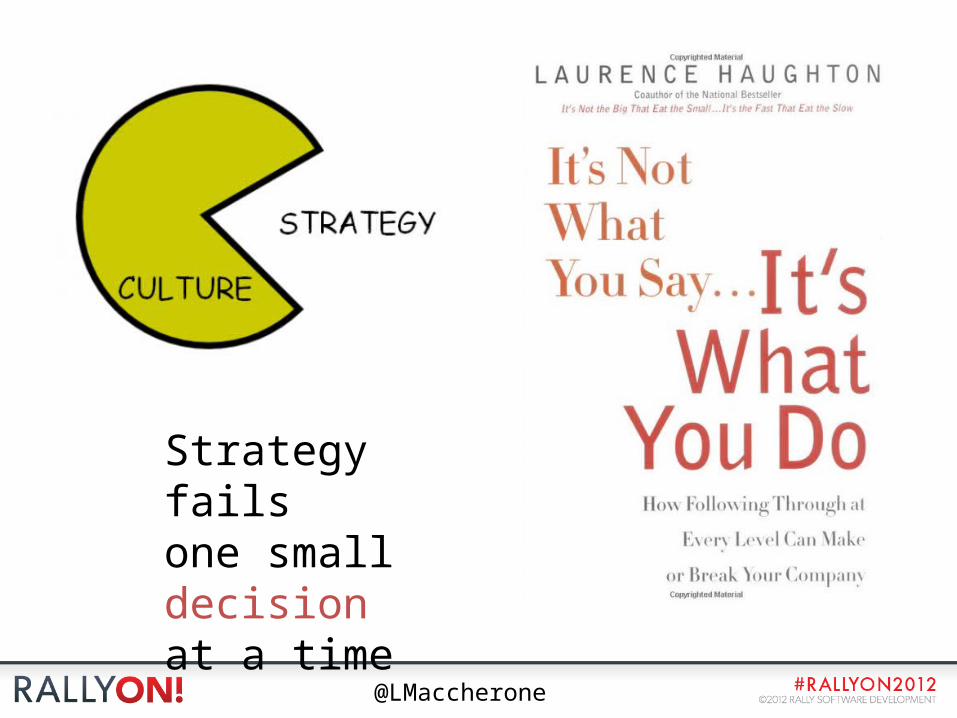
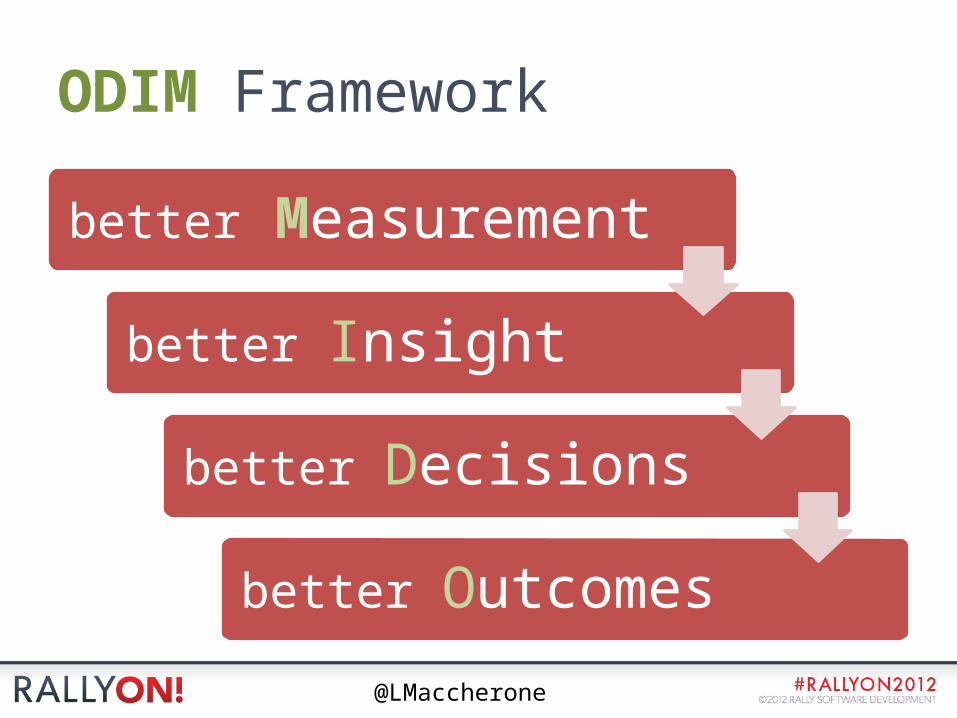
ODIM Framework
better Measurement
better Insight
better Decisions
better Outcomes
@LMaccherone
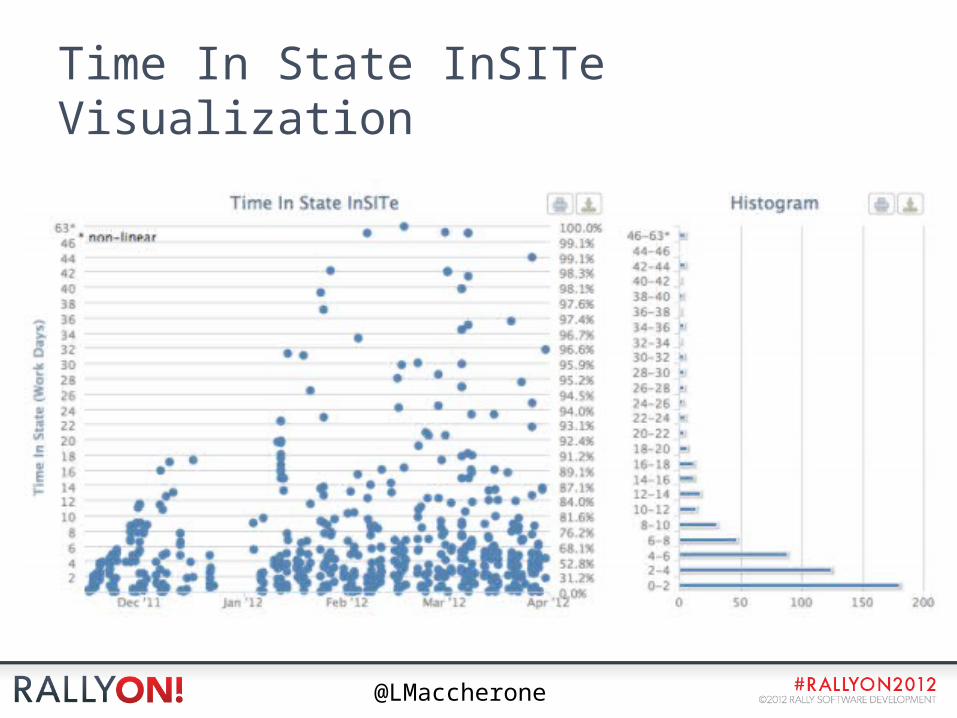
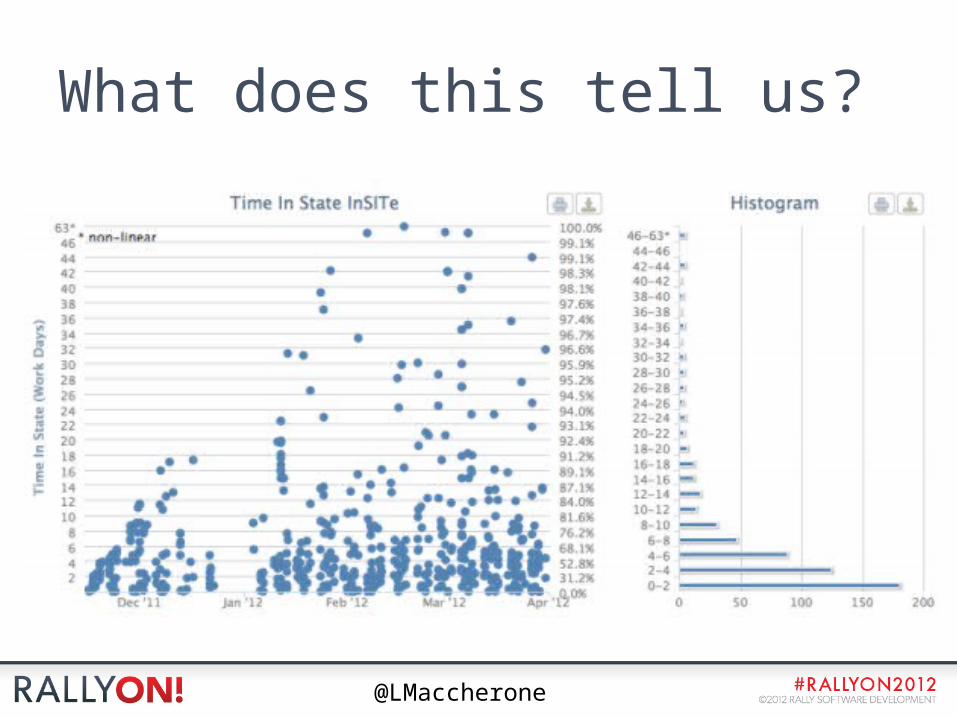
Time In State InSITe Visualization

@LMaccherone
Control limit misapplication
Control is an illusion, you infantile egomaniac. Nobody knows what's gonna happen next: not on a freeway, not in an airplane, not inside our own bodies and certainly not on a racetrack with 40 other infantile egomaniacs.
~Days of Thunder
@LMaccherone
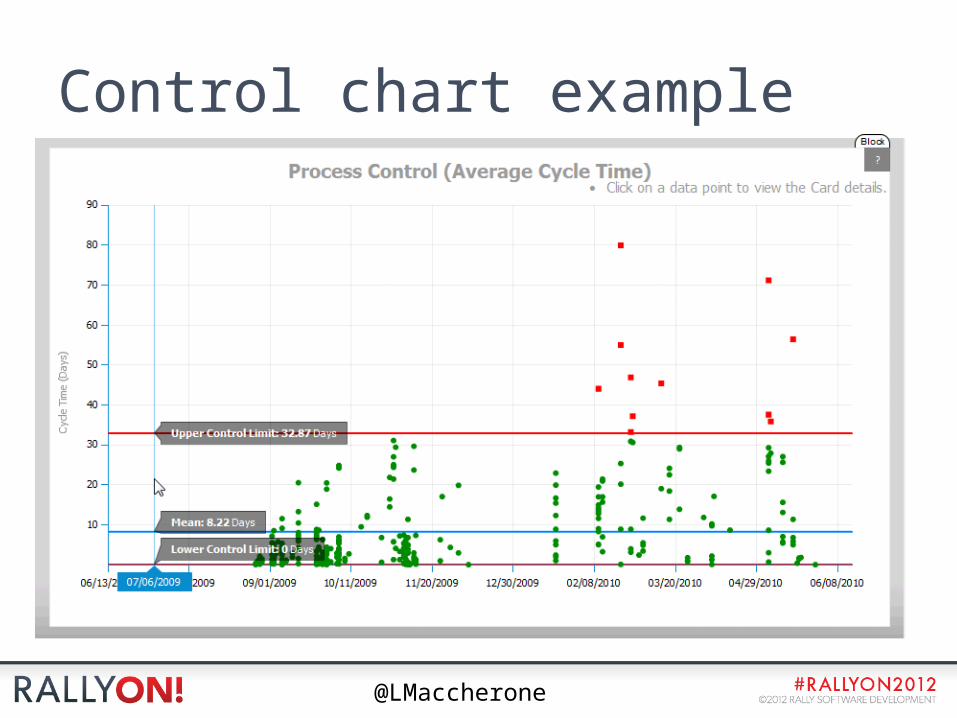
Control chart example
@LMaccherone
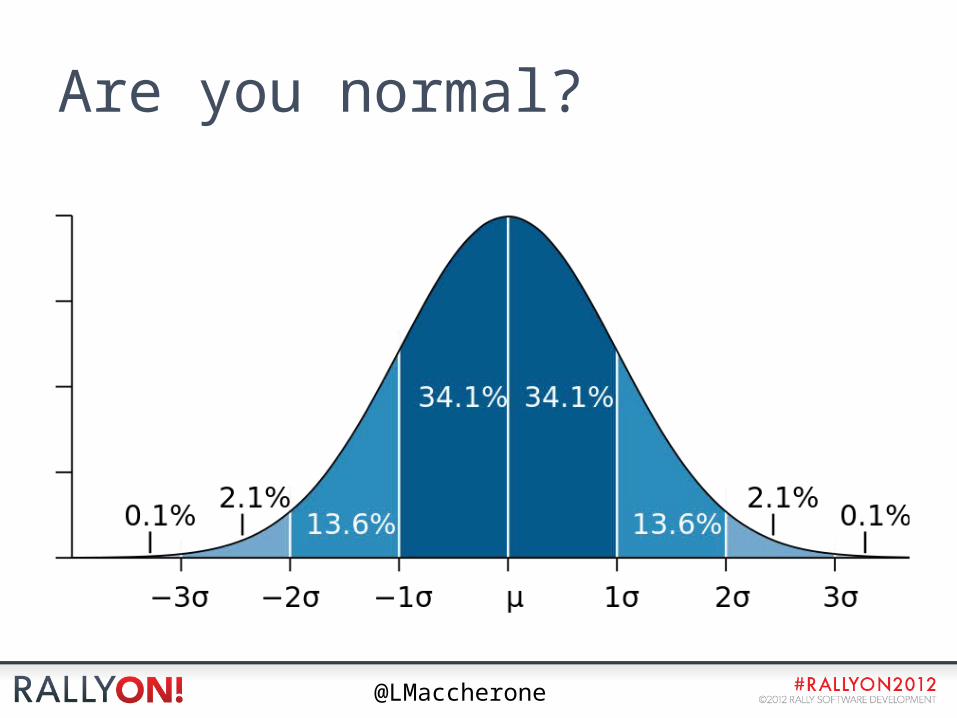
Are you normal?
@LMaccherone
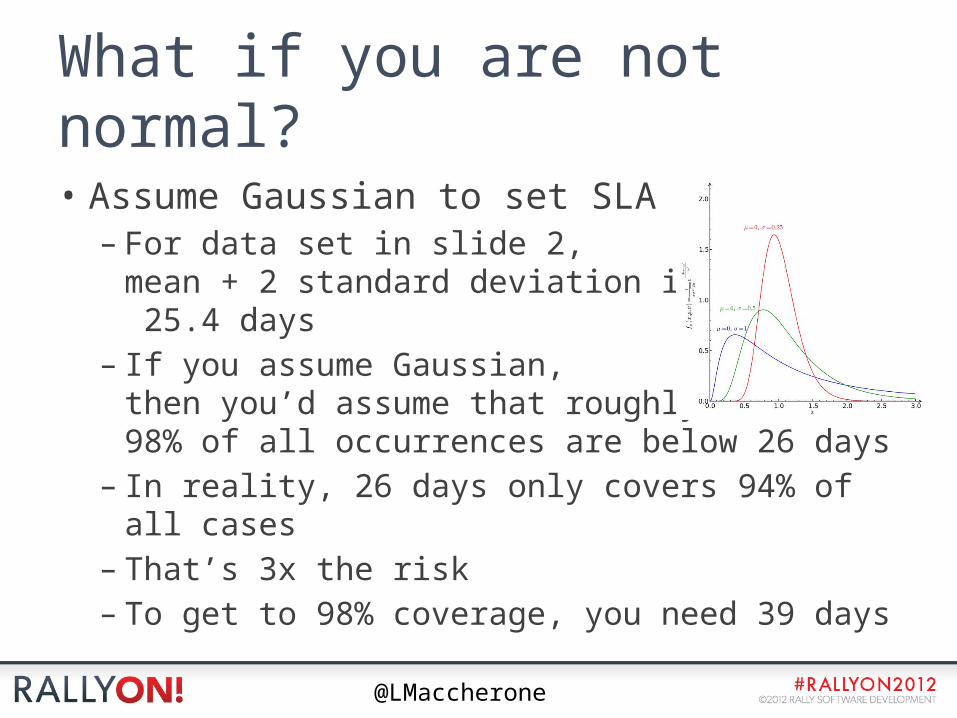
What if you are not normal?
• Assume Gaussian to set SLA– For data set in slide 2,
mean + 2 standard deviation is 25.4 days
– If you assume Gaussian, then you’d assume that roughly 98% of all occurrences are below 26 days
– In reality, 26 days only covers 94% of all cases– That’s 3x the risk– To get to 98% coverage, you need 39 days
@LMaccherone
If the shew(hart) fits…
• Some in the kanban world say to use Shewhart’s method
• That’s 7x the risk for our data set!!!
@LMaccherone
Pick your Poisson
• Assuming log-normal or Poisson…• 2.25x the risk
@LMaccherone
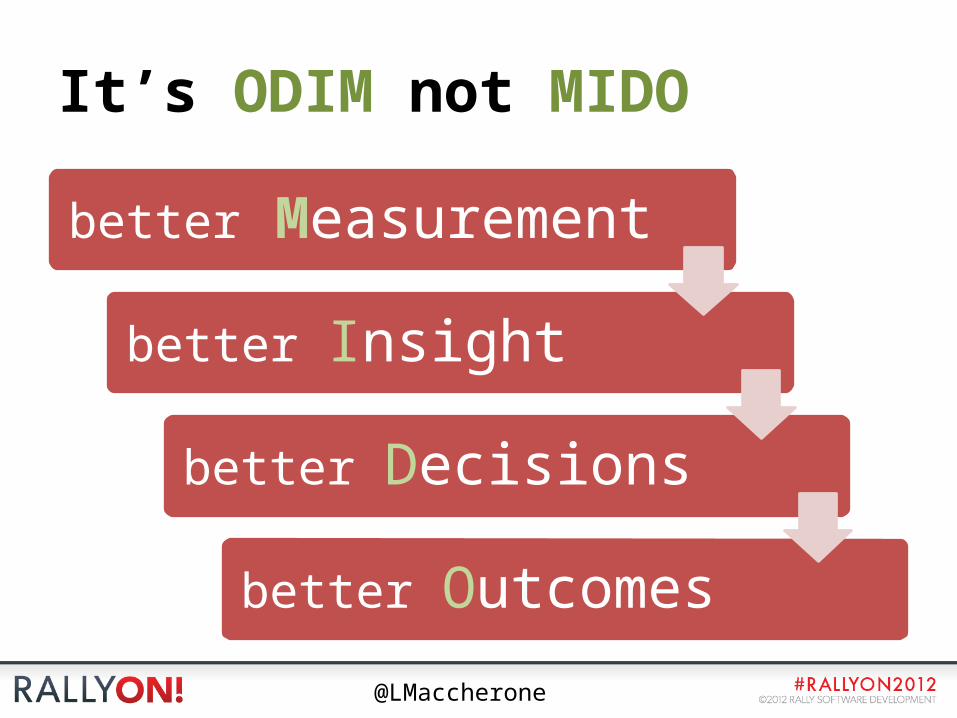
It’s ODIM not MIDO
better Measurement
better Insight
better Decisions
better Outcomes
@LMaccherone
Heavy tail phenomena are not incomprehensible… but they cannot be understood with traditional statistical tools. Using the wrong tools is incomprehensible.
~ Roger Cooke and Daan Nieboer
@LMaccherone
What does this tell us?
@LMaccherone
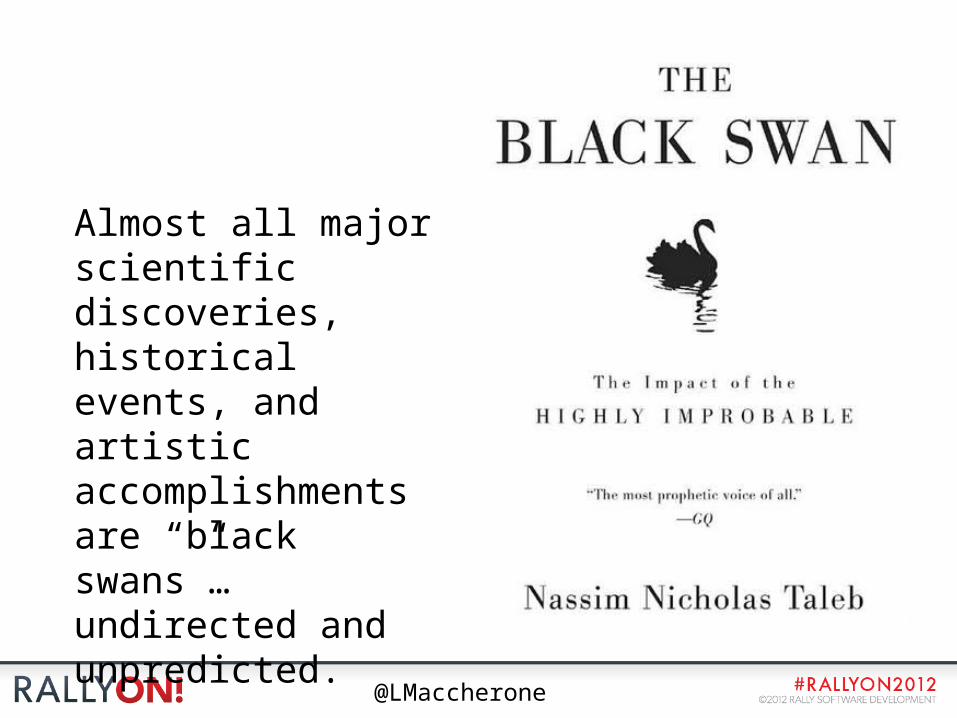
Almost all major scientific discoveries, historical events, and artistic accomplishments are “black swans”… undirected and unpredicted.
@LMaccherone
Coloring outside of the lines
• Control limits say, “don’t color outside of the lines”
• What if the most valuable work is done outside of the lines?
• Interactivity Answer questions
@LMaccherone
1. Feedback (focus of outcome measures)– Evaluate your prior outcomes after the fact to inform
current decisions• co-location is/isn't worth the "cost" in a particular situation• paying for coaching pays for itself in productivity• TDD has this quality benefit at this cost
2. Diagnostic/status/red-flag– What's going on?– Why?
3. Forecasting
4. As a lever (potentially “evil” use of outcome measures)
Purpose of measures
@LMaccherone
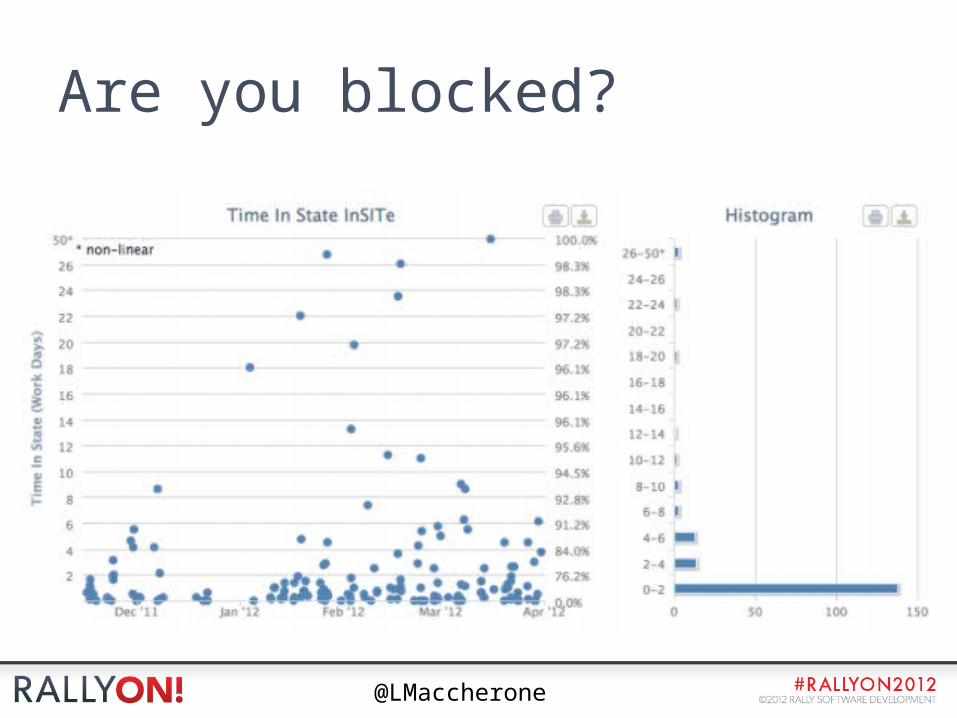
Are you blocked?
@LMaccherone
Use measures to find…CORRELATIONS
LEVERS
EARLY INDICATORS
@LMaccherone
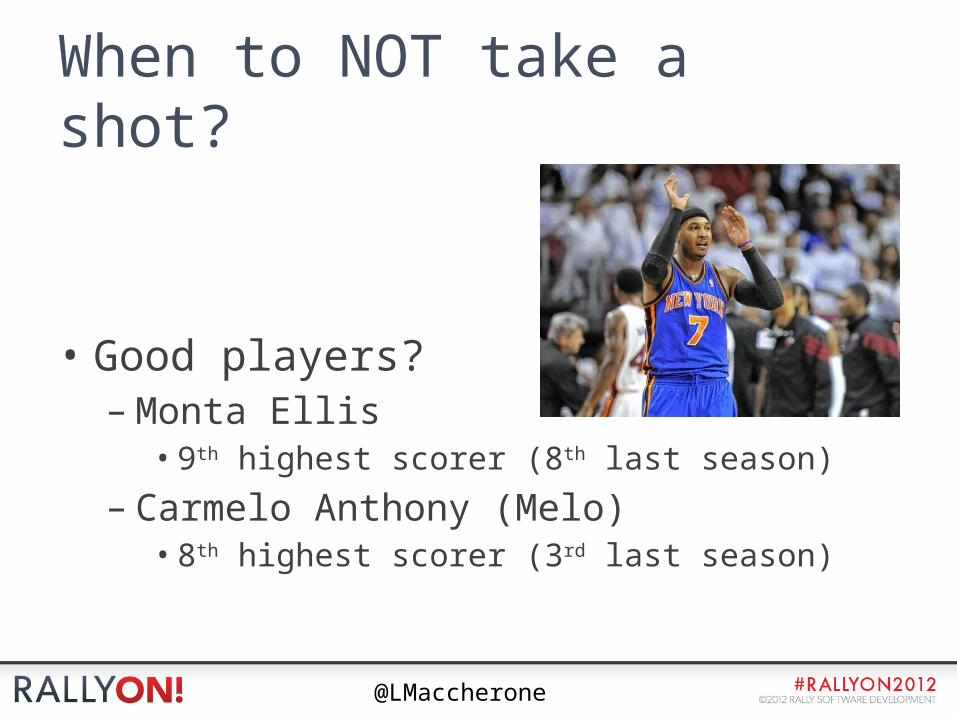
When to NOT take a shot?
• Good players?– Monta Ellis
• 9th highest scorer (8th last season)
– Carmelo Anthony (Melo)• 8th highest scorer (3rd last season)
@LMaccherone
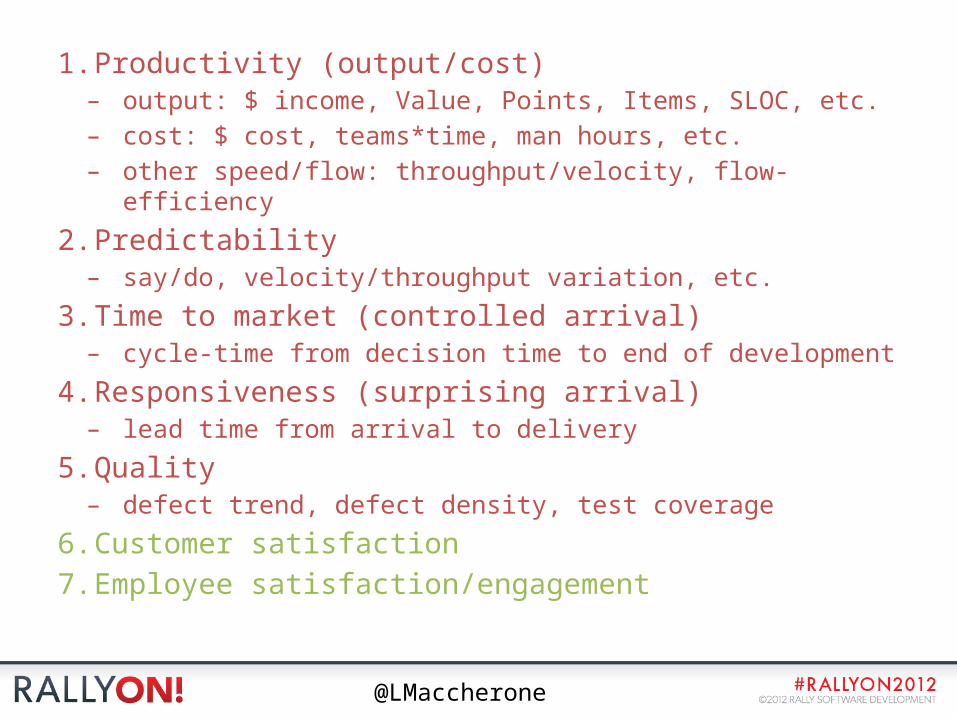
1. Productivity (output/cost)– output: $ income, Value, Points, Items, SLOC, etc.– cost: $ cost, teams*time, man hours, etc.– other speed/flow: throughput/velocity, flow-efficiency
2. Predictability– say/do, velocity/throughput variation, etc.
3. Time to market (controlled arrival)– cycle-time from decision time to end of development
4. Responsiveness (surprising arrival)– lead time from arrival to delivery
5. Quality– defect trend, defect density, test coverage
6. Customer satisfaction
7. Employee satisfaction/engagement
@LMaccherone
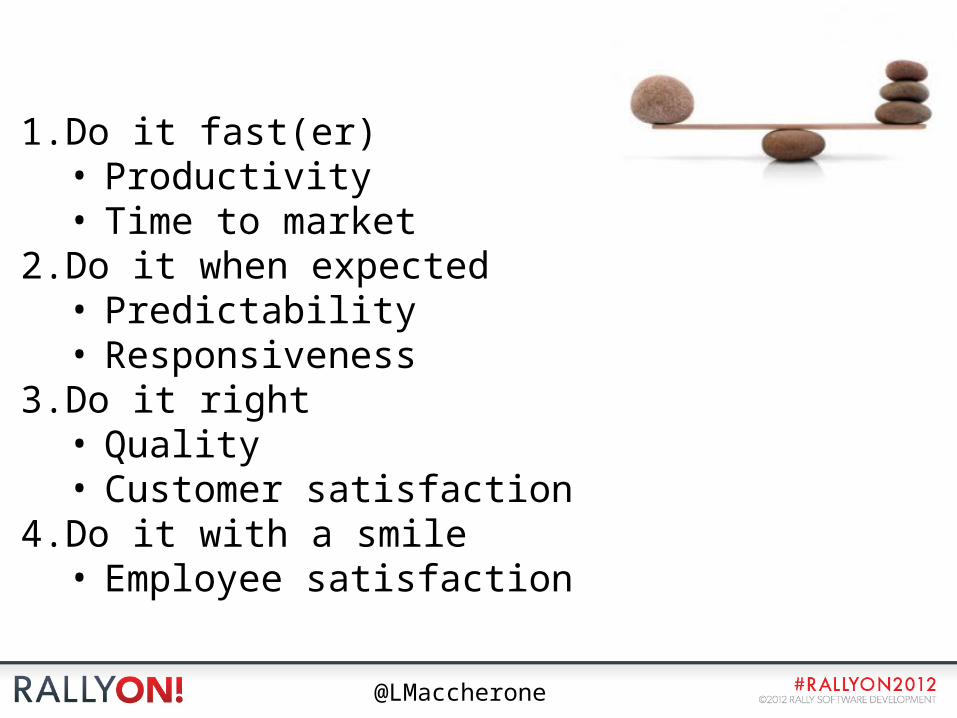
1. Do it fast(er)• Productivity• Time to market
2. Do it when expected• Predictability• Responsiveness
3. Do it right• Quality• Customer satisfaction
4. Do it with a smile• Employee satisfaction