Embed Size (px)
Citation preview
NPRDC TR 84-9 NOVEMBER 1983
lJ CLASSIFICATION AND ASSIGNMENT WITHIN PRIDE(CLASP): A RECRUIT ASSIGNMENT MODEL
i&
APPROVED FOR PUBLIC RELEASE;DISTRIBUTION UNLIMITED
NAVY PERSONNEL RESEARCHSnioANDDEVELOPMENT CENTER
San Diego, California 92152
84 01 17 104
NPRDC TR 84-9 November 1983 -'
-i
CLASSIFICATION AND ASSIGNMENT WITHIN PRIDE (CLASP).-A RECRUIT ASSIGNMENT MODEL
Leonard P. Kroeker "Bernard A. Rafacz
Reviewed byMartin F. Wiskoff
Released byJ. W. Renard
Captain, U.S. NavyCommanding Officer
Navy Personnel Research and Development CenterSan Diego, California 92152 ""
-XI

UNCLASSIFIEDSECURITY CLASSIFICATION OF THIS PAGE (Whenm D~at Eaitor.V
REPORT DOCUMENTATION PAGE BEFORE COMPLTEING POWM1. RIPORT NUMBER I .GOVT ACCE5S8IN NO, I. fRECIPlENI'S CATALOG NUMB It
NPRDC TR 84-9 I f~N4. TITLE (and Subtitle) S. TYPE OF REPORT II P90NOD COVERgO
CLASSIFICATION AND ASSIGNMENT WITHIN FnlRprPRIDE (CLASP): A RECRUIT ASSIGNMENT Jl17-Sp18MODEL 6 iow~ ~.~ NME
7. AUTHOR(a) Kree . CONTMACT Oil GAANT NUM111911.)
Bernard A. Rafacz
S. PERFORMING ORGANIZATION NAME AND ADDRESS 0. PA OA W ELEMENPftOJ t'T, -MIGA M RW"W94 UNTUME MSNavy Personnel Research and Development CenterSan Diego, California 92152 Z *17PN0
11. CONTROLLING OFFICE NAME AND ADDRESS 12. -REPORT OATV
Navy Personnel Research and Development Center November 1983San Diego, California 92152 ' UURPAE
14. MNITOR~ING AGENCY NAME &AODRESs(II different fronIt CrPt~eoling Offie.) 15, SECURITY CLASS, (of Ohio ir
UNCLASSIFIEDIso OECL. ASSI PIC ATI ON/DO@WN GRADING
SCHEDULE
16. DISTRIBUTION STATEMENT (of this Report)
Approved for public release; distribution unlimited.
17. DISTRIBUTION STATEMENT (of the abstract aenterdlIn Block 20, It different from RwOt45)
1S. SUPPLEMENTARY NOTES
19. KEY WORDS (Con tinue on reverseed side lnocesary and Identify by block nuobor)
Person~nel allocation system Assignment modelCLSPersonnel classification Person-job match Optimal assignmentPersonnel utilization Recruit classificationDifferential job placement
jo.\A\lSTRACT (Continue on reverse sid.e1 Unscoaautvwand Identify by block mmbm'w)
The purpose of this research was to design, construct, and test a me~thematicallmodel for optimal assignment of Navy recruit applicants. Navy policy data were usedto formulate experimental forms of utility model components. The forms were testedin a simulation procedure using Navy accession data. Performance characteristics wereevaluated for the model, called Classification and Assignment Within PRIDE (CLASP). '
Results showed that the CLASP personnel allocation systemn provides decision-makers -
DD JAN 73 1473 EDITION OF INOV 65 IS OlISOLETEf UNCLASSIFIEDS/N 0102- LF- 014- 6601 SECURITY CLASSIFICAT10if OF THIS PAGE (%o bad 24W
ff...s a*~~'WIjc

.F . .• , .,• . -. . , . , • .. . . . .. , -. . ... . . .-. , • • • • • • . 1.
UNCLASSIFIED
S.ECUR"TY CLASSVICATIO16 OF THIS ,AO3I, o,1m -. ,a bw•,.
"-"with an improved tool for personnel classification and placement. It enables' managers"- to make personnel decisions with both greater accuracy and greater concern for
individual applicants. Under both field test and simulation conditions, the CLASPf.N procedure assigned personnel more effectively to optimal ratings than did the existing
first-come, first-served procedure.
L". %"
I.
S/N 0102. LF- 014-6601
S T C UNCIASS IFIED" = " " SECURITY CLASSEIFICATION OP THIS PAGEr(D31• D"ta E~ntered)
% -. :,3 . .• ,• . :• . . .• m, .. • . . ••.. • L -- * ' ,s / ,. -. . " -' _'. - ; • -'. - • " - ~ - . .
FOREWORD
The purpose of this research, which was conducted under project Z1167-PN.02(Computer-Assisted Testing, Counseling, and Assignment of Recruits), was to develop andtest a computerized system for Navy personnel assignment. This system, calledClassification and Assignment Within PRIDE (CLASP), was implemented by the Com-mander, Navy Recruiting Command (CNRC) on 2 June 1981. Since then, it has been usedto assign recruit applicants to ratings requiring "A" school training. This reportdocuments the CLASP model's development and ini'ial evaluation. Research results areintended for program managers at the Navy Military Personnel Command (NMPC-48),CNRC-20, and CNRC-30, as well as Department of Defense researchers involved indeveloping personnel allocation systems.
Appreciation is expressed to CAPT Jensen (NMPC-48), CAPT Terrell (CNRC-20),LCDR Biegler (NMPC-481), and LCDR Sheehan (NMPC-482) for their significant contribu-tions to policy modeling and to assignment system development and testing. !n addition,many useful recommendations were contributed by NMPC and CNRC headquarters andfield personnel. The final version of the CLASP system contained many of therecommended improvements.
J. W. RENARD JAMES W. TWEEDDALECaptain, U.S. Navy Technical DirectorCommanding Officer
AoOessiOn For
DTIC TAB| iu~uiounce 0aSjust if oation ' __
Q ] Speiaa
VI
S•"AvailabilitY Code$
A
if'
Code
U T "12
d Qail an
0T A v- -a-atp

SUMMARY
Problem
Since 1973, recruit applicants have been assigned to "VA" school seats on a first-come,first-served basis with the aid of a computerized reservation network called PersonalizedRecruiting for Immediate and Delayed Enlistment (PRIDE). A new assignment procedurewas needed that could apply a consistent decision-oriented classification rationale to eachFpro3pective applicant, use more information about each applicant's job preferences, andoperate on all Navy jobs available nationwide.
The purpose of the research reported here was to design, construct, and test amathematical model for optimal assignment of recruit applicants.
Approach
Navy policy data were used to formulate experimental forms for utility modelcomponeoits. Each experimental form was tested in a simulation procedure using Navyaccession data. Performance characteristics were noted, revisions made, and refined
functional forms were derived for the composite modul, called Classification andAssignment Within PRIDE (CLASP). Results from a simulation of the CLASP compositemodel were evaluated and compared to PRIDE assignments and to data from a 1978CLASP field test for their capacity to (1) maximize training school success, (2) optimizematching of aptitude level and Navy job complexity, (3) optimize matching of applicantpreferences and Navy requirements, (4) fill quotas at uniform rates within all Navyratings, and (5) balance the distribution of ethnic minorities within all ratings.
Both the simulation and the field test confirmed the capability of CLASP to makeoptimal assignments of recruit applicants:
1. The CLASP procedure yielded assignments higher in quality than those obtained% - under the PRIDE process when compared on the basis of optimality index scores and mean
square statistics.
2. Comparison between overall CLASP assignment quality and the proportion ofvacancies in the job bank showed that quality was highest when there were large numbersof vacancies and lower when few positions remained to be filled.
3. The CLASP procedure was more effective than the PRIDE process at filling* - rating quotas uniformly and distributing the proportion of minority recruits evenly across
the 86 ratings included in the research.
The CLASP system was implemented by the Navy Recruiting Command on 2 June1981.
Conclusions
CLASP provides decision-makers with an improved tool for personnel classificationand placement. it enables managers to make personnel decisions with both greater
IS I LANK_
6d i.. .. . . . . . . . . ..-- - - - - - - - - - - - - - - - - - - - - . - - - -
SI
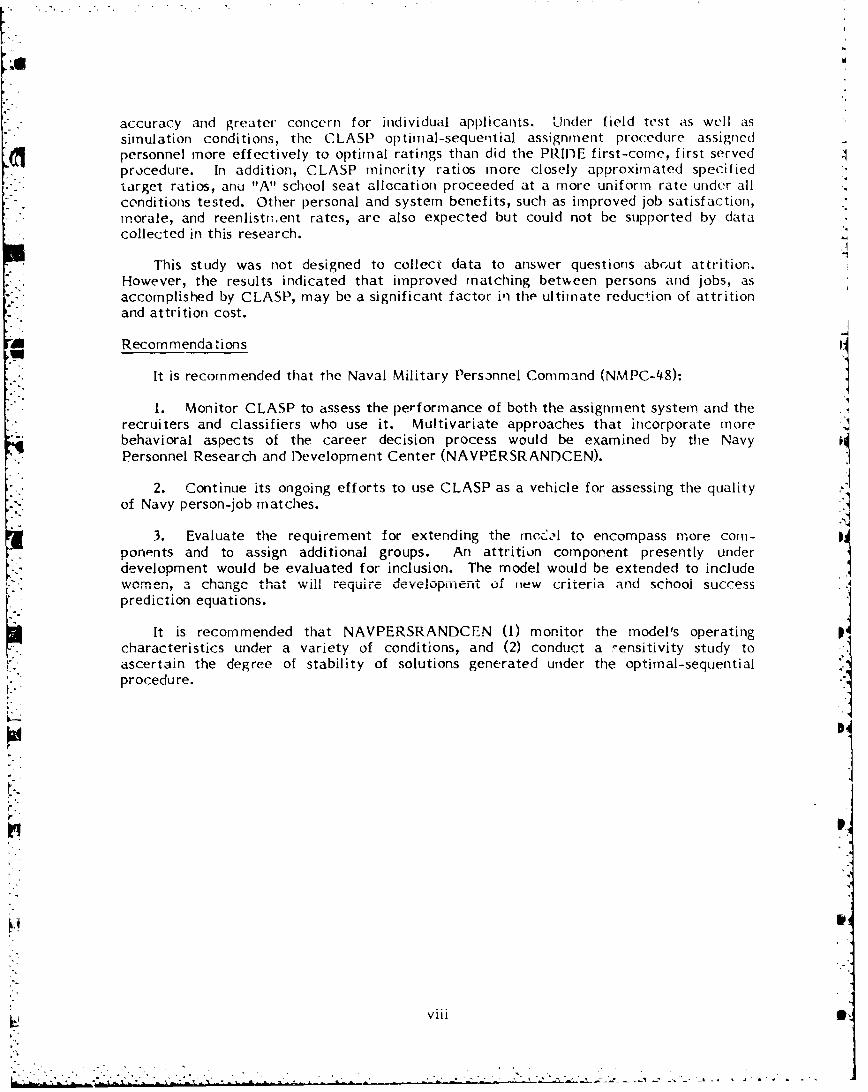
accuracy and greater concern for individual applicants. Under field test as well assimulation conditions, the CLASP optimal-sequential assignment procedure assignedpersonnel more effectively to optimal ratings than did the PRIDE first-come, first servedprocedure. In addition, CLASP minority ratios more closely approximated specifiedtarget ratios, anu "A" school seat allocation proceeded at a more uniform rate under allconditions tested. Other personal and system benefits, such as improved job satisfaction,morale, and reenlistri.ent rates, are also expected but could not be supported by datacollected in this research.
This study was not designed to collect data to answer questions about attrition.However, the results indicated that improved matching between persons and jobs, asaccomplished by CLASP, may be a significant factor in the ultimate reduction of attritionand attrition cost.
' Recommendations
It is recommended that the Naval Military Personnel Command (NMPC-48):
1. Monitor CLASP to assess the performance of both the assignment system and therecruiters and classifiers who use it. Multivariate approaches that incorporate morebehavioral aspects of the career decision process would be examined by the NavyPersonnel Research and Development Center (NAVPERSRANDCEN).
2. Continue its ongoing efforts to use CLASP as a vehicle for assessing the quality .2of Navy person-job matches.
3. Evaluate the requirement for extending the m-cJl to encompass more corn-ponents and to assign additional groups. An attrition component presently underdevelopment would be evaluated for inclusion. The model would be extended to includewomen, a change that will require devel.op,,,ent u. new criteria and school success
prediction equations.
It is recommended that NAVPERSRANDCEN (1) monitor the model's operatingcharacteristics under a variety of conditions, and (2) conduct a -ensitivity study toascertain the degree of stability of solutions generated under the optimal-sequentialprocedure.
p"
p
ii~b ,hh.,, - :ib..mI . ., ,. . ,, , ., h•. '' -• , , -.. • • :-. ... . . . . .- .

'N- .. ~'. . - -4 N -~
K CONTENTS
Page
INTRODUCTION ......................................... ................
Background ............................................................. ISequential Assignment.....................................................2Assignment Quality .............................. I........................2
Objectives ................................................................ 3
APPROACH................................................................3
CLASP Utility Model Development............................................4CLASP Model Evaluation....................................................4
!sample ................................................................. 4PRIDE Assignments ....................................................... 4CLASP Assignments.......................................................5Field Test...............................................................5
RESULTS AND DISCUSSION ................................................... 5
CLASP Utility Model Development............................................5School Success Component ................................................. 6Technical Aptitude/Job Complexity Component ........................... 7
SNavy Prior it y/Irddivi dual Preference Component...............................9
Minority Fill-rate Component..............................................12I!Fraction Fill-rate Component..............................................13Composite Utility..........................................................15I
*Decision Index Proredtire .. ..... ... .. ... ..0Optimality Index.........................................................17List Presentation Strategy ................................................ 17Future Rating Options....................................................18
CLASP and PRIDE Assignment Evaluation and Comparisor ....................... 19Overall Assignment Quaiity ............................................... 19Assignment Quality Over Time.............................................21Assignment Quality vs. Recruiting Quotas...................................23"A"l School Attrition Cost .................. I...............................24Fraction and Minority Fill Rates ........................................... 24
CONCLUSIONS............................................... .............. 30
RECOMMENDATIONS....................................................... 31
REFERENCES.............................................................. 33
APPENDIX A--TITLES AND ABBREVIATIONS FOR 86 NAVY RATINGS ............ A-0
APPENDIX B3--DECISION INDEX (DO) MEANS FOR JULY 1977 DATA SET...........B-0
DISTRIZIMJTI()N LIST
Iu ix

LIST OF TABLES
Page
1. Component Weights for the CLASP Composite Utility ..................... 15
2. Rating (2ptirns Lists Ordered by Recruiting Month for aHypotheticai Recruit Applicant ........................................ 18
3. Rating Options for First Recruit on Simulation Data Tape .................. 19
4. A'-erage 01 Values UT ndcr CLASP and PRIDE Assignment Procedures ........ 25
5. 1978 Viield Test .ssignment Results ...................................... 26
6. Sixty-five Navy Ratings Ra.iked by Improvei .ent Potential and AttritihC ost ............................................................. .. 27
7. Minority Ratios C .tained Under CLASP and PRIDE AssignmentProcedures .......................................................... 29
LIST OF FIGURES
1. Utility vs. job complexity at constant aptitude levels ........................ 8
2. Utility vs. individual preference at constant priority levels ................... It1
3. Minority fill-rate feedback mechanism ..................................... 12
4. Fraction fill-rate component ............................................. 14
5. Number of simulated assignments vs. improvement in optimality .............. 20
6. Deterioration in assignment quality over time .............................. 21
7. Reduction in quality disL :pan :y over time .................. 22
8. Optimality index vs. percentage of total quota filled using
six assum ptions ........................................................ 23
9. Proportion of ETAE positions filled vs. time remaining toshipping date .......................................................... 28
,'4
--J
r%~ CA$~V \.C-\>.%Xt:~........ *-. *-. -. ,.-,-
4.. .• . . .
INTRODUCTION
One of the final steps in the military accessioning process occurs at regional militaryenlistment processing stations (MEPSs) (formerly called armed forces examining andentrance statd3ns (AFEESs)). The MEPSs, which serve all the military services, evaluatepotentia. rncruits mentally and physically to ascertain their suitability for service. Oncebasic qualification i; determined, the process oi dcterminirig technical school ("A" school)assignment begins.
From 1973 until 1981, recruit applicants were assigned to Navy jobs or ratings on afirst-come, first-served basis, using a computerized reservation network adapted from theArmy's REQUEST system and named Personalized Recruitment for Immediate andDelayed Enlistment (PRIDE). When these assignment decisions were examined closely, itwas shown that they frequently (1) could not distinguish assignment options on the basis ofpredicted school success, (2) neglected matching personnel of a given ability level withjobs appropriate for that level, (3) lacked response flexibility to changing Navy priorities,(4) could not incorporate applicants' preferences in a consistent way, (5) failed toaccommodate important Navy objectives such as uniform minority and "A" schoolaccession rate, (6) reflected rating availability instead of assignment quality, and (7)neglected applicant quality in favor of satisfying recruiting goal requirements. A newassignment procedure was needed that could apply a consistent decision-oriented clas-sification rationale to each prospective applicant, use more information about eachapplicant's job preference, and operate on all Navy jobs available nationwide.
Background
During the past 20 years, the technology and process for assigning Navy enlistees tojob training have changed dramatically. Until the 1960s, classifiers at the three recruittraining centers (RTCs) hand-sorted stacks of cards that represented a week's recruit poolinto Digeonholes that renruntfd i v-lhl assignment. After 1l96, ÷I-e ... t.. .. L...Jthe assistance of the computer-assisted classification system (COMPASS), which in-
corporated mathematical optimizing techniques and the computer's speed to improve thequality of assignment decisions (Dow, Wulfo, Moonan, Swanson, & Taylor, 1964; Swanson &Dow, 1965). In 1973, the assignment process shifted to the AFEESs (now called MEUSs).After making assignment decisions, Navy classifiers reserved places for technicaltraining in "A" schools by using the PRIDE computerized reservation network.
Strategies for improving the quality of job training assignments developed asconsequences of the political, economic, and social changes that impinged on the militaryservices. With the end of conscription in 1973, there was a shift in proportions ofenlistees: Fewer came from the higher mental ability groups and more from the lowergroups. At the same time, the overall trend in the United States toward use ofincreasingly sophisticated machines and, thus, greater need tor technically skilledworkers, has been paralleled by the Navy's increasing need for technically skilledpersonnel to operate and maintain sophisticated military equipment. Under today's all-volunteer force (AVF), training guarantees are often offered as incentives for militaryenlistment. Quotas for technical training schools must be filled seque ally, at whatevertime enlistees present themselves, without knowing whether the nexi applicant might bebetter qualified for a job than the person just assigned to it. Refined, improvedassignment strategies have been developed to make optimal use of the availableapplicants, to improve their Navy job success, and, therefore, to reduce attrition with itsassociated retraining and replacement costs.
LUi-
Sequential Assignment
The early research dealing wich aspects of the assignment question focused onattempts to develop optimal allocation algorith,ns to handle pooled personnel available allat one time. Brogden (1946) first addressed the problem of optimal assignment with morethan two job categories. Votaw (1952) and Dwyer (1954) recognized the equivalencebetween optimal personnel assignment and the linear programming transportation prob-lem. They proposed using the simplex and optimal regions methods.
However, under current conditions, a functional Navy accessioning system requiresthat personnel be assigned as they become available. Research in sequential assignmentwas conducted by Horst and Sorenson (1976), who proposed a matrix transformationmethod that resulted in near-optimal assignments. Rafacz and Halstead (1977) developeda'method to allow comparisons between present and possible future applicants. They useda matching function to estimate optimal assignments that depend on a shadow populationresembling the real one to which the present applicant belongs.
Assignment Quality
The shift from pooled assignment at three RTCs to sequential assignment at manyMEPSs developed from attempts to bring assignments into close correspondence withrecruits' individual needs and preferences. This approach resulted in approximately 60percent of recruits destined for "A" schools being assigned by MEPS classifiers, using thePRIDE computer reservation network. The remaining 40 percent were sent to RTCs andassigned later by the COMPASS II model (Hatch, Pierce, & Fischer, 1968). COMPASS IIuaed an efficient procedure developed by Hatch (1971, 1975) and based on the network flowalgorithms of Ford and Fulkerson (1962).
During a typical recruit intei view at a MEPS, the classifier compared training schoolq,,otas tn each recruit's physical data, Armed Service. Vocational ,Aptfitude Sattery(ASVAB) scores, desired entry dates, and job preferences. A short discussion was heldwith the applicant before agreement was reached on a rating assignment. Using PRIDE,the classifier established the availability of the desired rating and entered the reservationfor a school seat. While PRIDE required the classifier to make a judgment about the bestNavy job for each applicant, most classifiers possessed a high level of expertise withrespect to only a few Navy ratings--not to all. The inconsistency of this assignmentprocess was exacerbated by .ne short time available for interviewing each applicant.
The limitations of the assignment process prompted the Navy Recruiting Command(NRC) and the Bureau of Naval Personnel to seek assistance from the Navy PersonnelResearch and Development Center (NA'PERSRANDCEN) in developing a comprehensiveclassification procedure for nonprior-se, vice males that would incorporate an optimal-sequential algorithm similar to the one used by the Air Force Advanced Personnel DataSystem's Procurement Management Information System (APDS-PROMIS) (Ward, Haney,Hendrix, & Pina, 1978). A flexible assignment process was required that would providetradeoffs between conflicting objectives and retain the advantages of APDS-PROMISwhile operating within the PRIDE computer system and exhibiting characteristics uniquelysuited to the Navy.
It appeared that a mathematical model that would produce optimal assignmnent ofapplicants as they become available offered significant potential benefits. This approachcould be employed tG model and quantify conflicting objectives and could subsequently beused to define the criterion to which an optimization procedure would be applied. The
2

a-..
•.9 assignment system proposed for development by NAVPERSRANDCEN was entitledClassification and Assignment Within PRIDE (CLASP).
The CLASP model incorporates results from earlier research. An index of predictionefficiency was developed by Horst (1954) in his attempts to produce methodologies forconstructing differential prediction test batteries. The decision index procedure, thebasis of the optimal-sequential assignment approach in APDS-PROMIS and CLASP, wasfirst proposed by Ward (1959) in his attempt to obtain close-to-optimal solutions undersequential assignment conditions. Ward noted that the size of the analysis of variance
0. interaction term describing the person-job matrix was directly related to the Horst index.The significance of this observation lies in the fact that military personnel managers r ay
KY" devise policies that affect differential classification through the linking mechanism of theinteraction term. In other words, the effectiveness of the differential assignment'U procedure can be influenced by the manipulation of policy variables. McWilliams (1970)showed that the decision index was remarkably effective in developing approximatesolutions to the transportation problem, when compared to various alternatives.
Objectives
The objectives of the effort reported here were to (I) design and construct a utilitymodel for optimal assignment of male recruit applicants and describe the weightingproblem that determined composite utility scores, (2) test the utility model in asimulated optimal-sequential assignment, and (3) compare the simulation results of the
N]'S new optimal-sequential assignment procedure with typical results from the PRIDE first-come, first-served procedure.
•- APPROACH
The set of dimensions used by a person to evaluate a prospective job will often be
different from the set used by an organization to evaluate an applicant. The whole set ofindividual and organizational dimensions may be considered as a common space character-istic of a particular person-job match. Clearly, any given match involves compromise in anumber of the dimensions by both the applicant and the organization.
2-s Preliminary discussion with NRC personnel identified several critical factors fordeveloping the CLASP person-job matching system:
SI. CLASP should consist of a utility model, designed in modules to facilitateintegrating components and implementing the model.
%*"
2. The model chould use an algorithm similar to the one used by the, Air ForceAPDS-PROMIS system.
3. The CLASP system should be compatible with the goaling procedures currentlyused by NRC.
4. The CLASP system should work compatibly with the PRIDE computerizedreservation system.
5. CLASP operating procedures should require no additional classification time atMEPS.
3

CLASP Utility Model Development
The Air Force APDS-PROMIS system was investigated and it was decided that anumber' of design concepts could be adapted for use in a Navy system. Discussions withNavy manpower and personne! decision makers resulted in guidelines to be followed indeveloping model components. Subsequently, functional forms of several CLASP modelcomponents were derived from Navy policy data, using a policy-capturing programdeveloped by Ward (1977). The CLASP mathematical model was designed to provide Navyrating (job) options to first-term, nonprior service male applicants at the MEPSs. Itincorporates Navy policy as well as data on the the applicants' abilities and preferences toachieve (1) maximum training school success, (2) optimal matching of aptitude level andjob complexity, (3) optimal matching of applicant preferences and Navy requirements, (4)orderly fill rates within all Navy jobs (ratings), and (5) balanced minority fill rates withinS~all ratings.
After preliminary policy data were gathered for each component and a tentativef unctional form produced for each, the functional forms were tested in a simulationprocedure using data from actual Navy accessions. The performance characteristics werenoted, revisions made, and refined functional forms were derived. The result was a utilitymodel that could be used to approximate a procedure for optimal person-job matching andthat could be evaluated on a larger scale.
"CLASP Model Evaluation
To test the quality of the CLASP model's person-job matching on a large scale, acomputer simulation of Navy "A" school assignments was designed. The simulation com-pared the actual assignments made by classifiers using the PRIDE reservation network tohypothetical CLASP assignments of the same recruits.
r Sample
"NRC prepared and sent to NAVPERSRANDCEN tape3 containing data for all recruitswho entered the Navy during July 1977. Out of that month's total of 11,202 recruits, 3,516were assigned to "A" school seats by classifiers using the PRIDE first-come, first-servedprocedure; and the rest, to school seats or fleet billets during recrul;t training. The 3,516
recruits assigned to "A" school by classifiers, some of whom had been recruited during thepreceding 9 months as part of a delayed-entry program, were the target population forL this research.
PRIDE Assignments
The Navy classifiers assigned the majority of the 3,516 recruits to school seats for- specific ratings: the others were assigned to occupational specialties (OCCSPEC), broad
occupational groupings comprised of many different ratings. Because the CLASPprocedure requires quotas specified by rating, the number of OCCSPEC school seats wassubdivided into the appropriate numbers of specific school seats.
For simulation purposes, a random assignment algorithm was used to place eachrecruit from an OCCSPEC category into one of the specific school seat categories. Thisprocess continued until all recruits in the OCCSPEC groupings were assigned to specificschool seats in 86 ratings (listed in Appendix A).
Lt .'

CLASP Assignments
CTASP requires that a classifier obtain recruit applicant information concerning (1)ASVAB test scores, (2) job preferences, (3) minority group membership, (4) physicalqualifications, (5) citizenship, and (6) high school graduation. The first three kind- finformation are used directly to determine rating options for each applicant; and the rest,to restrict the list to ratings for which the applicant meets the requirements.
Except for job prefere;.ces, all this information was available on the NRC data tapes.Job preference data to be used in the simulation exercise were obtained indirectly, byidentifying the job area containing the rating to which a recruit had been assigned underthe PRIDE procedure, and then specifying that this job area carry the largest value (100)on the preference scale. Since the recruits' other choices were unknown, lowerpreference scale values were randomly assigned to remaining job areas for each person.This process evaluated CLASP assignments by their degree of correspondence to PRIDEassignments, but its introduction of randomization placed the CLASP assignment pro-cedure at a disadvantage to PRIDE. Thus, the quality of the CLASP solution was lowerthan it would have been under free-choice operating conditions.
The recruit data were entered into the optimal-sequential computer program, whichproduced rating option lists for each recruit in the same order that their PRIDEreservations had been recorded in the NRC data base. The CLASP assignment wasdefined as the uppermost rating option on each person's list.
Field Test
In 1978, CLASP was field-tested at eight MEPSs in cities across the United States.Navy classifiers used CLASP to assign a total of 31d recruit applicants to "A" schooltraining. The assignments were evaluated for their overall quality (optimality) andcorrespondence to applicant preferences.
RESULTS AND DISCUSSION
CLASP Utility Model Development
The CLASP utility model was formulat-d to ensure consistent application of Navypolicies among classifiers and from one assignment to the next. It is comprised of five
(3) Navy priority/individual preference, (4) minority fill-rate, and (5) fraction fill-rate.
Each component was designed to influence the assignment procedure independently of theothers. This design does not imply strict statistical independence; rather, a slight degreeof correlation among the utility cornponents was expected.
'The CLASP classification procedure operates on a payoff matrix, a rectangular arrayof numbers representing the utilities of the various decision outcome combinations. Theutilities express the value to the Navy (on an arbitrary scale) of the consequences ofassigning a specific person to a specific job. The higher payoff values are more desirablethan the lower ones, because the probability of a person succeeding in a job is amonotonically increasing function of increasing payoff value.
The utility of assigning a particular person to a particular job is derived from aweighted linear combination of utilities, with each comporent expressing a diffetrent
51
aspect of the decision outcome. The whole utility model is a first approximation tomatching persons and jobs, taking into account the behavior and judgment of both recruitapplicants and Navy classifiers. The five compcnents are described in the followingparagraphs. .
-pplSchool Success Component
The school success component predicts success as a function of ASVAB subtestores. Before CLASP, classifiers made "A" school assignments based on the cutoff score
for a rating, without considering the degree to which an applicant might exceed thatscore. Because an applicant's potential for school success increases as his or her aptitudescores risa, the CLASP school success component was designed to incorporate informationabout the full range of aptitude scores, instead of being limited to cutoff scores. ,
Different combinations of subtest scores are used to predict school success for eachrating.
School success is measured by final "A" school performance grade. It is employed asthe criterion variable in a linear regression involving ASVAB subtest scores as predictorvariables. For each of the 86 Navy ratings used in this research, a regression equationwas obtained that produced the maximum multiple correlation between the criterion andthe predictors. The unique linear combination of predictor variables (ASVAB subtest
scores) for a given rating defines a composite score value when applied to a givenindividual. In fact, Xij, the composite score for person i and rating j. could be used to
order persons according to the degree of success expected during "A" school training inpreparation for tasks in the j'th rating.
The school success component yields a numerical value for relative utility as afunction of Xij . (the average composite score for the j'th rating), and a. (the standardIj :deviation (SD) of the distribution of X.. scores for the i.ph rating). The utility equation forthe jth rating is given by: ii
(X ij .) i
U mP+Q (. (.,J.
where:
U is the school success utility value associated with placing person i in rating j,
m, P, and Q are scaling constants, and
X ,i X, ýand a are as defined above.
Given appropriate choices of the scaling constants, the U scores could be expressed
in the same metric. This procedure facilitates comparing ratings for person i and allowsthe rating for which U.. is largest to be identified as the optimal rating with respect to
school success for person i. In all, 86 school success utility equations were developed, onefor each rating.
6
•" " " • • • "" "* " " •""" "" "" "" "" "' "" "" """-' ," "" "" "" "" '" •" "" " " " • •" •" "" '" 3" " "• "" "*•" ••'•. "" -.- %
Technical Aptitude/Job Complexity Component
In ascertaining whether an applicant is suited to a particular job, an employer mustassess the job's requirements and the applicant's abilities. In other words, the employermust decide whether a parti-ular person has the abilities required for success in aparticular job.
During a typical employment interview, an employer makes a judgment about eachapplicant's abilities, using some internai scale. This internal scale is not well defined butallows the employer to evaluate prospective employees. The employer can be morecertain, however, about the characteristics of the job and the type of person most likely
l-ý to fill the job successfully. The employer's experience enables him or her to rank-orderjobs based on the technical ability they require. This continuum forms a second scale."For example, an employer may judge that a particular person belongs to the upper 25percent of applicants, as assessed on the internal aptitude scale. A particular job may be
0 rated by the employer as belonging to the upper 25 percent of jobs on a scale of requiredtechnical ability. Having established the relative positions of both the job and theapplicant on the two scales, the employet : iust judge their correspondence to each other.In this case, there appears to be a good match, and it is likely that the applicant will beoffered the job.
The technical aptitude/job complexity component acts similarly to the evaluativetechniques used by an employer. This utility function involves two scales: (1) a measureof a recruit applicant's overall technical aptitude, and (2) a measure of the Navy rating's
difficulty or complexity. Thus, the conjunction of values determined by rank-orderingpersons and ratings allows person-job matches to be evaluated as utility values.
The technical aptitude scale was established on the basis of factor analytic results
(Shirkey, 1977). A technical aptitude factor emerged as a strong first factor in ananalysis that involvec 000 subjects responding to ASVAB test items. This analysis wassupported by previous findings in the literature, which also reported a strong technicalaptitude first factor (Fletcher & Ree, 1976). The technical aptitude factor is a compositeof four ASVAB subtest scores: (1) mechanical comprehension, (2) shop information, (3)ele, tronics information, and (4) general science. The equation employed is:
(C. - 180)A. 40.0 + 60 1 (2)(280 - 180)
where:
Ai is the technical aptitude corresponding to the i'th person, and
Ci is the technical aptitude composite of four ASVAB subtest scores for the i'th
person.
The job complexity scale was established using paired comparison methodology.Initial scale values were produced for the 86 ratings by applying the paired comparisonprocedure to two data sets: (1) experimenter judgments about the cognitive skills requiredby the 86 ratings (Marquardt & McCormick, 1973), and (2) experimenter estimates of thevisual perceptual attributes required. Data were then collected from 22 Navy enlistedrating managers who were asked to compare the job complexity of small groups of ratings.These managers ranked the complexity of 8 to 10 job!. in pairs, thus contributing to amatrix from which new scale values could be derived for all 86 ratings. The sc--ie was4.
%.
~. ~ A./ .k~ -'- - 'c ~7

then modtfied by using an iterative procedure to revise psychological values (Kroeker,g 1982).
The raw technical aptitude/job complexity utility score associated with assigningperson i to job j is given by the following equation:
Y.i 30.0 - (0.0005) (A. - 100)2 + (l1g67) (D. - 35) (3)
,.i• - (0.00001696) (A. - 100) 2 (D -35)2
(0.0001867) (A. - 100)2 35)
(0.0 1244) (D.- 35)2
where:
Y is the raw utility score of assigning person i to rating j,
Ai is the technical aptitude score for person i, and
D. is the complexity index value for rating j.
A graph of this equation is given in Figure 1.
Utilityto ! 10000
90,% s
80
,-'.340 TECHNICAL,•-• APTITUDE
70
0
-20
!460-40 0 50
40 50 60 70 80 90 100Job Complexity
Figure 1. Utility vs. job complexity at constant aptitude levels.
8I

The uppermost curve on the graph represents utility values for the highest level oftechnical aptitude (\100) across the entire range cf job complexity. The fact that thiscurve's maximum region occurs at tie upper end of the complexity scale implies atendency for the utility function to assign highly able persons to demanding jobs. The
- : curve slopes downward gently from the region of demanding jobs to less demanding ones.This gradual downward slope implies that, although it is less likely for a highly able person
* to be assigned to less demanding jobs, it is clearly possible that such assignment mayoccur, given Navy priorities or individual preferences.
The lowest curve rpresents utility values foý- the lowest level of aptitude (40) acrossthe entire range of job complexity. Its maximum region occurs at the lower end of thecomplexity scale; the sharp downward slope in the direction of increasing job complexityimplies that lower ability applicants will almost always be assigned to less complex jobs.The central curve indicates that an applicant of average ability (70) will have a reasonablechance to be assigned to all jobs. Given the shape of the utility curve, it is most likelythat he would be assigned to a rating in the intermediate complexity range.I
The final utility calculation used by the procedure was obtained by the followingequation:
Y..U. mp + Q '1-- (4)
where:j
U i is the aptitude/complexity utility associated with person i and rating j,
Y.. is the raw utility score for person i and rating J,
ay is the SDi of the population of Yscores, and
m, P, and Q are constants.
Navy Priority/Indiv~idual Preference Component
The purpose of this component is to incorporate both Navy priorities arid individual
preferences when assigning recruit applicants to ratings. These two sets of objectivesmay be incompatible, particularly if both are described by utility functions allowed tovary independently. For example, the gain in utility resulting from an expression ofstrong nref erence f or a particular rating may be of fset by a loss in utility if the rating has
~ a low Navy priority.
To overcome the deficiency of a strictly additive model, an interactive utility4 function was designed. Thus, a utility value is obtained as a function of the Navy priority
index value for a particular rating in conjunction with the specified preference value of anapplicant for that rating. To address both Navy priority and individual preference, twoscales were derived:
1. Priority scale. Navy priorities were obtained from the career reenlistmentobjectives listed by the Office of the Chief of Naval Operations. These priorities were
4=. 9

augmented and modified using rating popularAy and rating size as variables in a least-squares regression analysis. The resulting priority scale was refined by data collectedfrom 10 Navy personnel managers concerned with setting recruiting goals and "A" schoolpriorities. In a procedure similar to that used to establish the job complexity scale, theseofficers compared the relative importance to the Navy of small groups of ratings, bypairs. As with the job complexity scale, values were then further modified using aprocedure to revis,! estimates of psychological scale values (Kroeker, 1982).
2. Individual preference scale. This scale was established and applied to 14occupational categories. Rating preferences were grouped by occupational category,because recruit applicants do not have time to rank-order all 86 ratings, even if they havefull information about the entire set.
The preference point allocation procedure allows each applicant to select the 5 mostdesirable of the 14 occupational groups, rank-order the!;e 5 groups, and indicate hisinterest in each group on a 3-point scale. The preference point equation is given by:
(40.0)I(n)R(n)P(n) =60.0 + (Imax Rmax I R min(5)
ln=, 2, 3, 4, 5where:
P(n) is the preference value associated with any rating in the n'th occupational group,
I(n) is the interest index value of the n'th group,
1min' Imax are the interest index values associated with the lowest and highest
ranked occupational groups respectively, and
R R are the rank values a.,sociated with the lowest and highest rankedmin maxoccupationa' groups respectively.
For each of the five occupational groups an applicant selects, the preference pointvalue is the same for each rating in the group. For each of the remaining nineoccupational groups, the ratings are assigned a constant value near the lower end of thepreference point scale.
Given the Navy priority index value for a rating and the individual preference pointvalue for that rating, the priority/preference utility corresponding to the person-jobmatch was obtained from the following equation:
V.. = 90.0 + (0.001)W. 2 + (l.8Xzij - 100) (6)
- (0.0000014)W. 2 (Zij - 100)2
- (0.00018)W. 2 (Zij - 100)
+ (0.009)(z 1-0O)2
10
where: -
ijis the prior ity/pre fere ice utility associated with placing person i in rating j,
W. is the Navy priority index value corresponding to the j'th rating, and
zis the individual preference poinit value of person i for rating j.
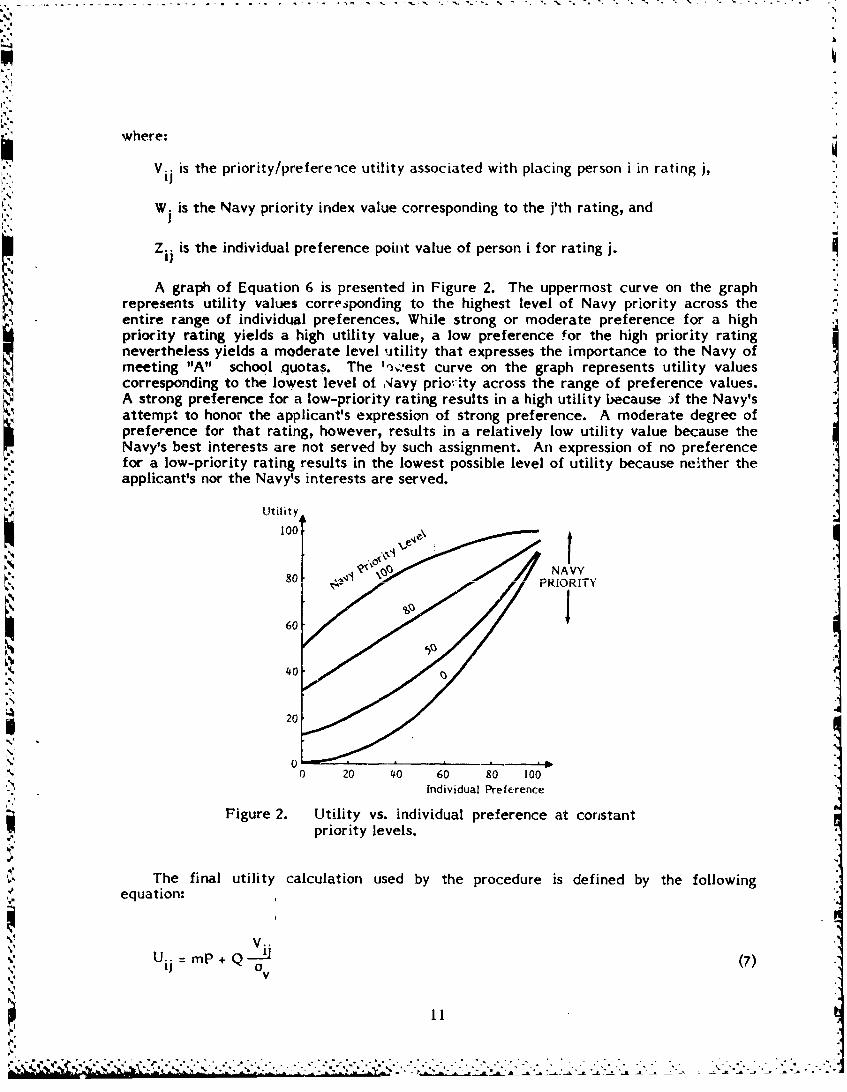
A graph of Equation 6 is presented in Figure 2. The uppermost curve on the graphrepresents utility values corresponding to the highest level of Navy priority across the
- entire range of individual preferences. While strong or moderate preference for a highpriority rating yields a high utility value, a low preference for the high priority ratingnevertheless yields a moderate level utility that expresses the importance to the Navy of
meeing"A"l school quotas. The ",)%'est curve on the graph represents utility valuescorresponding to the lowest level of Navy prio-Ity across the range of preference values.A strong preference for a low-priority rating results in a high utility because if the Navy'sattempt to honor the applicant's expression of strong preference. A moderate degree ofp reference for that rating, however, results in a relatively low utility value because theI Navy's best interests are not served by such assignment. An expression of no preferencefor a low-priority rating results in the lowest possible level of utility because neither the
K applicant's nor the Navy's interests are served.
Utility :
100.
60 1V
40
j 20
N. 00 20 40 60 80 100
Individual Preference
Figure 2. Utility vs. individual preference at constant
priority levels.
The final utility calculation used by the procedure is defined by the followingequation:
%I% V.1
U AP+ .
where:
Uij is the priority/preference utility associated with person i and rating j,
V is the raw utility score for person i and rating j,
a is the SD of the population of V. scores, and
m, P, and Q are constants.
Minority Fill-rate Component
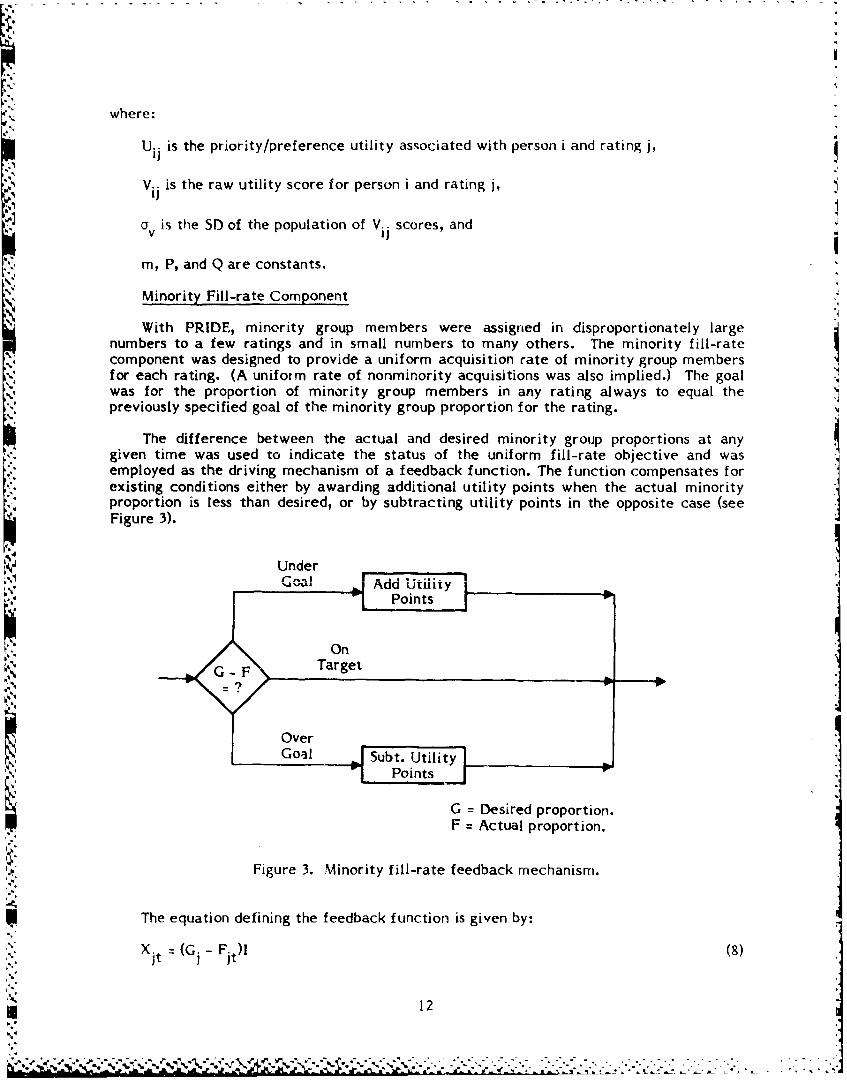
With PRIDE, minority group members were assigned in disproportionately largenumbers to a few ratings and in small numbers to many others. The minority fill-ratecomponent was designed to provide a uniform acquisition rate of minority group membersfor each rating. (A uniform rate of nonminority acquisitions was also implied.) The goalwas for the proportion of minority group members in any rating always to equal thepreviously specified goal of the minority group proportion for the rating.
The difference between the actual and desired minority group proportions at anygiven time was used to indicate the status of the uniform fill-rate objective and wasemployed as the driving mechanism of a feedback function. The function compensates forexisting conditions either by awarding additional utility points when the actual minorityproportion is less than desired, or by subtracting utility points in the opposite case (seeFigure 3).
Under
oActAdd ua1 ipoy .oS"•[ Points
OnG- F Target
OverGoal Subt. Utility
" Points I
G = Desired proportion.F = Actual proportion.
Figure 3. Minority fill-rate feedback mechanism.
The equation defining the feedback function is given by:
Xit (G -Ft)l (8)jt jit
12
-4 4k-¶h ,-. . .
"-''- .• .. •' • - '.,."-',,'.' ,,'••--,' V. ,, '•" .. x ".,...,:.,:.--. .'.-.-.--- .- -.-.. . .. ..-...-- -. .. . . . 4i
where:
G tis the desired minority proportion for rating j,
Fjisthe aculminority proportion within rating j at time t, and
I is an idctrvariable assuming the value +1 for minority group members and -1othrie
The minority fill-rate utility function was governed strictly by the difference inproportions observed within rating j at any given time t. The equation corresponding tothis utility function was given by:
=mP +sQ Lt (9)
where:
Y. is the minority fill-rate utility for person i with respect to rating j at time t,ijt
* S X is the proportion difference within rating j at time t),
- ~ ~ ~ ~ C inm thp e-risc. rcA n-nmna. tp rnpnrt.ion wihn -A r~.n
m, s, P, and Q are constants.
Fraction Fill-rate Component
With PRIDE assignments, the end of any recruiting month was typically marked by aflurry of recruiting activity aimed at filling a substantial number of positions in certainratings, largely because there was no systematic assignment procedure to acquirepersonnel at a uniform rate within ratings. From a managerial perspective, a procedureresulting in a uniform rate of acquisition is highly desirable. The fraction fill-ratecomponent was designed to compare the proportion of applicants assigned to a particularrating with the average proportion of applicants assigned to all ratings at that time. Ifthe proportion for the rating in question is below the average, additional utility points are
* -; awarded to influence the applicant to select that rating. If he does, the rating proportion%* moves closer to the average value.
rating exceeds the average value. If another rating is selected instead, the resultingaverage proportion value increases slightly, thereby moving toward the value of the ratingproportion. The operational part of the utility function is given by the equation:
IIT. =tBt -F. (10
13

where:
T.t is the difference in proportions for rating j at time t,
Tel r. the weighte•; aw-rage of proportions across all ratings at time t, and
F is the proportion of applicants that have been assigned to openings within rating jup to time t.
4The fraction fill-rate utility function was represented by the following equation:
Yijt Y mP + r QTjt 011)
where:
Y is the fraction fill-rate utility given to person i with respect to rating j at time t,ijt
T.t is the difference in proportion for rating j at time t,
and m, r, P, and Q are constants.
The fraction fill-rate component acts as a feedback mechanism driven by thediscrepancy between the fill proportion for a specific rating and the average proportion.Its advantage lies in the fact that it is not directly time-dependent, relying instead on thefeedback characteristics to accomplish a uniform rate of accession across iatings. It is"important to note that the procedure does not presuppose a uniform rate of fill acrosstime but, rather, accommodates any prospective applicant arrival rate (see Figure 4).
I Below
" BAverage WiheAdd Utilityap." "1 Points_
Target
'-" B = Weighted average of proportions.
F = Actual proportion.
Figure 4. Fraction fill-i component.
N,* . .
\7
Composite Utility
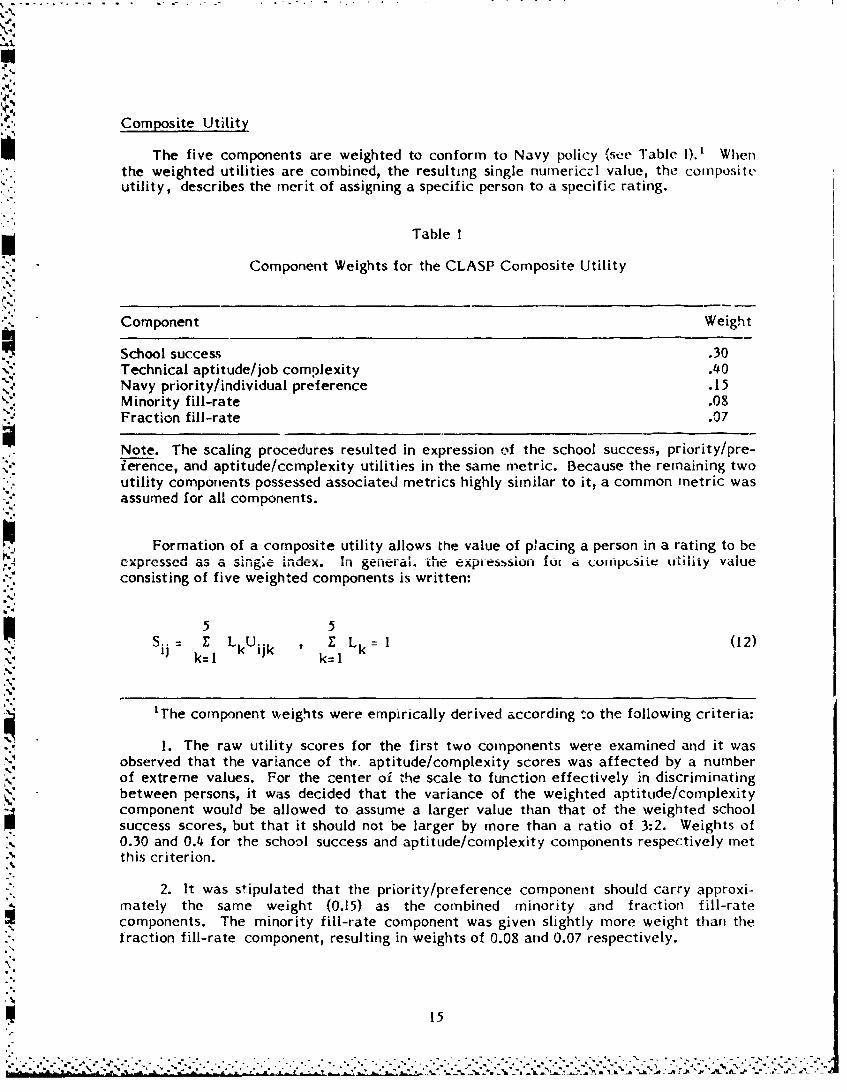
The five components are weighted to conform to Navy policy (see Table 1).1 Whenthe weighted utilities are combined, the resulting single numericcl value, the compositeutility, describes the merit of assigning a specific person to a specific rating.
Table I
Component Weights for the CLASP Composite Utility
Component Weight
School success .30Technical aptitude/job complexity .40Navy priority/individual preference .15Minority fill-rate .08Fraction fill-rate .07
Note. The scaling procedures resulted in expression of the school success, priority/pre-ference, and aptitude/ccmplexity utilities in the same metric. Because the remaining twoutility components possessed associated metrics highly similar to it, a common metric wasassumed for all components.
Formation of a composite utility allows the value of placing a person in a rating to beexpressed as a index. in general, &.. . pens i f0i c CUbLe ulity valueconsisting of five weighted components is written:
5 5... Z LkUijk E L k 1 (12)
k=1 k=1
'The component weights were empirically derived according to the following criteria:
1. The raw utility scores for the first two components were examined and it wasobserved that the variance of th. aptitude/complexity scores was affected by a numberof extreme values. For the center of the scale to function effectively in discriminatingbetween persons, it was decided that the variance of the weighted aptitude/complexitycomponent would be allowed to assume a larger value than that of the weighted schoolsuccess scores, but that it should not be larger by more than a ratio of 3:2. Weights of0.30 and 0.4 for the school success and aptitude/complexity components respectively met
-'- this criterion.
2. It was stipulated that the priority/preference component should carry approxi-mately the same weight (0.15) as the combined minority and fraction fill-ratecomponents. The minority fill-rate component was given slightly more weight than thefraction fill-rate component, resulting in weights of 0.08 and 0.07 respectively.
15* .. *. * . . . . . .- _. ? ~ .
where:
Sij is the composite utility associated with assigning person i to rating j, jU is the utility associated with person i for rating j on component k, andijk,
L is the decision maker's weight associated with component k.kIDecision Index Proc.!dure
"*1In CLASP assignments, every recruit applicant is initially considered a potential
candidate for every rating and receives a composite utility score for each one. Each 4
composite utility score, obtained by calculating the value of the five utility componentsand weighting them as described earlier, is compared with the average composite utilityor the decision index mean value for each rating; the difference is called the decisionlindex (DI) score (McWilliams, 1970; Ward, 1959;. Thus, a DI score Js calculated for everypossible person-job combination.
The DI score is calculated as follows: In a matrix S having I rows (person) and Jcolumns (ratings) and in which the elements S.. are composite utility values corresponding
"to the i.Th person and the fth rating, any composite utility value may be written:
Si S.. + (Si.-S)+(So -m..) (13)
+ (Si -.- s.i +
The only part of this expression carrying information concerning the suitability ofpersorn i for rating j is the far right-hand term. For a fixed value of i (i.e., for a givenperson), the far right-hand term contains only two variable quantities, S.. and S...Rewriting the term produces: iJ
S. - S- S. + S.. S.. - S. -K (14)
for a fixed value of i and where K is a constant. The expression
DI (S -S.) (15)
forms the operational part of the procedure. Recall that S.. represents the composite
utility associated with assigning person i to rating j, and S.. represents the meancomposite utility for rating j across all persons.
The DI mean, -.. , for a given recruiting month forms the basis for the subsequent
operation of the optimal-sequential assignment procedure. Changing the set of DI meansin the procedure yields different assignments. (1I1 means for the July 1977 data set appearin Appendix B.) When recruit applicant population characteristics do not change acrossmonths, a highly stable 01 mean configuratioi, results, with minimal disturbancesoccurring in the assignment system. However, when the characteristics change radically,
N it is necessary to adjust the DI rnean profile to operate the procedure at maximum.1% ef ficiency.
16
'L " " • " d • • t -° ' • . • • •1I . ' -' : ' t •, . . ' ,, ! , '. . . . . . . .
After Dl values are calculated for all ratings for each person, they are ranked from
highest to lowest. The highest DI value identifies the rating for which a person comparesmost favorably with the population of qualified individuals. Because the DI values can bedifficult to interpret, an optimality index (01) was developed to assist classifiers withcomparisons.
Optimality Index
To facilitate comparisons among ratings, the DI values were rescaled to a commonmetric by means of the following equation:
(Si. = S..)
Rij 0 + 20 (16)
where:
Rij is the rescaled value of rating j for person i,
(S -S.j) is the DI for person i with respect to job j, and
U. is the SD of the DI values for person i.i
When the largest Rij value for person i is represented by Rmax, the second rescaling
involves enly a translation of the origin and is given by the equation:
&ij = R + (100 - R ) (17)I.jj ij max
where:
0ij is the optimality index value associated with rating j for ptrson i.
The 01 allows ratings positioned at different points along the scale to be comparedeasily. Setting the largest 01 to an arbitrary va!ue of 100 defines a convenient frame ofreference to help classifiers underscore tMe need for selecting options near the top of theratings lists when they discuss these lists with recruit applicants.
List Presentation Strategy
01 scores enable the rating options for each recruit applicant to be ordered so thatthe highest ranked is the optimal ratinp for the applicant because its relative utility isgreatest. After rank-ordering, the list of ratings is reduced by removing all those forwhich an applicant does not qualify or for which there is no opening within the recruitingmonth in question.
Because the ultimate objective of the CLASP assignment procedure is acquiringpersons who select optimal ratings, it is inefficient to expend significant resources indetermining an ordered list of ratings for an applicant without a list presentation strategythat attempts to influence the applicant's choice. When a class'fier presents the amended
'.5 ratings list to an applicant, the optimal jobs, on the top of the list, would be discussed
17
,--.

first. Ideally, the applicant would select the first rating, which is associated with themaximum utility when individual and organizational objectives are considered jointly. Inpractice, however, the applicant would be likely to select a rating further down the listbecause he would be evaluating ratings solely from his own perspective. When theclassifier and the applicant reach a compromise, a reservation is made for the ratingagreed on by both people.
* if an applicant rejected the ratings at the top and undertook a search lower on thelist, the 01 score might be so low at some point that the Navy would not be interested inassigning the person to such ratings because mrany other applicants could be identified as
* more suitable candidates. Even though a lower ranked rating may be desirable from a* personal perspective, it may not be equally desirable from an organizational one.
- . Any particular list may have been affected by the deletion of ratings with filledquotas. Because some of these deleted ratings may be attractive to an applicant, it isworth considering rating options for a future recruiting month, in which the quotas may beunf illed.
N Future Rating Options
A second list may be prepared that includes ratings available in future recruitingmonths (see Table 2). Rating options are displayed within a given recruiting month if thefollowing criteria are met: (1) the quotas for the ratings are open, (2) the applicantqualifies for the ratings, and (3) the 01 for each rating exceeds a specified minimumvalue.
Li Table 2Rating Options Lists Ordered by Recruiting Month for a Hyp..thetical Recruit Applicant
Jan a Feb Mar Apr May Jun Jul Aug Sep
Job D Job C Job B Job A .
Job H Job D Job C 2Job BJob I Job H Job D Job CJob N Job!I Job G Job D
V.'.,etc.
a Current recruiting month.
Although the hypothetical applicant in Table 2 may qualify for jobs A, B, and C, theyr 11ý%do not appear on the optimal ratings list for the current recruiting month because the
quotas are filled. For this applicant, the jobs with the highest 01s appear in the listsfarthest from the current recruiting inonth.
Significant benefit can accrue to the Navy if rating options from the top of the listcan be secured foc- an applicant in a future recruiting month. To facilitate this process,CLAW'I allows rating options for as many as 12 months to be displayed at the computerterminal. A maximum of 15 rating options can be displayed for the current month, 10options for the next mor.th, and 5 options for each following month. Rating optionschosen from future recruiting months are constrained to be among those bearing high 01values. Consequently, there is greater flexibility in rating options in the current month,at the risk of lower 01 scores, while greater control and higher 01 scores may be obtainedin distant recruiting mont~hs.
18

K'
CLASP and PRIDE Assignment Evaluation and Comparison
The simulation process applied to the July 1977 data set resulted in the allocation of3,450 school seats. Sixty-six persons (1.9%) did not receive assignments, partly because ofan artifactual constraint that is discussed on page 21, and partly because the data baseincluded personnel for whom admission requirements had been waived and who could,therefore, not legitimately receive a simulation assignment.
Overall Assignment Quality
Table 3 displays the rating options list prepared for the first recruit on the simulationdata tape. The 01 defines the value of assigning this person to a specific rating. Thetable also enables comparisons between the quality of the assignment made under theCLASP and PRIDE procedures. In this example, the recruit was actually assigned throughPRIDE as a sonar technician (ST) in the advanced electronics field (AEF) and hypo-I! thetically assigned through CLASP as an aviation electronics technician (AT) in the AEFS~group.
Table 3
Rating Options List for First Recruit on Simulation Data Tape
Rank Ratinga Optimality Index (01)
I b AT (AEF) 1002 DS (AEF) 943 ET (AEF) 934'" EA 91
5 PE (AEF) 886 AT 867 AX (AEF) 868 FT (AEF) 849 MM (NF) 84
10 ET (NF) 8411 EW (AEF) 8312 JO 8313 c ST (AEF) 82
14 AW 81,. • 15 EM (NF) 81
"16 AE 7817 TD 7618 MR 7519 ET 7520 AG 74
aAEF = Aviation electronics field, and NF = Nuclear field; titles of ratings are provided in
Appendix A.bCLASP assignment.
c PRIDE assignment.
19
%, %. -
J.
A measure of agreement between the results of the CLASP and PRIDE assignmentprocedures and an ideal level of assignment quality was obtained using a weighted meansquare (MS) statistic consisting of the weighted sum of squared deviations from an 01level of 100, divided by the total number of assignments made.
This measure yielded the following values: CLASP deviation M.S =749.6 and PRIDEdeviation MS =1337.4. The results indicated that the CLASP optimal-sequential pro-
L cedure produced closer agreement with the assignment quality level desired by personnelplanners. If a more realistic estimate of the highest average optimality attainable underoperational conditions (e.g., the 1978 field test values of 92.6 or 89.0) had been usedinstead of the ideal value of 100, the MS sta.:istical criterion would have favored theoptimal-sequential procedure even more heavily.
The extent of potential improvement in assignment quality that can be achieved byusing the optimal-sequential procedure was difficult to quantify. Figure 5 indicatespotential improvement by displaying the frequency of impro~ ement score categories.Depicted along the abscissa, these categories were based on the! difference in optimalityobtained under the two procedures for each assignment. The majority of casesdemonstrated a moderate degree of improvement in assignment quality. The remainder,particularly those cases involving simulation assignments near the end of the recruitingperiod, demonstrated an inferior assignment.
Frequency
600
500
400
300
200
-5-10 -5 0 5 10 15 20 2530 35 40 45 >45
OpiaiyImprovement Score(CAPassignment minus
Figure 5. Number of simulated assignments vs. improvement in optimality.
20
Assignment Quality Over Time
The assignment simulation using the July 1977 data base demonstrated that overall7assignment quality was best in the first month, when all positions were vacant, anddeteriorated toward the end of the simulated time period, when very few positions
$remained unfilled. To explain this phenomenon, two indices of relative allocationeffectiveness were defined. The first, labeled 6 (assignment quality), was the differencein 01 values between the optimal job on a list unconstrained by quotas and the bestavailable job, the job whose 01 value was largest on the list of available positions. The
* second index, E: (quality discrepancy), was the difference in 01 values between the bestavailable job and the one actually assigned under the PRIDE first-come, first-served
k. It.procedure. The 6 index was used to assess the performance of the CLASP optimal-sequential procedure as a function of time.
The average value of 6 for each month was calculated from the simulatedassignments made during that month. Figure 6 illustrates the deterioration of assignment9quality over time as measured by 6. The relationship is described by a correlation of0.96.
Deterioration 4in 'n.4
AssignmentQuality
30
202* 20
Teresult shown in Figure 6 was affected by the simulation constraint that requiredeveryone in the simulation sample to be assigned to openings available in July 1977. Inpractice, under a flexible delayed-entry program, there is no such last-minute need to fillthe remaining positions with the limited number of available persons. Under realoperating conditions, the population considered for the July 1977 openings and thelikelihood of higher quality assignments would be increased.
I This artifactual effect was most pronounced during the late stages of the CLASPsimulation and may have accounted for the elevation of the July 6 value in Figure 6 to alevel of 1.5 standard error units above the predicted value.
21
An average c value for each month was calculated from the difference in 01 valuesbetween the simulated (CLASP) and actual (PRIDE) assignments. The graph in Figure 7indicates that the difference in quality between the CLASP and PRIDE procedures, asmeasured by c, decreased with time. The relationship was described by a correlation of
20
cLASP/PRIDE 2Quality
Discrepancy 15
10
NNov Dec Jan Feb Mar Apr May Jun Jul% Time in Months
A Figure 7. Reduction in quality discrepancy over time.
For the purpose of this research, assignment quality was defined in terms of high 01values that systematically represented policy considerations and consistently applied themto person characteristics and job properties. Within this frame of reference, the CLASPoptimal-sequential procedure was a more effective mechanism for carrying ou~t personnelacquisition policies than was the PRIDE first-come, first-served procedure. As indicatedby the large positive e value in Figure 7, CLASP was particularly effective Zt the outsetof the recruiting period. Although e assumed a value near zero during the last month,
j indicating that the two procedures were approximately equally effective near the end ofthe recruiting period, E Would not decrease so rapidly in a field recruiting situation as inthis simulation. As previously noted, under real operating conditions, a larger number ofpotential candidates would be considered for the unfilled positions at the end of arecruiting period. Consequently, person-job matching for the last positions would bebetter and the final s value would be higher.
S At the end of the simulated CLASP assignment, the observed E: value fell 1.3 standarderror units below the predicted value (see Figure 7), implying substantially poorer qualityassignments than under the PRIDE procedure. This effect, a result of force-fitting thelate-arriving personnel to the remaining positions, was an artificial constraint imposr- 'vsimulation and was of similar size to the discrepancy in 6 values discussed earlier.
3 22

Assignment Quality vs. Recruiting Quotas
A number of performance comparisons between the CLASP and PRIDE procedurescan be made using Figure 8, which depicts the relationship between average 01 andpercentages of the total quota that would be filled using six different assumptions. Theactual assignment curve, labeled PRIDE, represents the average O under first-come,first-served conditions. The remaining curves were generated using CLASP procedures.Curve I represents the average 01 under the assumption that everyone selected the first(highest valued) job on the optimal list. Curves 5 through 20 use the assumptions that allpersons chose the jobs ranked 5th, 10th, 15th, and 20th respectively.
AverageOptimalityIndex (01)
1:0 PRIDE
40 1 CLASP
220
0 20. 40 60 80 too
Percentage of Total Quota
Figure 8. Optimality index vs. percentage of totalquota filled using six assumptions.
In Figure 8, the horizontal axis does not represent a linear time scale. For example,there is a 5-week time interval between the 0 and 10 percent points on the abscissa butonly a 3-week interval between the 90 and 100 percent points. The shape of the functionsalters slightly when average optirnality is plotted against time, the curves exhibitingslightly negative slopes for a longer portion of the horizontal axis than in Figure 8. Thecurves also display a more pronounced drop toward the axis at the end of the time period,primarily due to the artificial simulation constraint discussed previously.
The simulation-generated curves in Figure 8 display a marked decrease in the averageoptimality due to the force-fitting phenomenon near the end of the recruiting period,while the actual assignment curve (PRIDE) shows only a slight decline. Although it wassomewhat more difficult to assign personnel at high optimality levels by the end of thesimulated recruiting period, curves generated under normal operating conditions with theoptimal-sequential assignment procedure are expected to exhibit at most a moderatedecline.
23
MO.~. . .. .
As indicated in Figure 8, average optimality varied as a function of position on theoptimal list, with assignment quality decreasing most rapidly among the top-rankedchoices. In other words, dropping from the highest ranked to the 2nd job option had amore serious effect than descending from the 19th to the 20th. Under normal operatingconditions, the average optimality of the top-ranked choice under CLASP is expected toexceed that of the average choice under PRIDE by as much as 20 points. Simulationconstraints precluded determining more exact estimates.
The average 01 values for each of the two assignment procedures are listed by jobcategory (rating) in Table 4. IL' should be noted that the values obtained under theoptimal-sequential procedure in the CLASP column are underestimates of the true valuesbecause of the simulation constraints mentioned earlier. Nevertheless, they usuallyexceed the average value obtained under the PRIDE first-comne, first-served procedure.Several ratings with quotas of zero were not included ;n the analyses but are shown inTable 4 as part of the complete list.
Under actual operating conditions, recruit applicants would choose at various levelson the optimal list. Although no simulation results were available for a policy permittingdifferent choice levels, the 1978 field test produced average choice levels ranging from
* 1.63 to 3.10 and corresponding average 01 values ranging from 90.0 to 85.7 (see Table 5).The average 01 value of 87.3 and average rank of 2.24 are consistent with the data in
Figure 8. The data in Table 5 are also in close agreement with those reported by CNRCfor a 1980 field test, in which an average rank of 2.77 was obtained, with 57 percent of therecruit applicants selecting the highest ranked job on the ordered lists.2
"A"l School Attrition CostThe potential effectiveness of the CLASP procedure was partially assessed with
respect to "A"l school attrition cost. Table 6 presents Navy ratings ranked by improve-m ent potential, which is the difference between average 01 scores under CLASP andP RIDE procedures as calculated from the simulation data set, and "A"l school attritioncost as calculated by Middleton, Rankin, Green, and Papetti (1977). The correlationbetween the two sets of ranks was 0.39, suggesting that improved matching of persons tojobs may be a significant factor in the ultimate reduction of attrition and attrition cost.
Fraction and Minority Fill Rates
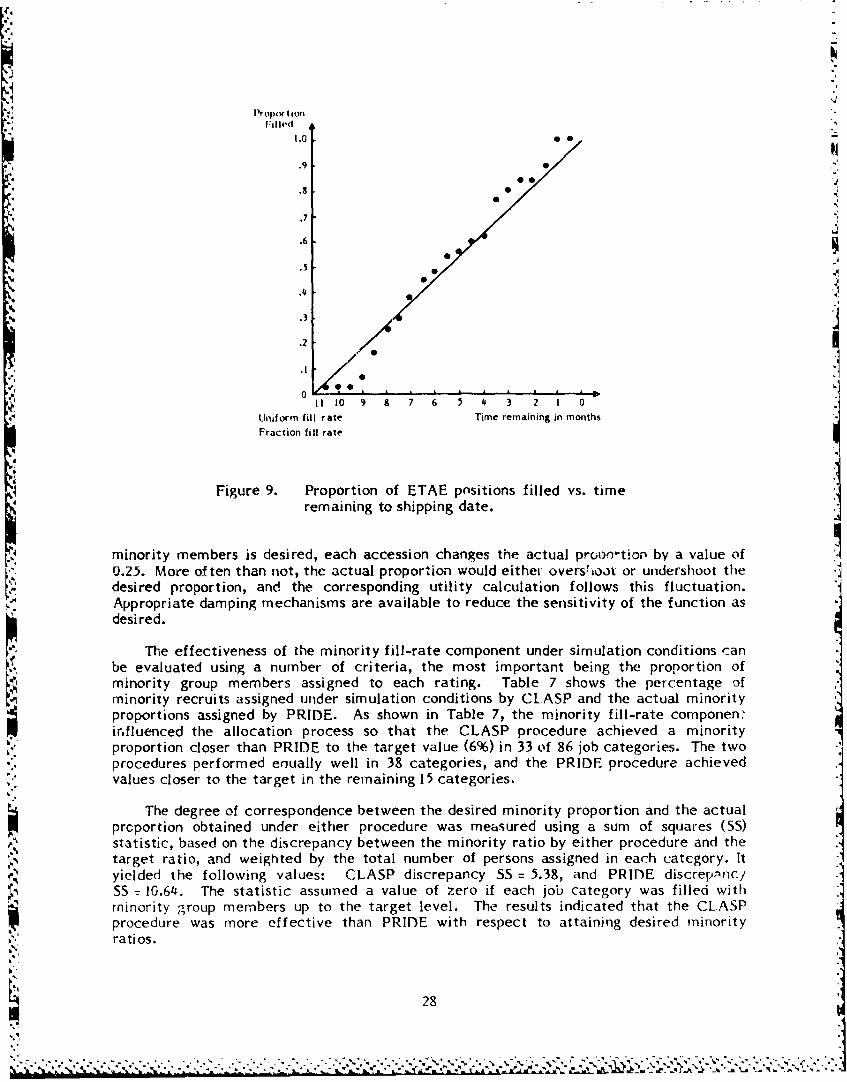
To fill a given rating's quota at a uniform rate within a given shipping month, theCLASP fraction fill-rate component allocates utility points to increase or decreaseemphasis on that job category. A typical simulation graph showing the relationshipbetween the proportion of advanced electronic technician (ETAE) positions filled with
k~. qualified applicants and time remaining until the shipping month is presented in Figure 9.The fraction fill-rate function in this illustration corrects for th~e relative deficiencyduring the early months, numbered 11 through 8, and for the relative oversupply during
r the later months, numbered 4 through 0.
The operation of the minority fill-rate function displays similar characteristics.However, the corrections appear more drastic because the relative discrepancies betweenactual and desired proportions are affected to a greater de2gree by a single additionalaccession in a job category with a small goal. For example, when a target goal of four
2Black, CDR 3.H. CNRC-24. Personal communication, March 1981.
24 . .
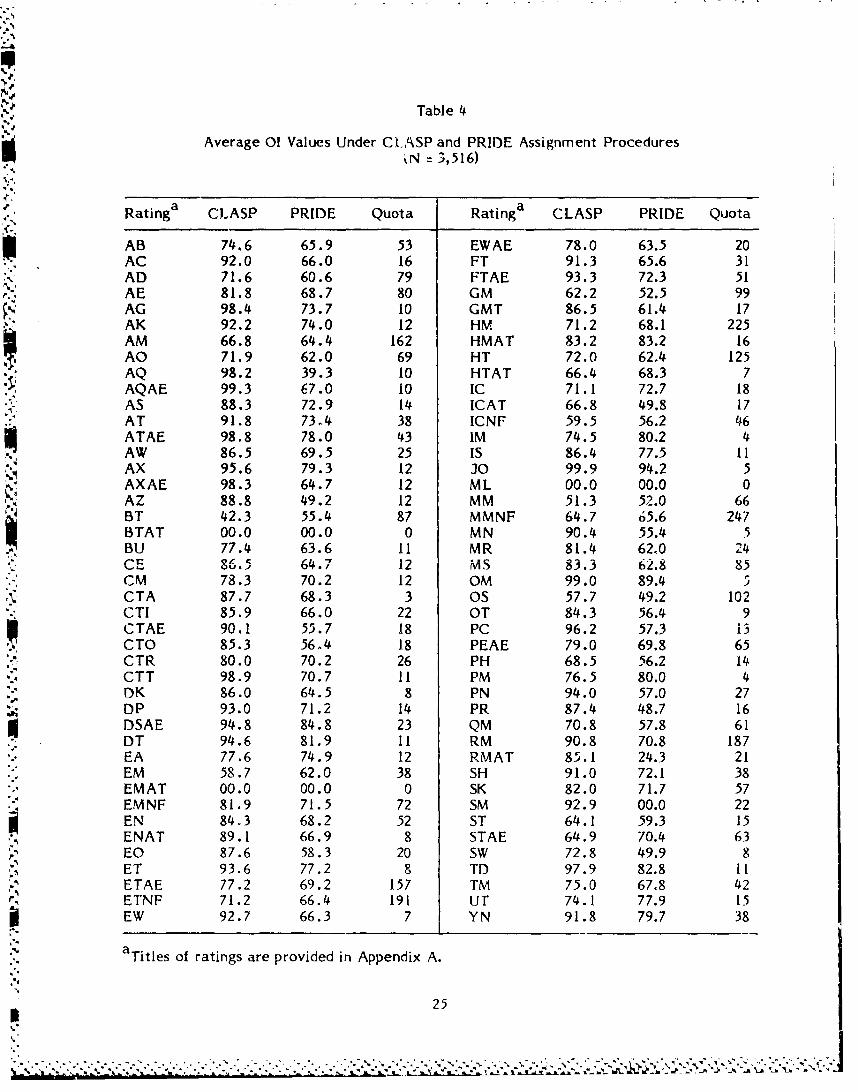
Table 4
Average O Values Under CI.ASP and PRIDE Assignment Procedures
%N 3,516)
Rating CLASP PRIDE Quota Rating CLASP PRIDE Quota
AB 74.6 65.9 53 EWAE 78.0 63.5 20AC 92.0 66.0 16 FT 91.3 65.6 31AD 71.6 60.6 79 FTAE 93.3 72.3 51AE 81.8 68.7 80 GM 62.2 52.5 99AG 98.4 73.7 10 GMT 86.5 61.4 17AK 92.2 74.0 12 HM 71.2 68.1 225AM 66.8 64.4 162 HMAT 83.2 83.2 16AO 71.9 62.0 69 HT 72.0 62.4 125AQ 98.2 39.3 10 HTAT 66.4 68.3 7AQAE 99.3 67.0 10 IC 71.1 72.7 18AS 88.3 72.9 14 ICAT 66.8 49.8 17AT 91.8 73.4 38 ICNF 59.5 56.2 46ATAE 98.8 78.0 43 IM 74.5 80.2 4AW 86.5 69.5 25 IS 86.4 77.5 11AX 95.6 79.3 12 30 99.9 94.2 5AXAE 98.3 64.7 12 ML 00.0 00.0 0AZ 88.8 49.2 12 MM 51.3 52.0 66BT 42.3 55.4 87 MMNF 64.7 65.6 247BTAT 00.0 00.0 0 MN 90.4 55.4 5BU 77.4 63.6 11 MR 81.4 62,0 2 4CE• 86. 64.7 12 MS 83.3 62.8 85CM 78.3 70.2 12 OM 99.0 89.4 5CTA 87.7 68.3 3 OS 57.7 49.2 102CTI 85.9 66.0 22 OT 84.3 56.4 9CTAE 90.1 55.7 18 PC 96.2 57.3 13CTO 85.3 56.4 18 PEAE 79.0 69.8 65CTR 80.0 70.2 26 PH 68.5 56.2 14CTT 98.9 70.7 11 PM 76.5 80.0 4DK 86.0 64.5 8 PN 94.0 57.0 27DP 93.0 71.2 14 PR 87.4 48.7 16DSAE 94.8 84.8 23 QM 70.8 57.8 61DT 94.6 81.9 11 RM 90.8 70.8 187EA 77.6 74.9 12 RMAT 85.1 24.3 21EM 58.7 62.0 38 SH 91.0 72.1 38
"" EMAT 00.0 00.0 0 SK 82.0 71.7 57EMNF 81.9 71.5 72 SM 92.9 00.0 22EN 84.3 68.2 52 ST 64.1 59.3 15ENAT 89.1 66.9 8 STAE 64.9 70.4 63E# 87.6 58.3 20 SW 72.8 49.9 8ET 93.6 77.2 8 TD 97.9 82.8 11
.4 ETAE 77.2 69.2 157 TM 75.0 67.8 42ETNF 71.2 66.4 191 u r 74.1 77.9 15EW 92.7 66.3 7 YN 91.8 79.7 38
aTitles of ratings are provided in Appendix A.
25
.4 ,..,.,> .,.,.,.,,.-. ., . ".. . . ., . ..... , .•:.:.-,<': , ,c 2, • ,X , • ,: : :'.,,,. -. • .. • . -!,

Table 5
1978 Field Test Assignment Results
Average Average ChoiceSite N Optimality Index (01) on Rating List
Phoenix 30 90.0 1.64Oakland 64 86.6 3.10Boston 81 88.1 2.38Chicago 10 90.6 2.80Minneapolis 39 79.9 2.11Des Moines 19 85.7 2.40Houston A 0'4~.00
Miami 64 90 .9 1.63
%Total 341----Overall Average -- - 87.3 2.24
26
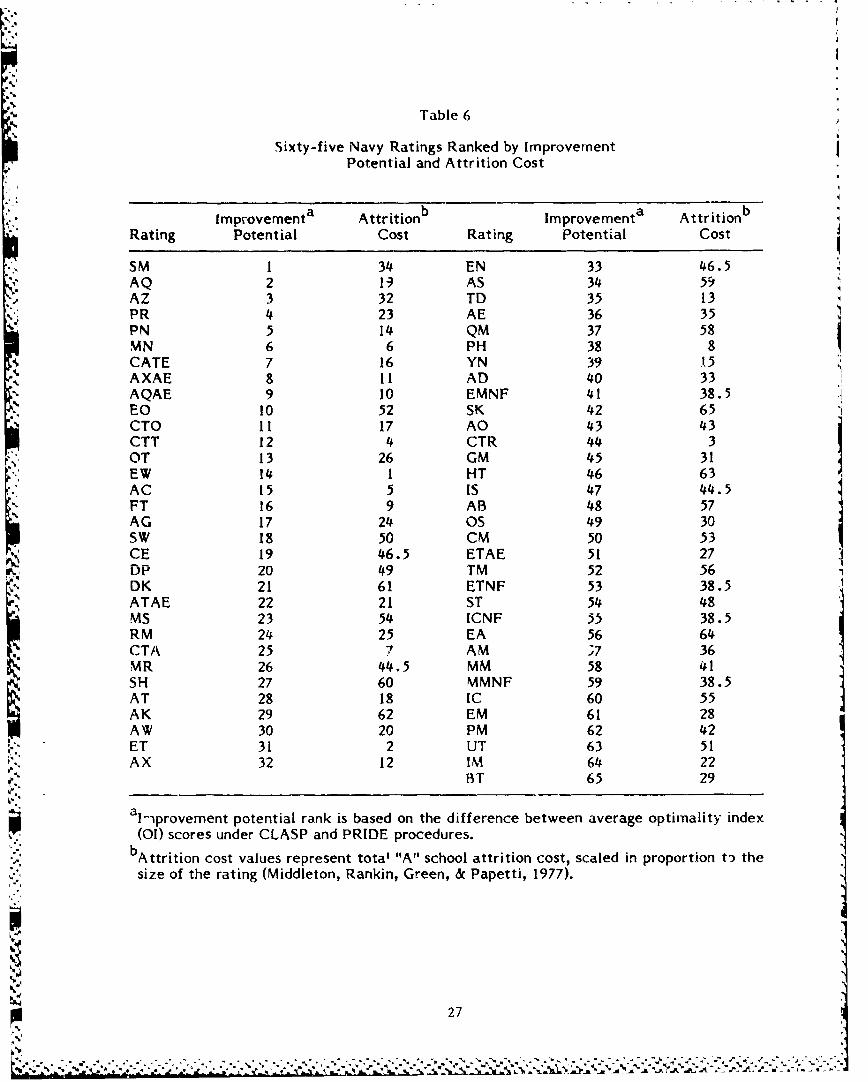
Table 6
Sixty-five Navy Ratings Ranked by ImprovementPotential and Attrition Cost
Improvementa Attritionb Improvementa AttritionRating Potential Cost Rating Potential Cost
SM 1 34 EN 33 46.5AQ 2 19 AS 34 59AZ 3 32 TD 35 13PR 4 23 AE 36 35PN 5 14 QM 37 58MN 6 6 PH 38 8CATE 7 16 YN 39 15AXAE 8 11 AD 40 33AQAE 9 10 EMNF 41 38.5"EO 10 52 SK 42 65CTO 11 17 AO 43 43CTT 12 4 CTR 44 3OT 13 26 GM 45 31EW 14 1 HT 46 63AC 15 5 is 47 44.5FT 16 9 AB 48 57AG 17 24 OS 49 30SW 18 50 CM 50 53CE 19 46.5 ETAE 51 27DP 20 49 TM 52 56DK 21 61 ETNF 53 38.5ATAE 22 21 ST 54 48MS 23 54 ICNF 55 38.5RM 24 25 EA 56 64CTA 25 7 AM .;7 36M R 26 44.5 MM 58 41SH 27 60 MMNF 59 38.5AT 28 18 IC 60 55AK 29 62 EM 61 28AW 30 20 PM 62 42ET 31 2 UT 63 51AX 32 12 IM 64 22
BT 65 29
a 1-.provement potential rank is based on the difference between average optirnality index
(01) scores under CLASP and PRIDE procedures.bAttrition cost values represent total "A" school attrition cost, scaled in proportion t the
size of the rating (Middleton, Rankin, Green, & Papetti, 1977).
27
r7,
44q
Propor tionFilled
1.0
.9SO0@
.7
.6
N .5
.4
*0~ .3
.2"l•• i°
II 10 9 8 7 6 5 4 3 2 1 0Uniform fill rate Time remaining in monthsFraction fill rate
Figure 9. Proportion of ETAE positions filled vs. timeremaining to shipping date.
minority members is desired, each accession changes the actual proon'tion by a value of0.25. More often than not, the actual proportion would either overs!,oot or undershoot thedesired proportion, and the corresponding utility calculation follows this fluctuation.Appropriate damping mechanisms are available to reduce the sensitivity of the function asdesi red.
The effectiveness of the minority fill-rate component under simulation conditions can
be evaluated using a number of criteria, the most important being the proportion ofminority group members assigned to each rating. Table 7 shows the percentage ofminority recruits assigned under simulation conditions by CLASP and the actual minorityproportions assigned by PRIDE. As shown in Table 7, the minority fill-rate componen'irnfluenced the allocation process so that the CLASP procedure achieved a minorityproportion closer than PRIDE to the target value (6%) in 33 of 86 job categories. The two
procedures performed equally well in 38 categories, and the PRIDE procedure achievedvalues closer to the target in the remaining 15 categories.
The degree of correspondence between the desired minority proportion and the actualprcportion obtained under either procedure was measured using a sum of squares (SS)statistic, based on the discrepancy between the minority ratio by either procedure and thetarget ratio, and weighted by the total number" of persons assigned in each category. Ityielded the following values: CLASP discrepancy SS = 5.38, and PRIDE discreprnc/SS 7 10.64. The statistic assumed a value of zero if each job category was filled withminority group members up to the target level. The results indicated that the CLASPprocedure was more effective than PRIDE with respect to attaining desired minorityratios.
28
.~. . .' ..

Table 7
Minority Ratios Obtained Under CLASP and PRIDE Assignment Procedures
Minority Recruits Minority RecruitsAssigned Assigned
Rating RatingQuota CLASP PRIDE Quota CLASP PRIDE
Ratinga (N) (%) (%) Ratinga (N) (%) (%)
AB 53 10 12 EWAE 20 5 5AC 16 6 6 FT 31 3 0AD 79 9 6 FTAE 51 2 6AE 80 1 8 GM 99 10 7AG 10 0 0 GMT 17 6 6AK 12 8 8 HM 225 12 11AM 162 8 7 HMAT 16 6 6AO 69 6 16 HT 125 8 2AQ 10 10 0 HTAT 7 0 0AQAE 10 10 0 IC 18 11 6AS 14 0 0 ICAT 17 6 0AT 38 0 3 ICNF 46 2 2ATAE 43 2 7 IM 0 0AW 25 0 0 iS 11 0 0AX 12 0 0 3O 5 0 0AXAE 12 0 8 ML 0 0 0AZ 12 0 17 MM 66 8 3BT 87 6 3 MMNF 247 3 2BTAT 0 0 0 MN 5 0 0BU 11 0 0 MR 24 4 0CE 12 8 0 MS 85 13 8CAM 12 8 0 OM 5 0 0CTA 3 0 33 OS 102 10 2CTI 22 5 0 OT 9 0 0CTAE 18 0 11 PC 13 0 15CTO 18 6 0 PEAE 65 3 0CTR 26 12 12 PH 14 7 8C TT 11 9 11 PM 4 0 0DK 8 12 0 PN 27 7 27DP 14 14 8 PR 16 0 0DSAE 23 4 13 QM 61 5 7DT 11 0 27 RM 187 9 14EA 12 0 0 RMAT 21 5 5EM 38 10 5 SH 38 13 17EMAT 0 0 0 SK 57 10 14EMNF 72 0 0 SM 22 9 0EN 52 4 2 ST 15 0 0ENAT 8 0 0 STAE 63 3 3EO 20 0 0 Sw 8 12 14ET 8 0 0 TD 11 9 9ETAE 157 5 4 I'M 42 10 17ETNF 191 2 1 UT 15 7 0EW 7 14 14 YN 38 5 !6
4Titles of ratings are provided in Appendix A.
29
fa-

CONCLUSIONS
CLASP provides decision-makers with an improved tool for personnel classificationand placement. It enables managers to make personnel decisions with both greater.accuracy and greater concern for individual applicants. Under both field tcst andsimulation conditions, the CLASP optimal-sequential assignment procedure assignedpersonnel more effectively to optimal ratings than did the PRIDE first-come, first-servedprocedure. In addition, CLASP minority ratios more closely approximated specifiedtarget ratios, and "A" school seat allocation proceeded at a more uniform rate under allconditions tested.
Comparisons between the CLASP and PRIDE procedures were frequently based onscale values derived from systematic application of utility functions that embody policyconsiderations determined by Navy decision-makers. Therefore, the CLASP optimal-sequential procedure, which depends on these functions, was clearly superior to the PRIDElirst-come, first-served procedure. PRIDE was less effective because policy mattershandled at the local di.strict level receive support from a restricted data base and becauselocal decisions may not consider broader national concerns. For example, a particularclassifier, familiar with a small subset of ratings, may influence most recruit applicantsto select from that subset. CLASP makes it possible to measure the effectiveness ofcertain assignment policies and the consequences of various tradeoff decisions.
A general CLASP rule-of-thumb is to assign a recruit applicant to the highesL ratingon the ordered list because a higher ranked job results in greater payoff to the Navy. Inview of the fact that payoff is also dependent on the candidate's preferences and abilities,the choice of a highly ranked position is also in his best interest. Other personal andsystem benefits, such as improved job satisfaction, morale, and reenlistment rates, arealso expected but could not be supported by data collected in this research.
It is anticipated that the operation of the CLASP optimal-sequential asr•ignmentprocedure and the monitoring capability it affords will result in a substantially reducednumber of ghost reservations. The effective operation of the PRIDE system was impairedby operators securing highly desirable school seats for nonexistent recruits (making ghostreservations) in the hope that, when suitable candidates were found, substitute reserva-tions could be made and enlistment contracts could be expeditiously signed. Although thispractice of system manipulation benefited a few recruiters, it harmed the system bywithholding potential sales and by producing unreliable accession statistics. Except forthe fraction and minority fill-rate functions, the utility calculations in CLASP are largelyindependent of time and therefore yield similar Ol values regardless of an applicant's timeof entry into the system. Thus, the CLASP procedure will make ghost reservations a lesslucrative, more risky proposition.
This study was not designed to collect data to answer questions about attrition.However, the results indicated that improved matching between persons and jobs, asaccomplished by CLASP, may be a significant factor in the ultimate reduction of attritionand attrition cost.
30
............................. ,. - . ,r~ -. ,'
RECOMMENDAllONS
It is recommended that the Naval Military Personnel COl1mmand (NMPC-48):
1. Monitor CLASP to assess the performance of both the assignment system and the"recruiters and classifiers who use it. Multivariate approaches that incorperate morebehavioral aspects of the career decision process would be examined by NAVPERSRAND-CEN.
2. Continue its ongoing efforts to use CLASP as a vehicle for assessing the qualityof Navy person-job matches.
3. Evaluate the requirement for extending the model to encompass morecomponents and to assign additional groups. An attrition component presently underdevelopment would be evaluated for inclusion. The model would be extended to includewomen, a change that will require development of new criteria and school successprediction equations.
It is recommended that NAVPERSRANDCEN (1) moniti)r the model's operatingcharacteristics under a variety of conditions, and (2) conduct a sensitivity study toascertain the degree of stability of solutions generated under the optimal-sequentialprocedure.
31
Nt
"Sp
'.;
31 •

.--- • 7,.-' - ---
REFERENCES
Brogden, H. E. An approch to the problems of difierential prediction. Psychometrika,1946, 11, 139-154.
Dow, A. N., Wolfe, 3J. H., Moonan, W. J., Swanson, L., & Taylor, C. W. Feasibility study ofthe use of automation with enlisted classification procedures (NPRA Memo. Rep. 64-29). San Diego: Naval Personnel Research Activity, December 1964.
Dwyer, P. S. Solution of the personnel classification problem with the method of optimalregions. Psychometrika, 1954, 1t9, 11-25.
Fletcher, 3., & Ree, M. 3. Armed Services Vocational Aptitude Battery correlationalanalysis, ASVAB form 2 versus form 5 (AFHRL Tech. Rep. 76-70). Brooks Air ForceBase, TX: Human Resources Laboratory, October 1976.
Ford, L. R., & Fulkerson, D. S. Flows in networks. Princeton, NJ: Princeton UniversityPress, 1962.
latch, R. S. Development of optimal allocation algorithms for personnel assignment. InSmith, A. R. (Ed.). Models of manpower systems. New York: American ElsevierPublishing, 1971.
Hatch, R. S. Bench marks comparing transportation codes based on principle simplex andprimal-dual algorithms. Operations Research, 1975, 6, 1167-1172.
Hatch, R. S., Pierce, M. B., & Fisher, A. H. Development of a computer-assisted recruit"assignment system (COMPASS II). Rockville, MD: Decision Systems Associates, 1968.
-:L.
Horst, P. A technique for the development of a differential prediction battery.Psychological Monographs, 1954, 68 (No. 9, Whole No. 380).
Horst, P., & Sorenson, R. C. Matrix transformation for optimal personnel assignments(NPRDC Tech. Note 77-5). San Diego: Navy Personnel Research and DevelopmentCenter, Decemnber 1976.
"Kroeker, L. A procedure to revise estimates of psychological scale values. In B. Rimland(Ed.). Independent research and independent exporatory development at the NayPersonnel Research and Development Center--FYSI (NPRDC Spec. Rep. 82-27). SanDiego: Navy Personnel Researach and Development Center, June 1982.
Marquardt, L. D., & McCormick, E. 3. Component analyses of the attribute data based onthe position analysis questionnaire (Tech. Rep. 73-2). West Lafayette, IN: Occupa-tional Research Center, Purdue University, September 1973.
McWilliams, G. 3. A method for the approximate solution of transportation problems.Austin, TX: Unpublished master's thesis, University of Texas, 1970.
Middleton, M. G., Rankin, W. C., Green, E. K., & Papetti, C. 3. Academic attrition fromNavy technical training class "A" school courses (TAEG Rep. No. 47). Orlando, FL:Training Analysis and Evaluation Group, July 1977.
33 [PREVIOUS PAGE|IS BLANK
V-, . . ...,fi,•,

S.. .. - ... -- . h r -- €-- . ' - r. • • , • - 9 ,.; . l ._• • .•.-. -...-- ••.---.- -l -'-•d•-l.•. •' .- " •-•.•...... .. •- w ''...... .. , . "...... ...-... ... . "",...
Rafacz, B. A., & Halstead, D. The sequential assignment problem: Phase I. Thedevelopment of a computer simulation program to evaluate a sequential assignmentstrategy (NPRDC Tech. Note 77-13). San Diego: Navy Personnel Research andDevelopment Center, May 1977.
Shirkey, E. C. The development of a technical aptitude item pool for use in tailoredtesting (Unpublished manuscript). San Diego: Navy Personnel Research and Develop- "
nent Center, December 1977.
Swanson, L., & Dow, A. N. Project COMPASS: A computer assisted classification systemfor Navy enlisted men (NPRA SRR 66-6). San Diego: Naval Personnel ResearchActivity, October 1965.
Votaw, D. F. Methods of solving some personnel classification problems. PsEyc-.owetrika, J1952, 17, 255-266.
Ward, I H. Use of a decision index in assigning Air Force personnel (WADC Tech. Note59-38). Lackland Air Force Base, TX: Personnel Laboratory, April 1959.
Ward, I H. Creating mathematical models of judgment processes: From policy-capturingto policy-spcifying (AFHRL Tech. Rep. 77-47). Brooks Air Force Base, TX: Air ForceHuman Resources Laboratory, August 1977.
Ward, 3. H., Haney, D. L., Hendrix, W. H., & Pina, M. Assignment procedures in the AirForce procurement management information system (AFHRL Tech. Rep. 7'-30).Brooks Air Force Base, TX: Air Force Human Resources Laboratory, July 1978.
.34
I",
I ~34 •
i?$-.-:--.•. "-•.•.•.-?..'• .•. ¢.''• -.•N< :•..<7,-,,,Z<••' •:•: • /:,•. ,. :" • -- •,• • " " - ... . . .... ...

-. %
APPENDIX A
TITLES AND ABBREVIATIONS FOR 86 NAVY RATINGS
A-O
%~ ~~~~~ *.- I , . - -
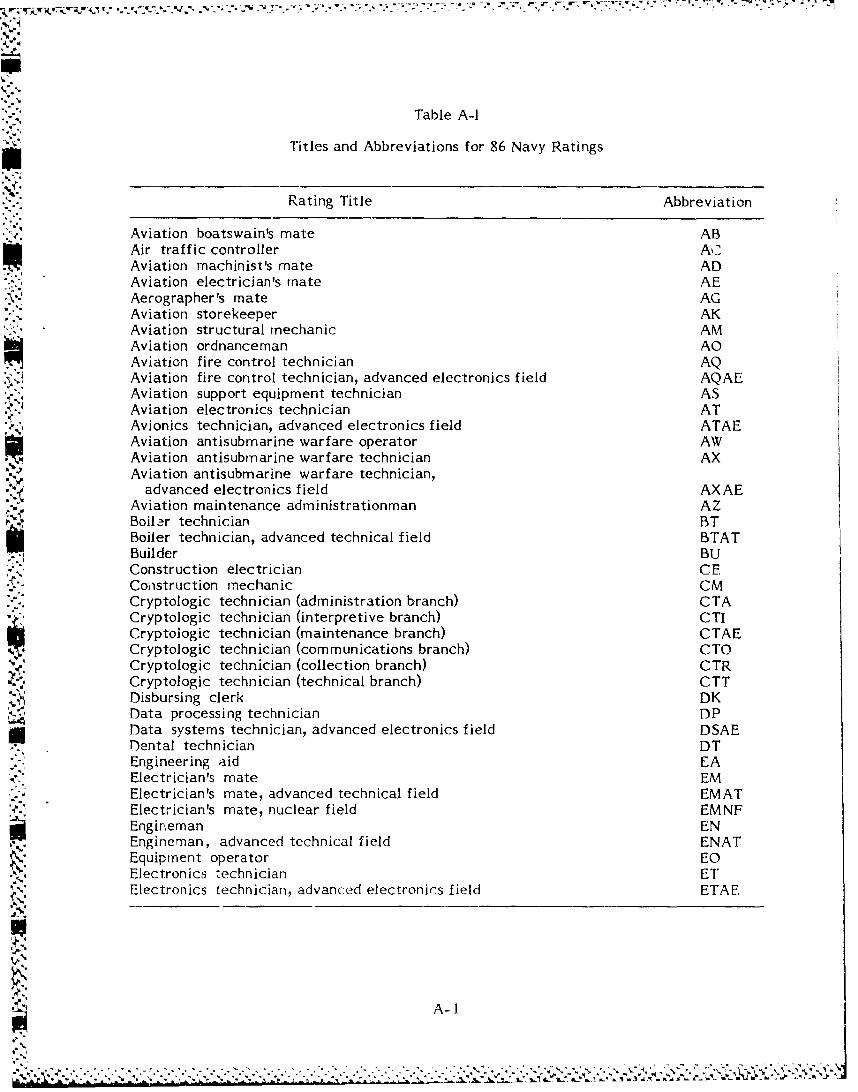
-~- . - - --. , , . , -
Table A-I
Titles and Abbreviations for 86 Navy Ratings
Rating Title Abbreviation
Aviation boatswain's mate ABAir traffic controller ACAviation machinist's mate ADAviation electrician's mate AEAerographer's mate AGAviation storekeeper AKAviation structural mechanic AMAviation ordnanceman AOAviation fire control technician AQAviation fire control technician, advanced electronics field AQAEAviation support equipment technician ASAviation electronics technician ATAvionics technician, advanced electronics field ATAEAviation antisubmarine warfare operator AWAviation antisubmarine warfare technician AXAviation antisubmarine warfare technician,
advanced electronics field AXAEAviation maintenance administrationman AZBoiler technician BTBoiler technician, advanced technical field BTATBuilder BUConstruction electrician CEConstruction mechanic CMCryptologic technician (administration branch) CTACryptologic technician (interpretive branch) CTICryptologic technician (maintenance branch) CTAECryptologic technician (communications branch) CTOCryptologic technician (collection branch) CTRCryptologic technician (technical branch) CTTDisbursing clerk DKData processing technician DPData systems technician, advanced electronics field DSAE_Dental technician DTEngineering aid EAElectrician's mate EMElectrician's mate, advanced technical field EMATElectrician's mate, nuclear field EMNFEngineman ENEngineman, advanced technical field ENATEquipment operator EOElectronics technician ETElectronics technician, advanced electronics field ETAE
A-. I

'I I
Table A-I (Continued)
Rating Title Abbreviation
Electronics technician, nuclear field ETNFElectronics warfare technician EWElectronics warfare technician, advanced electronics field EWAEFire control technician FTFire control technician, advanced electronics field FTAEGunner's mate GMGunner's mate (technician) GMTHospital corpsman HMHospital corpsman, advanced technical field HMATHull maintenance technician HTHull maintenance technician, advanced technical field HTAT
Interior communications electrician ICInterior communications electrician, advanced technical field ICATInterior communications electrician, nuclear field ICNFlnstrumentman IMIntelligence specialist ISJournalist 30Molder MLMachinist's mate MMMachinist's mate, nuclear field MMNFMineman MNMachinery repairman MRMess management specialist MSOpticalm an OMOperations specialist OSOcean systems technician OTPostal clerk PCPOLARIS electronics technician, advanced electronics field PEAEPhotographer's mate PHPattern maker (includes MLCM) PMPersonnelman PNAircrew survival equipmentman PRQuartermaster QMRadioman RMRadioman, advanced technical field RMATShip's serviceman SHStorekeeper SKSignalman SMSonar technician STSonar technician, advanced electronics field STAESteelworker SWTradevman TDTorpedoman's mate TMUtilitiesman UTYeoman YN
A-2

APPENDIX B
DECISION INDEX (01) MEANS FOR JULY 1977 DATA SET
-i
ON"
-B-0
S•-0

Table B-I
"Decision Index (DI) Means For July 1977 Data Set"(N = 3,516)
Rating DI Mean Rating DI Mean
AB 5243. EWAE 4"67.AC 4969. FT 4581.AD 5233. FTAE 4604.AE 4647. GM 5243.AG 4727. GMT 4946.AK 4942. HM 5171.AM 5213. HMAT 4660.AO 5001. HT 5148.AQ 5166. HTAT 4777.AQAE 5117. IC 5191.AS 4904. ICAT 4803.AT 4337. ICNF 4985.ATAE 4364. IM 4679.
AW 4458. IS 4629.AX 4545. 30 4217.AXAE 4521. ML 4847.
AZ 4603. MM 5368.BT 5280. MMANF 4878.BTAT 4958. MN 4827.BU 4934. MR 4940.CE 5048. MS 5167.CM 5013. OmM 4379.CTA 4729. OS 5271.CTI 4909. OT 4750.CTAE 4952. PC 5231.CTO 4901. PEAE 4658.CTR 5098. PH 4985.CTT 5069. PM 4904.DK 5107. PN 5000.DP 4960. PR 5287.DSAE 4429. OM 4998.DT 4994. RM 5238.EA 4484. RMAT 5254.EM 5119. SH 5089.EMAT 4664. SK 5130.EMNF 4759. SM 5140.EN 5062. ST 4837.ENAT 4662. STAE 4821.EO 5063. Sw 5033.ET 4755. TD 4590.ETAE 4776. TM 5004.ETNF 4860. UT 4961.EW 4814. YN 4939.
B-II,,E"
* * * * . - "

DISTRIBUTION LIST
Assistant Secretary of Defense (Manpower, Reserve Affairs & Logistics)Executive Secretary, Defense Advisory Committee on Women in the Services (DACO-
WITS) (35)Deputy Under Secretary of Defense for Research and Engineering (Research and
Advanced Technology)Military Assistant for Training and Personnel Technology (ODUSD(R&AT))Assistant Secretary of the Navy (Manpower & Reserve Affairs) (OASN(M&RA))Deputy Assistant Secretary of the Navy (Manpower) (OASN(M&RA)) (TRs)Chief of Naval Operations (OP-01), (OP-11), (OP-115) (2), (OP-12), (OP-13), (OP-135C4)
(OP-14), (OP-1iOF2), (OP-15), (OP-987H)Chief of Naval Material (NMAT 05), (NMAT 0722) 4dChief of Naval Research (Code 200), (Code 440) (3), (Code 442), (Code 442Pr)
*.• Chief of Naval Education and Training (N-21)0Chief of Naval Technical Training (016)Commandant of the Marine Corps (MPI-20)
"*" Commander in Chief, United States Naval Forces, Europe (2), Commander Fleet Training Group, Pearl Harbor
Commander Naval Military Personnel Command (NMPC-013C)Commander Navy Recruiting Command (3)Commander Training Command, U.S. Atlantic FleetSCommander Training Command, U.S. Pacific FleetCommanding Officer, Naval Aerospace Medical Institute (Library Code 12) (2)Commanding Officer, Naval Technical Training Center, Corry Station (Code 101B)Commanding Officer, Naval Training Equipment Center (Technical Library) (5), (Code N-
Director, Office of Naval Research Branch Office, Chicago (Coordinator for
Psychological Sciences)r•" President. Naval War College 4
...rin dent, Naval Postgraduate SchoolCom,,ai.ider, Army Research Institute for the Behavioral and Social Sciences, Alexandria,
(PERI-ASL), (PERI-ZT), (PERI-SZ)Commander, Air Force Human Resources Laboratory, Brooks Air Force Base (Manpower
and Personnel Division), (Scientific and Technical Information Office)Commander, Air Force Human Resources Laboratory, Williams Air Force Base
(AFHRL/OT)Commander, Air Force Human Resources Laboratory, Wright-Patterson Air Force Base
(AFHRL/LR)Commanr"'nco C" , U.S. Coast Guard Research and Development Center, Avery Point ,Commandant Coast Guard Headquarters
Pre. >, Naf ,.. Defense University (3)Institute for Defense Analyses, Science and Technology DivisionDefense Technical Information Center (DDA) (12)
!_-S.
.0.