Embed Size (px)
Citation preview
LINKS Marketing
Tactics Simulation
Revised January 2019
\
Randall G. Chapman, PhD

2 LINKS Marketing Tactics Simulation
Copyright (c) 2010-2019 by Randall G Chapman LINKS® is a registered trademark of Randall G Chapman. All rights reserved.
LINKS Marketing Tactics Simulation 3
Table of Contents
Introduction .................................................................................................................... 5 Why Use Simulations? ........................................................................................................ 5 What Will You Learn? .......................................................................................................... 6 LINKS Overview ................................................................................................................... 6 Excel Spreadsheet Access To This Manual’s Exhibits....................................................... 8
Product Configurations and Product Costs .................................................................. 9
Supply Management and Service ................................................................................ 10 Manufacturing .................................................................................................................... 10 Distribution and Transportation ........................................................................................ 10 Service ............................................................................................................................... 10
Generate Demand Decisions ....................................................................................... 11 Price Decisions .................................................................................................................. 11 Marketing Spending Decisions ......................................................................................... 12 Marketing Program Details ................................................................................................ 14
Marketing Mix Allocation ............................................................................................. 14 Marketing Positioning .................................................................................................. 14 Promotional Program .................................................................................................. 16
Introduction/Drop Decisions ............................................................................................. 18 Sales Volume Forecasting Decisions ............................................................................... 19
Financial and Operating Reports ................................................................................. 21 Performance Evaluation Report ........................................................................................ 21 P&L Statements ................................................................................................................. 21 Forecasting Accuracy Report ............................................................................................ 25 Set-Top Box Industry Bulletin ........................................................................................... 26 Sample Reports ................................................................................................................. 26
Research Studies ......................................................................................................... 34 Research Studies Strategy ................................................................................................ 34 Pre-Existing Research Study Resources .......................................................................... 35
Availability Perception Drivers .................................................................................... 35 Self-Reported End-User Consumer Preferences ........................................................ 36
Research Study #1: Benchmarking - Earnings ................................................................ 37 Research Study #14: Regional Summary Analysis ......................................................... 37 Research Study #24: Price Sensitivity Analysis .............................................................. 38 Research Study #27: Marketing Program Benchmarking ............................................... 40 Research Study #28: Marketing Program Experiment .................................................... 40 Research Study #38: Retention Statistics ....................................................................... 42 Research Studies Table of Contents ................................................................................ 42
Decision Forms ............................................................................................................ 43

4 LINKS Marketing Tactics Simulation
Performance Evaluation ............................................................................................... 46
Appendix: Web-Based LINKS Access ........................................................................ 48
LINKS Marketing Tactics Simulation 5
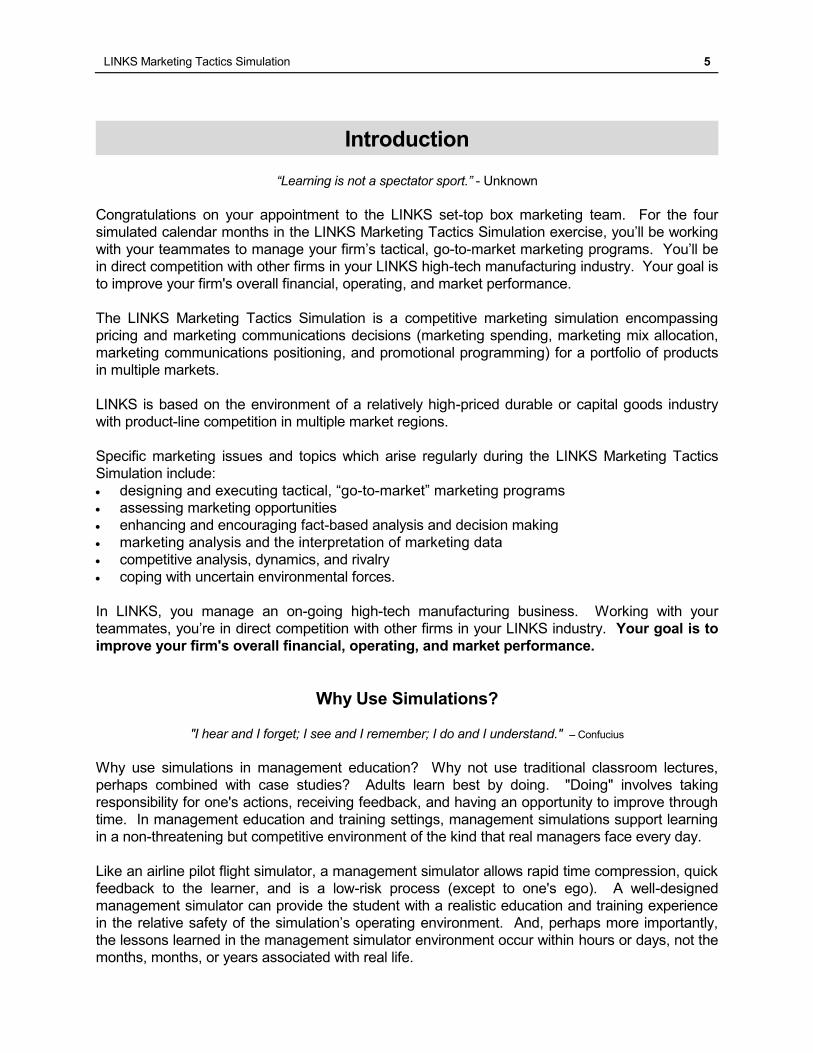
Introduction
“Learning is not a spectator sport.” - Unknown
Congratulations on your appointment to the LINKS set-top box marketing team. For the four
simulated calendar months in the LINKS Marketing Tactics Simulation exercise, you’ll be working
with your teammates to manage your firm’s tactical, go-to-market marketing programs. You’ll be
in direct competition with other firms in your LINKS high-tech manufacturing industry. Your goal is
to improve your firm's overall financial, operating, and market performance.
The LINKS Marketing Tactics Simulation is a competitive marketing simulation encompassing
pricing and marketing communications decisions (marketing spending, marketing mix allocation,
marketing communications positioning, and promotional programming) for a portfolio of products
in multiple markets.
LINKS is based on the environment of a relatively high-priced durable or capital goods industry
with product-line competition in multiple market regions.
Specific marketing issues and topics which arise regularly during the LINKS Marketing Tactics
Simulation include:
designing and executing tactical, “go-to-market” marketing programs
assessing marketing opportunities
enhancing and encouraging fact-based analysis and decision making
marketing analysis and the interpretation of marketing data
competitive analysis, dynamics, and rivalry
coping with uncertain environmental forces.
In LINKS, you manage an on-going high-tech manufacturing business. Working with your
teammates, you’re in direct competition with other firms in your LINKS industry. Your goal is to
improve your firm's overall financial, operating, and market performance.
Why Use Simulations?
"I hear and I forget; I see and I remember; I do and I understand." – Confucius
Why use simulations in management education? Why not use traditional classroom lectures,
perhaps combined with case studies? Adults learn best by doing. "Doing" involves taking
responsibility for one's actions, receiving feedback, and having an opportunity to improve through
time. In management education and training settings, management simulations support learning
in a non-threatening but competitive environment of the kind that real managers face every day.
Like an airline pilot flight simulator, a management simulator allows rapid time compression, quick
feedback to the learner, and is a low-risk process (except to one's ego). A well-designed
management simulator can provide the student with a realistic education and training experience
in the relative safety of the simulation’s operating environment. And, perhaps more importantly,
the lessons learned in the management simulator environment occur within hours or days, not the
months, months, or years associated with real life.

6 LINKS Marketing Tactics Simulation
Here are the classic reasons to favor management simulations in adult-learning environments.
Compared to traditional lecture/case/discussion educational events, simulations:
Reflect active not passive participation, enhancing learning motivation.
Apply key management concepts, especially coordination and planning.
Demand analysis and decisions in the context of market-based feedback in the presence of
thoughtful, vigilant competitors.
Provide rapid feedback, encouraging participants to learn from their successes and failures
within a relatively low-risk competitive environment.
Provide learning variety through novel learning environments.
What Will You Learn?
"The ability to learn faster than competitors may be the only
true sustainable competitive advantage." – Arie P. De Geus
Learning objectives in the LINKS Marketing Tactics Simulation include the following:
Gaining exposure to marketing tactics (“go-to-market”) elements
Appreciating the need for balance and managing trade-offs in designing and executing
effective and efficient marketing programs
Experiencing competitive dynamics in an evolving marketplace
Appreciating information flows and integration of information with decision making
Enhancing and encouraging fact-based analysis and decision making
Gaining familiarity with financial statements used routinely in for-profit businesses.
Since the management simulation learning environment is built around teams, small group
functioning and decision making skills are emphasized in the background throughout this
simulation exercise. Since most workplaces include healthy doses of project teams, the
management simulation learning environment provides hands-on experience in identifying key
principles and practices associated with high-performing teams.
LINKS Overview
LINKS firms manufacture and distribute products, as well as provide post-sale end-user consumer
service via regional service centers. Each decision period in LINKS is one calendar month.
There is no known time-of-year seasonality in LINKS markets.
You assume control of your LINKS firm at the end of month 3. Thus, your first decisions will be
for month 4. Although your firm has been operating for a number of years, detailed information is
only available about the recent past. All firms in your industry started month 1 identically. This is
consistent with an industry that has evolved over time with all competitors now emulating each
other exactly. Decisions in months 1-3 were constant throughout these three months. Due to the
normal random forces in the various markets in which your firm operates, the financial and market
positions of the firms in your industry will vary somewhat at the end of month 3.
The LINKS "product" is a set-top box, a high-tech electronics product purchased by individual
consumers for home use and by businesses for office and operations uses. According to Michael
B. Quinion (http://www.quinion.demon.co.uk/words/turnsofphrase/tp-set1.htm): "This term
describes a specialised computer which translates incoming digital signals into a form suitable for
LINKS Marketing Tactics Simulation 7
viewing on a standard television set. The source of the signals could be a digital satellite or
terrestrial broadcast, a cable television channel or a video-on-demand programme sent down a
telephone line. Other projected uses for the set-top box include control of interactive viewing, for
example with a home-shopping channel or WebTV. It may also decrypt signals on subscription or
pay-per-view channels." LINKS set-top boxes are "fourth generation" versions. Fourth-
generation set-top boxes include telephony applications (such as internet-based long-distance
calling, interactive video conferencing, and interactive TV), local-area wireless networking,
control/monitoring of a wide range of within-area electrical appliances and devices, and digital
media server, basic virtual reality, and teleportation enhancement capabilities.
As LINKS begins, you and your teammates take over an on-going firm in the set-top box industry.
Your goal is to improve the financial, operating, and market performance of this firm during the
LINKS exercise.
Your firm has two products, referenced as "f-p" (for firm "f" and product "p"). For example,
product 4-1 refers to product 1 of firm 4. Each LINKS firm in your set-top box industry has two
hyperware products: a low-end product 1 and a mid-range product 2.
Your firm has a manufacturing plant and distribution center in market region 1. Your
manufacturing plant in market region 1 produces finished set-top boxes that are shipped
via your distribution center in market region 1 to all market regions served by your firm.
There are three regional markets in your set-top box industry. One sales channel (retail) exists to
reach end-user consumers in these three regional markets. When you receive your initial
financial reports, you’ll see the market region descriptors for the market regions in your particular
LINKS set-top box industry.
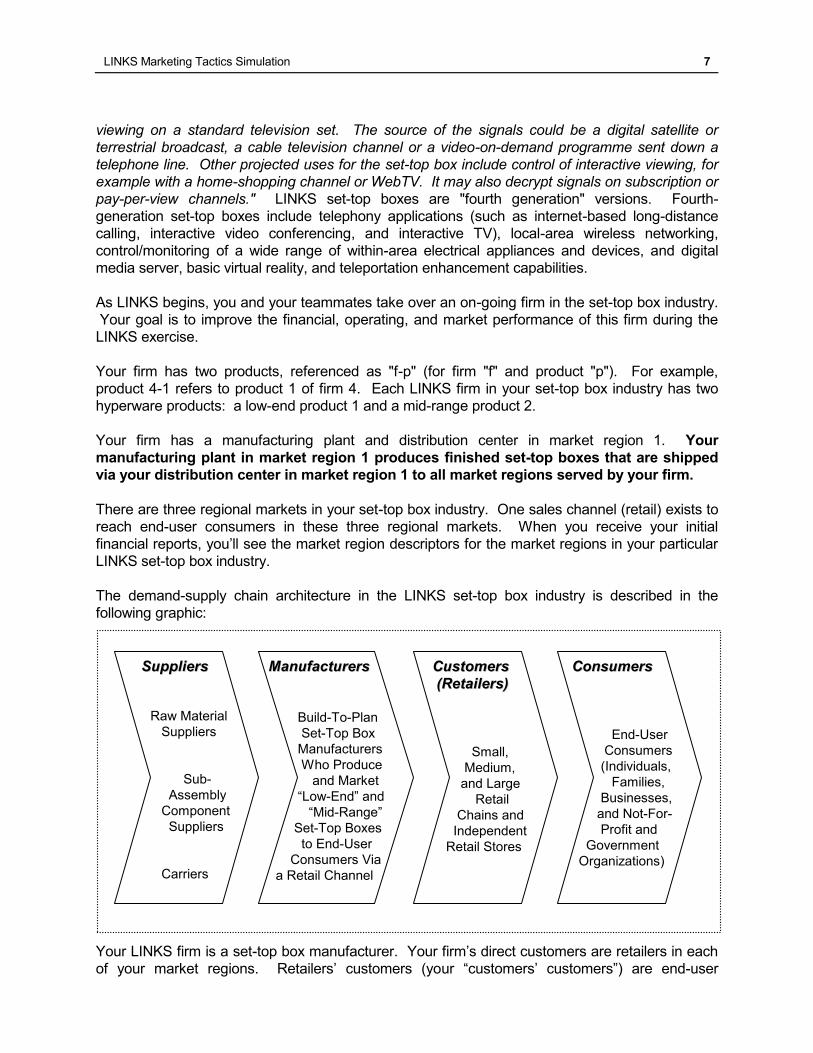
The demand-supply chain architecture in the LINKS set-top box industry is described in the
following graphic:
Your LINKS firm is a set-top box manufacturer. Your firm’s direct customers are retailers in each
of your market regions. Retailers’ customers (your “customers’ customers”) are end-user
MMaannuuffaaccttuurreerrss
Build-To-Plan
Set-Top Box
Manufacturers
Who Produce
and Market
“Low-End” and
“Mid-Range”
Set-Top Boxes
to End-User
Consumers Via
a Retail Channel
CCoonnssuummeerrss
End-User
Consumers
(Individuals,
Families,
Businesses,
and Not-For-
Profit and
Government
Organizations)
CCuussttoommeerrss
((RReettaaiilleerrss))
Small,
Medium,
and Large
Retail
Chains and
Independent
Retail Stores
SSuupppplliieerrss
Raw Material
Suppliers
Sub-
Assembly
Component
Suppliers
Carriers
8 LINKS Marketing Tactics Simulation
consumers.
The LINKS currency unit is the LCU, the "LINKS Currency Unit." The LCU is
abbreviated "$" and pronounced Ldollar ("el-dollar"). The "LINKS Currency
Unit" (LCU) is a Euro-like multi-country currency.
In your travels, you might have encountered the "$" symbol associated
with currencies in Australia, the Bahamas, Barbados, Belize, Bermuda, Brunei Darussalam,
Canada, Cayman Islands, Fiji, Guyana, Hong Kong, Jamaica, Liberia, Namibia, New Zealand,
Singapore, Solomon Islands, Suriname, Taiwan, Trinidad/Tobago, the United States, and
Zimbabwe. That's merely a coincidence. The "$" currency symbol is widely known to have
originated with the Ldollar.
Excel Spreadsheet Access To This Manual’s Exhibits
This LINKS Marketing Tactics Simulation participant’s manual includes a number of tabular
exhibits. To facilitate convenient access to these exhibits for on-going referencing during your
LINKS exercise, these exhibits have been included in an Excel spreadsheet. To access/download
this Excel spreadsheet, point your favorite browser to this case-sensitive URL:
http://www.LINKS-simulations.com/MT/ExhibitsMT.xls
LINKS Marketing Tactics Simulation 9
Product Configurations and Product Costs
Your firm’s hyperware set-top box products are defined by a seven-character configuration code
with the following elements and interpretations:
(1) Product category: "H" for hyperware.
(2) Raw material Alpha: 0-9 (number of kilograms).
(3) Raw material Beta: 0-9 (number of kilograms).
(4) Bandwidth: 1-6 (terahertz). Bandwidth is a "more-is-better" product attribute. End-user
consumers will always prefer more bandwidth (i.e., higher terahertz), but they might or might
not prefer it enough to offset the additional bandwidth costs.
(5) Warranty: corporate policy is to offer a 0-month warranty (i.e., no warranty).
(6) Packaging: "1" (standard), "2" (premium), or "3" (environmentally sensitive premium). More
expensive premium packaging presumably has positive generate demand implications.
(7) Memory Capacity: 0, 1, 2, or 3 memory disks. Memory capacity is pre-engineered capacity
for optional additional memory chips/disks. Optional memory chips/disks are purchased,
installed, and configured by the end-user consumer after (sometimes many months after) the
original purchase of the set-top box product.
For example, H551010 is a hyperware set-top box product with 5 kilograms of raw material Alpha,
5 kilograms of raw material Beta, bandwidth of 1 terahertz, warranty of 0 months, standard
packaging, and 0 memory disks.
In addition to these configuration elements, hyperware set-top boxes require one Gamma and one
Epsilon sub-assembly component with costs of $17.00 and $24.00, respectively.
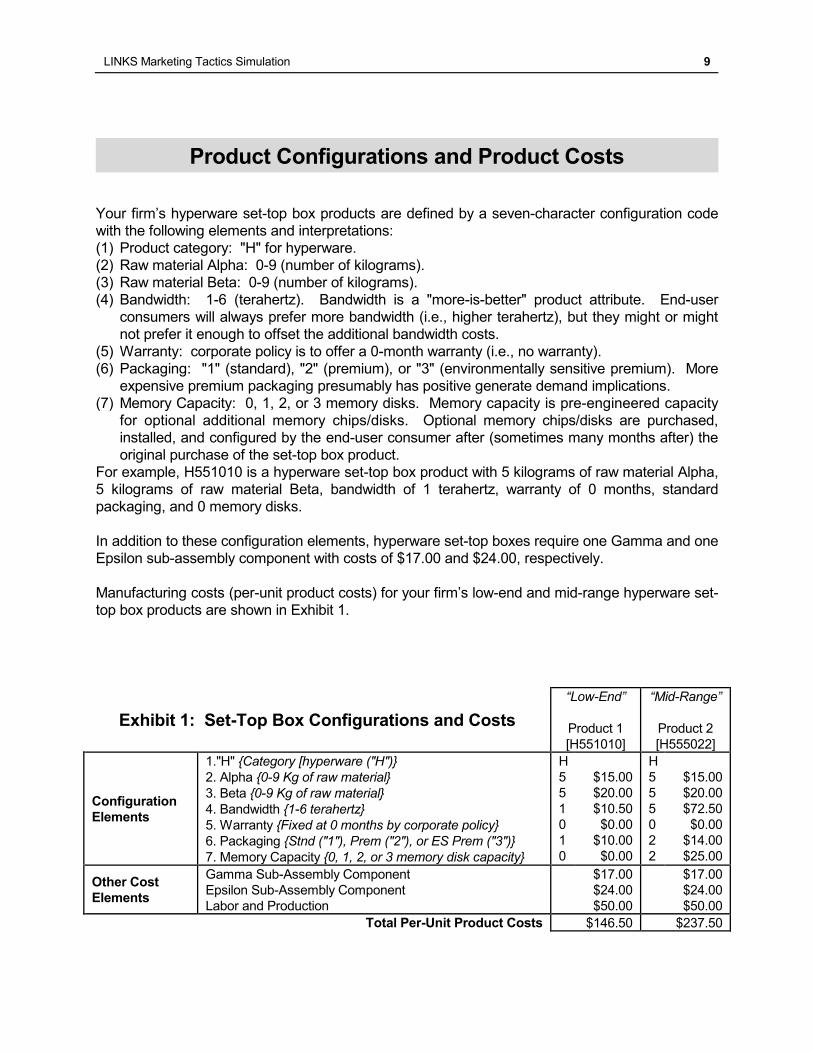
Manufacturing costs (per-unit product costs) for your firm’s low-end and mid-range hyperware set-
top box products are shown in Exhibit 1.
Exhibit 1: Set-Top Box Configurations and Costs
“Low-End”
Product 1
[H551010]
“Mid-Range”
Product 2
[H555022]
Configuration
Elements
1."H" {Category [hyperware ("H")}
2. Alpha {0-9 Kg of raw material}
3. Beta {0-9 Kg of raw material}
4. Bandwidth {1-6 terahertz}
5. Warranty {Fixed at 0 months by corporate policy}
6. Packaging {Stnd ("1"), Prem ("2"), or ES Prem ("3")}
7. Memory Capacity {0, 1, 2, or 3 memory disk capacity}
H
5
5
1
0
1
0
$15.00
$20.00
$10.50
$0.00
$10.00
$0.00
H
5
5
5
0
2
2
$15.00
$20.00
$72.50
$0.00
$14.00
$25.00
Other Cost
Elements
Gamma Sub-Assembly Component
Epsilon Sub-Assembly Component
Labor and Production
$17.00
$24.00
$50.00
$17.00
$24.00
$50.00
Total Per-Unit Product Costs $146.50 $237.50
10 LINKS Marketing Tactics Simulation
Supply Management and Service
Manufacturing
No explicit manufacturing decisions are required in the LINKS Marketing Tactics Simulation.
Automatic just-in-time procurement and manufacturing ensures that all customer demand from
retailers is fully met without ever holding procurements or finished goods inventory.
Manufacturing costs include:
Fixed costs per production order of $67,500 (i.e., whenever a product’s production volume in a
month is greater than zero units, your firm incurs a fixed cost of $67,500).
Variable costs of $30/unit for labor and $20/unit for production.
Depreciation and maintenance of your set-top box plant capacity costs $300,000/month for
each production "shift.” This cost is recorded as "Plant Capacity FC" (plant capacity fixed
costs) on your "Corporate Current P&L Statement." These costs are allocated equally among
your products. A production "shift" can accommodate up to 50,000 production units. If total
production across all products is less than 50,000 units per month, then only one production
shift is needed that month, and the associated costs are $300,000. If total production across
all products is 50,001 to 100,000 units, then two production "shifts" are needed in that month,
with associated costs of $600,000. The LINKS software automatically schedules the
appropriate number of production "shifts" based on total production. There must always be at
least one production "shift" capability at all times, even if total production is zero units.
Distribution and Transportation
Your firm owns a distribution center in market region 1, adjacent to your manufacturing plant.
Finished goods orders from retail customers in all regions are sourced from this distribution
center, with these associated transportation costs:
In market region 1, the within-region transportation costs to ship products from your region-1
distribution center to region-1 retail customers are $4 per unit.
For market regions 2 and 3, the cross-region transportation costs to ship products to retail
customers from your region-1 distribution center are $18/unit and $26/unit, respectively.
Service
Rather than actively managing service centers, your firm outsources service to reputable
call-center service providers in each region. Your firm’s policy is to use “Standard” service
outsourcing which guarantees a 20% service quality level. The per-call costs associated with
“Standard” service outsourcing are $10, $12, and $13 in regions 1, 2, and 3, respectively.
These "SQ Guarantees" are long-run averages. Service outsourcers guarantee that perceived
service quality won't vary by more than 3% from these averages in any month. Costs for
call-center service outsourcing are reported as "Service Outsourcing" on your financial reports.
LINKS Marketing Tactics Simulation 11
Generate Demand Decisions
Your LINKS firm is responsible for generate demand decisions for your set-top boxes: pricing,
marketing spending, marketing program details, and sales volume forecasting. This chapter
provides the relevant details for all of these generate demand decisions.
There is one sales channel within each LINKS market region. The retail channel serves
individual consumers who purchase set-top boxes for home use and businesses with set-top
box needs. Retailers stock set-top boxes, along with an array of other similar and
complementary electronic products. Retailers provide point-of-purchase support for in-person
shoppers. In all regions, the retail-channel order processing costs are $4/unit.
Price Decisions
You set prices for each actively-distributed product in each market region. Your manufacturer
price is the price into the retail channel. It’s the bulk-rate price for all units purchased for
resale by retail customers. The custom in the set-top box industry is to quote a single price
regardless of order volume. You do not control final selling prices in the retail channel. Across
your market regions, retailers markup your manufacturer prices by 45%-55% to arrive at their
final end-user consumer prices.
Prices affect end-user consumer demand in the usual fashion within the set-top box industry.
Higher prices are normally associated with lower levels of demand in all markets. The specific
price sensitivities in the markets that you face in LINKS are unknown. You will need to learn
about the markets' responsiveness to price through your experience in LINKS and by exploiting
available LINKS research studies.
It's very easy to drop price to attempt to increase demand. However, it's always an interesting
question whether that increased demand actually increases profits. Remember, the price drop
that generates increased demand also reduces your margin on each unit sold. More importantly,
it's easy for competitors to see and feel threatened by a price change.
In addition to the physical costs of producing and distributing updated price sheets, lists, and
databases that accrue when a manufacturer changes price (so-called “menu costs”), a range of
indirect and non-obvious costs arise with price adjustments.1
1 Recent published research documents the range of direct and indirect costs associated with price
adjustments for a large U.S. industrial manufacturer (more than one billion USD$ revenues selling 8,000
products [used to maintain machinery] through OEMs and distributors). The authors found that
managerial costs are more than 6 times, and customer-facing costs are more than 20 times, the so-called
“menu costs” (physical costs) associated with price adjustments. In total, price adjustment costs comprise
1.22% of the company’s revenue and 20.03% of the company’s net margin. {Source: Mark J. Zbaracki,
Mark Ritson, Daniel Levy, Shantanu Dutta, and Mark Bergen, “Managerial and Customer Costs of Price
Adjustment: Direct Evidence From Industrial Markets,” The Review of Economics and Statistics,
Volume 86, Number 2 (May 2004), pp. 514-533.}
12 LINKS Marketing Tactics Simulation
Managerial Costs: A manufacturer must
gather information, analyze, assess, and
ultimately communicate the logic
associated with price changes throughout
their firm. Managerial costs presumably
increase with larger price changes, since
there is more to assess/analyze and
more organizational members become
involved with larger price changes.
Customer-Facing Costs: When
implementing price changes, a
communications program must be
created and executed to portray a price
change in the most favorable light to
customers. Price adjustments potentially
involve (re)negotiation with those retail
customers who are resistant to new
(higher) prices.
In LINKS, each price change by your manufacturing firm for a product in a market region results
in $10,000 in costs plus $200 in costs per-dollar change in price (increase or decrease in price)
plus costs of 0.25% of current-month revenues.2 For example, a $75 change in price on a
product with revenues of $4,500,000 in a particular region incurs price change costs of $10,000
+ ($200)(75) + (0.0025)($4,500,000) = $10,000 + $15,000 + $11,250 = $36,250. These price
change costs are recorded as “Price Changes” in the “Fixed and Other Costs” section of your
firm’s profit-and-loss statements in the month in which the price change occurs.
Price wars are often initiated by thoughtless price manipulations by naive managers who assume
that competitors won't notice, won't respond, or respond ineptly. To provide a fact-based
approach for making pricing decisions, please refer to the "Pricing Worksheet" on the following
page. Complete this "Pricing Worksheet" anytime you're planning to reduce prices. Review the
worksheet details with your teammates. After this review, go ahead with the price decrease if you
really think that it's appropriate. Review this "Pricing Worksheet" again after you receive next
month's financial results to verify whether your assumptions and predictions were reasonable.
Marketing Spending Decisions
"Advertising is what you do when you can't go see somebody." – Fairfax Cone
A marketing spending budget is required for each set-top box product in each market region. This
budget is managed by your firm’s regional managers and is used for advertising, promotion, and
sales force efforts associated with your products. You are free to allocate funds to marketing
spending as you see fit. Spending does not have to be equal for all products in all regions.
2 Price change costs only accrue for products that are already actively being sold in a region. No price
change costs accrue for price changes for a product as it is being introduced into a region (i.e., it was
inactive in that region in the last month).
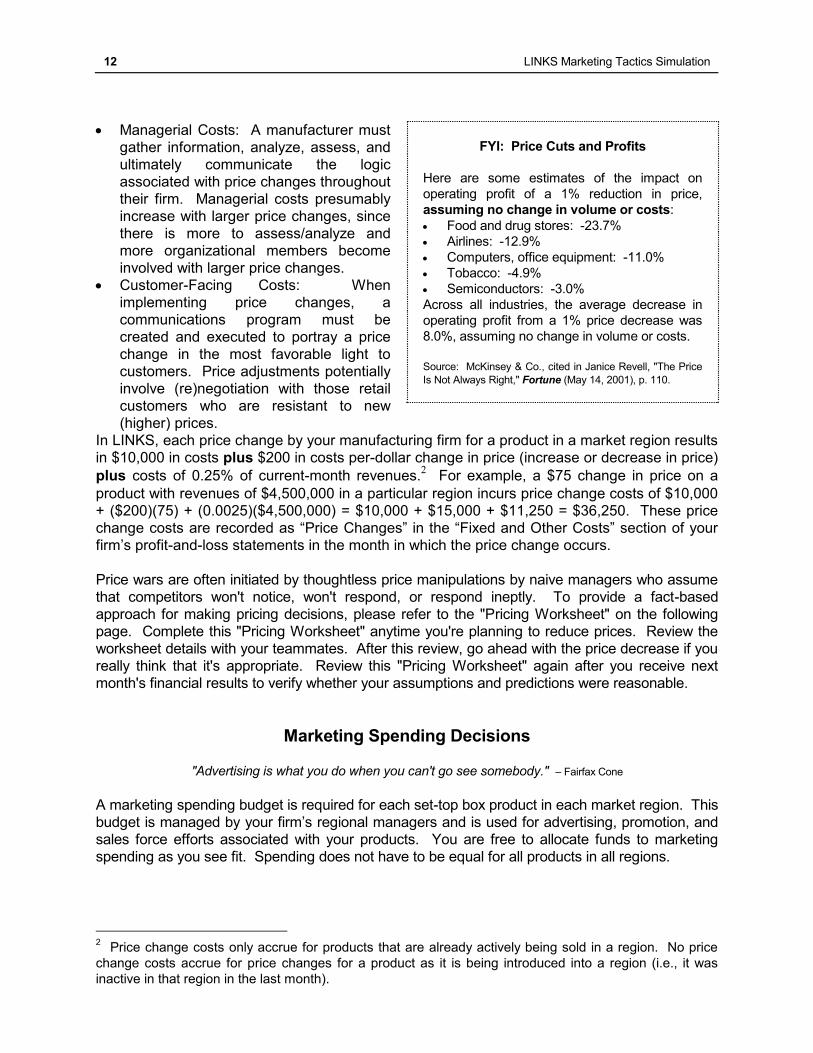
FYI: Price Cuts and Profits
Here are some estimates of the impact on
operating profit of a 1% reduction in price,
assuming no change in volume or costs:
Food and drug stores: -23.7%
Airlines: -12.9%
Computers, office equipment: -11.0%
Tobacco: -4.9%
Semiconductors: -3.0%
Across all industries, the average decrease in
operating profit from a 1% price decrease was
8.0%, assuming no change in volume or costs.
Source: McKinsey & Co., cited in Janice Revell, "The Price
Is Not Always Right," Fortune (May 14, 2001), p. 110.
LINKS Marketing Tactics Simulation 13
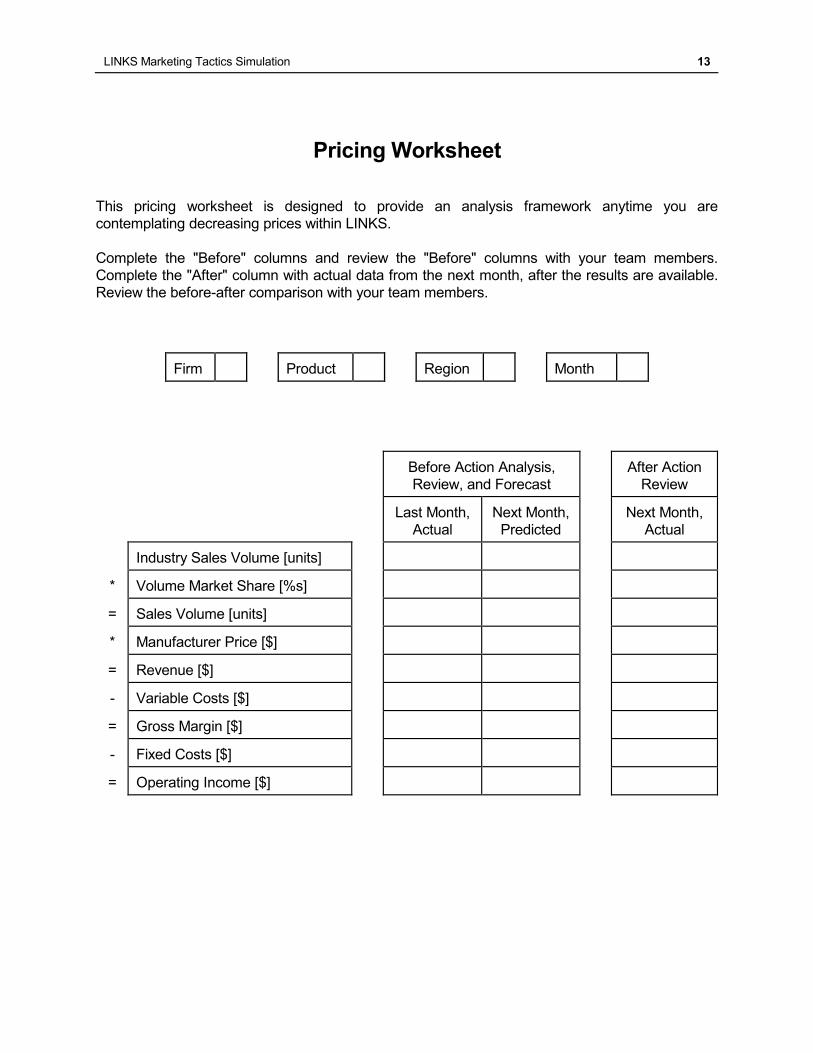
Pricing Worksheet
This pricing worksheet is designed to provide an analysis framework anytime you are
contemplating decreasing prices within LINKS.
Complete the "Before" columns and review the "Before" columns with your team members.
Complete the "After" column with actual data from the next month, after the results are available.
Review the before-after comparison with your team members.
Firm Product Region Month
Before Action Analysis,
Review, and Forecast
After Action
Review
Last Month,
Actual
Next Month,
Predicted
Next Month,
Actual
Industry Sales Volume [units]
* Volume Market Share [%s]
= Sales Volume [units]
* Manufacturer Price [$]
= Revenue [$]
- Variable Costs [$]
= Gross Margin [$]
- Fixed Costs [$]
= Operating Income [$]
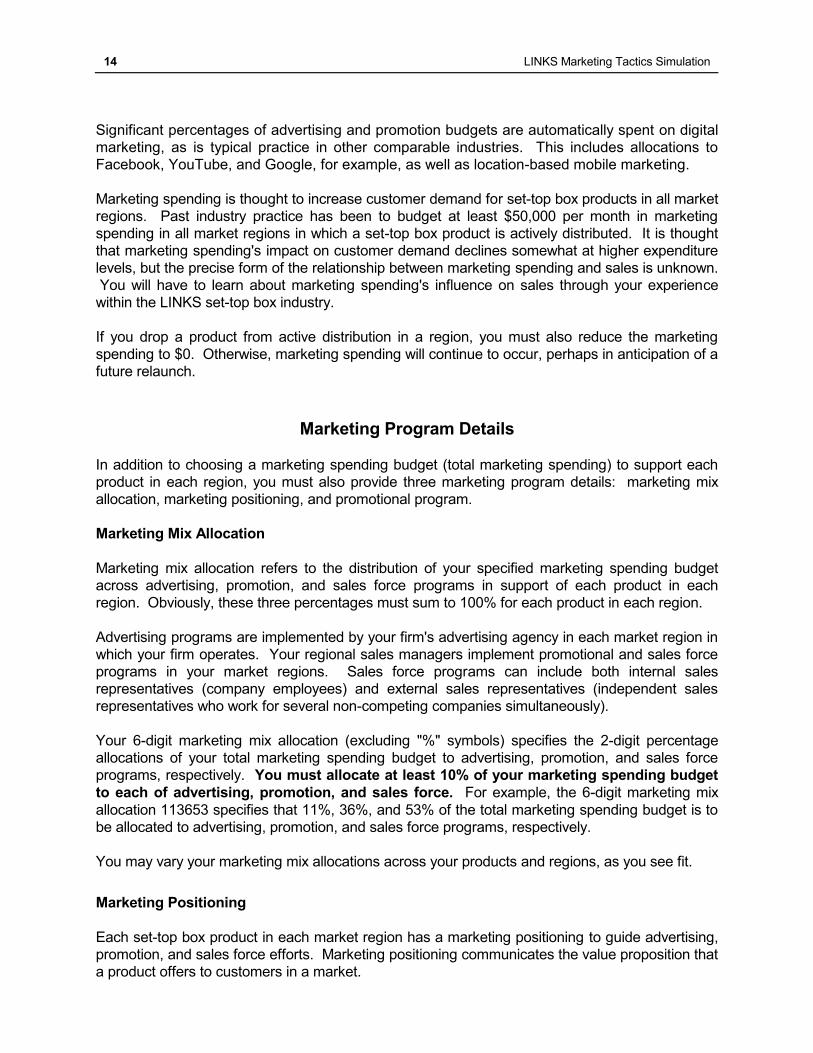
14 LINKS Marketing Tactics Simulation
Significant percentages of advertising and promotion budgets are automatically spent on digital
marketing, as is typical practice in other comparable industries. This includes allocations to
Facebook, YouTube, and Google, for example, as well as location-based mobile marketing.
Marketing spending is thought to increase customer demand for set-top box products in all market
regions. Past industry practice has been to budget at least $50,000 per month in marketing
spending in all market regions in which a set-top box product is actively distributed. It is thought
that marketing spending's impact on customer demand declines somewhat at higher expenditure
levels, but the precise form of the relationship between marketing spending and sales is unknown.
You will have to learn about marketing spending's influence on sales through your experience
within the LINKS set-top box industry.
If you drop a product from active distribution in a region, you must also reduce the marketing
spending to $0. Otherwise, marketing spending will continue to occur, perhaps in anticipation of a
future relaunch.
Marketing Program Details
In addition to choosing a marketing spending budget (total marketing spending) to support each
product in each region, you must also provide three marketing program details: marketing mix
allocation, marketing positioning, and promotional program.
Marketing Mix Allocation
Marketing mix allocation refers to the distribution of your specified marketing spending budget
across advertising, promotion, and sales force programs in support of each product in each
region. Obviously, these three percentages must sum to 100% for each product in each region.
Advertising programs are implemented by your firm's advertising agency in each market region in
which your firm operates. Your regional sales managers implement promotional and sales force
programs in your market regions. Sales force programs can include both internal sales
representatives (company employees) and external sales representatives (independent sales
representatives who work for several non-competing companies simultaneously).
Your 6-digit marketing mix allocation (excluding "%" symbols) specifies the 2-digit percentage
allocations of your total marketing spending budget to advertising, promotion, and sales force
programs, respectively. You must allocate at least 10% of your marketing spending budget
to each of advertising, promotion, and sales force. For example, the 6-digit marketing mix
allocation 113653 specifies that 11%, 36%, and 53% of the total marketing spending budget is to
be allocated to advertising, promotion, and sales force programs, respectively.
You may vary your marketing mix allocations across your products and regions, as you see fit.
Marketing Positioning
Each set-top box product in each market region has a marketing positioning to guide advertising,
promotion, and sales force efforts. Marketing positioning communicates the value proposition that
a product offers to customers in a market.
LINKS Marketing Tactics Simulation 15
Marketing positioning includes both “how to say it” (competitive positioning) and "what to say"
(benefit proposition). LINKS firms select a two-digit marketing positioning code for each product
in each market region.
First Digit: “How To Say It”
(Competitive Positioning)
Examples of “how to say it” include marketing
communications claims of more benefits for
the same price as competitors or equivalent
competitive benefits but at a lower price.
Second Digit: “What To Say”
(Benefit Proposition)
Examples of “what to say” include marketing
communications claims of superiority in
product quality, service quality, or availability
either individually or in combination.
Details follow about the specifics of “how to say it” (competitive positioning) and “what to say”
(benefit proposition).
“How to say it" (competitive positioning), the first digit in a LINKS marketing positioning
code, reflects a firm’s decision about whether to focus on benefit(s) exclusively, price exclusively,
or explicitly compare benefit(s) to price within marketing positioning. Your firm may use the
adjectives "more," "same," or "less" to describe your product offering relative to competing
products targeted at a specific market segment in a particular market region.
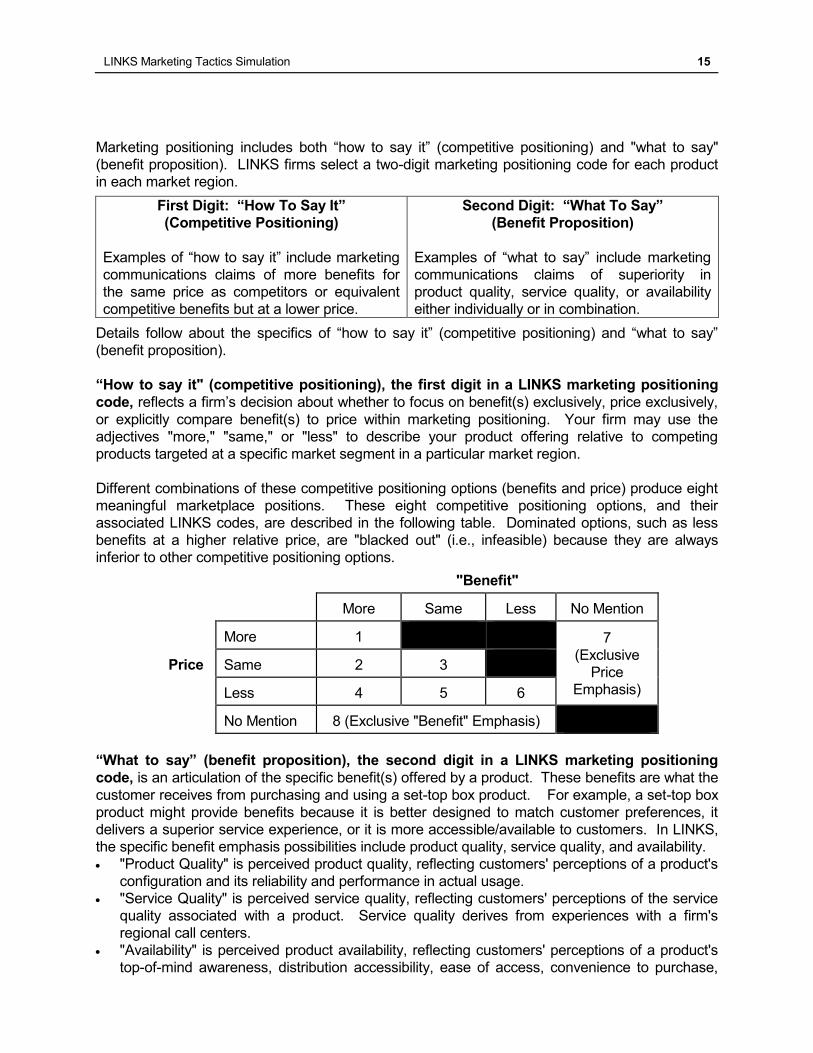
Different combinations of these competitive positioning options (benefits and price) produce eight
meaningful marketplace positions. These eight competitive positioning options, and their
associated LINKS codes, are described in the following table. Dominated options, such as less
benefits at a higher relative price, are "blacked out" (i.e., infeasible) because they are always
inferior to other competitive positioning options.
"Benefit"
More Same Less No Mention
More 1 7
(Exclusive
Price
Emphasis)
Price Same 2 3
Less 4 5 6
No Mention 8 (Exclusive "Benefit" Emphasis)
“What to say” (benefit proposition), the second digit in a LINKS marketing positioning
code, is an articulation of the specific benefit(s) offered by a product. These benefits are what the
customer receives from purchasing and using a set-top box product. For example, a set-top box
product might provide benefits because it is better designed to match customer preferences, it
delivers a superior service experience, or it is more accessible/available to customers. In LINKS,
the specific benefit emphasis possibilities include product quality, service quality, and availability.
"Product Quality" is perceived product quality, reflecting customers' perceptions of a product's
configuration and its reliability and performance in actual usage.
"Service Quality" is perceived service quality, reflecting customers' perceptions of the service
quality associated with a product. Service quality derives from experiences with a firm's
regional call centers.
"Availability" is perceived product availability, reflecting customers' perceptions of a product's
top-of-mind awareness, distribution accessibility, ease of access, convenience to purchase,
16 LINKS Marketing Tactics Simulation
and general presence/prominence in the market place.
A product’s marketing positioning may focus on one, two, or all three of these benefits. Note that
price is not a benefit to customers, but rather reflects the economic cost incurred to obtain the
offering's benefit(s). Price positioning is included within the first part of the marketing positioning
decision, "how you say it" (competitive positioning).
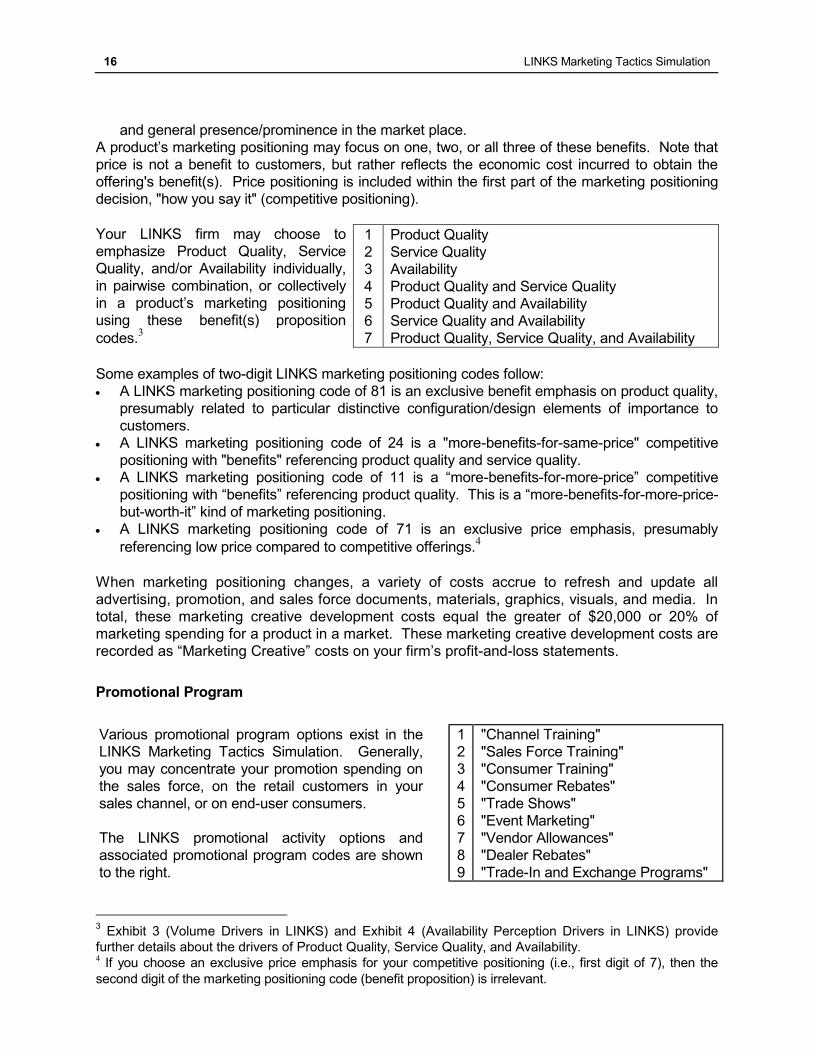
Your LINKS firm may choose to
emphasize Product Quality, Service
Quality, and/or Availability individually,
in pairwise combination, or collectively
in a product’s marketing positioning
using these benefit(s) proposition
codes.3
1
2
3
4
5
6
7
Product Quality
Service Quality
Availability
Product Quality and Service Quality
Product Quality and Availability
Service Quality and Availability
Product Quality, Service Quality, and Availability
Some examples of two-digit LINKS marketing positioning codes follow:
A LINKS marketing positioning code of 81 is an exclusive benefit emphasis on product quality,
presumably related to particular distinctive configuration/design elements of importance to
customers.
A LINKS marketing positioning code of 24 is a "more-benefits-for-same-price" competitive
positioning with "benefits" referencing product quality and service quality.
A LINKS marketing positioning code of 11 is a “more-benefits-for-more-price” competitive
positioning with “benefits” referencing product quality. This is a “more-benefits-for-more-price-
but-worth-it” kind of marketing positioning.
A LINKS marketing positioning code of 71 is an exclusive price emphasis, presumably
referencing low price compared to competitive offerings.4
When marketing positioning changes, a variety of costs accrue to refresh and update all
advertising, promotion, and sales force documents, materials, graphics, visuals, and media. In
total, these marketing creative development costs equal the greater of $20,000 or 20% of
marketing spending for a product in a market. These marketing creative development costs are
recorded as “Marketing Creative” costs on your firm’s profit-and-loss statements.
Promotional Program
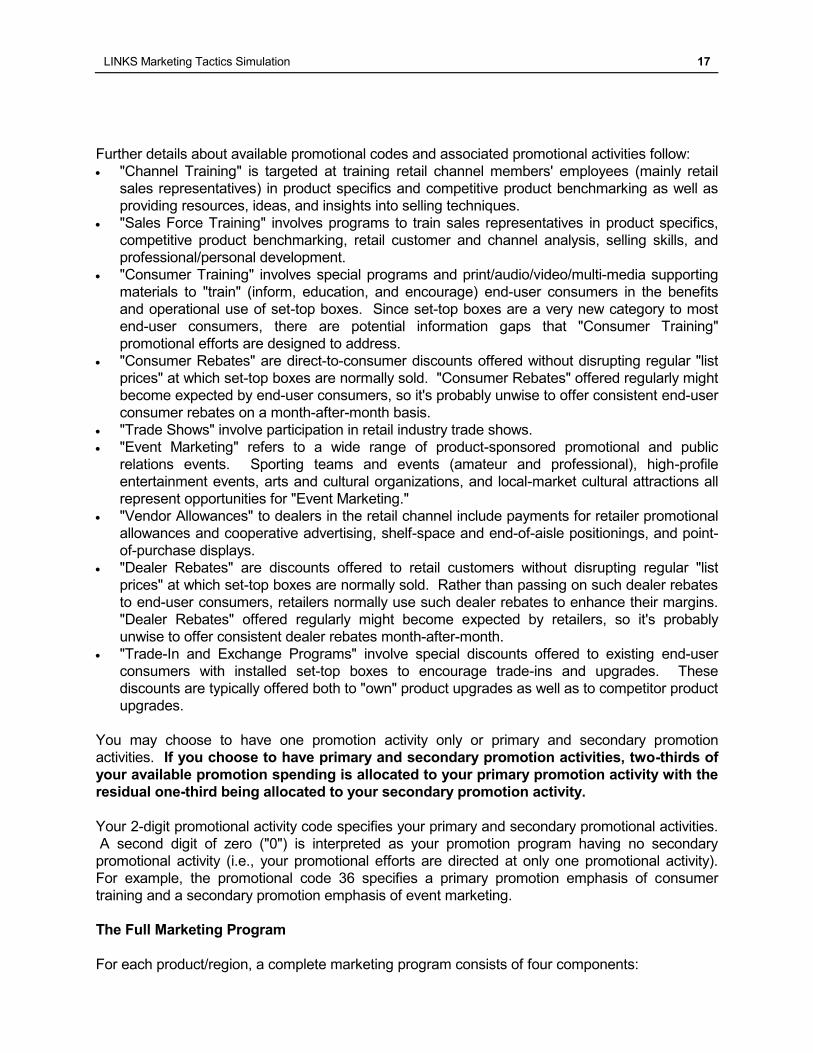
Various promotional program options exist in the
LINKS Marketing Tactics Simulation. Generally,
you may concentrate your promotion spending on
the sales force, on the retail customers in your
sales channel, or on end-user consumers.
The LINKS promotional activity options and
associated promotional program codes are shown
to the right.
1
2
3
4
5
6
7
8
9
"Channel Training"
"Sales Force Training"
"Consumer Training"
"Consumer Rebates"
"Trade Shows"
"Event Marketing"
"Vendor Allowances"
"Dealer Rebates"
"Trade-In and Exchange Programs"
3 Exhibit 3 (Volume Drivers in LINKS) and Exhibit 4 (Availability Perception Drivers in LINKS) provide
further details about the drivers of Product Quality, Service Quality, and Availability. 4 If you choose an exclusive price emphasis for your competitive positioning (i.e., first digit of 7), then the
second digit of the marketing positioning code (benefit proposition) is irrelevant.
LINKS Marketing Tactics Simulation 17
Further details about available promotional codes and associated promotional activities follow:
"Channel Training" is targeted at training retail channel members' employees (mainly retail
sales representatives) in product specifics and competitive product benchmarking as well as
providing resources, ideas, and insights into selling techniques.
"Sales Force Training" involves programs to train sales representatives in product specifics,
competitive product benchmarking, retail customer and channel analysis, selling skills, and
professional/personal development.
"Consumer Training" involves special programs and print/audio/video/multi-media supporting
materials to "train" (inform, education, and encourage) end-user consumers in the benefits
and operational use of set-top boxes. Since set-top boxes are a very new category to most
end-user consumers, there are potential information gaps that "Consumer Training"
promotional efforts are designed to address.
"Consumer Rebates" are direct-to-consumer discounts offered without disrupting regular "list
prices" at which set-top boxes are normally sold. "Consumer Rebates" offered regularly might
become expected by end-user consumers, so it's probably unwise to offer consistent end-user
consumer rebates on a month-after-month basis.
"Trade Shows" involve participation in retail industry trade shows.
"Event Marketing" refers to a wide range of product-sponsored promotional and public
relations events. Sporting teams and events (amateur and professional), high-profile
entertainment events, arts and cultural organizations, and local-market cultural attractions all
represent opportunities for "Event Marketing."
"Vendor Allowances" to dealers in the retail channel include payments for retailer promotional
allowances and cooperative advertising, shelf-space and end-of-aisle positionings, and point-
of-purchase displays.
"Dealer Rebates" are discounts offered to retail customers without disrupting regular "list
prices" at which set-top boxes are normally sold. Rather than passing on such dealer rebates
to end-user consumers, retailers normally use such dealer rebates to enhance their margins.
"Dealer Rebates" offered regularly might become expected by retailers, so it's probably
unwise to offer consistent dealer rebates month-after-month.
"Trade-In and Exchange Programs" involve special discounts offered to existing end-user
consumers with installed set-top boxes to encourage trade-ins and upgrades. These
discounts are typically offered both to "own" product upgrades as well as to competitor product
upgrades.
You may choose to have one promotion activity only or primary and secondary promotion
activities. If you choose to have primary and secondary promotion activities, two-thirds of
your available promotion spending is allocated to your primary promotion activity with the
residual one-third being allocated to your secondary promotion activity.
Your 2-digit promotional activity code specifies your primary and secondary promotional activities.
A second digit of zero ("0") is interpreted as your promotion program having no secondary
promotional activity (i.e., your promotional efforts are directed at only one promotional activity).
For example, the promotional code 36 specifies a primary promotion emphasis of consumer
training and a secondary promotion emphasis of event marketing.
The Full Marketing Program
For each product/region, a complete marketing program consists of four components:
18 LINKS Marketing Tactics Simulation
(1) Marketing spending budget (marketing support spending allocated to a product in a region).
(2) Marketing mix allocation, a 6-digit code corresponding to the 2-digit percentages (excluding
"%" symbols) of the respective allocations of the total marketing spending budget to
advertising, promotion, and sales force sub-programs.
(3) Marketing positioning, a 2-digit code corresponding to competitive positioning ("how-you-say-
it") and benefit proposition ("what-you-say").
(4) Promotional program, a 2-digit code representing primary and secondary promotional
programs (the second digit of "0" signifies that no secondary promotion activity exists).
Obviously, these marketing program elements must be chosen with a sense of a product's natural
relative standing in the competitive set-top box industry.
You may vary your marketing spending budgets, marketing mix allocations, marketing
positionings, and promotional programs across your products and regions as you see fit.
If you make any inadvertent input error in marketing mix allocation, marketing positioning, or
promotional program inputs, the previous month's values will continue to be in effect. Examples of
input errors include marketing mix allocations which don't sum to 100%, marketing mix allocations
of less than 10%, and invalid marketing positioning or promotional program codes.
Introduction/Drop Decisions
You may introduce products into regions not currently active or drop products from regions as you
see fit. Introduction incurs a one-time cost of $750,000 in any region to cover retail slotting fees
and allowances.5 Dropping a product from active distribution in a region incurs no special costs.
Introduction costs are recorded under "Introductions" on your financial statements.
If you wish to "activate" a product in a region, you must issue a specific introduction decision.
Change the "Active Product?" status to "Yes" to introduce a product into a region. To drop a
product from active status in a region, change its "Active Product?" status to "No." You only
have to introduce a product into a region once. Once a product is active in a region, it will
continue to be active until you make an explicit drop ("No") decision.
You must explicitly introduce or drop a product from a region, regardless of your marketing
spending and your sales volume forecasts. Setting marketing spending to zero does not result in
the associated product being dropped from that market region.
If you drop a product from a region, you must change marketing spending to $0. Otherwise,
marketing spending continues to occur, in anticipation of a future relaunch.
Your firm has a corporate policy of limiting new product-region launches to a maximum of
one in any month.
5 Slotting fees and allowances are the up-front, one-time, lump-sum payments from set-top box
manufacturers to retailers to obtain new product distribution in the retail channel. For a discussion and
analysis of retail-channel slotting fees, see Paula Fitzgerald Bond, Karen Russo France, and Richard
Riley, “A Multi-Firm Analysis of Slotting fees,” Journal of Public Policy & Marketing, Volume 25,
Number 2 (Fall 2006), pp. 224-237.
LINKS Marketing Tactics Simulation 19
Sales Volume Forecasting Decisions
"Prediction is very difficult, especially about the future." – Niels Bohr
Monthly sales volume forecasts are required in the LINKS Marketing Tactics Simulation for each
of your products in every market region in which your products are actively distributed.
Administrative overhead costs of $240,000 for each product in each region increase by 3% for
every 1% inaccuracy in your sales volume forecasts. For example, a forecast error of 10%
(whether positive or negative) for a product in a region increases the administrative overhead
costs for that product in that region by 30%.
The maximum administrative overhead penalty associated with sales forecasting inaccuracy
for each product in each region is a tripling of administrative overhead.
Forecast error costs are recorded as “Forecast Inaccuracy” costs on your firm’s profit-and-loss
statements, so the reported base administrative overhead costs are always $240,000 for each
product in each region.
Sales volume forecasting decisions are independent of production decisions. Sales volume
forecasting decisions are your best estimates of your firm’s sales.
Within LINKS, short-term sales volume forecasts are required for the next month. These
forecasts are for each product in each region in which products are actively distributed.
The following page contains a judgmental sales forecasting worksheet that provides a template
for systematically approaching the sales forecasting process. Judgmental adjustments are
challenging, but at least you're explicitly taking into account that your and their (competitors')
generate demand program changes influence your sales.
Forecasting accuracy is equal to 100*(1-(abs(Forecast-Actual)/Actual)) expressed in percentage
terms, where "abs" is the absolute value function. Thus, a forecast value of 11,000 and an actual
value of 8,000 result in a forecast accuracy of 100*(1-abs(11,000-8,000)/8,000) = 100*(1-
(3,000/8,000)) = 100*(1-0.375) = 62.5%. The minimum possible value of forecasting accuracy is
0.0%. For example, with an Actual sales volume of 8,000, a Forecast above 16,000 results in a
forecasting accuracy score of 0.0%.
20 LINKS Marketing Tactics Simulation
Judgmental Sales Forecasting Worksheet
Sales forecasting is extraordinarily challenging due to the many factors influencing your sales
(your current and recent generate demand programs, current and recent competitors' generate
demand programs, and exogenous market forces).
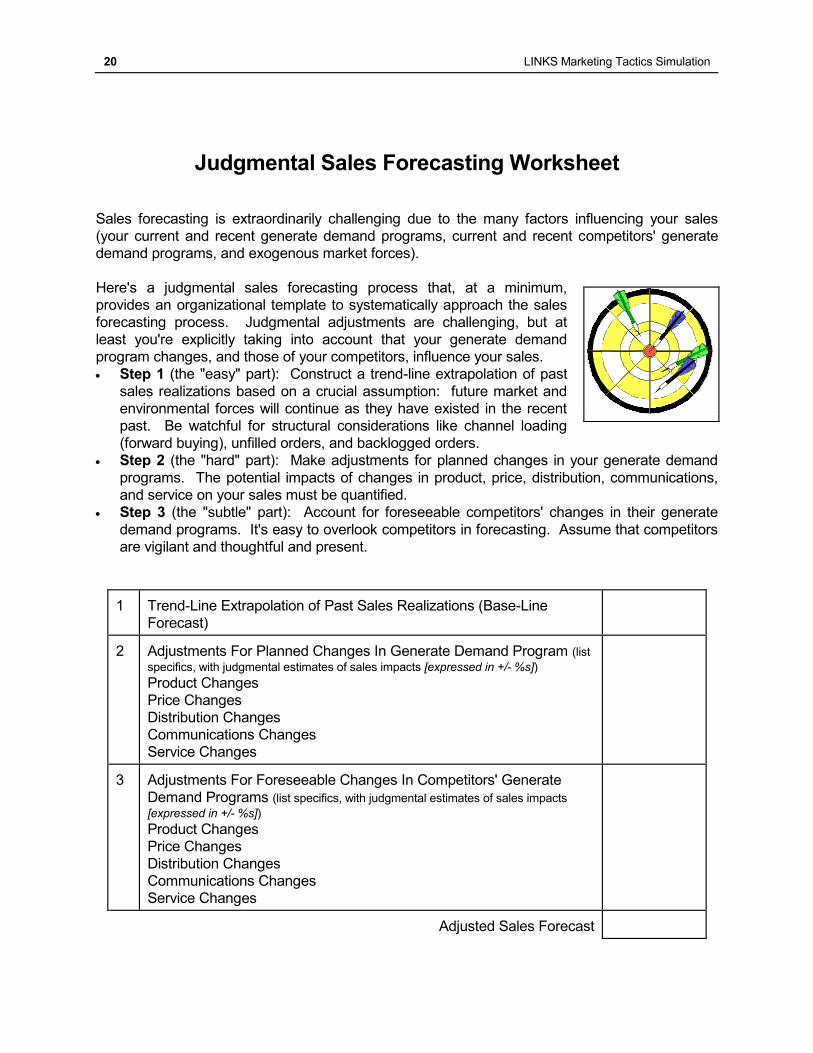
Here's a judgmental sales forecasting process that, at a minimum,
provides an organizational template to systematically approach the sales
forecasting process. Judgmental adjustments are challenging, but at
least you're explicitly taking into account that your generate demand
program changes, and those of your competitors, influence your sales.
Step 1 (the "easy" part): Construct a trend-line extrapolation of past
sales realizations based on a crucial assumption: future market and
environmental forces will continue as they have existed in the recent
past. Be watchful for structural considerations like channel loading
(forward buying), unfilled orders, and backlogged orders.
Step 2 (the "hard" part): Make adjustments for planned changes in your generate demand
programs. The potential impacts of changes in product, price, distribution, communications,
and service on your sales must be quantified.
Step 3 (the "subtle" part): Account for foreseeable competitors' changes in their generate
demand programs. It's easy to overlook competitors in forecasting. Assume that competitors
are vigilant and thoughtful and present.
1 Trend-Line Extrapolation of Past Sales Realizations (Base-Line
Forecast)
2 Adjustments For Planned Changes In Generate Demand Program (list
specifics, with judgmental estimates of sales impacts [expressed in +/- %s]) Product Changes
Price Changes
Distribution Changes
Communications Changes
Service Changes
3 Adjustments For Foreseeable Changes In Competitors' Generate
Demand Programs (list specifics, with judgmental estimates of sales impacts
[expressed in +/- %s]) Product Changes
Price Changes
Distribution Changes
Communications Changes
Service Changes
Adjusted Sales Forecast
LINKS Marketing Tactics Simulation 21
Financial and Operating Reports
The LINKS financial and operating reports are described in this chapter. These are the standard
reports that you receive after each month of the LINKS exercise.
Profitability Drivers
"A company can outperform rivals only if it can establish a difference that it can
preserve. Competitive strategy is about being different, deliberately choosing a
different set of activities to deliver a unique value mix." – Michael Porter
The financial and operating reports described in this chapter are lengthy and detailed. To provide
an overall roadmap for thinking about the drivers of profitability, the three charts in Exhibits 2-4
decompose net income into its underlying components.
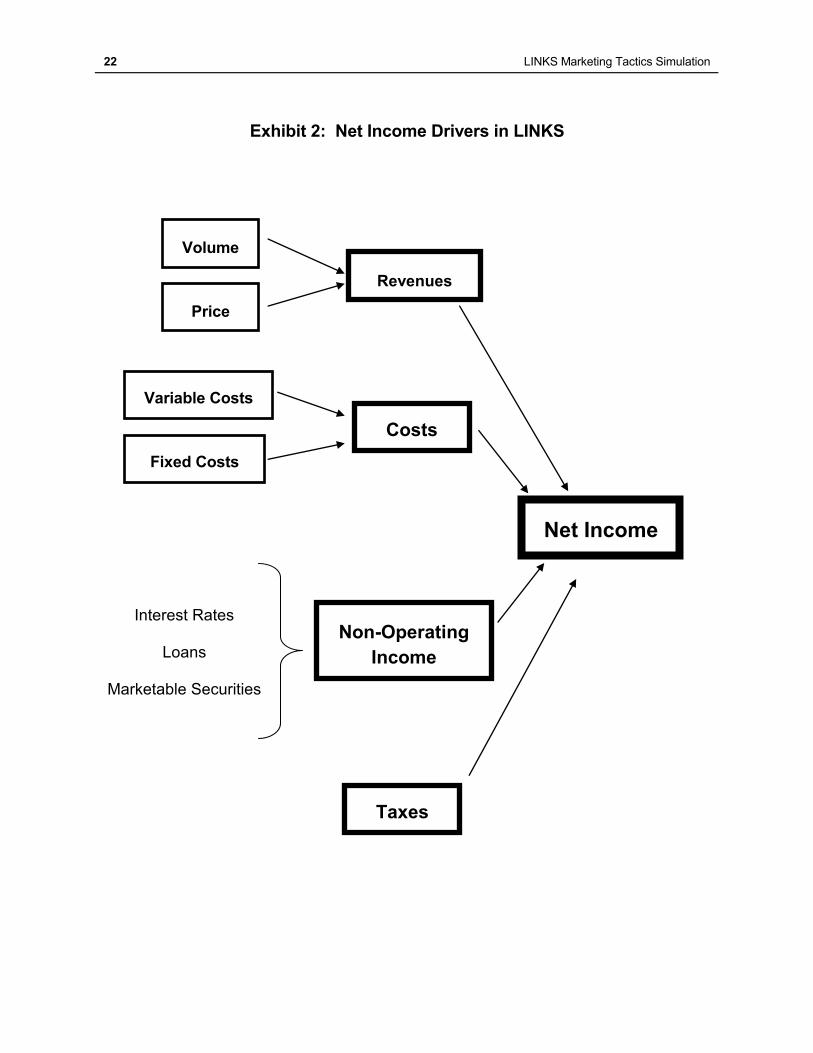
In Exhibit 2, the principal drivers of net income are revenues and costs. Taxes and non-operating
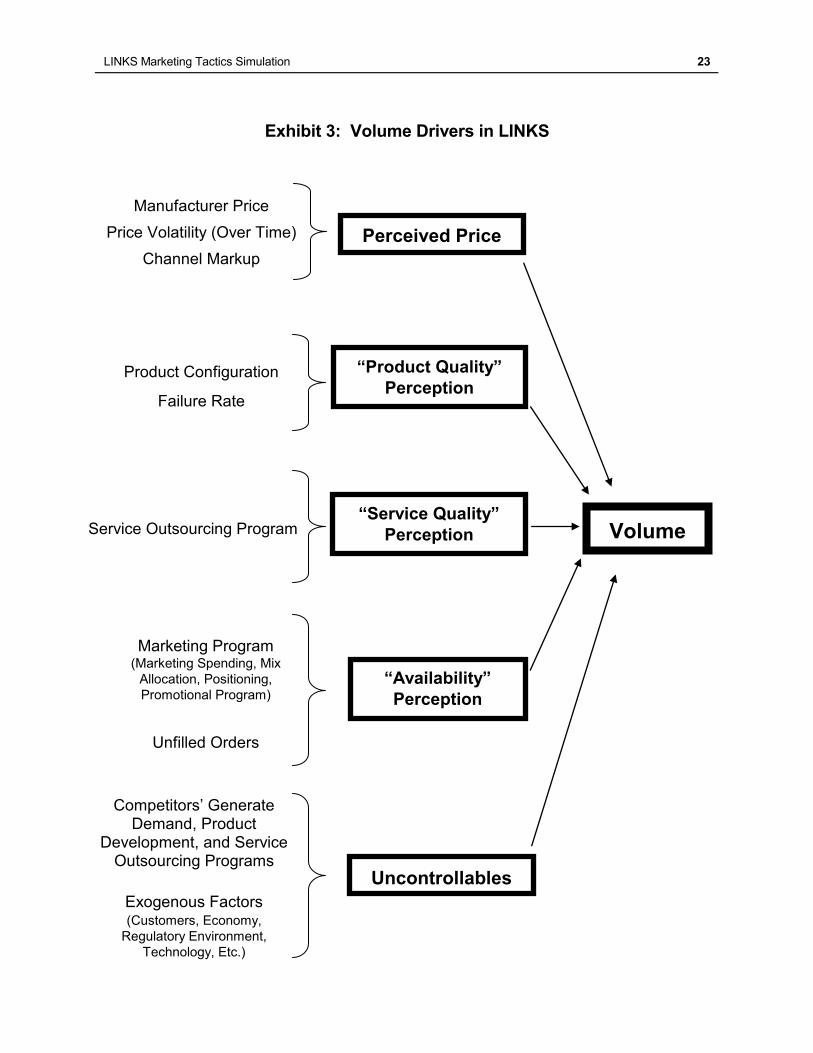
income play lesser roles. Exhibit 3 provides a breakdown of the drivers of volume, one of the two
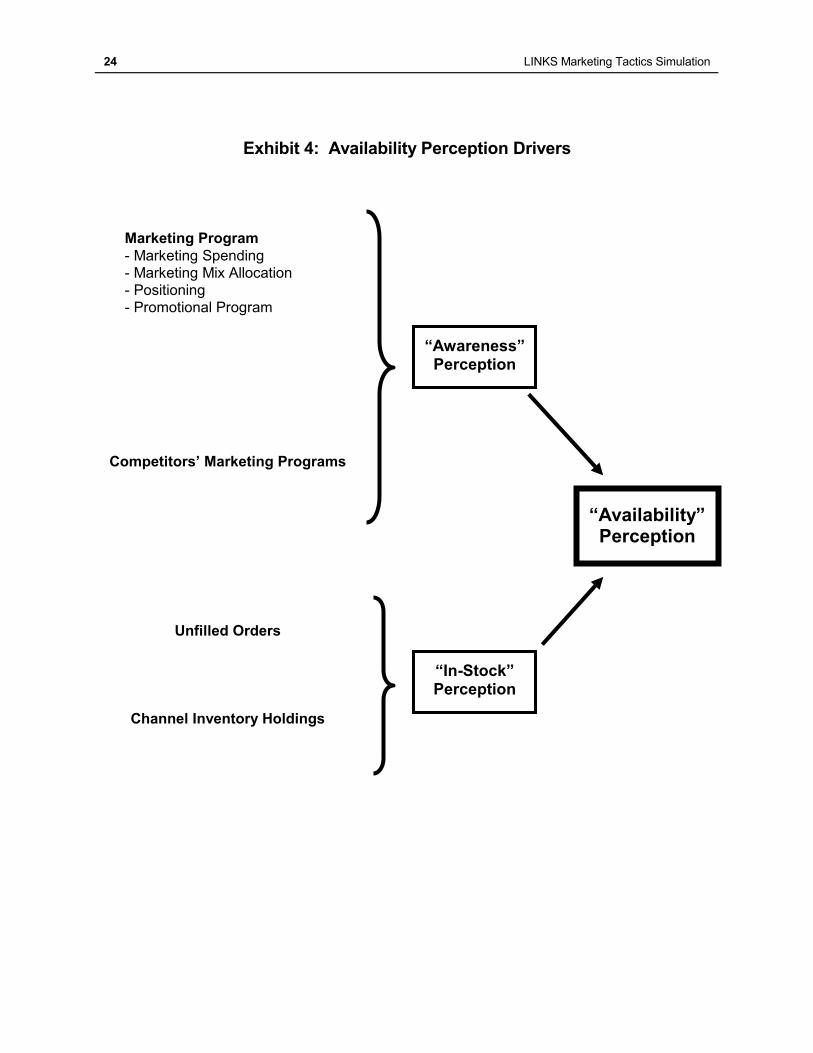
key drivers of revenues. Exhibit 4 provides further details about the drivers of availability
perceptions. Collectively, these exhibits provide a sense of the DNA of net income.
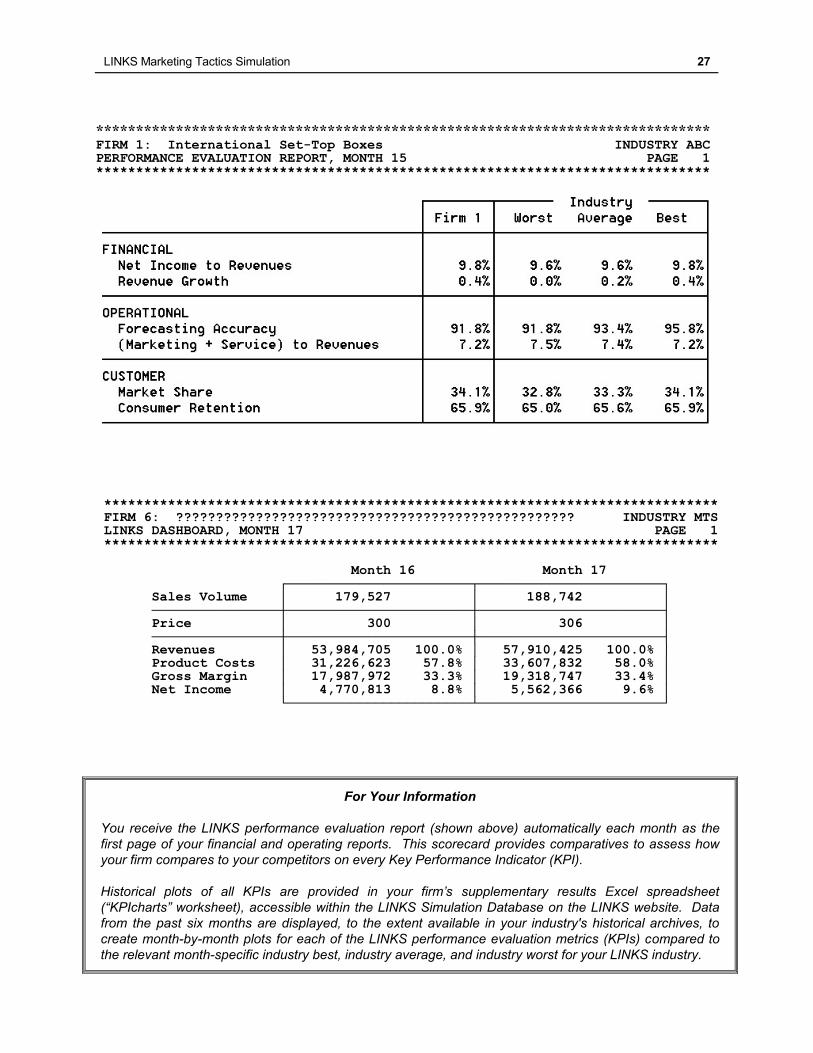
Performance Evaluation Report
Please consult the “Performance Evaluation” chapter for a detailed discussion of the
"Performance Evaluation Report" that forms the first page of your financial and operating reports.
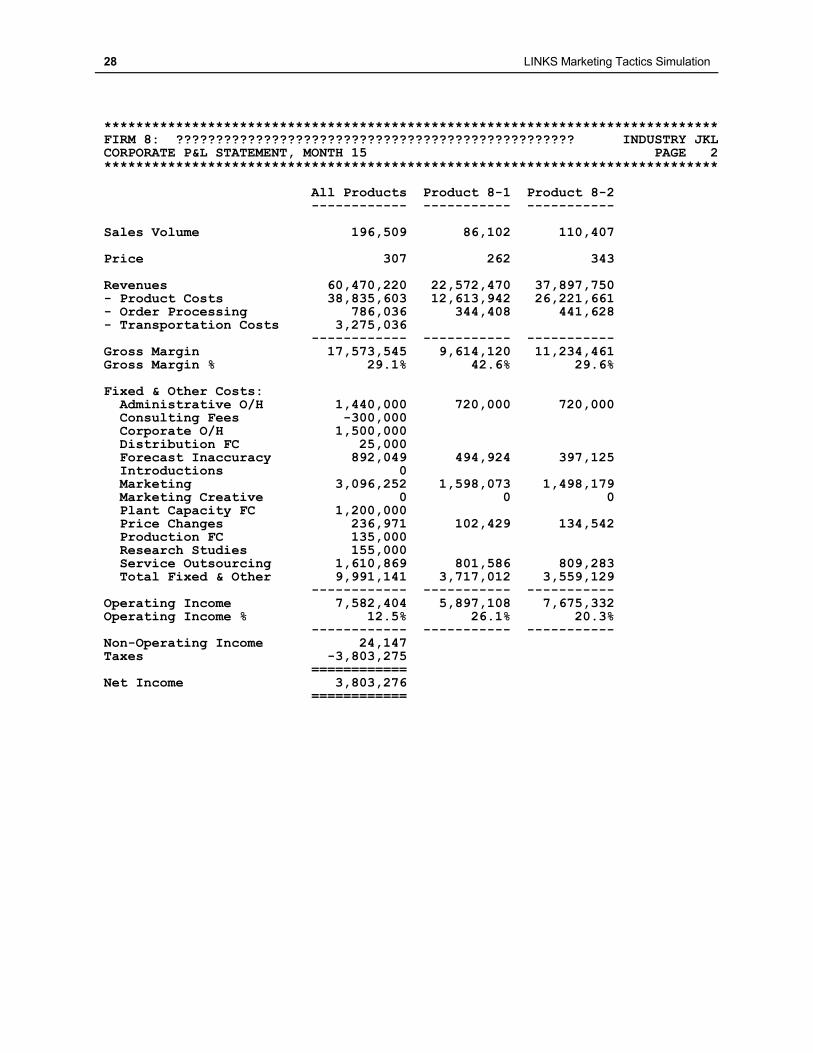
P&L Statements
The "Corporate P&L Statement" aggregates all of the product-specific profit-and-loss statements
into an overall corporate profit-and-loss statement. A variety of line items appear on the
"Corporate P&L Statement" only, because it is not possible to unambiguously allocate those costs
to specific products in specific regions.
Definitions of non-obvious line items on the "Corporate Current P&L Statement" follow:
Administrative overhead ("Administrative O/H") is $240,000/month for each product actively-
distributed in each market region.
"Consulting Fees" may be positive or negative. "Consulting Fees" are adjustments to income
or expenses. Conversations with your coach/instructor are normally without charge, so don't
worry about "Consulting Fees" associated with these consultations. In LINKS, the "Consulting
Fees" line item represents a convenient mechanism for making adjustments to income or
expenses. For example, a research billing problem can be corrected via an appropriate
negative "Consulting Fee."
Corporate overhead ("Corporate O/H") is $750,000 per product per month. This per-product
charge is incurred if a product is actively distributed in one or more market regions.
22 LINKS Marketing Tactics Simulation
Exhibit 2: Net Income Drivers in LINKS
Net Income
Revenues
Costs
Non-Operating
Income
Taxes
Volume
Price
Fixed Costs
Variable Costs
Interest Rates
Loans
Marketable Securities
LINKS Marketing Tactics Simulation 23
Exhibit 3: Volume Drivers in LINKS
Competitors’ Generate
Demand, Product Development, and Service
Outsourcing Programs
Exogenous Factors (Customers, Economy,
Regulatory Environment,
Technology, Etc.)
Volume
Perceived Price
“Availability”
Perception
Uncontrollables
“Service Quality”
Perception
“Product Quality”
Perception Product Configuration
Failure Rate
Marketing Program (Marketing Spending, Mix
Allocation, Positioning,
Promotional Program)
Unfilled Orders
Service Outsourcing Program
Manufacturer Price
Price Volatility (Over Time)
Channel Markup
24 LINKS Marketing Tactics Simulation
Exhibit 4: Availability Perception Drivers
“Availability” Perception
“Awareness” Perception
“In-Stock” Perception
Marketing Program
- Marketing Spending
- Marketing Mix Allocation
- Positioning
- Promotional Program
Competitors’ Marketing Programs
Unfilled Orders
Channel Inventory Holdings
LINKS Marketing Tactics Simulation 25
"Distribution FC" reflects the fixed costs associated with operating distribution centers.
“Forecast Inaccuracy” records the costs associated with forecasting errors. "Introductions" reflects introduction costs when products are first introduced into market
regions. One-time introduction costs are $250,000 for each introduction of a product in a
market region.
"Marketing" equals total marketing spending.
"Non-Operating Income" derives either from interest earned on "Marketable Securities" (from
the previous month's "Balance Sheet") or from interest paid on "Loans" (from the previous
month's "Balance Sheet").
"Operating Income" equals "Gross Margin" minus "Total Fixed Costs."
"Order Processing" records order processing costs for $4/unit in all regions.
"Plant Capacity FC" represents the costs associated with production "shifts" in your
manufacturing plant. These costs cover all depreciation and maintenance associated with
your plant capacity. These costs are allocated equally among your products.
"Production FC" includes the fixed costs associated with production orders. Fixed costs for
production are included in the "Production FC" line item.
"Research Studies" reflects the total costs associated with last month's research study
requests. Note that the current month's research studies are executed after the current
month's financial reports are prepared. Thus, research study billings are lagged a month.
"Taxes" represents the corporate taxes payable in the market region in which your firm has its
manufacturing plant. Your manufacturing plant is located in market region 1, which has a
corporate tax rate of 50%.
"Total Fixed Costs" is the sum of all fixed costs. Note that "Total Fixed Costs" does not sum
correctly down and across since some fixed costs are not allocated to specific products.
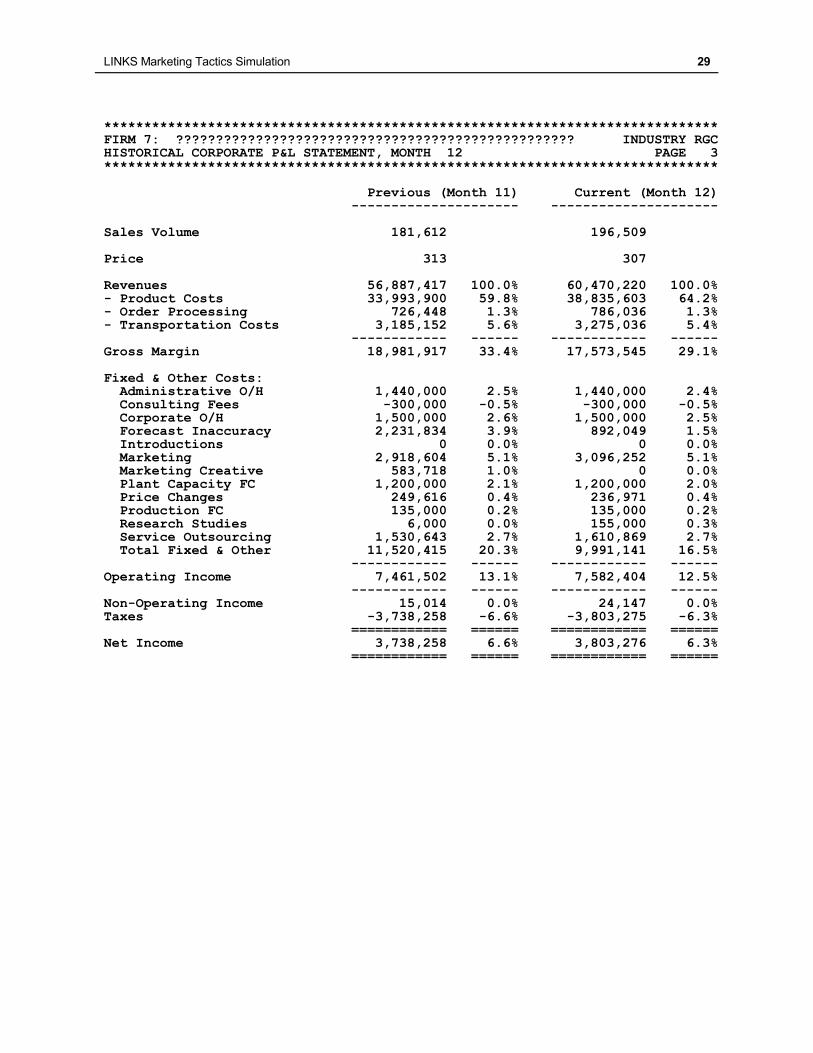
The "Historical Corporate P&L Statement" reports the previous and current month's corporate-
level profit-and-loss data. In addition, all elements in the "Historical Corporate P&L Statement"
are expressed in percentage-of-revenue terms.
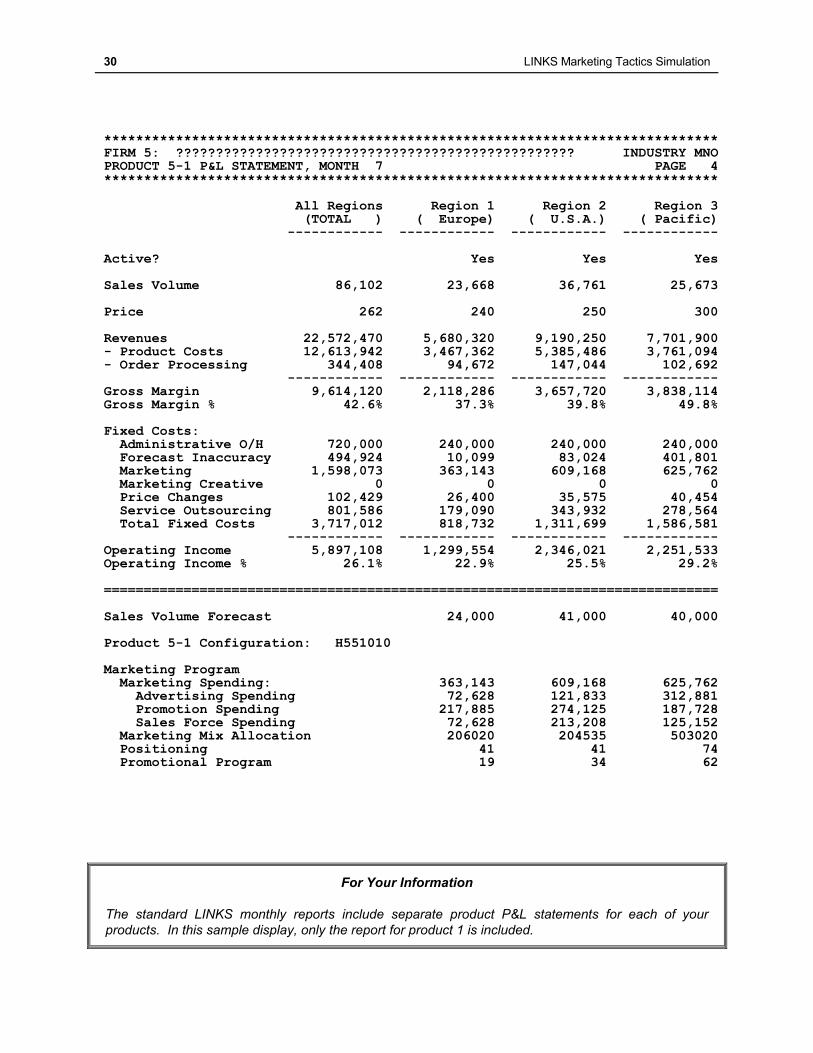
Each product has a current-month profit-and-loss statement.
Forecasting Accuracy Report
The "Forecasting Accuracy Report" provides details of the forecasting accuracy associated with
your short-term (next-month) sales volume forecasts. In addition, the sales history for all of your
firm's products (product-unit sales by product and region) for the last six months is displayed at
the end of this report.
Forecasting accuracy is equal to 100*(1-(abs(Forecast-Actual)/Actual))
expressed in percentage terms, where "abs" is the absolute value
function. Thus, a forecast value of 11,000 and an actual value of 8,000
results in a forecast accuracy of 100*(1-abs(11,000-8,000)/8,000) =
100*(1-(3,000/8,000)) = 100*(1-0.375) = 62.5%. The minimum possible
value of forecasting accuracy is 0.0%. For example, with an Actual sales
volume of 8,000, a Forecast above 16,000 results in a forecasting
accuracy score of 0.0%.
26 LINKS Marketing Tactics Simulation
Set-Top Box Industry Bulletin
The "Set-Top Box Industry Bulletin" provides current-month industry-related information.
Information reported in the "Bulletin" includes things that an actual manager in the set-top box
industry could easily observe without additional cost or with nominal effort during the course of
events that comprise a normal month's work. To drill down below these headlines, you will need
appropriate research studies.
Sample Reports
"The meaning of life is to do the best you can with what you've got." – Anonymous
The following pages provide samples of the standard LINKS financial
and operating reports. In addition to these reports, you'll receive the
results of any research studies that you order on additional pages after
the last page of your financial and operating reports.
These samples are provided to familiarize you with the style and format of the reports that are
provided to your firm after each LINKS round. The data reported in these sample reports are only
illustrative of reports formatting. These data aren’t specific to your particular LINKS industry.
Please do not interpret these samples as suggested guidelines or benchmarks for good decisions
and performance within LINKS.
If you’d like some further background on interpreting LINKS financial statements, please access
Tutorial #1 (“P&L Statements”) on the LINKS website and spend 30 minutes or so working
through it prior to the beginning of your LINKS event.
LINKS Marketing Tactics Simulation 27
***************************************************************************** FIRM 1: International Set-Top Boxes INDUSTRY ABC PERFORMANCE EVALUATION REPORT, MONTH 15 PAGE 1 *****************************************************************************
***************************************************************************** FIRM 6: ?????????????????????????????????????????????????? INDUSTRY MTS LINKS DASHBOARD, MONTH 17 PAGE 1 ***************************************************************************** Month 16 Month 17 ┌───────────────────────┬───────────────────────┐ Sales Volume │ 179,527 │ 188,742 │ ────────────────┼───────────────────────┼───────────────────────┤ Price │ 300 │ 306 │ ────────────────┼───────────────────────┼───────────────────────┤ Revenues │ 53,984,705 100.0% │ 57,910,425 100.0% │ Product Costs │ 31,226,623 57.8% │ 33,607,832 58.0% │ Gross Margin │ 17,987,972 33.3% │ 19,318,747 33.4% │ Net Income │ 4,770,813 8.8% │ 5,562,366 9.6% │ └───────────────────────┴───────────────────────┘
For Your Information
You receive the LINKS performance evaluation report (shown above) automatically each month as the
first page of your financial and operating reports. This scorecard provides comparatives to assess how
your firm compares to your competitors on every Key Performance Indicator (KPI).
Historical plots of all KPIs are provided in your firm’s supplementary results Excel spreadsheet
(“KPIcharts” worksheet), accessible within the LINKS Simulation Database on the LINKS website. Data
from the past six months are displayed, to the extent available in your industry's historical archives, to
create month-by-month plots for each of the LINKS performance evaluation metrics (KPIs) compared to
the relevant month-specific industry best, industry average, and industry worst for your LINKS industry.
28 LINKS Marketing Tactics Simulation
***************************************************************************** FIRM 8: ?????????????????????????????????????????????????? INDUSTRY JKL CORPORATE P&L STATEMENT, MONTH 15 PAGE 2 ***************************************************************************** All Products Product 8-1 Product 8-2 ------------ ----------- ----------- Sales Volume 196,509 86,102 110,407 Price 307 262 343 Revenues 60,470,220 22,572,470 37,897,750 - Product Costs 38,835,603 12,613,942 26,221,661 - Order Processing 786,036 344,408 441,628 - Transportation Costs 3,275,036 ------------ ----------- ----------- Gross Margin 17,573,545 9,614,120 11,234,461 Gross Margin % 29.1% 42.6% 29.6% Fixed & Other Costs: Administrative O/H 1,440,000 720,000 720,000 Consulting Fees -300,000 Corporate O/H 1,500,000 Distribution FC 25,000 Forecast Inaccuracy 892,049 494,924 397,125 Introductions 0 Marketing 3,096,252 1,598,073 1,498,179 Marketing Creative 0 0 0 Plant Capacity FC 1,200,000 Price Changes 236,971 102,429 134,542 Production FC 135,000 Research Studies 155,000 Service Outsourcing 1,610,869 801,586 809,283 Total Fixed & Other 9,991,141 3,717,012 3,559,129 ------------ ----------- ----------- Operating Income 7,582,404 5,897,108 7,675,332 Operating Income % 12.5% 26.1% 20.3% ------------ ----------- ----------- Non-Operating Income 24,147 Taxes -3,803,275 ============ Net Income 3,803,276 ============
LINKS Marketing Tactics Simulation 29
***************************************************************************** FIRM 7: ?????????????????????????????????????????????????? INDUSTRY RGC HISTORICAL CORPORATE P&L STATEMENT, MONTH 12 PAGE 3 ***************************************************************************** Previous (Month 11) Current (Month 12) --------------------- --------------------- Sales Volume 181,612 196,509 Price 313 307 Revenues 56,887,417 100.0% 60,470,220 100.0% - Product Costs 33,993,900 59.8% 38,835,603 64.2% - Order Processing 726,448 1.3% 786,036 1.3% - Transportation Costs 3,185,152 5.6% 3,275,036 5.4% ------------ ------ ------------ ------ Gross Margin 18,981,917 33.4% 17,573,545 29.1% Fixed & Other Costs: Administrative O/H 1,440,000 2.5% 1,440,000 2.4% Consulting Fees -300,000 -0.5% -300,000 -0.5% Corporate O/H 1,500,000 2.6% 1,500,000 2.5% Forecast Inaccuracy 2,231,834 3.9% 892,049 1.5% Introductions 0 0.0% 0 0.0% Marketing 2,918,604 5.1% 3,096,252 5.1% Marketing Creative 583,718 1.0% 0 0.0% Plant Capacity FC 1,200,000 2.1% 1,200,000 2.0% Price Changes 249,616 0.4% 236,971 0.4% Production FC 135,000 0.2% 135,000 0.2% Research Studies 6,000 0.0% 155,000 0.3% Service Outsourcing 1,530,643 2.7% 1,610,869 2.7% Total Fixed & Other 11,520,415 20.3% 9,991,141 16.5% ------------ ------ ------------ ------ Operating Income 7,461,502 13.1% 7,582,404 12.5% ------------ ------ ------------ ------ Non-Operating Income 15,014 0.0% 24,147 0.0% Taxes -3,738,258 -6.6% -3,803,275 -6.3% ============ ====== ============ ====== Net Income 3,738,258 6.6% 3,803,276 6.3% ============ ====== ============ ======
30 LINKS Marketing Tactics Simulation
***************************************************************************** FIRM 5: ?????????????????????????????????????????????????? INDUSTRY MNO PRODUCT 5-1 P&L STATEMENT, MONTH 7 PAGE 4 ***************************************************************************** All Regions Region 1 Region 2 Region 3 (TOTAL ) ( Europe) ( U.S.A.) ( Pacific) ------------ ------------ ------------ ------------ Active? Yes Yes Yes Sales Volume 86,102 23,668 36,761 25,673 Price 262 240 250 300 Revenues 22,572,470 5,680,320 9,190,250 7,701,900 - Product Costs 12,613,942 3,467,362 5,385,486 3,761,094 - Order Processing 344,408 94,672 147,044 102,692 ------------ ------------ ------------ ------------ Gross Margin 9,614,120 2,118,286 3,657,720 3,838,114 Gross Margin % 42.6% 37.3% 39.8% 49.8% Fixed Costs: Administrative O/H 720,000 240,000 240,000 240,000 Forecast Inaccuracy 494,924 10,099 83,024 401,801 Marketing 1,598,073 363,143 609,168 625,762 Marketing Creative 0 0 0 0 Price Changes 102,429 26,400 35,575 40,454 Service Outsourcing 801,586 179,090 343,932 278,564 Total Fixed Costs 3,717,012 818,732 1,311,699 1,586,581 ------------ ------------ ------------ ------------ Operating Income 5,897,108 1,299,554 2,346,021 2,251,533 Operating Income % 26.1% 22.9% 25.5% 29.2% ============================================================================= Sales Volume Forecast 24,000 41,000 40,000 Product 5-1 Configuration: H551010 Marketing Program Marketing Spending: 363,143 609,168 625,762 Advertising Spending 72,628 121,833 312,881 Promotion Spending 217,885 274,125 187,728 Sales Force Spending 72,628 213,208 125,152 Marketing Mix Allocation 206020 204535 503020 Positioning 41 41 74 Promotional Program 19 34 62
For Your Information
The standard LINKS monthly reports include separate product P&L statements for each of your
products. In this sample display, only the report for product 1 is included.
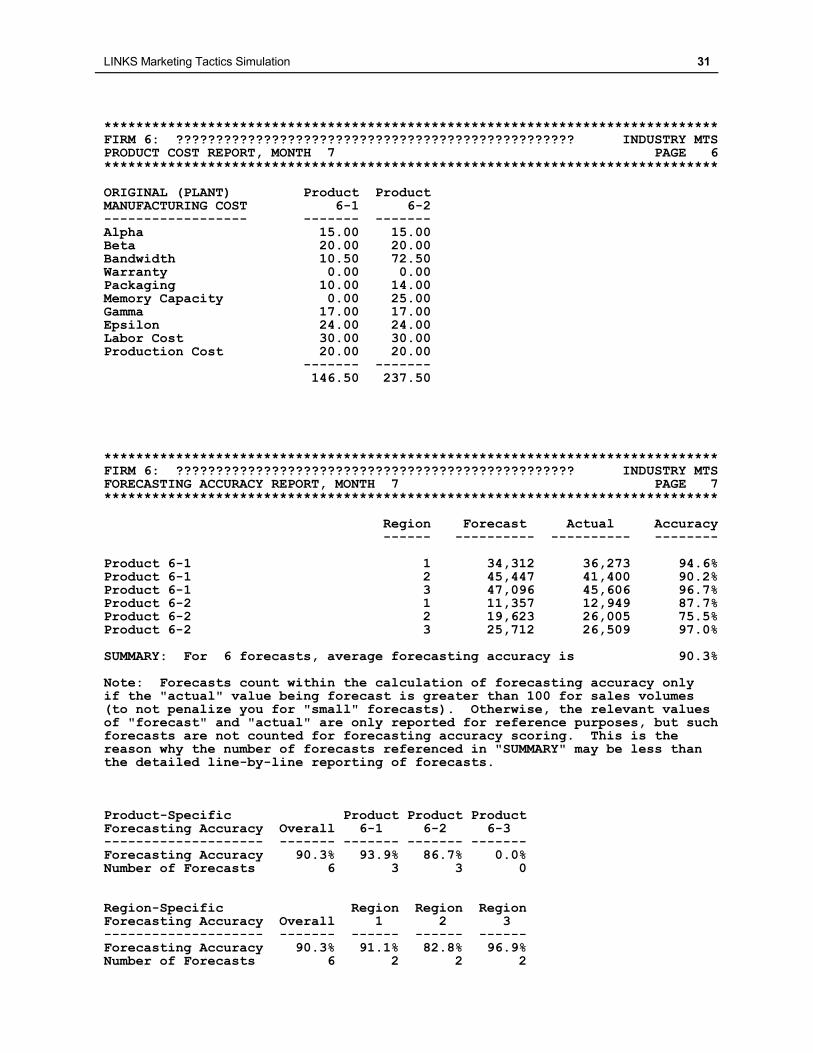
LINKS Marketing Tactics Simulation 31
***************************************************************************** FIRM 6: ?????????????????????????????????????????????????? INDUSTRY MTS PRODUCT COST REPORT, MONTH 7 PAGE 6 ***************************************************************************** ORIGINAL (PLANT) Product Product MANUFACTURING COST 6-1 6-2 ------------------ ------- ------- Alpha 15.00 15.00 Beta 20.00 20.00 Bandwidth 10.50 72.50 Warranty 0.00 0.00 Packaging 10.00 14.00 Memory Capacity 0.00 25.00 Gamma 17.00 17.00 Epsilon 24.00 24.00 Labor Cost 30.00 30.00 Production Cost 20.00 20.00 ------- ------- 146.50 237.50 ***************************************************************************** FIRM 6: ?????????????????????????????????????????????????? INDUSTRY MTS FORECASTING ACCURACY REPORT, MONTH 7 PAGE 7 ***************************************************************************** Region Forecast Actual Accuracy ------ ---------- ---------- -------- Product 6-1 1 34,312 36,273 94.6% Product 6-1 2 45,447 41,400 90.2% Product 6-1 3 47,096 45,606 96.7% Product 6-2 1 11,357 12,949 87.7% Product 6-2 2 19,623 26,005 75.5% Product 6-2 3 25,712 26,509 97.0% SUMMARY: For 6 forecasts, average forecasting accuracy is 90.3% Note: Forecasts count within the calculation of forecasting accuracy only if the "actual" value being forecast is greater than 100 for sales volumes (to not penalize you for "small" forecasts). Otherwise, the relevant values of "forecast" and "actual" are only reported for reference purposes, but such forecasts are not counted for forecasting accuracy scoring. This is the reason why the number of forecasts referenced in "SUMMARY" may be less than the detailed line-by-line reporting of forecasts. Product-Specific Product Product Product Forecasting Accuracy Overall 6-1 6-2 6-3 -------------------- ------- ------- ------- ------- Forecasting Accuracy 90.3% 93.9% 86.7% 0.0% Number of Forecasts 6 3 3 0 Region-Specific Region Region Region Forecasting Accuracy Overall 1 2 3 -------------------- ------- ------ ------ ------ Forecasting Accuracy 90.3% 91.1% 82.8% 96.9% Number of Forecasts 6 2 2 2
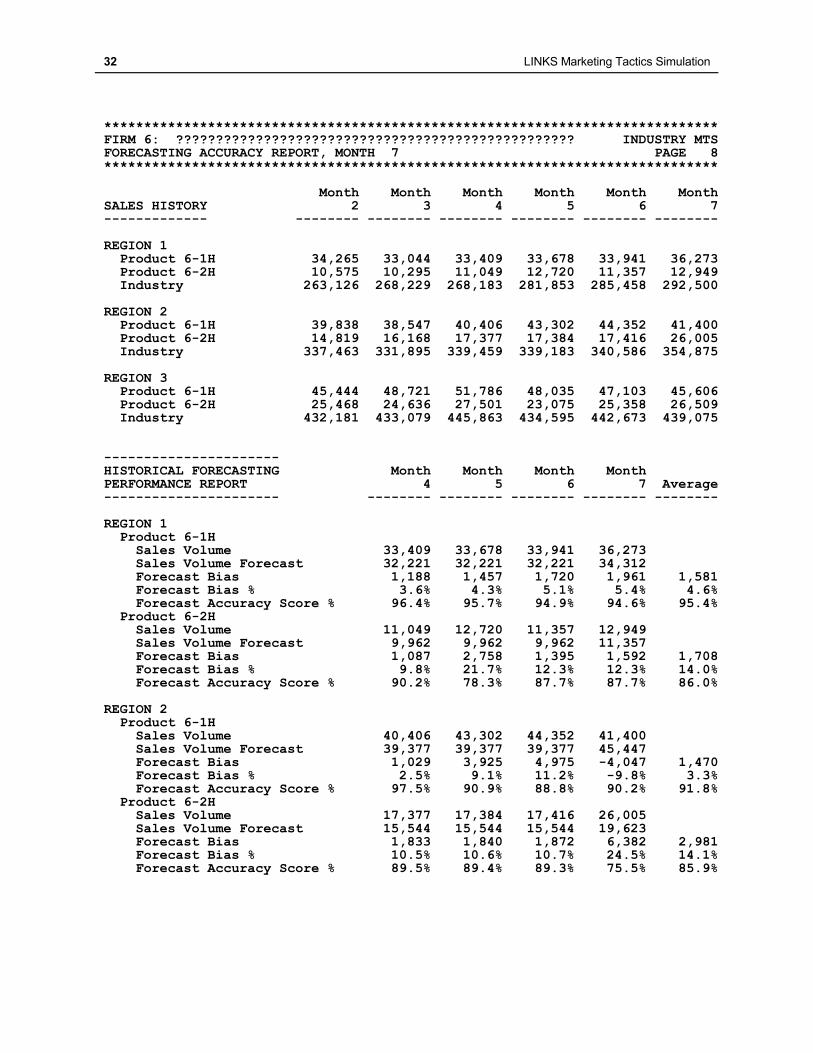
32 LINKS Marketing Tactics Simulation
***************************************************************************** FIRM 6: ?????????????????????????????????????????????????? INDUSTRY MTS FORECASTING ACCURACY REPORT, MONTH 7 PAGE 8 ***************************************************************************** Month Month Month Month Month Month SALES HISTORY 2 3 4 5 6 7 ------------- -------- -------- -------- -------- -------- -------- REGION 1 Product 6-1H 34,265 33,044 33,409 33,678 33,941 36,273 Product 6-2H 10,575 10,295 11,049 12,720 11,357 12,949 Industry 263,126 268,229 268,183 281,853 285,458 292,500 REGION 2 Product 6-1H 39,838 38,547 40,406 43,302 44,352 41,400 Product 6-2H 14,819 16,168 17,377 17,384 17,416 26,005 Industry 337,463 331,895 339,459 339,183 340,586 354,875 REGION 3 Product 6-1H 45,444 48,721 51,786 48,035 47,103 45,606 Product 6-2H 25,468 24,636 27,501 23,075 25,358 26,509 Industry 432,181 433,079 445,863 434,595 442,673 439,075 ---------------------- HISTORICAL FORECASTING Month Month Month Month PERFORMANCE REPORT 4 5 6 7 Average ---------------------- -------- -------- -------- -------- -------- REGION 1 Product 6-1H Sales Volume 33,409 33,678 33,941 36,273 Sales Volume Forecast 32,221 32,221 32,221 34,312 Forecast Bias 1,188 1,457 1,720 1,961 1,581 Forecast Bias % 3.6% 4.3% 5.1% 5.4% 4.6% Forecast Accuracy Score % 96.4% 95.7% 94.9% 94.6% 95.4% Product 6-2H Sales Volume 11,049 12,720 11,357 12,949 Sales Volume Forecast 9,962 9,962 9,962 11,357 Forecast Bias 1,087 2,758 1,395 1,592 1,708 Forecast Bias % 9.8% 21.7% 12.3% 12.3% 14.0% Forecast Accuracy Score % 90.2% 78.3% 87.7% 87.7% 86.0% REGION 2 Product 6-1H Sales Volume 40,406 43,302 44,352 41,400 Sales Volume Forecast 39,377 39,377 39,377 45,447 Forecast Bias 1,029 3,925 4,975 -4,047 1,470 Forecast Bias % 2.5% 9.1% 11.2% -9.8% 3.3% Forecast Accuracy Score % 97.5% 90.9% 88.8% 90.2% 91.8% Product 6-2H Sales Volume 17,377 17,384 17,416 26,005 Sales Volume Forecast 15,544 15,544 15,544 19,623 Forecast Bias 1,833 1,840 1,872 6,382 2,981 Forecast Bias % 10.5% 10.6% 10.7% 24.5% 14.1% Forecast Accuracy Score % 89.5% 89.4% 89.3% 75.5% 85.9%
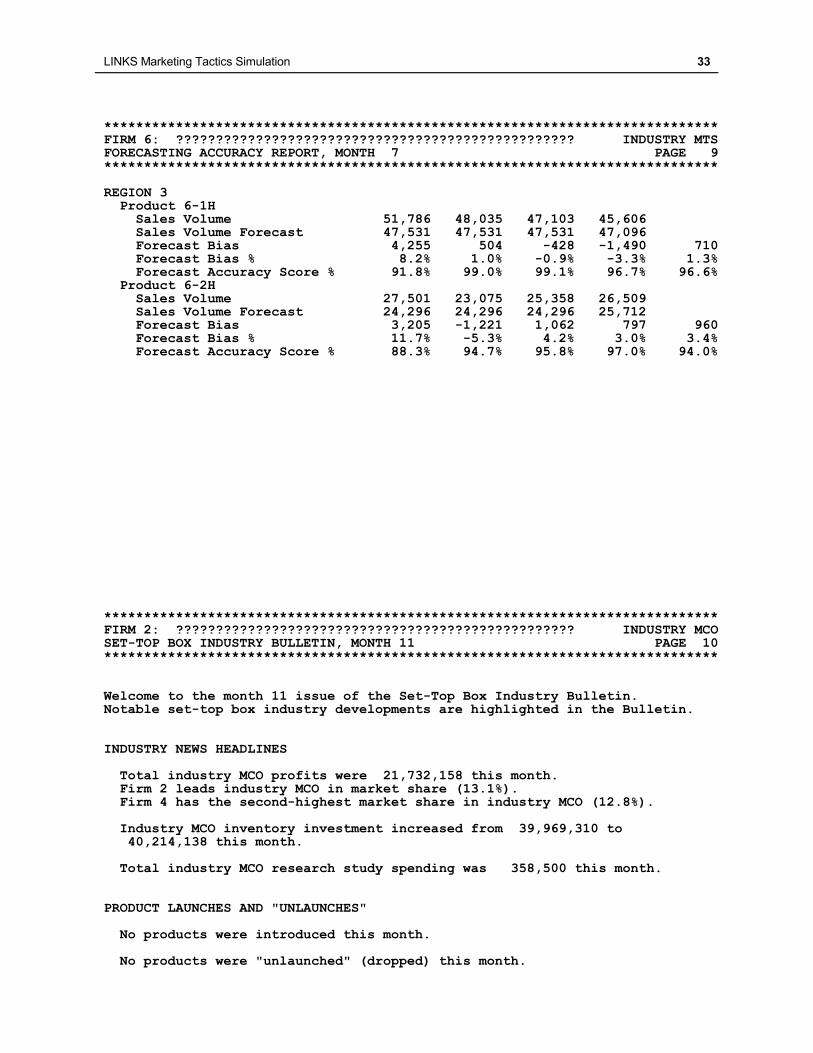
LINKS Marketing Tactics Simulation 33
***************************************************************************** FIRM 6: ?????????????????????????????????????????????????? INDUSTRY MTS FORECASTING ACCURACY REPORT, MONTH 7 PAGE 9 ***************************************************************************** REGION 3 Product 6-1H Sales Volume 51,786 48,035 47,103 45,606 Sales Volume Forecast 47,531 47,531 47,531 47,096 Forecast Bias 4,255 504 -428 -1,490 710 Forecast Bias % 8.2% 1.0% -0.9% -3.3% 1.3% Forecast Accuracy Score % 91.8% 99.0% 99.1% 96.7% 96.6% Product 6-2H Sales Volume 27,501 23,075 25,358 26,509 Sales Volume Forecast 24,296 24,296 24,296 25,712 Forecast Bias 3,205 -1,221 1,062 797 960 Forecast Bias % 11.7% -5.3% 4.2% 3.0% 3.4% Forecast Accuracy Score % 88.3% 94.7% 95.8% 97.0% 94.0% ***************************************************************************** FIRM 2: ?????????????????????????????????????????????????? INDUSTRY MCO SET-TOP BOX INDUSTRY BULLETIN, MONTH 11 PAGE 10 ***************************************************************************** Welcome to the month 11 issue of the Set-Top Box Industry Bulletin. Notable set-top box industry developments are highlighted in the Bulletin. INDUSTRY NEWS HEADLINES Total industry MCO profits were 21,732,158 this month. Firm 2 leads industry MCO in market share (13.1%). Firm 4 has the second-highest market share in industry MCO (12.8%). Industry MCO inventory investment increased from 39,969,310 to 40,214,138 this month. Total industry MCO research study spending was 358,500 this month. PRODUCT LAUNCHES AND "UNLAUNCHES" No products were introduced this month. No products were "unlaunched" (dropped) this month.
34 LINKS Marketing Tactics Simulation
Research Studies "Time spent in reconnaissance is seldom wasted." – Sun Tzu, 4BC
Each month of the LINKS Marketing Tactics Simulation, research studies requests are submitted
along with your other decision variable changes. Although LINKS research studies are ordered
prior to the beginning of the next month (i.e., this is “plan-ahead” research study decision making),
research studies are executed during and after the next month. Thus, research studies reports
always reflect the just-completed month's experience.
In the following research study descriptions, “Sample Output” displays illustrate the style and
formatting of LINKS research study output. These samples are only for illustrative purposes.
These “Sample Output” examples should not be viewed as providing any specific insight into your
particular set-top box industry.
Research Studies Strategy
Which research studies should you purchase? When should you purchase these research
studies? Two snappy but uninformative responses would be "purchase exactly the research
studies that you need and no others" and "it depends." Unfortunately, these responses are not
very constructive counsel. Heavy-duty anticipatory thinking is needed before deciding on
research study purchases.
Bruce Henderson, noted strategist, author, and management consultant, offers the following
insightful process-based suggestion for conducting research: "Define the problem and
hypothesize the approach to a solution intuitively before wasting time on data collection and
analysis. Do the first analysis lightly. Then, and only then, redefine the problem more rigorously
and reanalyze in depth. Don't go to the library and read all the books before you know what you
want to learn." The problem "reanalysis" stage is particularly relevant since that is where research
studies may play a role, once you have determined that the information provided in the research
may provide useful insight into the problem.
In thinking about research studies strategy and tactics, some generalizations are possible:
Excellent strategy, plans, and tactics can only be developed based on excellent analysis.
Since research provides the raw data for excellent analysis, research should be an important
component of your LINKS decision-making process. Do not relegate your research studies
pre-ordering decisions to the last five minutes of team meetings. Rather, treat research
studies ordering decisions as a fundamental part of your whole LINKS decision-making
process.
Plan ahead. To identify patterns and trends, you will probably need to order some research
studies on a more-or-less regular basis. A formal research studies plan should be a part of
your management planning process.
Systematize the post-analysis of research studies. This might involve, for example, the
continual updating of databases, charts, or graphs to reformat the raw LINKS research studies
results into more meaningful and useful forms.
Share insights derived from particular research studies with all of your team members. These
may require research studies' "experts" to assume coaching roles with research studies
LINKS Marketing Tactics Simulation 35
"novices." This is a natural state of affairs. Given the complexity of LINKS, it is not possible to
be an "expert" on everything.
Pre-Existing Research Study Resources
To assist your LINKS management team, two research studies have been sourced from reputable
marketing research vendors. Key results of these two research studies follow. Other on-going
research studies that you might wish to order as you manage your LINKS firm are described later
in this chapter.
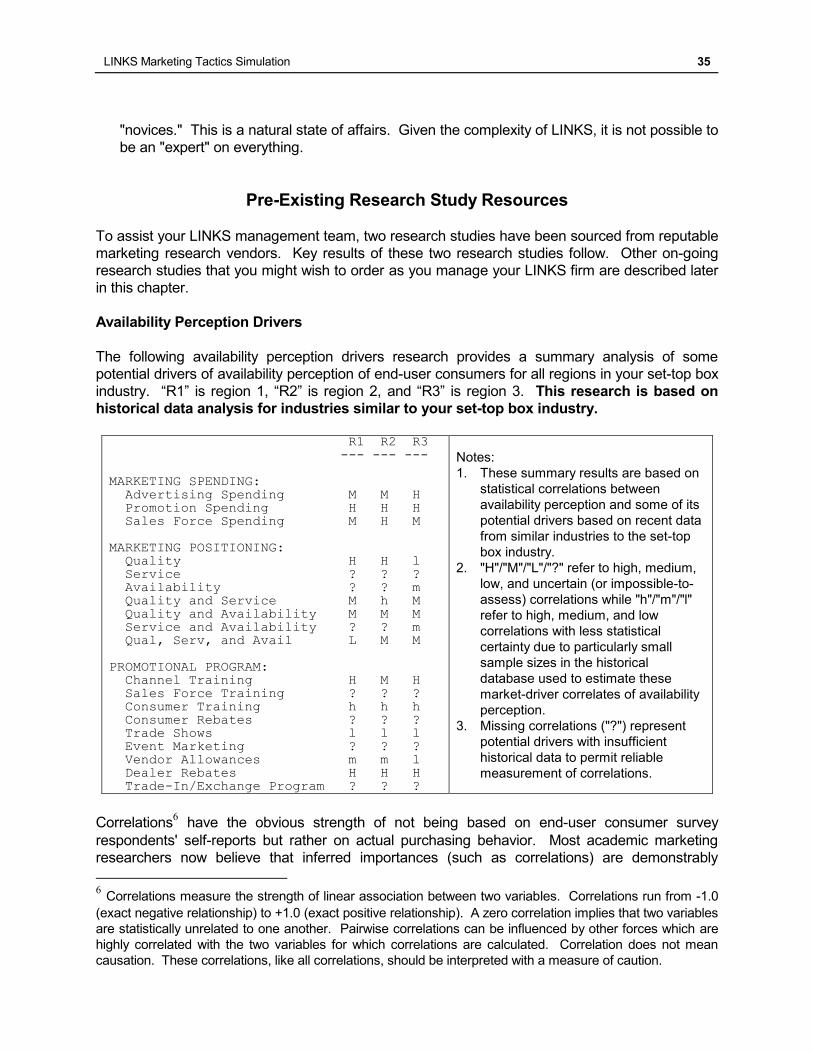
Availability Perception Drivers
The following availability perception drivers research provides a summary analysis of some
potential drivers of availability perception of end-user consumers for all regions in your set-top box
industry. “R1” is region 1, “R2” is region 2, and “R3” is region 3. This research is based on
historical data analysis for industries similar to your set-top box industry.
R1 R2 R3 --- --- --- MARKETING SPENDING: Advertising Spending M M H Promotion Spending H H H Sales Force Spending M H M MARKETING POSITIONING: Quality H H l
Service ? ? ? Availability ? ? m Quality and Service M h M Quality and Availability M M M Service and Availability ? ? m Qual, Serv, and Avail L M M PROMOTIONAL PROGRAM: Channel Training H M H Sales Force Training ? ? ? Consumer Training h h h Consumer Rebates ? ? ? Trade Shows l l l Event Marketing ? ? ? Vendor Allowances m m l Dealer Rebates H H H Trade-In/Exchange Program ? ? ?
Notes:
1. These summary results are based on
statistical correlations between
availability perception and some of its
potential drivers based on recent data
from similar industries to the set-top
box industry.
2. "H"/"M"/"L"/"?" refer to high, medium,
low, and uncertain (or impossible-to-
assess) correlations while "h"/"m"/"l"
refer to high, medium, and low
correlations with less statistical
certainty due to particularly small
sample sizes in the historical
database used to estimate these
market-driver correlates of availability
perception.
3. Missing correlations ("?") represent
potential drivers with insufficient
historical data to permit reliable
measurement of correlations.
Correlations6 have the obvious strength of not being based on end-user consumer survey
respondents' self-reports but rather on actual purchasing behavior. Most academic marketing
researchers now believe that inferred importances (such as correlations) are demonstrably
6 Correlations measure the strength of linear association between two variables. Correlations run from -1.0
(exact negative relationship) to +1.0 (exact positive relationship). A zero correlation implies that two variables
are statistically unrelated to one another. Pairwise correlations can be influenced by other forces which are
highly correlated with the two variables for which correlations are calculated. Correlation does not mean
causation. These correlations, like all correlations, should be interpreted with a measure of caution.
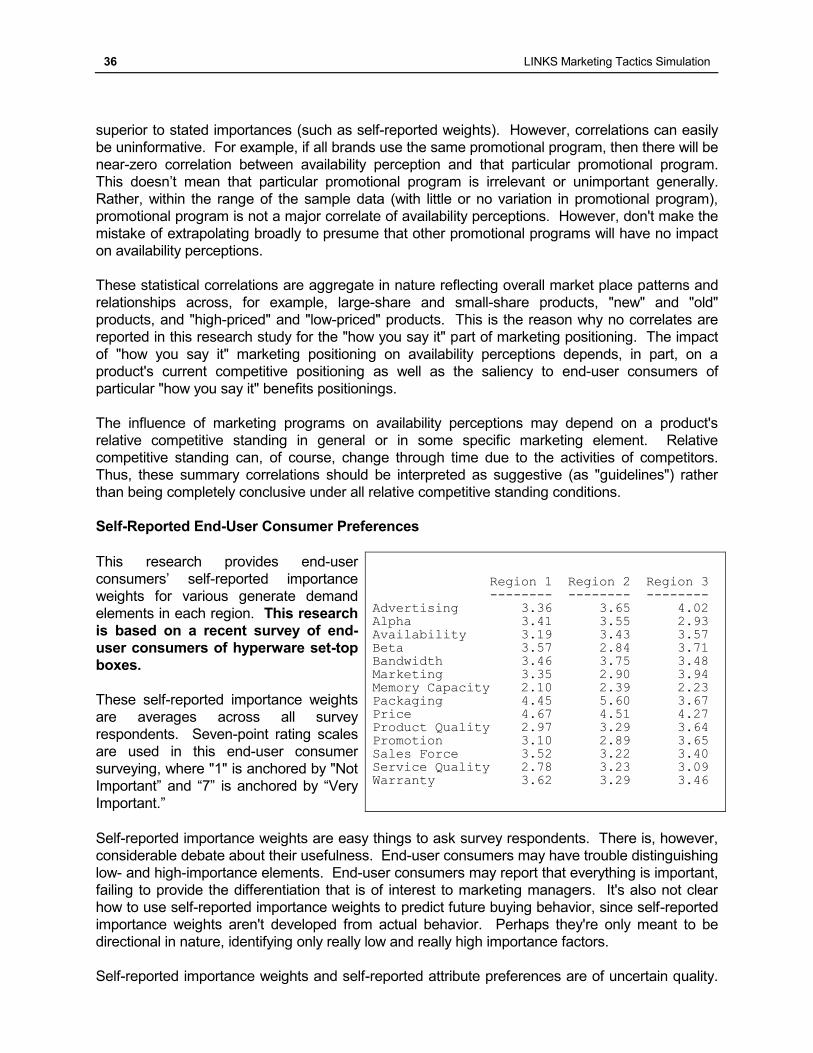
36 LINKS Marketing Tactics Simulation
superior to stated importances (such as self-reported weights). However, correlations can easily
be uninformative. For example, if all brands use the same promotional program, then there will be
near-zero correlation between availability perception and that particular promotional program.
This doesn’t mean that particular promotional program is irrelevant or unimportant generally.
Rather, within the range of the sample data (with little or no variation in promotional program),
promotional program is not a major correlate of availability perceptions. However, don't make the
mistake of extrapolating broadly to presume that other promotional programs will have no impact
on availability perceptions.
These statistical correlations are aggregate in nature reflecting overall market place patterns and
relationships across, for example, large-share and small-share products, "new" and "old"
products, and "high-priced" and "low-priced" products. This is the reason why no correlates are
reported in this research study for the "how you say it" part of marketing positioning. The impact
of "how you say it" marketing positioning on availability perceptions depends, in part, on a
product's current competitive positioning as well as the saliency to end-user consumers of
particular "how you say it" benefits positionings.
The influence of marketing programs on availability perceptions may depend on a product's
relative competitive standing in general or in some specific marketing element. Relative
competitive standing can, of course, change through time due to the activities of competitors.
Thus, these summary correlations should be interpreted as suggestive (as "guidelines") rather
than being completely conclusive under all relative competitive standing conditions.
Self-Reported End-User Consumer Preferences
This research provides end-user
consumers’ self-reported importance
weights for various generate demand
elements in each region. This research
is based on a recent survey of end-
user consumers of hyperware set-top
boxes.
These self-reported importance weights
are averages across all survey
respondents. Seven-point rating scales
are used in this end-user consumer
surveying, where "1" is anchored by "Not
Important” and “7” is anchored by “Very
Important.”
Region 1 Region 2 Region 3 -------- -------- -------- Advertising 3.36 3.65 4.02 Alpha 3.41 3.55 2.93 Availability 3.19 3.43 3.57 Beta 3.57 2.84 3.71 Bandwidth 3.46 3.75 3.48 Marketing 3.35 2.90 3.94 Memory Capacity 2.10 2.39 2.23 Packaging 4.45 5.60 3.67 Price 4.67 4.51 4.27 Product Quality 2.97 3.29 3.64 Promotion 3.10 2.89 3.65 Sales Force 3.52 3.22 3.40 Service Quality 2.78 3.23 3.09 Warranty 3.62 3.29 3.46
Self-reported importance weights are easy things to ask survey respondents. There is, however,
considerable debate about their usefulness. End-user consumers may have trouble distinguishing
low- and high-importance elements. End-user consumers may report that everything is important,
failing to provide the differentiation that is of interest to marketing managers. It's also not clear
how to use self-reported importance weights to predict future buying behavior, since self-reported
importance weights aren't developed from actual behavior. Perhaps they're only meant to be
directional in nature, identifying only really low and really high importance factors.
Self-reported importance weights and self-reported attribute preferences are of uncertain quality.
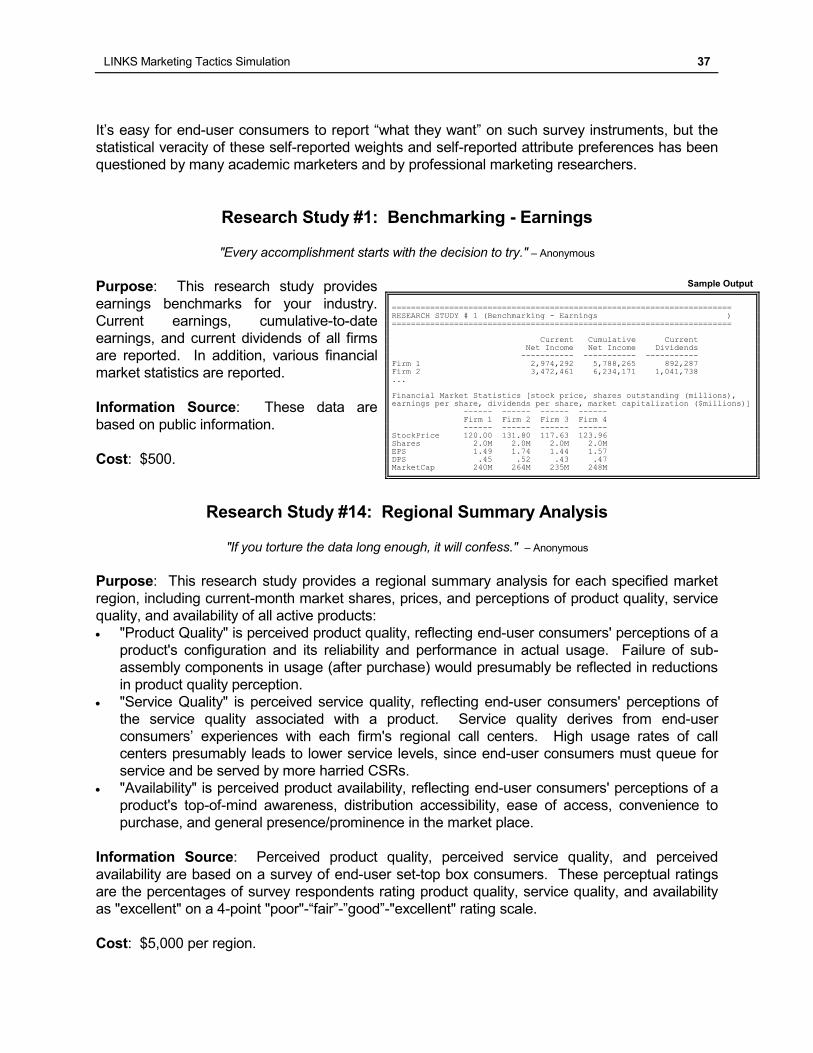
LINKS Marketing Tactics Simulation 37
It’s easy for end-user consumers to report “what they want” on such survey instruments, but the
statistical veracity of these self-reported weights and self-reported attribute preferences has been
questioned by many academic marketers and by professional marketing researchers.
Research Study #1: Benchmarking - Earnings
"Every accomplishment starts with the decision to try." – Anonymous
Purpose: This research study provides
earnings benchmarks for your industry.
Current earnings, cumulative-to-date
earnings, and current dividends of all firms
are reported. In addition, various financial
market statistics are reported.
Information Source: These data are
based on public information.
Cost: $500.
Research Study #14: Regional Summary Analysis
"If you torture the data long enough, it will confess." – Anonymous
Purpose: This research study provides a regional summary analysis for each specified market
region, including current-month market shares, prices, and perceptions of product quality, service
quality, and availability of all active products:
"Product Quality" is perceived product quality, reflecting end-user consumers' perceptions of a
product's configuration and its reliability and performance in actual usage. Failure of sub-
assembly components in usage (after purchase) would presumably be reflected in reductions
in product quality perception.
"Service Quality" is perceived service quality, reflecting end-user consumers' perceptions of
the service quality associated with a product. Service quality derives from end-user
consumers’ experiences with each firm's regional call centers. High usage rates of call
centers presumably leads to lower service levels, since end-user consumers must queue for
service and be served by more harried CSRs.
"Availability" is perceived product availability, reflecting end-user consumers' perceptions of a
product's top-of-mind awareness, distribution accessibility, ease of access, convenience to
purchase, and general presence/prominence in the market place.
Information Source: Perceived product quality, perceived service quality, and perceived
availability are based on a survey of end-user set-top box consumers. These perceptual ratings
are the percentages of survey respondents rating product quality, service quality, and availability
as "excellent" on a 4-point "poor"-“fair”-”good”-"excellent" rating scale.
Cost: $5,000 per region.
Sample Output
======================================================================= RESEARCH STUDY # 1 (Benchmarking - Earnings ) ======================================================================= Current Cumulative Current
Net Income Net Income Dividends ----------- ----------- ----------- Firm 1 2,974,292 5,788,265 892,287 Firm 2 3,472,461 6,234,171 1,041,738 ... Financial Market Statistics [stock price, shares outstanding (millions), earnings per share, dividends per share, market capitalization ($millions)] ------ ------ ------ ------ Firm 1 Firm 2 Firm 3 Firm 4 ------ ------ ------ ------ StockPrice 120.00 131.80 117.63 123.96 Shares 2.0M 2.0M 2.0M 2.0M EPS 1.49 1.74 1.44 1.57 DPS .45 .52 .43 .47 MarketCap 240M 264M 235M 248M
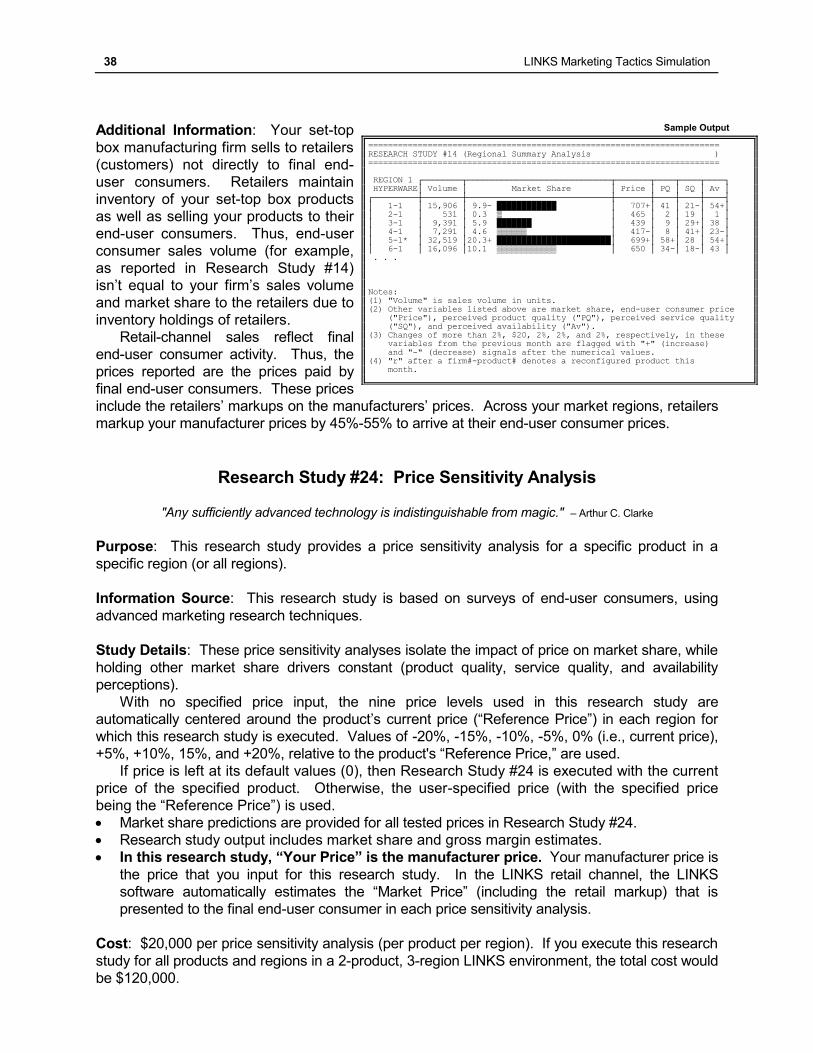
38 LINKS Marketing Tactics Simulation
Additional Information: Your set-top
box manufacturing firm sells to retailers
(customers) not directly to final end-
user consumers. Retailers maintain
inventory of your set-top box products
as well as selling your products to their
end-user consumers. Thus, end-user
consumer sales volume (for example,
as reported in Research Study #14)
isn’t equal to your firm’s sales volume
and market share to the retailers due to
inventory holdings of retailers.
Retail-channel sales reflect final
end-user consumer activity. Thus, the
prices reported are the prices paid by
final end-user consumers. These prices
include the retailers’ markups on the manufacturers’ prices. Across your market regions, retailers
markup your manufacturer prices by 45%-55% to arrive at their end-user consumer prices.
Research Study #24: Price Sensitivity Analysis "Any sufficiently advanced technology is indistinguishable from magic." – Arthur C. Clarke
Purpose: This research study provides a price sensitivity analysis for a specific product in a
specific region (or all regions).
Information Source: This research study is based on surveys of end-user consumers, using
advanced marketing research techniques.
Study Details: These price sensitivity analyses isolate the impact of price on market share, while
holding other market share drivers constant (product quality, service quality, and availability
perceptions).
With no specified price input, the nine price levels used in this research study are
automatically centered around the product’s current price (“Reference Price”) in each region for
which this research study is executed. Values of -20%, -15%, -10%, -5%, 0% (i.e., current price),
+5%, +10%, 15%, and +20%, relative to the product's “Reference Price,” are used.
If price is left at its default values (0), then Research Study #24 is executed with the current
price of the specified product. Otherwise, the user-specified price (with the specified price
being the “Reference Price”) is used.
Market share predictions are provided for all tested prices in Research Study #24.
Research study output includes market share and gross margin estimates.
In this research study, “Your Price” is the manufacturer price. Your manufacturer price is
the price that you input for this research study. In the LINKS retail channel, the LINKS
software automatically estimates the “Market Price” (including the retail markup) that is
presented to the final end-user consumer in each price sensitivity analysis.
Cost: $20,000 per price sensitivity analysis (per product per region). If you execute this research
study for all products and regions in a 2-product, 3-region LINKS environment, the total cost would
be $120,000.
Sample Output
======================================================================= RESEARCH STUDY #14 (Regional Summary Analysis ) ======================================================================= REGION 1 ┌────────┬─────────────────────────────┬───────┬────┬────┬────┐ HYPERWARE│ Volume │ Market Share │ Price │ PQ │ SQ │ Av │ ┌─────────┼────────┼─────────────────────────────┼───────┼────┼────┼────┤ │ 1-1 │ 15,906 │ 9.9- ████████████ │ 707+│ 41 │ 21-│ 54+│ │ 2-1 │ 531 │ 0.3 ▒ │ 465 │ 2 │ 19 │ 1 │ │ 3-1 │ 9,391 │ 5.9 ███████ │ 439 │ 9 │ 29+│ 38 │ │ 4-1 │ 7,291 │ 4.6 ▒▒▒▒▒▒ │ 417-│ 8 │ 41+│ 23-│ │ 5-1* │ 32,519 │20.3+ ███████████████████████│ 699+│ 58+│ 28 │ 54+│ │ 6-1 │ 16,096 │10.1 ▒▒▒▒▒▒▒▒▒▒▒▒ │ 650 │ 34-│ 18-│ 43 │ . . . Notes: (1) "Volume" is sales volume in units. (2) Other variables listed above are market share, end-user consumer price ("Price"), perceived product quality ("PQ"), perceived service quality ("SQ"), and perceived availability ("Av"). (3) Changes of more than 2%, $20, 2%, 2%, and 2%, respectively, in these
variables from the previous month are flagged with "+" (increase) and "-" (decrease) signals after the numerical values. (4) "r" after a firm#-product# denotes a reconfigured product this month.
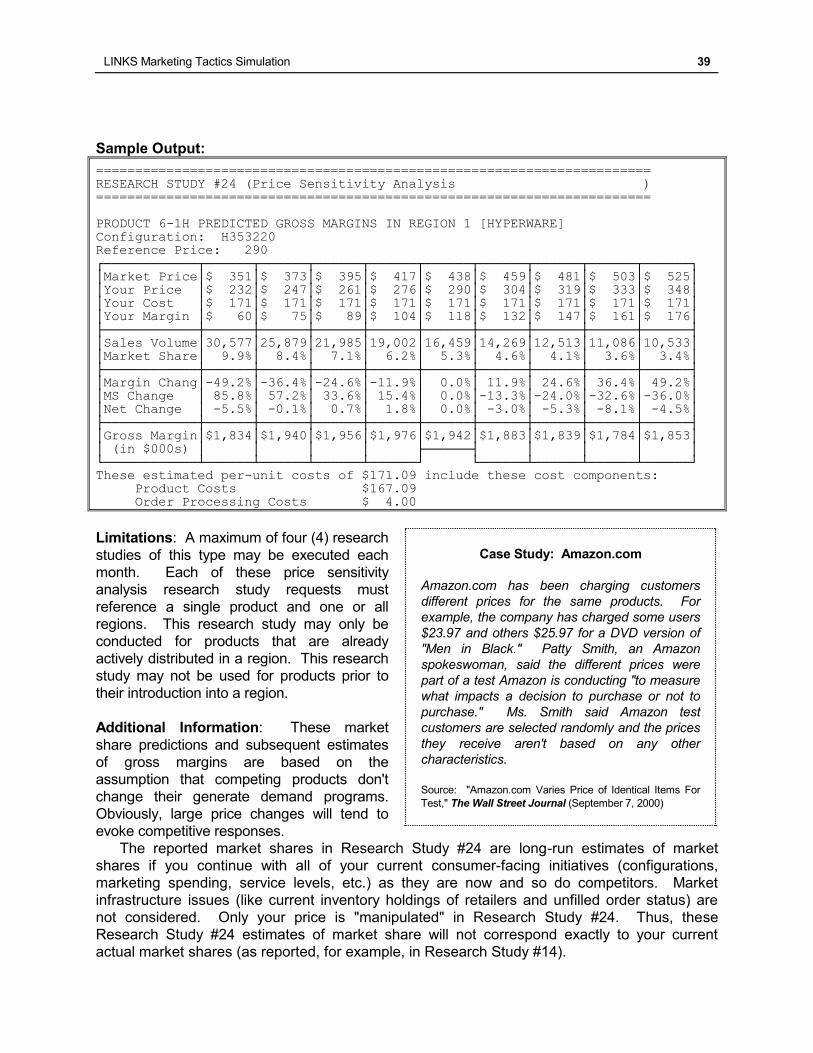
LINKS Marketing Tactics Simulation 39
Sample Output:
======================================================================= RESEARCH STUDY #24 (Price Sensitivity Analysis ) ======================================================================= PRODUCT 6-1H PREDICTED GROSS MARGINS IN REGION 1 [HYPERWARE] Configuration: H353220 Reference Price: 290 ┌────────────┬──────┬──────┬──────┬──────┬──────┬──────┬──────┬──────┬──────┐ │Market Price│$ 351│$ 373│$ 395│$ 417│$ 438│$ 459│$ 481│$ 503│$ 525│ │Your Price │$ 232│$ 247│$ 261│$ 276│$ 290│$ 304│$ 319│$ 333│$ 348│ │Your Cost │$ 171│$ 171│$ 171│$ 171│$ 171│$ 171│$ 171│$ 171│$ 171│ │Your Margin │$ 60│$ 75│$ 89│$ 104│$ 118│$ 132│$ 147│$ 161│$ 176│ ├────────────┼──────┼──────┼──────┼──────┼──────┼──────┼──────┼──────┼──────┤
│Sales Volume│30,577│25,879│21,985│19,002│16,459│14,269│12,513│11,086│10,533│ │Market Share│ 9.9%│ 8.4%│ 7.1%│ 6.2%│ 5.3%│ 4.6%│ 4.1%│ 3.6%│ 3.4%│ ├────────────┼──────┼──────┼──────┼──────┼──────┼──────┼──────┼──────┼──────┤ │Margin Chang│-49.2%│-36.4%│-24.6%│-11.9%│ 0.0%│ 11.9%│ 24.6%│ 36.4%│ 49.2%│ │MS Change │ 85.8%│ 57.2%│ 33.6%│ 15.4%│ 0.0%│-13.3%│-24.0%│-32.6%│-36.0%│ │Net Change │ -5.5%│ -0.1%│ 0.7%│ 1.8%│ 0.0%│ -3.0%│ -5.3%│ -8.1%│ -4.5%│ ├────────────┼──────┼──────┼──────┼──────┼──────┼──────┼──────┼──────┼──────┤ │Gross Margin│$1,834│$1,940│$1,956│$1,976│$1,942│$1,883│$1,839│$1,784│$1,853│ │ (in $000s) │ │ │ │ ├──────┤ │ │ │ │ └────────────┴──────┴──────┴──────┴──────┘ └──────┴──────┴──────┴──────┘ These estimated per-unit costs of $171.09 include these cost components: Product Costs $167.09 Order Processing Costs $ 4.00
Limitations: A maximum of four (4) research
studies of this type may be executed each
month. Each of these price sensitivity
analysis research study requests must
reference a single product and one or all
regions. This research study may only be
conducted for products that are already
actively distributed in a region. This research
study may not be used for products prior to
their introduction into a region.
Additional Information: These market
share predictions and subsequent estimates
of gross margins are based on the
assumption that competing products don't
change their generate demand programs.
Obviously, large price changes will tend to
evoke competitive responses.
The reported market shares in Research Study #24 are long-run estimates of market
shares if you continue with all of your current consumer-facing initiatives (configurations,
marketing spending, service levels, etc.) as they are now and so do competitors. Market
infrastructure issues (like current inventory holdings of retailers and unfilled order status) are
not considered. Only your price is "manipulated" in Research Study #24. Thus, these
Research Study #24 estimates of market share will not correspond exactly to your current
actual market shares (as reported, for example, in Research Study #14).
Case Study: Amazon.com
Amazon.com has been charging customers
different prices for the same products. For
example, the company has charged some users
$23.97 and others $25.97 for a DVD version of
"Men in Black." Patty Smith, an Amazon
spokeswoman, said the different prices were
part of a test Amazon is conducting "to measure
what impacts a decision to purchase or not to
purchase." Ms. Smith said Amazon test
customers are selected randomly and the prices
they receive aren't based on any other
characteristics.
Source: "Amazon.com Varies Price of Identical Items For
Test," The Wall Street Journal (September 7, 2000)
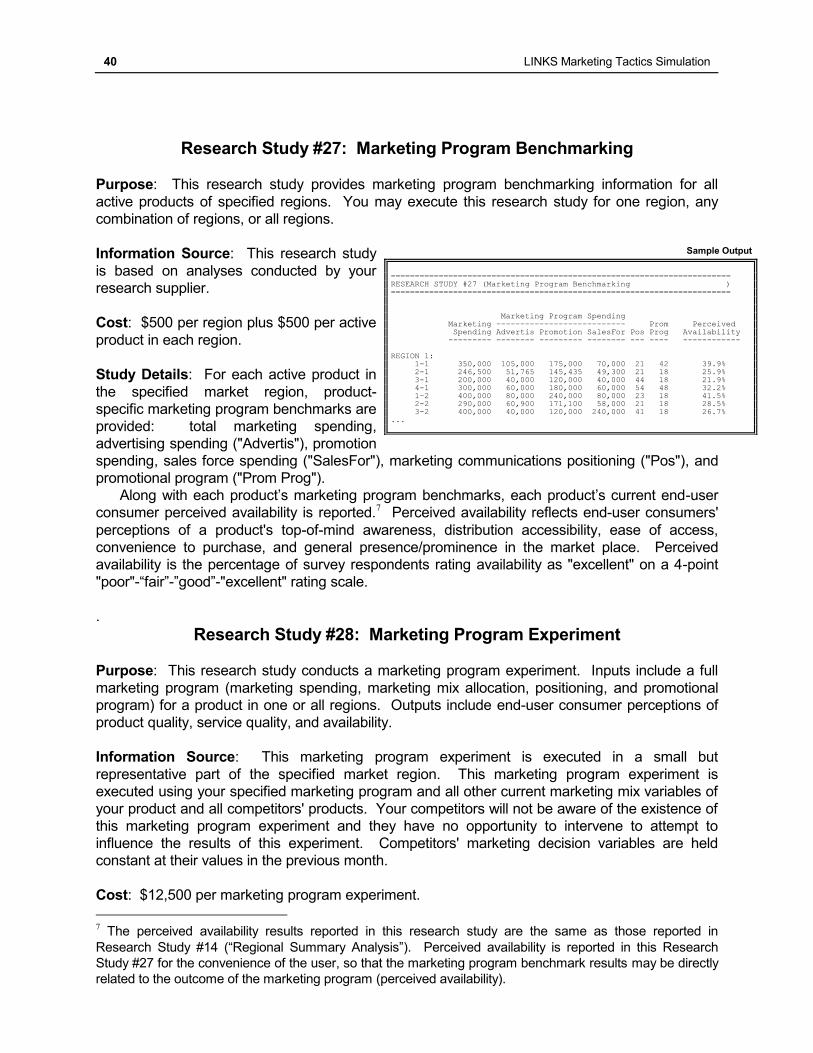
40 LINKS Marketing Tactics Simulation
Research Study #27: Marketing Program Benchmarking
Purpose: This research study provides marketing program benchmarking information for all
active products of specified regions. You may execute this research study for one region, any
combination of regions, or all regions.
Information Source: This research study
is based on analyses conducted by your
research supplier.
Cost: $500 per region plus $500 per active
product in each region.
Study Details: For each active product in
the specified market region, product-
specific marketing program benchmarks are
provided: total marketing spending,
advertising spending ("Advertis"), promotion
spending, sales force spending ("SalesFor"), marketing communications positioning ("Pos"), and
promotional program ("Prom Prog").
Along with each product’s marketing program benchmarks, each product’s current end-user
consumer perceived availability is reported.7 Perceived availability reflects end-user consumers'
perceptions of a product's top-of-mind awareness, distribution accessibility, ease of access,
convenience to purchase, and general presence/prominence in the market place. Perceived
availability is the percentage of survey respondents rating availability as "excellent" on a 4-point
"poor"-“fair”-”good”-"excellent" rating scale.
.
Research Study #28: Marketing Program Experiment
Purpose: This research study conducts a marketing program experiment. Inputs include a full
marketing program (marketing spending, marketing mix allocation, positioning, and promotional
program) for a product in one or all regions. Outputs include end-user consumer perceptions of
product quality, service quality, and availability.
Information Source: This marketing program experiment is executed in a small but
representative part of the specified market region. This marketing program experiment is
executed using your specified marketing program and all other current marketing mix variables of
your product and all competitors' products. Your competitors will not be aware of the existence of
this marketing program experiment and they have no opportunity to intervene to attempt to
influence the results of this experiment. Competitors' marketing decision variables are held
constant at their values in the previous month.
Cost: $12,500 per marketing program experiment.
7 The perceived availability results reported in this research study are the same as those reported in
Research Study #14 (“Regional Summary Analysis”). Perceived availability is reported in this Research
Study #27 for the convenience of the user, so that the marketing program benchmark results may be directly
related to the outcome of the marketing program (perceived availability).
Sample Output
======================================================================= RESEARCH STUDY #27 (Marketing Program Benchmarking ) ======================================================================= Marketing Program Spending Marketing --------------------------- Prom Perceived Spending Advertis Promotion SalesFor Pos Prog Availability --------- -------- --------- -------- --- ---- ------------
REGION 1: 1-1 350,000 105,000 175,000 70,000 21 42 39.9% 2-1 246,500 51,765 145,435 49,300 21 18 25.9% 3-1 200,000 40,000 120,000 40,000 44 18 21.9% 4-1 300,000 60,000 180,000 60,000 54 48 32.2% 1-2 400,000 80,000 240,000 80,000 23 18 41.5% 2-2 290,000 60,900 171,100 58,000 21 18 28.5% 3-2 400,000 40,000 120,000 240,000 41 18 26.7% ...
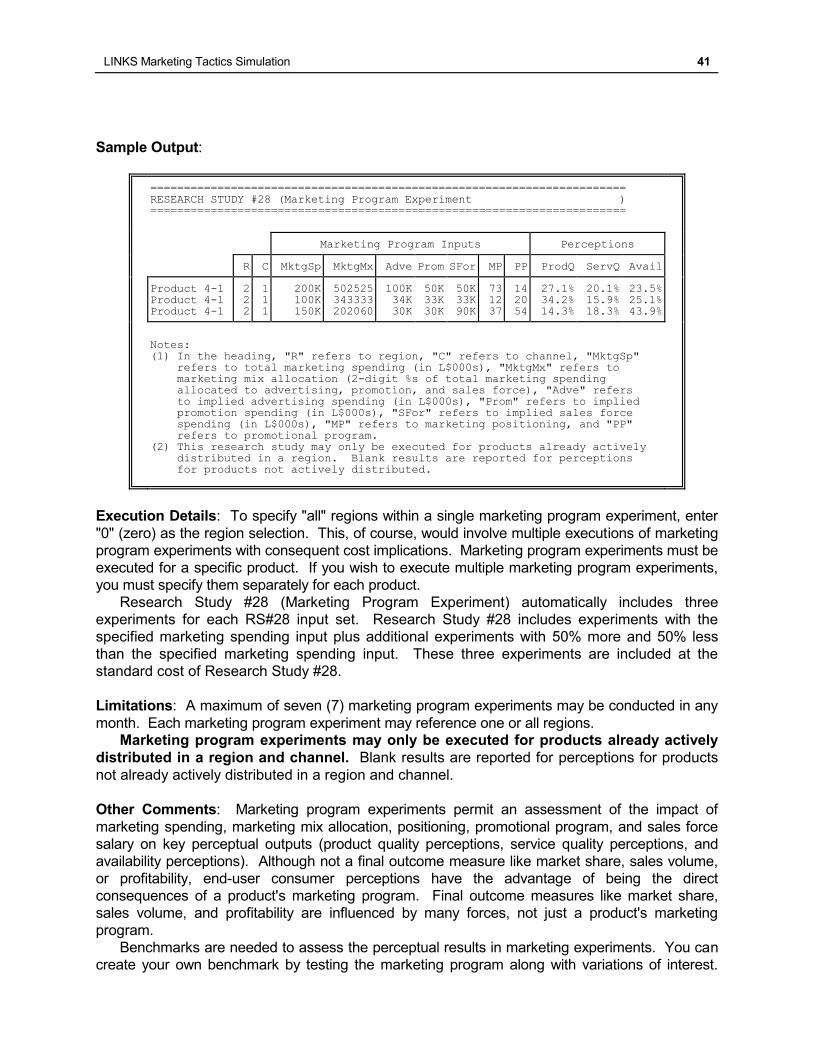
LINKS Marketing Tactics Simulation 41
Sample Output:
======================================================================= RESEARCH STUDY #28 (Marketing Program Experiment ) =======================================================================
Marketing Program Inputs Perceptions
R C MktgSp MktgMx Adve Prom SFor MP PP ProdQ ServQ Avail
Product 4-1 Product 4-1 Product 4-1
2 2 2
1 1 1
200K 100K 150K
502525 343333 202060
100K 34K 30K
50K 33K 30K
50K 33K 90K
73 12 37
14 20 54
27.1% 34.2% 14.3%
20.1% 15.9% 18.3%
23.5% 25.1% 43.9%
Notes: (1) In the heading, "R" refers to region, "C" refers to channel, "MktgSp" refers to total marketing spending (in L$000s), "MktgMx" refers to marketing mix allocation (2-digit %s of total marketing spending allocated to advertising, promotion, and sales force), "Adve" refers to implied advertising spending (in L$000s), "Prom" refers to implied promotion spending (in L$000s), "SFor" refers to implied sales force spending (in L$000s), "MP" refers to marketing positioning, and "PP" refers to promotional program. (2) This research study may only be executed for products already actively distributed in a region. Blank results are reported for perceptions for products not actively distributed.
Execution Details: To specify "all" regions within a single marketing program experiment, enter
"0" (zero) as the region selection. This, of course, would involve multiple executions of marketing
program experiments with consequent cost implications. Marketing program experiments must be
executed for a specific product. If you wish to execute multiple marketing program experiments,
you must specify them separately for each product.
Research Study #28 (Marketing Program Experiment) automatically includes three
experiments for each RS#28 input set. Research Study #28 includes experiments with the
specified marketing spending input plus additional experiments with 50% more and 50% less
than the specified marketing spending input. These three experiments are included at the
standard cost of Research Study #28.
Limitations: A maximum of seven (7) marketing program experiments may be conducted in any
month. Each marketing program experiment may reference one or all regions. Marketing program experiments may only be executed for products already actively
distributed in a region and channel. Blank results are reported for perceptions for products
not already actively distributed in a region and channel.
Other Comments: Marketing program experiments permit an assessment of the impact of
marketing spending, marketing mix allocation, positioning, promotional program, and sales force
salary on key perceptual outputs (product quality perceptions, service quality perceptions, and
availability perceptions). Although not a final outcome measure like market share, sales volume,
or profitability, end-user consumer perceptions have the advantage of being the direct
consequences of a product's marketing program. Final outcome measures like market share,
sales volume, and profitability are influenced by many forces, not just a product's marketing
program.
Benchmarks are needed to assess the perceptual results in marketing experiments. You can
create your own benchmark by testing the marketing program along with variations of interest.
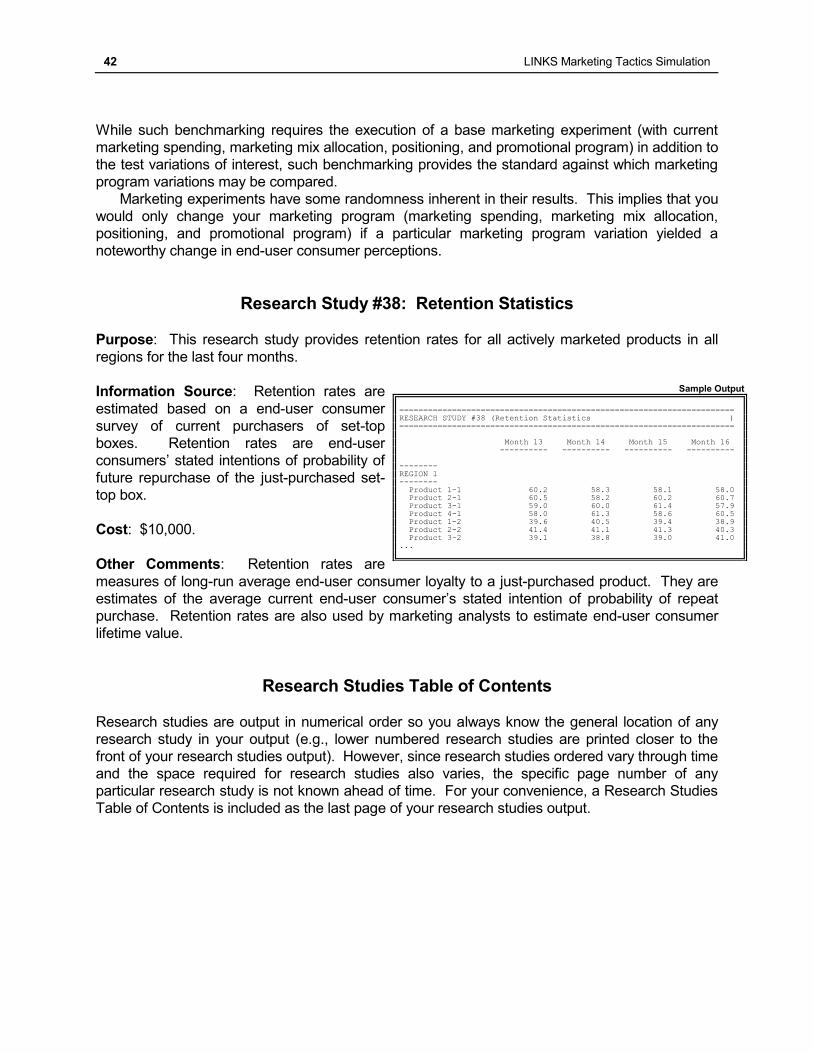
42 LINKS Marketing Tactics Simulation
While such benchmarking requires the execution of a base marketing experiment (with current
marketing spending, marketing mix allocation, positioning, and promotional program) in addition to
the test variations of interest, such benchmarking provides the standard against which marketing
program variations may be compared.
Marketing experiments have some randomness inherent in their results. This implies that you
would only change your marketing program (marketing spending, marketing mix allocation,
positioning, and promotional program) if a particular marketing program variation yielded a
noteworthy change in end-user consumer perceptions.
Research Study #38: Retention Statistics
Purpose: This research study provides retention rates for all actively marketed products in all
regions for the last four months.
Information Source: Retention rates are
estimated based on a end-user consumer
survey of current purchasers of set-top
boxes. Retention rates are end-user
consumers’ stated intentions of probability of
future repurchase of the just-purchased set-
top box.
Cost: $10,000.
Other Comments: Retention rates are
measures of long-run average end-user consumer loyalty to a just-purchased product. They are
estimates of the average current end-user consumer’s stated intention of probability of repeat
purchase. Retention rates are also used by marketing analysts to estimate end-user consumer
lifetime value.
Research Studies Table of Contents
Research studies are output in numerical order so you always know the general location of any
research study in your output (e.g., lower numbered research studies are printed closer to the
front of your research studies output). However, since research studies ordered vary through time
and the space required for research studies also varies, the specific page number of any
particular research study is not known ahead of time. For your convenience, a Research Studies
Table of Contents is included as the last page of your research studies output.
Sample Output
====================================================================== RESEARCH STUDY #38 (Retention Statistics ) ====================================================================== Month 13 Month 14 Month 15 Month 16 ---------- ---------- ---------- ---------- -------- REGION 1 -------- Product 1-1 60.2 58.3 58.1 58.0 Product 2-1 60.5 58.2 60.2 60.7 Product 3-1 59.0 60.0 61.4 57.9 Product 4-1 58.0 61.3 58.6 60.5 Product 1-2 39.6 40.5 39.4 38.9 Product 2-2 41.4 41.1 41.3 40.3 Product 3-2 39.1 38.8 39.0 41.0 ...

LINKS Marketing Tactics Simulation 43
Decision Forms
"The secret of getting ahead is getting started. The secret of getting
started is breaking your complex, overwhelming tasks into small
manageable tasks, and then starting on the first one." – Mark Twain
Use the LINKS decision forms on the following three pages during your team deliberations to
record your decisions in each month of the LINKS Marketing Tactics Simulation. Then, input
these decisions into LINKS via the LINKS web-server.
With the exception of research studies orders (which must be made every month), all LINKS
decisions are standing orders. (i.e., permanent until explicitly changed). You only need to enter
decision changes. If you are satisfied with a current decision, there is no need to change it.
You are responsible for your own LINKS input. Here's advice from a past participant:
"Never ask just one person to input the data. The volume of input data is so extensive that
even the most dependable individual will make mistakes. Our team president was
responsible for data entry, but we always had one additional person verify the inputs.
Even with this verification process, we still made input errors."
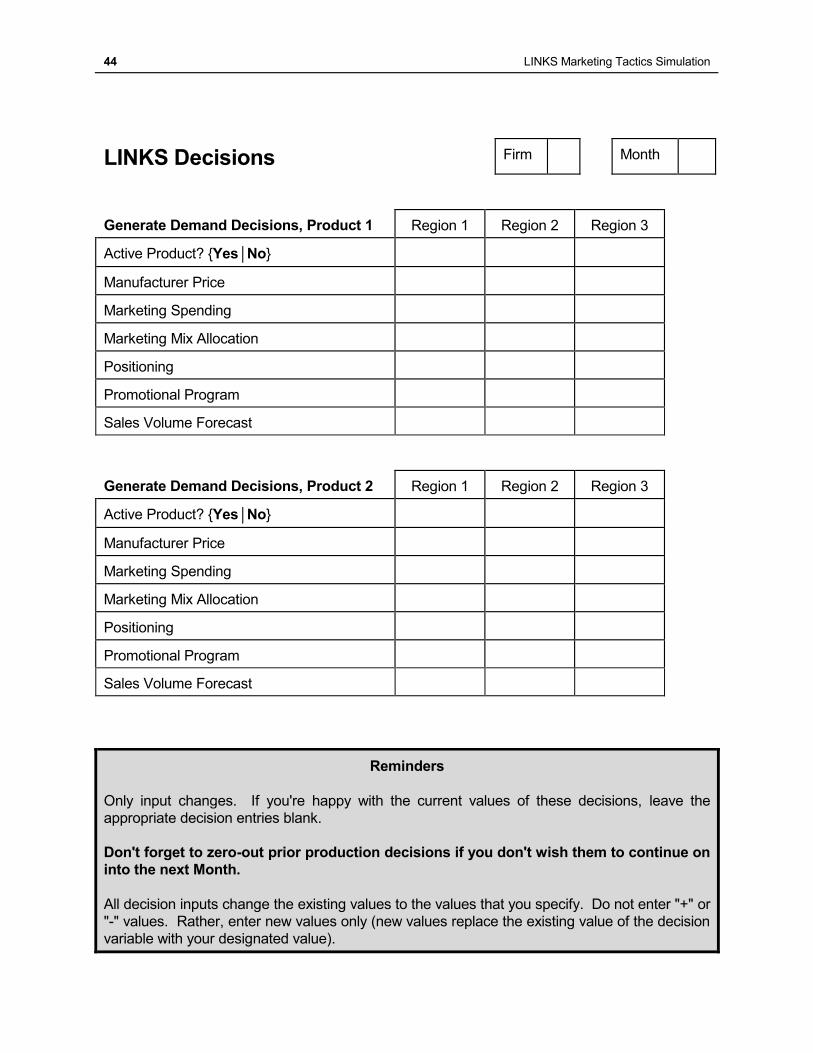
44 LINKS Marketing Tactics Simulation
LINKS Decisions Firm Month
Generate Demand Decisions, Product 1 Region 1 Region 2 Region 3
Active Product? {Yes│No}
Manufacturer Price
Marketing Spending
Marketing Mix Allocation
Positioning
Promotional Program
Sales Volume Forecast
Generate Demand Decisions, Product 2 Region 1 Region 2 Region 3
Active Product? {Yes│No}
Manufacturer Price
Marketing Spending
Marketing Mix Allocation
Positioning
Promotional Program
Sales Volume Forecast
Reminders
Only input changes. If you're happy with the current values of these decisions, leave the
appropriate decision entries blank.
Don't forget to zero-out prior production decisions if you don't wish them to continue on
into the next Month.
All decision inputs change the existing values to the values that you specify. Do not enter "+" or
"-" values. Rather, enter new values only (new values replace the existing value of the decision
variable with your designated value).
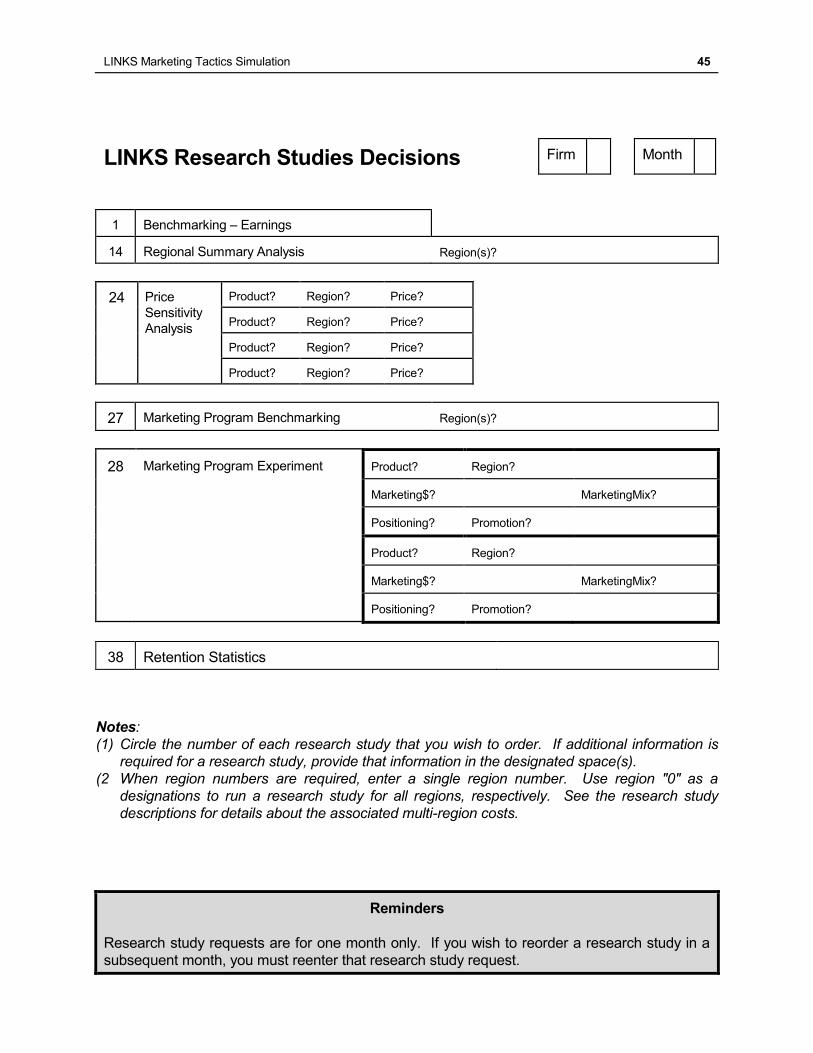
LINKS Marketing Tactics Simulation 45
LINKS Research Studies Decisions Firm Month
1 Benchmarking – Earnings
14 Regional Summary Analysis Region(s)?
24 Price
Sensitivity
Analysis
Product? Region? Price?
Product? Region? Price?
Product? Region? Price?
Product? Region? Price?
27 Marketing Program Benchmarking Region(s)?
28 Marketing Program Experiment Product? Region?
Marketing$? MarketingMix?
Positioning? Promotion?
Product? Region?
Marketing$? MarketingMix?
Positioning? Promotion?
38 Retention Statistics
Notes:
(1) Circle the number of each research study that you wish to order. If additional information is
required for a research study, provide that information in the designated space(s).
(2 When region numbers are required, enter a single region number. Use region "0" as a
designations to run a research study for all regions, respectively. See the research study
descriptions for details about the associated multi-region costs.
Reminders
Research study requests are for one month only. If you wish to reorder a research study in a
subsequent month, you must reenter that research study request.
46 LINKS Marketing Tactics Simulation
Performance Evaluation "If you're riding ahead of the herd, take a look back every now
and then to make sure it's still there." – Cowboy philosophy
Profitability measures obviously matter in assessing the long-run performance of a business.
However, "other things" are leading indicators of future profitability and root causes of profitability.
As you’ll note from the details that follow, current performance and change in performance are
considered in the LINKS multi-dimensional performance evaluation scorecard.
The LINKS scorecard is perhaps described more aptly as a boardroom-level scorecard. It
focuses on top-line boardroom kinds of financial, operational, and “customer” (end-user
consumer) performance measures and sub-measures. The LINKS scorecard includes the
measures and weights described in Exhibits 5-7. Each firm in your set-top box industry submits
their raw data to the Set-Top Box Trade Association, which provides your firm's personal
scorecard every month.
The LINKS scorecard is based on a ranking of performance on each sub-measure. These
rank-order comparisons across all competing firms within your industry avoid the undue
influence of particularly extreme values of individual sub-measures. This LINKS scorecard is a
within-industry performance evaluation system. Comparisons across industries are problematic
due to variations in environmental and competitive milieu.
Your firm receives weighted points for each competitor for whom your performance on a sub-
measure is better. For example, if your firm's ratio of "Net Profits" to "Revenues" is better than
three other firms' ratios, your firm receives 9 points. (Of course, the top-performing firm on "Net
Income" to "Revenues" ratio in a 6-firm industry would receive 15 points.) In general, the
maximum available points on any sub-measure are W*(N-1) where "W" is the sub-measure's
weight and "N" is the number of firms in the industry. Points accumulate each month throughout
the LINKS exercise.
To avoid an overemphasis on minor month-to-month variations in the calculation of the ranking of
firms on the performance sub-measures in the LINKS scorecard, minor differences in the sub-
measures are treated as ties in the calculation of ranking points. The thresholds for differences to
be treated as meaningful are listed in Exhibits 5-7 for each sub-measure. For example,
differences of 0.2% or less for "Ratio of Net Income to Revenues" are considered to be
statistically insignificant, and firms within 0.2% of each other would be treated as being tied.
Thus, two firms with ratios of Net Income to Revenues of 4.5% and 4.6% would be treated as
being tied in the calculation of ranking position and associated points received in any month.
You receive the LINKS scorecard automatically each month as the first page of your financial
and operating reports. This scorecard provides comparatives to assess how your firm's data
compares to the industry averages, lows, and highs on every KPI.
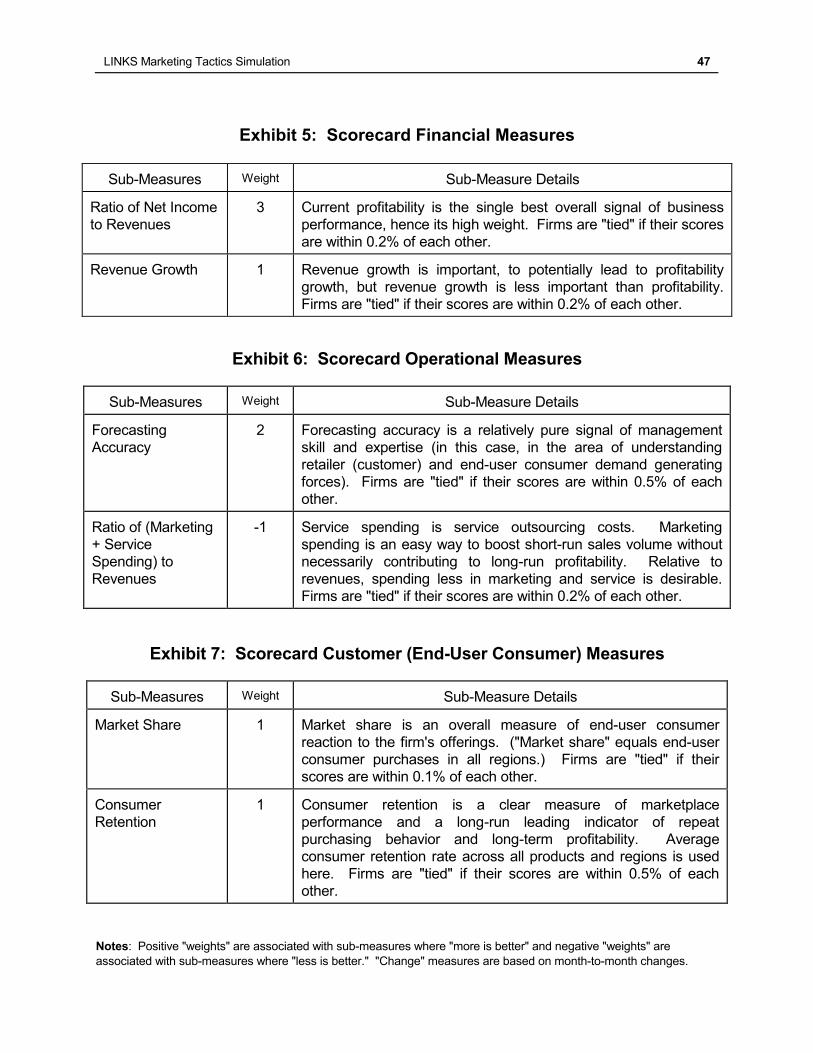
LINKS Marketing Tactics Simulation 47
Exhibit 5: Scorecard Financial Measures
Sub-Measures Weight Sub-Measure Details
Ratio of Net Income
to Revenues
3 Current profitability is the single best overall signal of business
performance, hence its high weight. Firms are "tied" if their scores
are within 0.2% of each other.
Revenue Growth 1 Revenue growth is important, to potentially lead to profitability
growth, but revenue growth is less important than profitability.
Firms are "tied" if their scores are within 0.2% of each other.
Exhibit 6: Scorecard Operational Measures
Sub-Measures Weight Sub-Measure Details
Forecasting
Accuracy
2 Forecasting accuracy is a relatively pure signal of management
skill and expertise (in this case, in the area of understanding
retailer (customer) and end-user consumer demand generating
forces). Firms are "tied" if their scores are within 0.5% of each
other.
Ratio of (Marketing
+ Service
Spending) to
Revenues
-1 Service spending is service outsourcing costs. Marketing
spending is an easy way to boost short-run sales volume without
necessarily contributing to long-run profitability. Relative to
revenues, spending less in marketing and service is desirable.
Firms are "tied" if their scores are within 0.2% of each other.
Exhibit 7: Scorecard Customer (End-User Consumer) Measures
Sub-Measures Weight Sub-Measure Details
Market Share 1 Market share is an overall measure of end-user consumer
reaction to the firm's offerings. ("Market share" equals end-user
consumer purchases in all regions.) Firms are "tied" if their
scores are within 0.1% of each other.
Consumer
Retention
1 Consumer retention is a clear measure of marketplace
performance and a long-run leading indicator of repeat
purchasing behavior and long-term profitability. Average
consumer retention rate across all products and regions is used
here. Firms are "tied" if their scores are within 0.5% of each
other.
Notes: Positive "weights" are associated with sub-measures where "more is better" and negative "weights" are
associated with sub-measures where "less is better." "Change" measures are based on month-to-month changes.
48 LINKS Marketing Tactics Simulation
Appendix: Web-Based LINKS Access
LINKS has no software to download/upload/install. Point your favorite web browser at the LINKS
Simulations website to interact with LINKS
http://www.LINKS-simulations.com
and then access the LINKS Simulation Database using your firm’s case-sensitive passcode. You'll be e-mailed your LINKS firm's passcode just before your LINKS event begins.
LINKS uses e-mail to communicate with all LINKS participants. Please ensure that your
preferred e-mail software is configured to receive e-mail messages from domains ending with:
@ChapmanRG.com @LINKS-simulations.com @LINKS-simulations.info
Your may wish to consult your personal information technology advisor to ensure that your e-
mail software is configured appropriately to receive LINKS e-mail from these domains.
While the LINKS Simulation Database works with all web browsers, Microsoft’s Internet Explorer
is recommended. LINKS website access requires a Java-enabled browser.
Output Retrieval After a LINKS Round: You'll be advised via e-mail when LINKS game-run
results are available on the LINKS Simulations website. Links within the LINKS Simulation
Database permit you to access your Word doc and Excel results after a game run.
Inputs For the Next LINKS Round: When you're ready to input decisions for the next LINKS
round, access the LINKS Simulation Database and make your input changes. o While any number of members of a LINKS firm may access the LINKS Simulation
Database simultaneously to “browse,” only one team member at a time can input
new decisions. If multiple members of a LINKS firm attempt to make inputs
simultaneously, problems can arise; all decision inputs might not be saved successfully on
the LINKS server with simultaneous inputs from multiple members of a LINKS firm.
o You may make some inputs now and others later. Only your final LINKS inputs at the input
submission deadline for your LINKS industry are included in the next LINKS round.
o Within the LINKS Simulation Database, current decision values are displayed on the input
screens. You only need to make changes. All LINKS decision variables are "standing
orders" and remain in effect until changed. However, you must input specific instructions
each LINKS round for ordering research studies. Otherwise, research studies will be
executed only once since "standing orders" don't exist for research studies.
o Inputs are checked for input integrity, including upper and lower bounds on permissible
numeric inputs. Invalid entries result in an error message reporting valid minimums and
maximums. And, informative messages are reported at the bottom of each web screen.
Save Input Changes on a LINKS input
web screen before moving to another input
screen in the LINKS Simulation Database.
Review reminder, warning, and
error messages reported at the bottom of the regenerated web screen after the inputs
are processed by the LINKS web server.
LINKS Marketing Tactics Simulation 49
Decision Inputs Audit: To provide
decision inputs auditing support, the
LINKS Simulation Database includes
a Decision Inputs Audit.
Accessible on the initial login and Exit web screens in the LINKS Simulation Database,
the Decision Inputs Audit checks a firm’s current decision inputs for potential problems
and inconsistencies. This LINKS Simulation Database audit function is not an audit of
the individual quality of each decision input (e.g., there’s no attempt to assess whether a
price of $345 is good or bad). But, possible problems are flagged for attention. For
example, forecasts that haven’t been changed since the last decision round are noted in
the audit display because forecasts are normally updated every decision round.
Accessing LINKS Results Files Via a Browser on a Public Computer: Web browsers leave
“tracks” to previously accessed web-pages in browser history files. If you access LINKS results
files on a public computer (e.g., in a public PC lab), others could access your results too via the
browser history.
Instructions for cleaning the cache in Internet Explorer follow. Other web browsers have
similar browser-cache cleaning protocols.
If you access LINKS results files on a public computer, follow these steps to clear
Internet Explorer’s browser history (cache):
1. Exit/close Internet Explorer after accessing your LINKS results file.
2. Re-start Internet Explorer.
a. Click on “Tools” and then “Internet Options.”
b. On the “Internet Options” screen, look for the “Browsing History” sub-section. Check
“Delete browsing history on exit” (it may already be checked).
c. Click the “Delete” button in the “Browsing History” sub-section.
d. Check the “History” box on the “Delete Browsing History” screen (it may already be
check).
e. Click the “Delete” button at the bottom of the “Delete Browsing History” screen.
f. Wait until the “Internet Options” screen re-appears.
g. Click the “OK” button.
3. Exit/close Internet Explorer.
These steps clear the browsing history from Internet Explorer on any computer and preserve
the security and privacy of your LINKS results files.


![Towards Modeling and Analysis of Power Consumption … simulations and analysis of power-conscious self-adaptation tactics [PLL14] on an architectural level. Power consumption properties](https://img.pdfslide.us/doc/110x75/5aae83c47f8b9a25088c5dc9/towards-modeling-and-analysis-of-power-consumption-simulations-and-analysis.jpg)
![LINKS Marketing Tactics SimulationLINKS Marketing Tactics Simulation [Unilever Edition] 9 Product Configurations and Product Costs Your firm’s hyperware set-top box products are](https://img.pdfslide.us/doc/110x75/5ec0199da0b4ef161c7d01a5/links-marketing-tactics-links-marketing-tactics-simulation-unilever-edition-9.jpg)