Embed Size (px)
Citation preview
Digital Pattern Simulations
Pattern Simulations
Pattern SimulationsWhat?
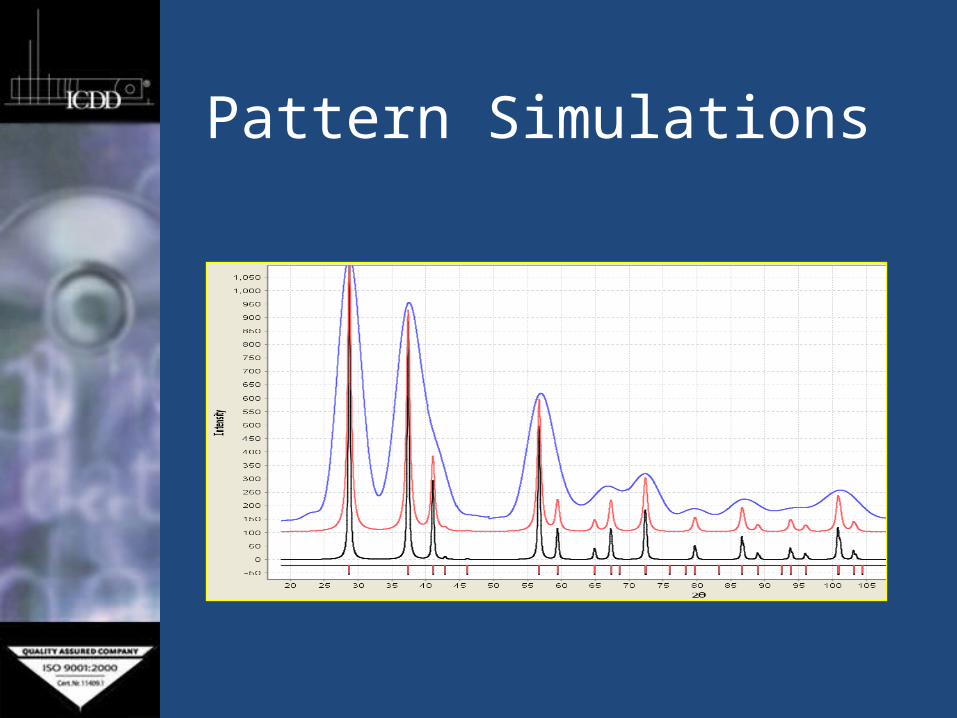
Digital powder patterns can be calculated for all entries in the Powder Diffraction File.
Multiple patterns can be plotted to simulate experimental data.
Pattern SimulationsWhy?
Digital pattern calculations can be varied to account for instrumental and experimental conditions normally present in a diffraction experiment.
By using digital patterns, reference data can be adjusted to more closely simulate experimental data for either phase identification or quantitative analysis.
Pattern SimulationsHow?
The Powder Diffraction File (PDF) contains 3 basic types of data. Therefore, the simulations use 3 different algorithms to calculate a digital pattern from each type. In the PDF, the software automatically elects the appropriate algorithm based on the information available from the entry data.
Each algorithm can be adjusted for common experimental and instrumental factors.
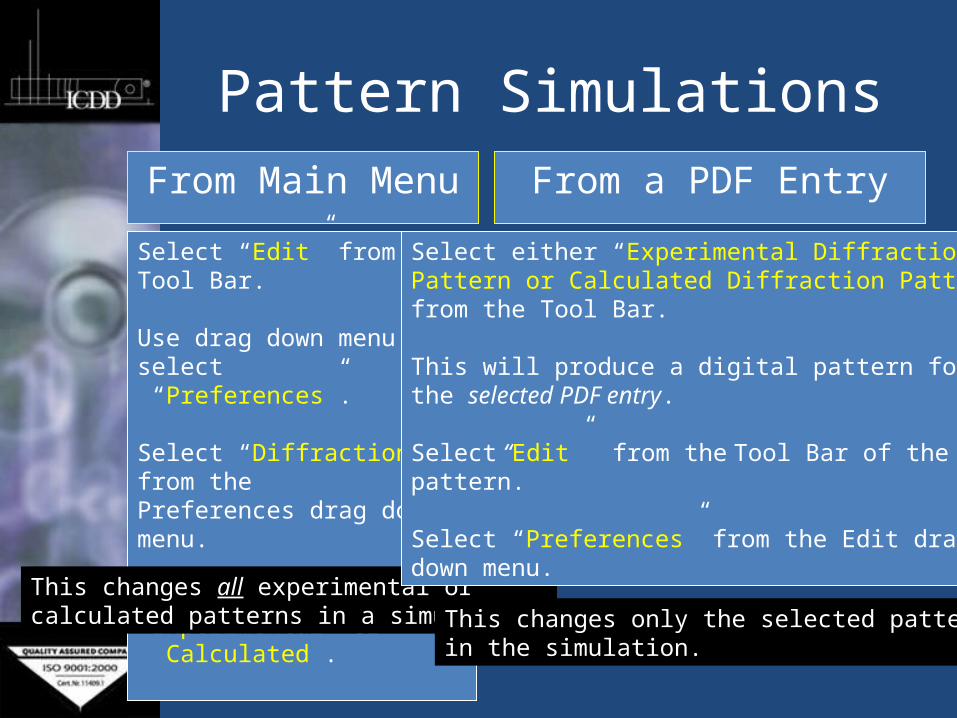
Pattern SimulationsFrom Main Menu From a PDF Entry
Select “Edit” from the Tool Bar.
Use drag down menu to select “Preferences”.
Select “Diffraction” from the Preferences drag down menu.
Select either “Experimental” or Calculated”.
This changes all experimental orcalculated patterns in a simulation.
Select either “Experimental DiffractionPattern or Calculated Diffraction Pattern”from the Tool Bar.
This will produce a digital pattern for the selected PDF entry.
Select “Edit” from the Tool Bar of the pattern.
Select “Preferences” from the Edit drag down menu.
This changes only the selected patternin the simulation.
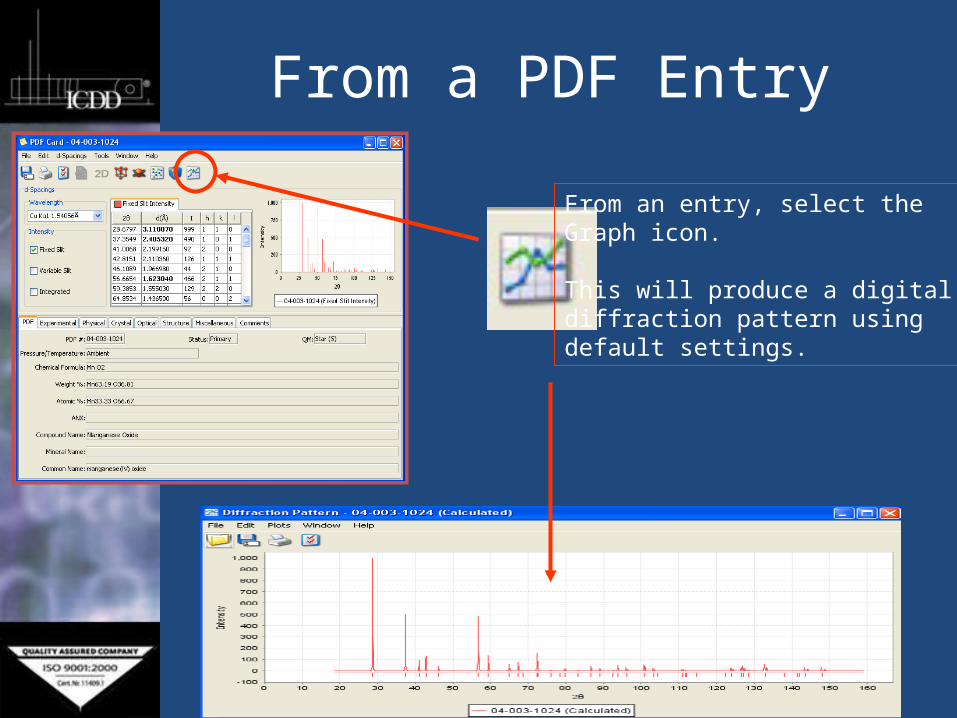
From a PDF Entry
From an entry, select theGraph icon.
This will produce a digitaldiffraction pattern usingdefault settings.
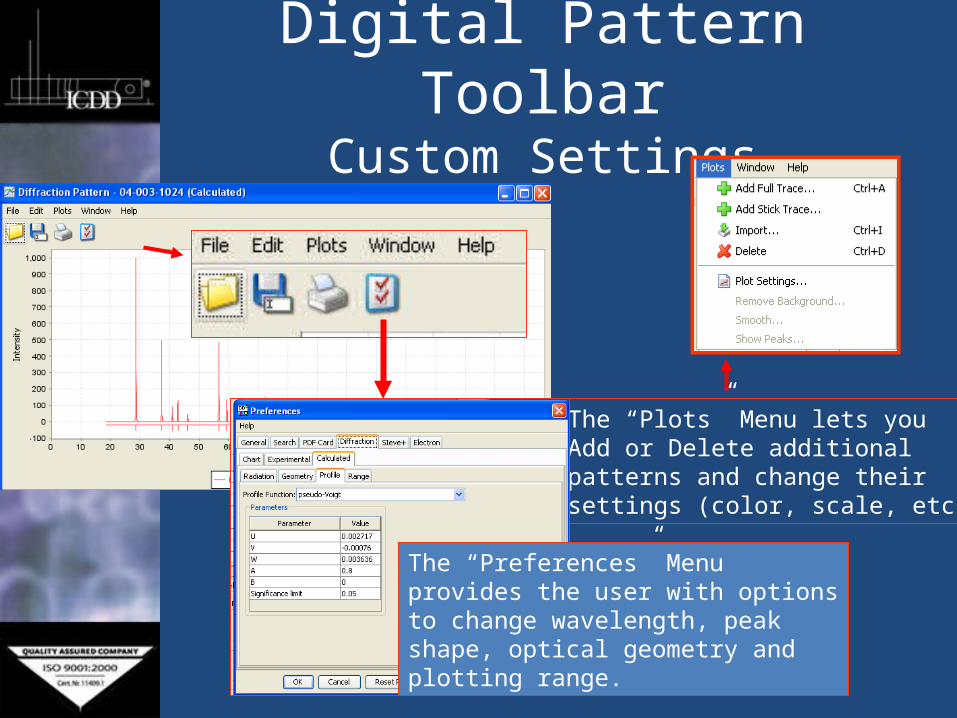
Digital Pattern ToolbarCustom Settings
The “Plots” Menu lets youAdd or Delete additional patterns and change theirsettings (color, scale, etc.).
The “Preferences” Menuprovides the user with optionsto change wavelength, peakshape, optical geometry andplotting range.
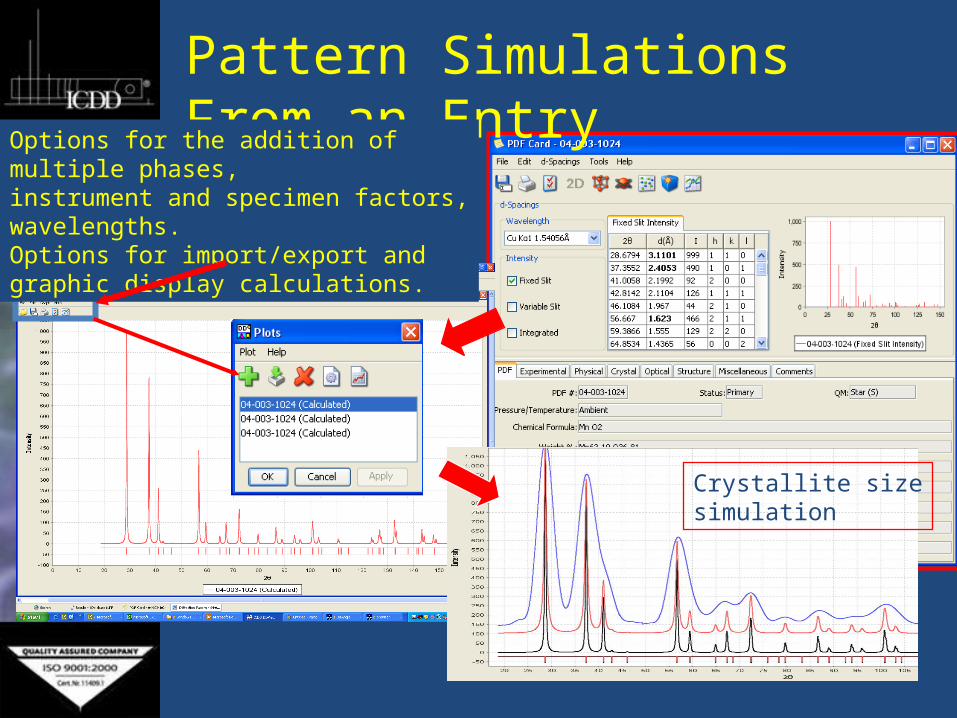
Pattern Simulations From an Entry
Options for the addition of multiple phases,instrument and specimen factors, wavelengths.Options for import/export and graphic display calculations.
Crystallite sizesimulation
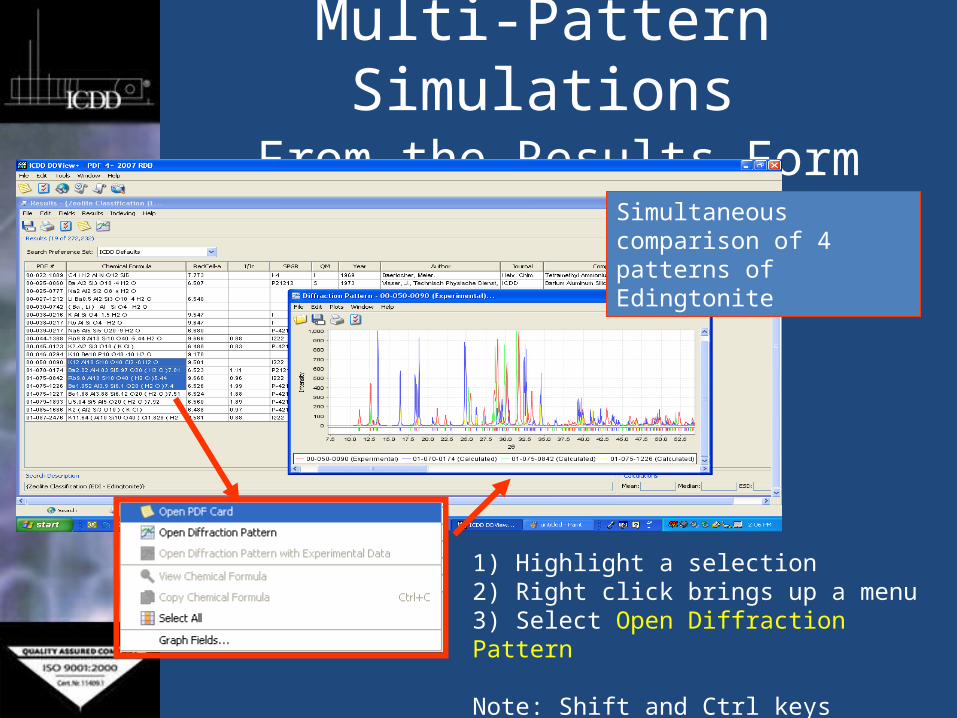
Multi-Pattern Simulations From the Results Form
1) Highlight a selection2) Right click brings up a menu3) Select Open Diffraction Pattern
Note: Shift and Ctrl keys highlight selections
Simultaneous comparison of 4 patterns of Edingtonite
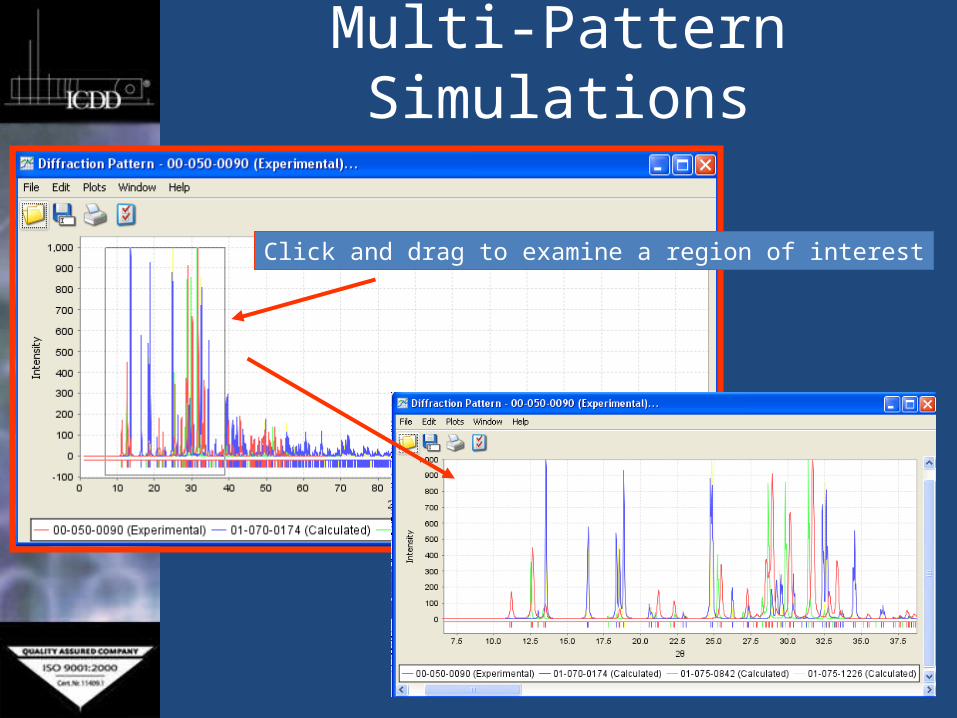
Multi-Pattern Simulations
Click and drag to examine a region of interest
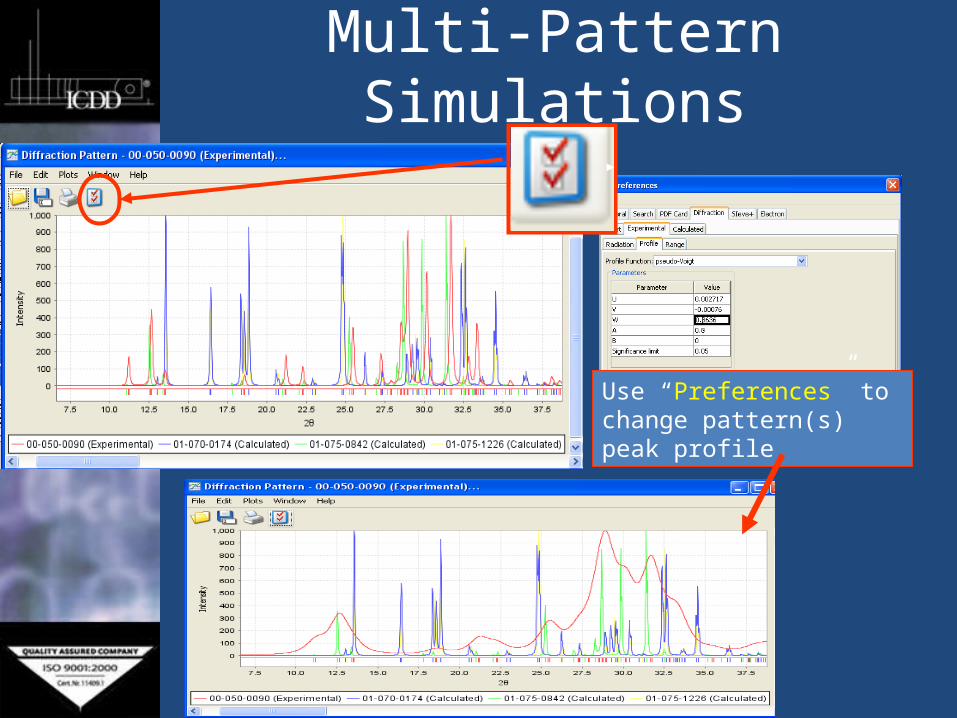
Multi-Pattern Simulations
Use “Preferences” to change pattern(s)peak profile
Simulations with Experimental Data
The digital pattern module can be used interactively with the program SIeve+. (See the Identification – PDF-4 SIeve+ tutorial).
The program SIeve+ will search the database to findmatches for experimental data based on Fink, Hanawalt or Long 8 search algorithms.
SIeve+ will examine the peak heights of the reference data and scale them to the experimentaldata. This scale factor is then input automatically intothe digital plotting routines.
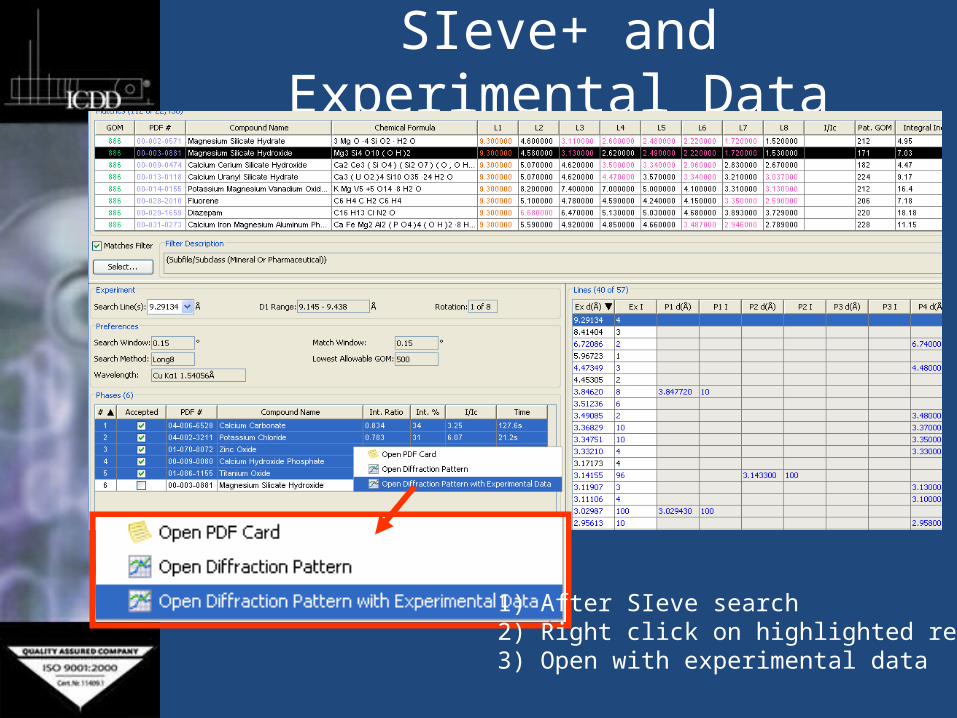
SIeve+ and Experimental Data
1) After SIeve search2) Right click on highlighted results3) Open with experimental data
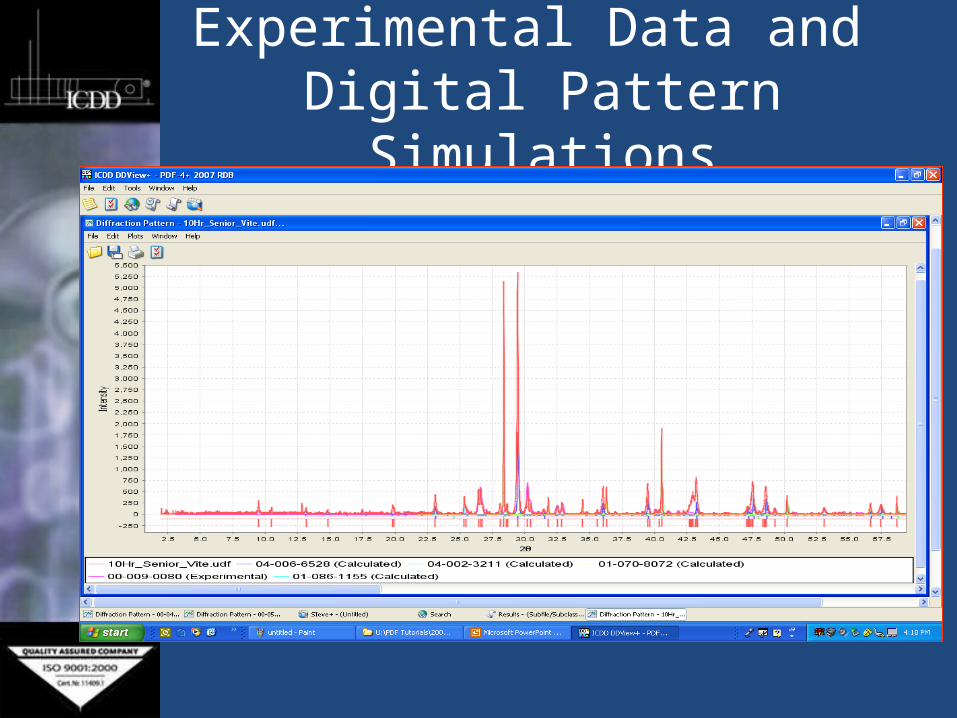
Experimental Data and Digital Pattern Simulations
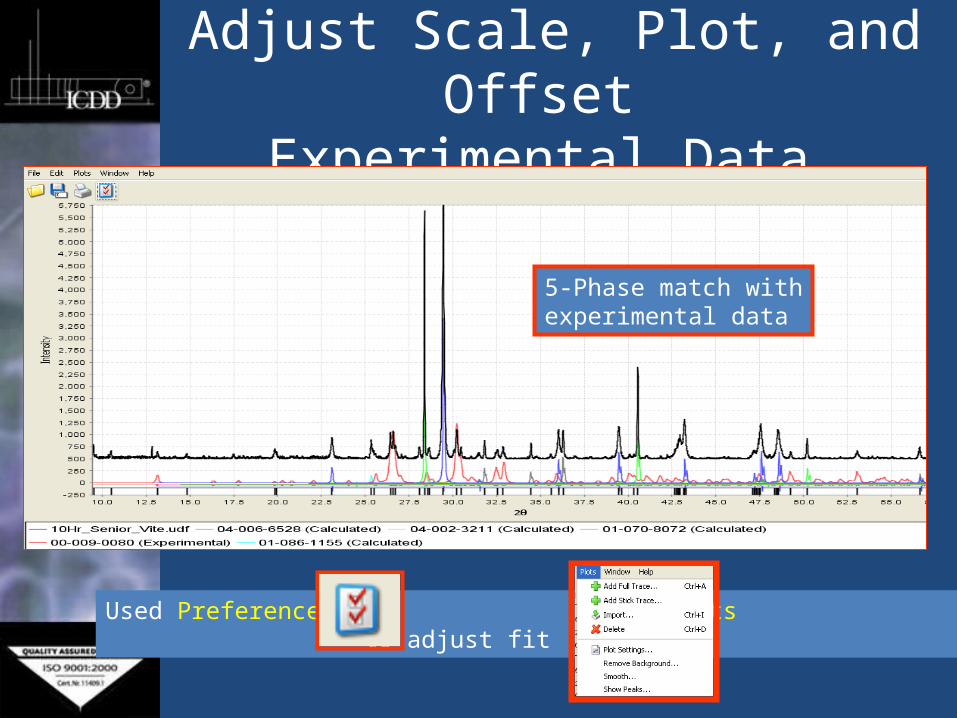
Adjust Scale, Plot, and Offset Experimental Data
5-Phase match withexperimental data
Used Preferences and Plots to adjust fit
Digital Patterns
• Can simulate crystallite size and other experimental conditions
• Useful for comparing data mining results
• Can be used to compare multiphase simulations with experimental results
International Centre for Diffraction Data
12 Campus Boulevard
Newtown Square, PA 19073
Phone: 610.325.9814
Fax: 610.325.9823
Thank you for viewing our tutorial. Additional tutorials are available at the ICDD web site (www.icdd.com).