Embed Size (px)
DESCRIPTION
Linear, Quadratic, and Exponential Models. Warm Up. Lesson Presentation. Lesson Quiz. Holt McDougal Algebra 1. Holt Algebra 1. Warm Up 1. Find the slope and y-intercept of the line that passes through (4, 20) and (20, 24). - PowerPoint PPT Presentation
Citation preview
Holt McDougal Algebra 1
Linear, Quadratic, and Exponential Models
Linear, Quadratic, and Exponential Models
Holt Algebra 1
Warm UpWarm Up
Lesson PresentationLesson Presentation
Lesson QuizLesson Quiz
Holt McDougal Algebra 1
Holt McDougal Algebra 1
Linear, Quadratic, and Exponential Models
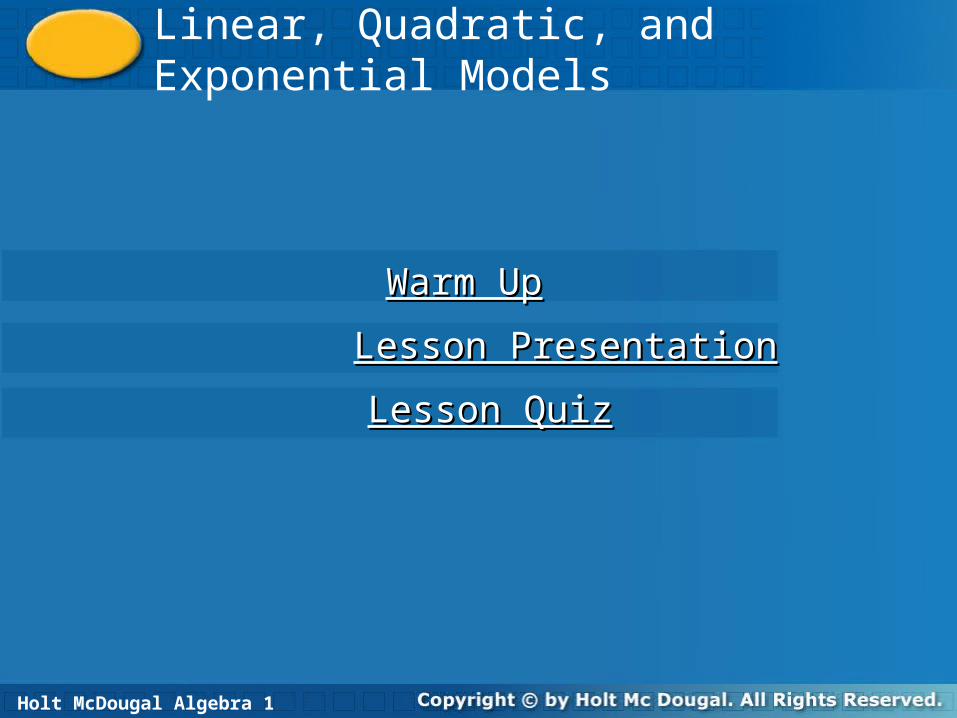
Warm Up
1. Find the slope and y-intercept of the line that
passes through (4, 20) and (20, 24).
The population of a town is decreasing at a rate of 1.8% per year. In 1990, there were 4600 people.
2. Write an exponential decay function to model this situation.
3. Find the population in 2010.
y = 4600(0.982)t
3199
Holt McDougal Algebra 1
Linear, Quadratic, and Exponential Models
Compare linear, quadratic, and exponential models.
Given a set of data, decide which type of function models the data and write an equation to describe the function.
Objectives
Holt McDougal Algebra 1
Linear, Quadratic, and Exponential Models
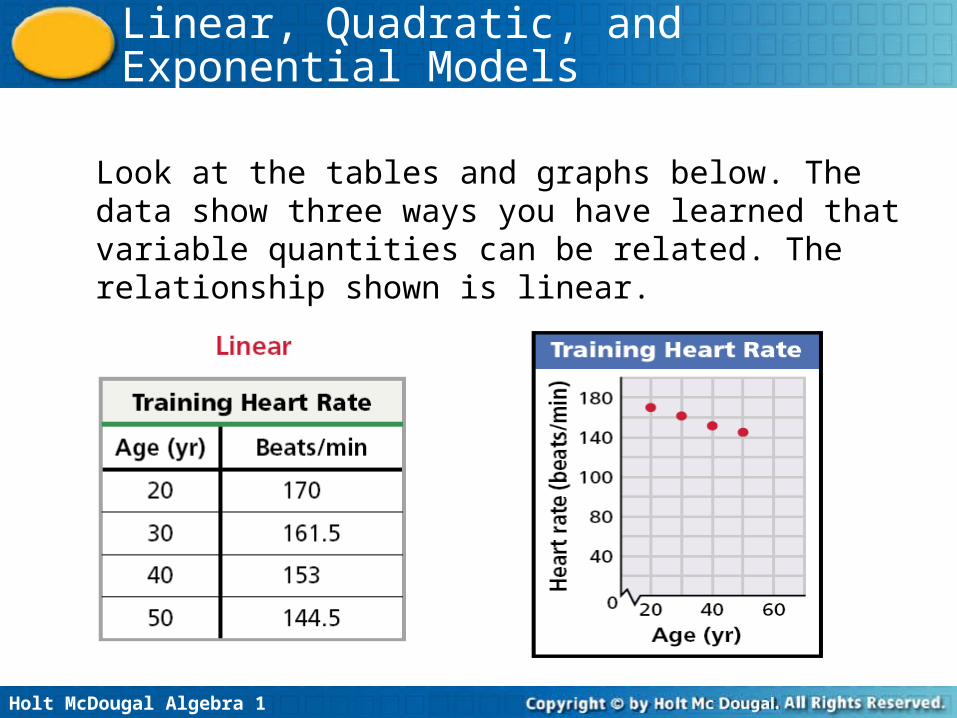
Look at the tables and graphs below. The data show three ways you have learned that variable quantities can be related. The relationship shown is linear.
Holt McDougal Algebra 1
Linear, Quadratic, and Exponential Models
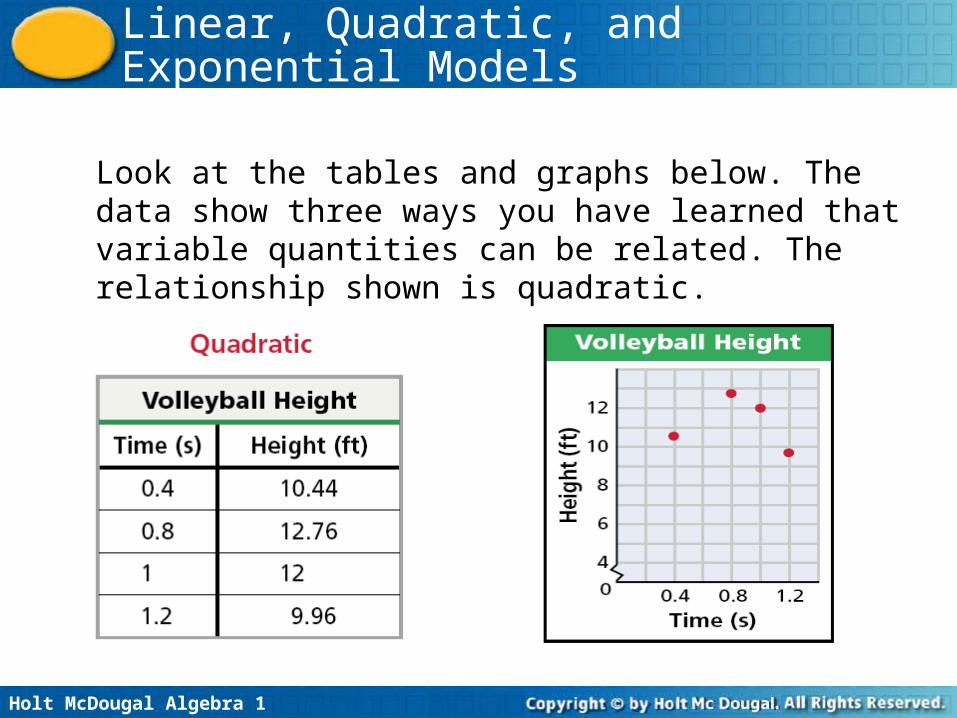
Look at the tables and graphs below. The data show three ways you have learned that variable quantities can be related. The relationship shown is quadratic.
Holt McDougal Algebra 1
Linear, Quadratic, and Exponential Models
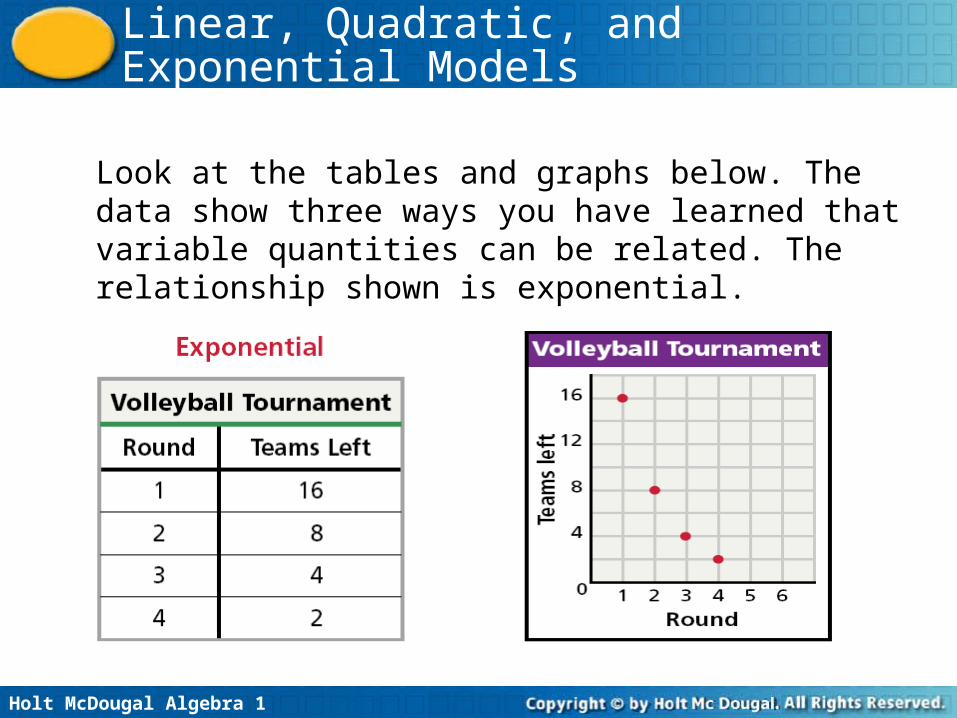
Look at the tables and graphs below. The data show three ways you have learned that variable quantities can be related. The relationship shown is exponential.
Holt McDougal Algebra 1
Linear, Quadratic, and Exponential Models
In the real world, people often gather data and then must decide what kind of relationship (if any) they think best describes their data.
Holt McDougal Algebra 1
Linear, Quadratic, and Exponential Models
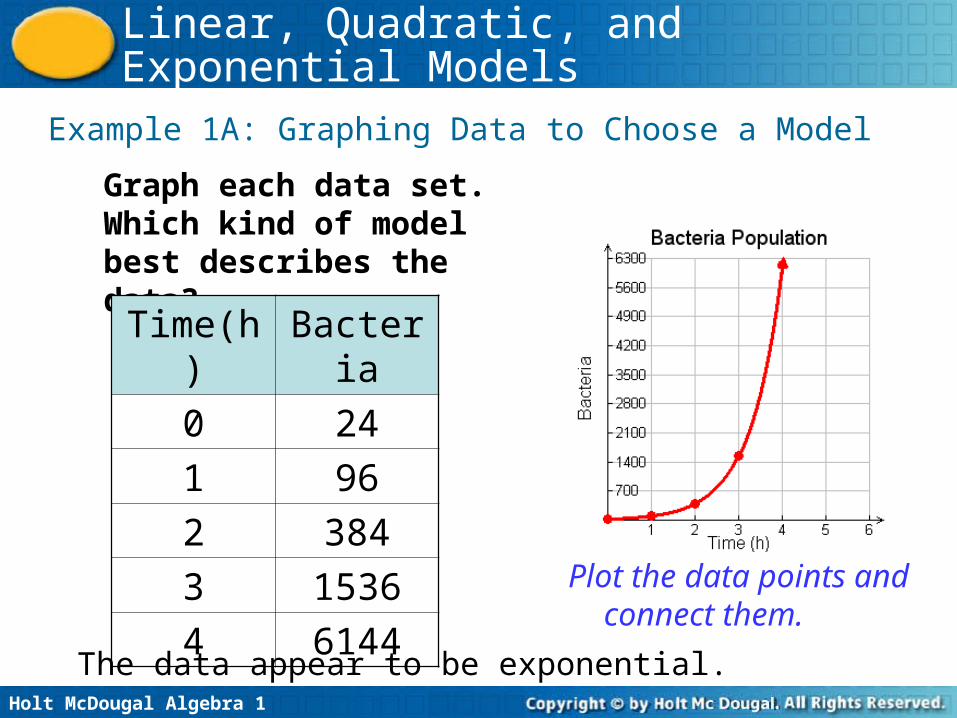
Example 1A: Graphing Data to Choose a Model
Graph each data set. Which kind of model best describes the data?
Plot the data points and connect them.
The data appear to be exponential.
Time(h) Bacteria
0 24
1 96
2 384
3 1536
4 6144
Holt McDougal Algebra 1
Linear, Quadratic, and Exponential Models
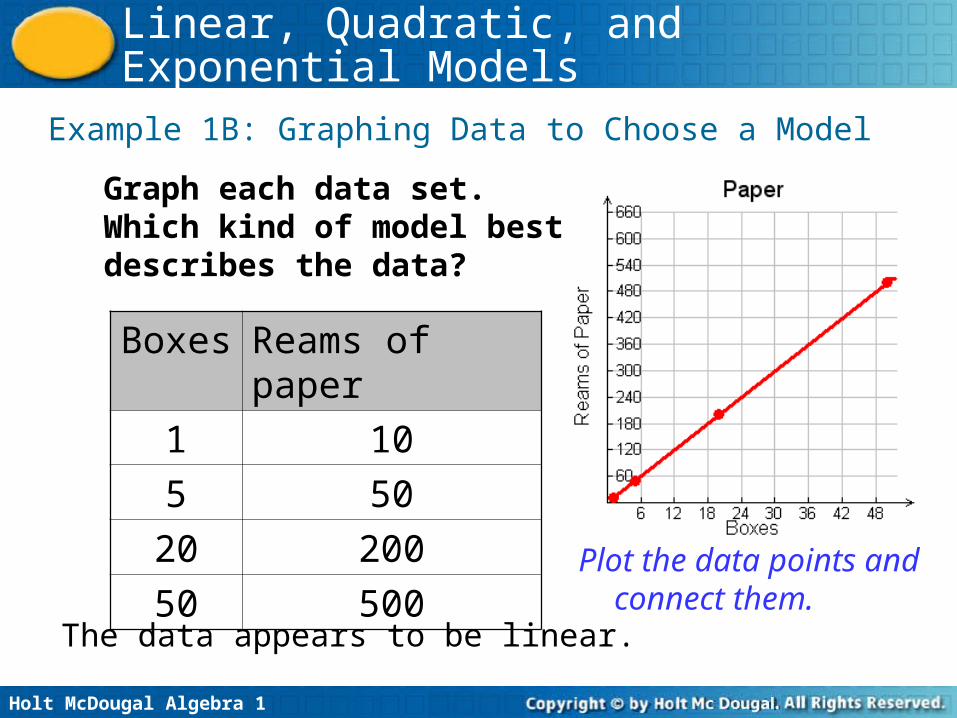
Example 1B: Graphing Data to Choose a Model
Graph each data set. Which kind of model best describes the data?
Boxes Reams of paper
1 10
5 50
20 200
50 500 Plot the data points and connect them.
The data appears to be linear.
Holt McDougal Algebra 1
Linear, Quadratic, and Exponential Models
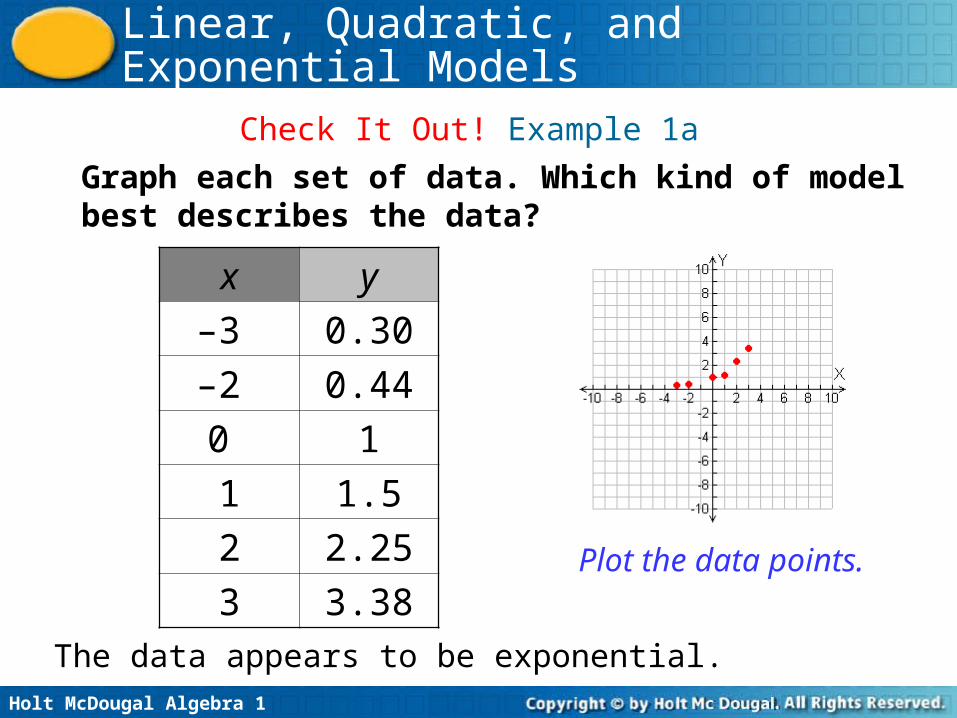
Check It Out! Example 1a
Graph each set of data. Which kind of model best describes the data?
x y
–3 0.30
–2 0.44
0 1
1 1.5
2 2.25
3 3.38Plot the data points.
The data appears to be exponential.
Holt McDougal Algebra 1
Linear, Quadratic, and Exponential Models
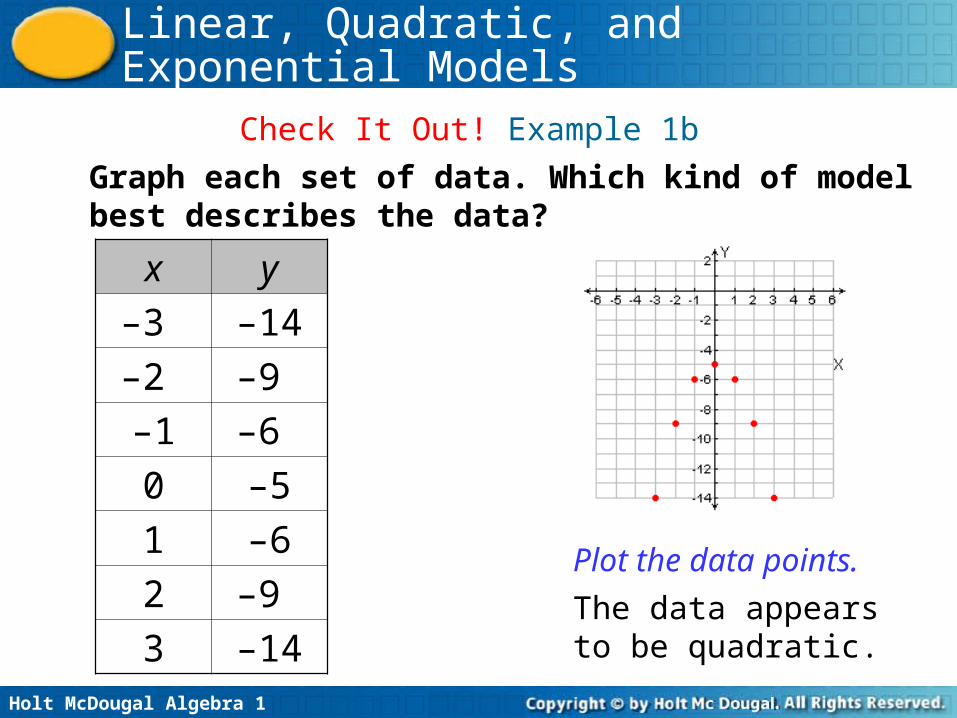
Check It Out! Example 1b
Graph each set of data. Which kind of model best describes the data?
Plot the data points.
The data appears to be quadratic.
x y
–3 –14
–2 –9
–1 –6
0 –5
1 –6
2 –9
3 –14
Holt McDougal Algebra 1
Linear, Quadratic, and Exponential Models
Another way to decide which kind of relationship (if any) best describes a data set is to use patterns.
Holt McDougal Algebra 1
Linear, Quadratic, and Exponential Models
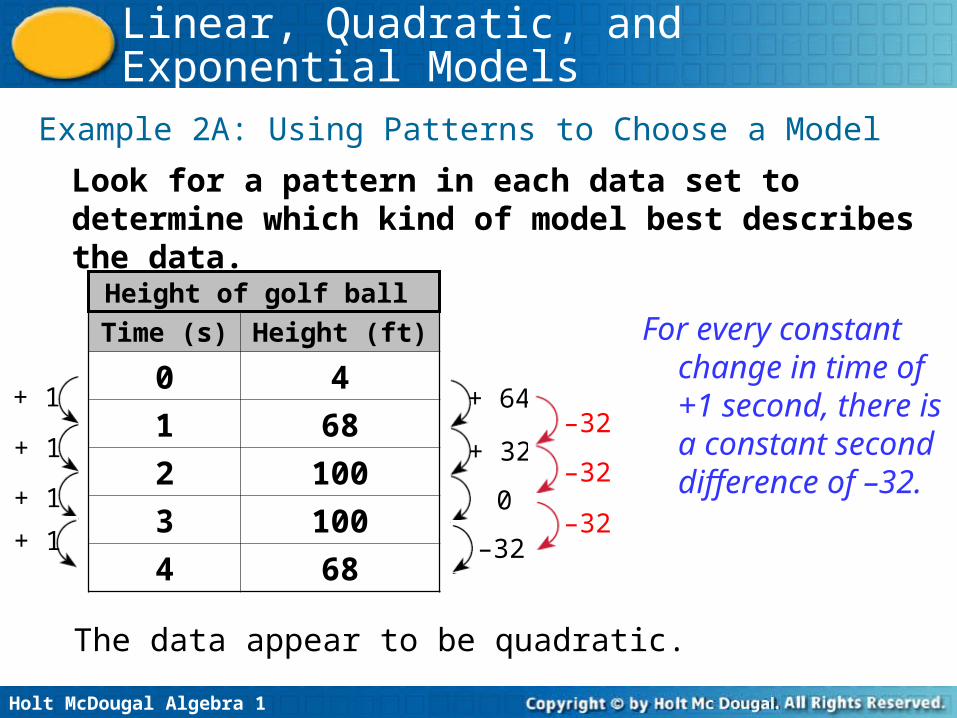
Example 2A: Using Patterns to Choose a Model
Look for a pattern in each data set to determine which kind of model best describes the data.
Time (s) Height (ft)
0 4
1 68
2 100
3 100
4 68
Height of golf ball
+ 64
+ 32
–32
0
+ 1
+ 1
+ 1
+ 1
–32
–32
–32
For every constant change in time of +1 second, there is a constant second difference of –32.
The data appear to be quadratic.
Holt McDougal Algebra 1
Linear, Quadratic, and Exponential Models
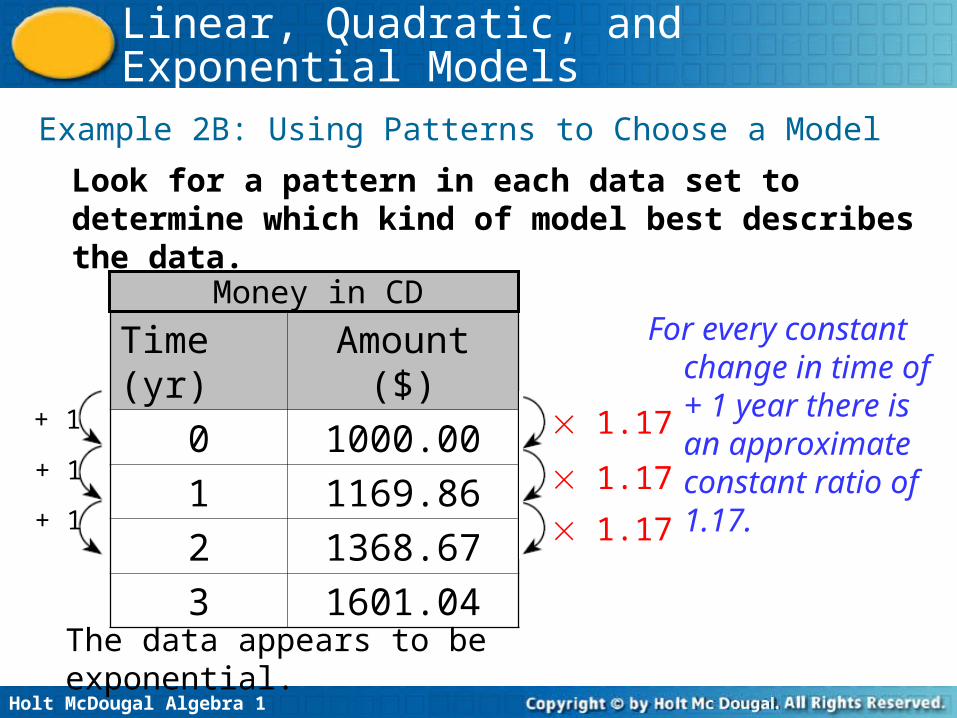
Time (yr) Amount ($)
0 1000.00
1 1169.86
2 1368.67
3 1601.04
Example 2B: Using Patterns to Choose a Model
Look for a pattern in each data set to determine which kind of model best describes the data.
Money in CD
+ 1
+ 1
+ 1
1.17
1.17
1.17
For every constant change in time of + 1 year there is an approximate constant ratio of 1.17.
The data appears to be exponential.
Holt McDougal Algebra 1
Linear, Quadratic, and Exponential Models
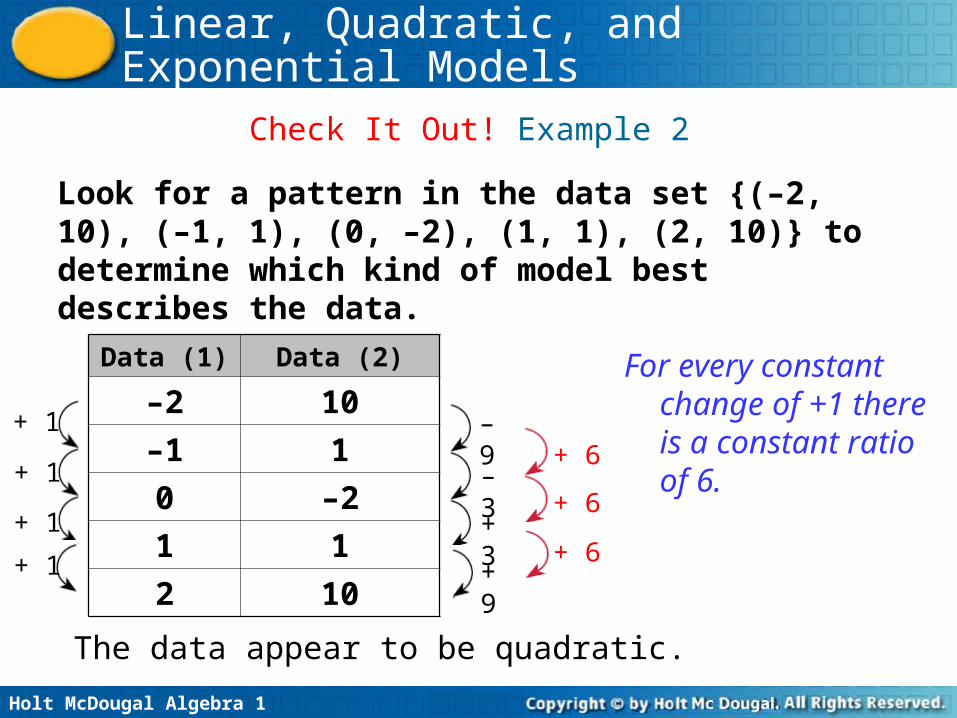
Check It Out! Example 2
Look for a pattern in the data set {(–2, 10), (–1, 1), (0, –2), (1, 1), (2, 10)} to determine which kind of model best describes the data.
Data (1) Data (2)
–2 10
–1 1
0 –2
1 1
2 10
+ 1
+ 1
+ 1
+ 1
+ 6
+ 6
+ 6
– 9
– 3
+ 3
+ 9
For every constant change of +1 there is a constant ratio of 6.
The data appear to be quadratic.
Holt McDougal Algebra 1
Linear, Quadratic, and Exponential Models
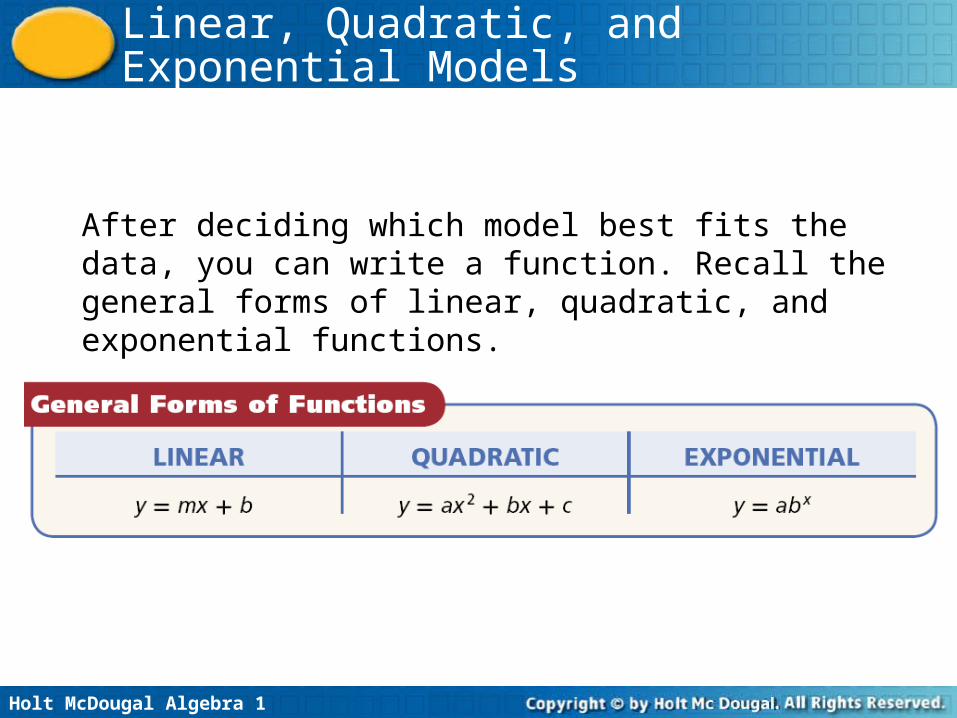
After deciding which model best fits the data, you can write a function. Recall the general forms of linear, quadratic, and exponential functions.
Holt McDougal Algebra 1
Linear, Quadratic, and Exponential Models
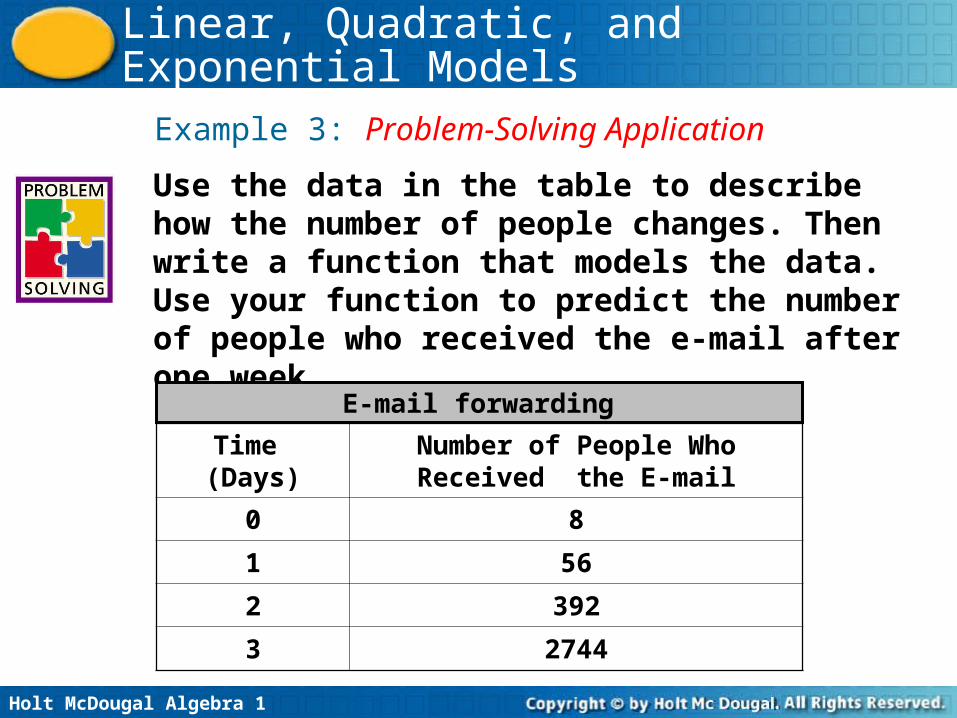
Example 3: Problem-Solving Application
Use the data in the table to describe how the number of people changes. Then write a function that models the data. Use your function to predict the number of people who received the e-mail after one week.
Time (Days) Number of People Who Received the E-mail
0 8
1 56
2 392
3 2744
E-mail forwarding
Holt McDougal Algebra 1
Linear, Quadratic, and Exponential Models
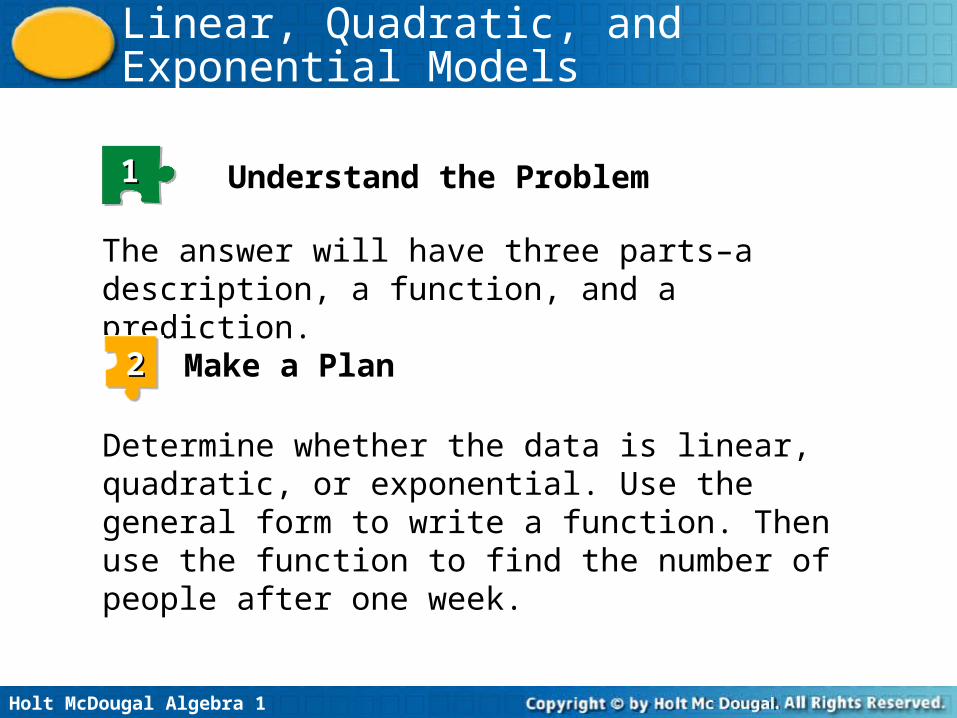
11 Understand the Problem
The answer will have three parts–a description, a function, and a prediction.
22 Make a Plan
Determine whether the data is linear, quadratic, or exponential. Use the general form to write a function. Then use the function to find the number of people after one week.
Holt McDougal Algebra 1
Linear, Quadratic, and Exponential Models
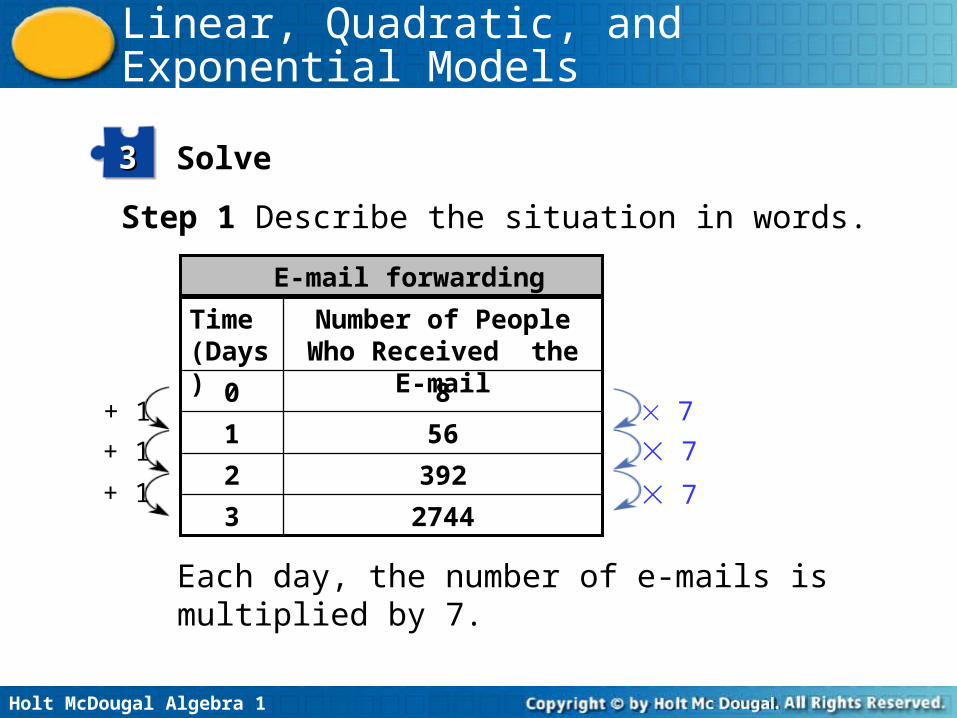
Solve33
Step 1 Describe the situation in words.
27443
3922
561
80
Number of People Who Received the E-mail
Time (Days)
E-mail forwarding
Each day, the number of e-mails is multiplied by 7.
7
7
7
+ 1
+ 1
+ 1
Holt McDougal Algebra 1
Linear, Quadratic, and Exponential Models
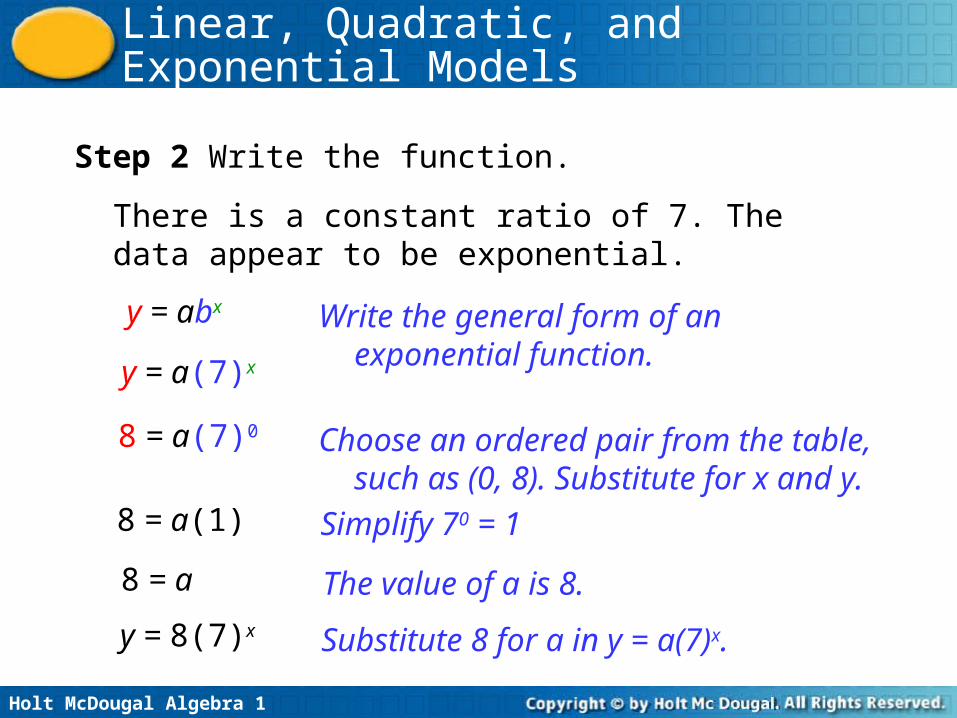
Step 2 Write the function.
There is a constant ratio of 7. The data appear to be exponential.
y = abx Write the general form of an exponential function.y = a(7)x
8 = a(7)0
8 = a(1)
8 = a
y = 8(7)x
Choose an ordered pair from the table, such as (0, 8). Substitute for x and y.
Simplify 70 = 1
The value of a is 8.
Substitute 8 for a in y = a(7)x.
Holt McDougal Algebra 1
Linear, Quadratic, and Exponential Models
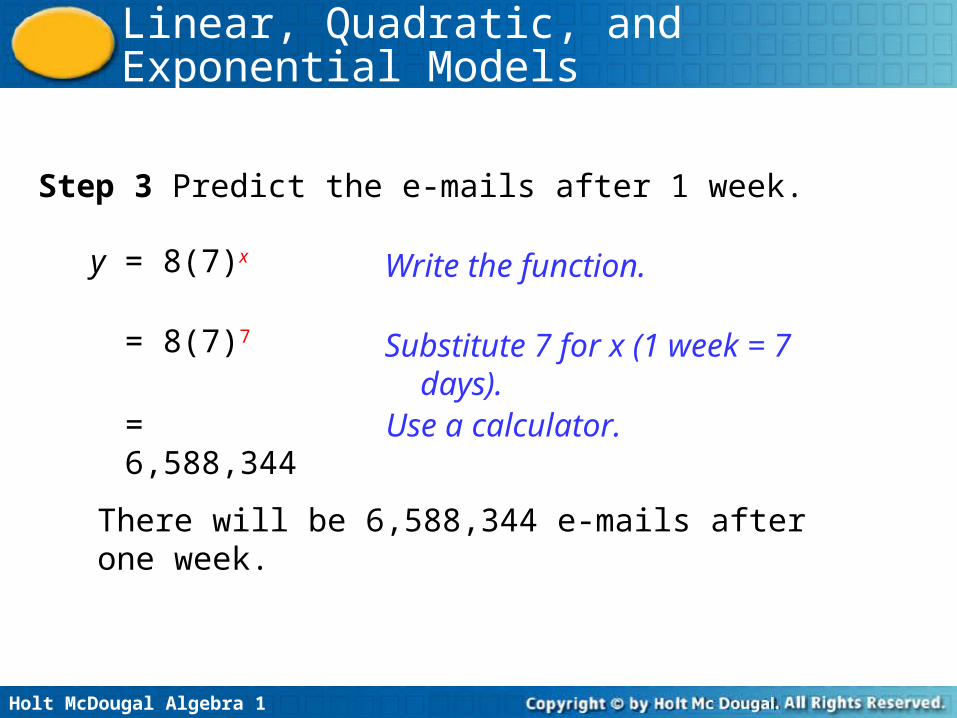
Step 3 Predict the e-mails after 1 week.
y = 8(7)x
= 8(7)7
= 6,588,344
There will be 6,588,344 e-mails after one week.
Write the function.
Substitute 7 for x (1 week = 7 days).
Use a calculator.
Holt McDougal Algebra 1
Linear, Quadratic, and Exponential Models
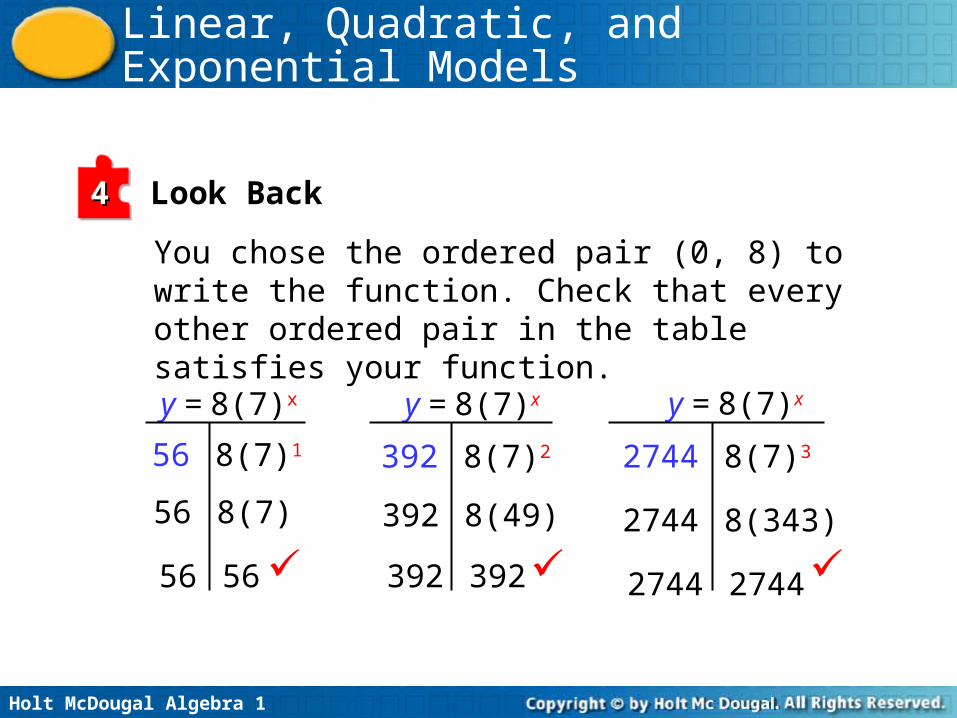
Look Back44
You chose the ordered pair (0, 8) to write the function. Check that every other ordered pair in the table satisfies your function.
y = 8(7)x
56 8(7)1
56 8(7)
56 56
y = 8(7)x
392 8(7)2
392 8(49)
392 392
y = 8(7)x
2744 8(7)3
2744 8(343)
2744 2744
Holt McDougal Algebra 1
Linear, Quadratic, and Exponential Models
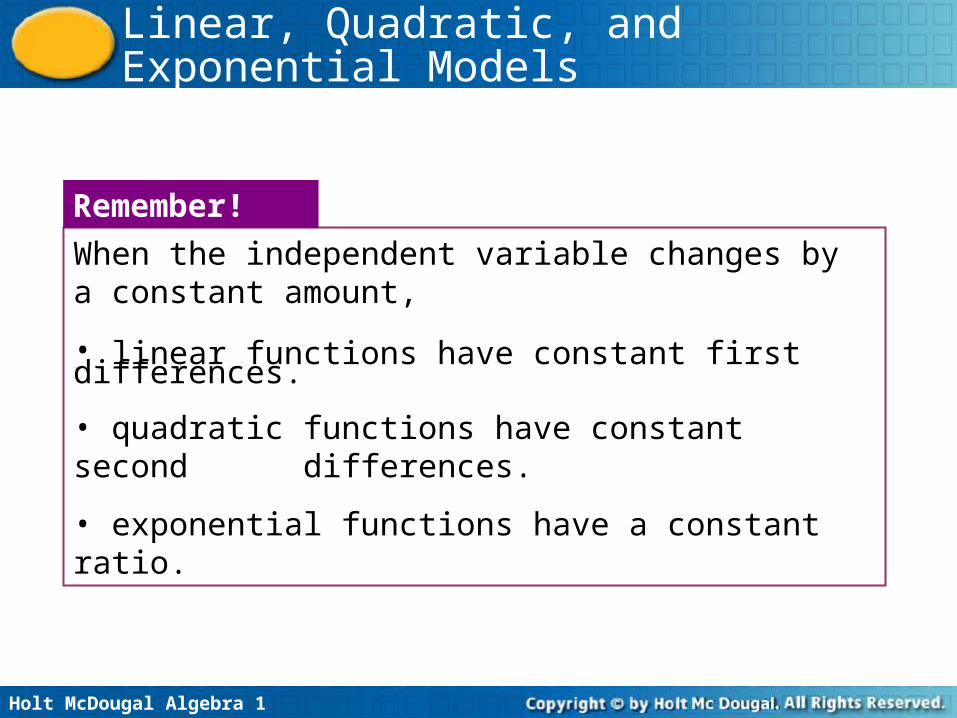
When the independent variable changes by a constant amount,
• linear functions have constant first differences.
• quadratic functions have constant second differences.
• exponential functions have a constant ratio.
Remember!
Holt McDougal Algebra 1
Linear, Quadratic, and Exponential Models
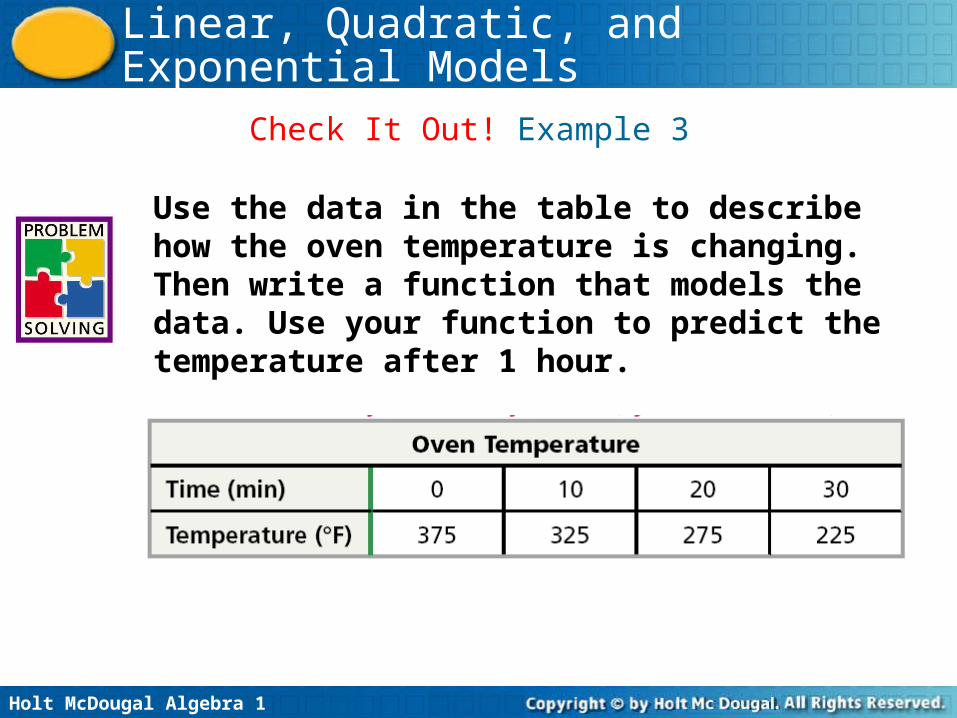
Use the data in the table to describe how the oven temperature is changing. Then write a function that models the data. Use your function to predict the temperature after 1 hour.
Check It Out! Example 3
Holt McDougal Algebra 1
Linear, Quadratic, and Exponential Models
11 Understand the Problem
The answer will have three parts–a description, a function, and a prediction.
22 Make a Plan
Determine whether the data is linear, quadratic, or exponential. Use the general form to write a function. Then use the function to find the temperature after one hour.
Holt McDougal Algebra 1
Linear, Quadratic, and Exponential Models
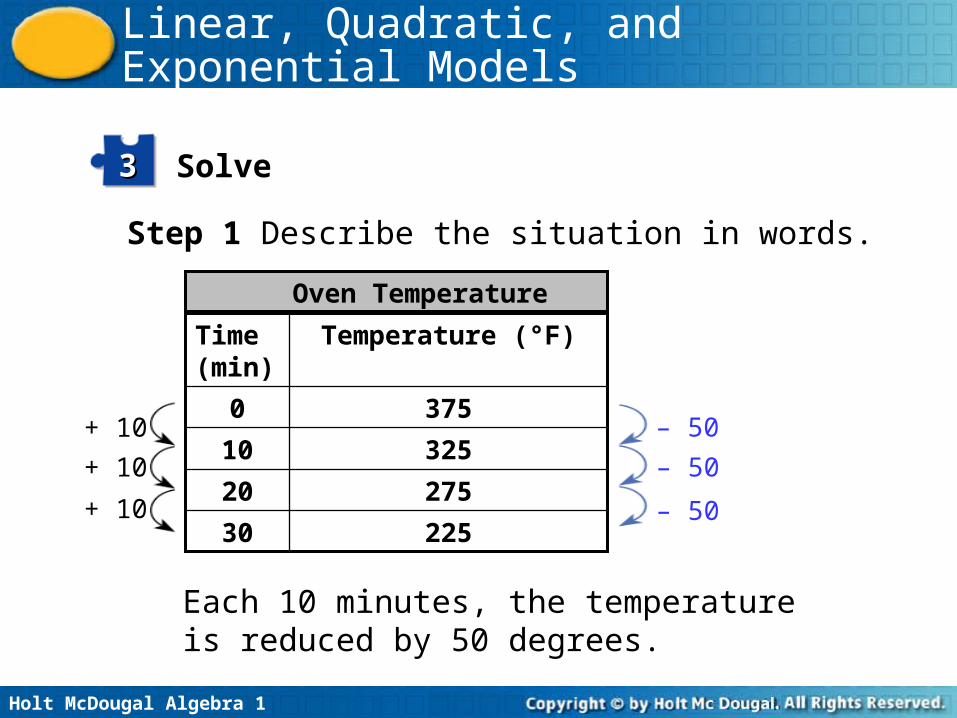
Solve33
Step 1 Describe the situation in words.
22530
27520
32510
3750
Temperature (°F)Time (min)
Oven Temperature
Each 10 minutes, the temperature is reduced by 50 degrees.
– 50
– 50
– 50
+ 10
+ 10
+ 10
Holt McDougal Algebra 1
Linear, Quadratic, and Exponential Models
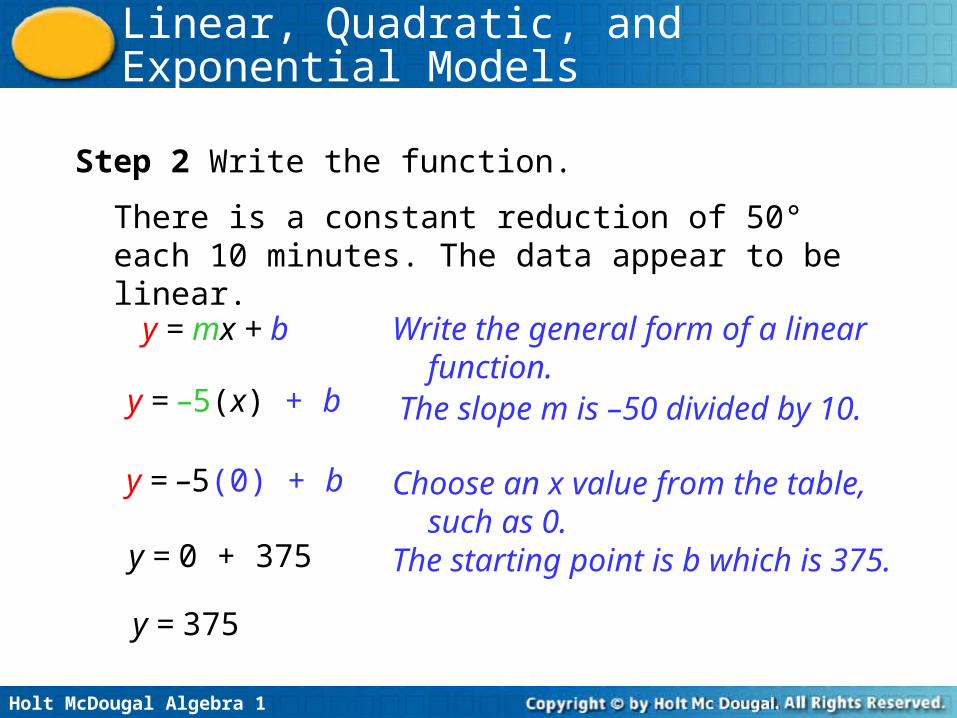
Step 2 Write the function.
There is a constant reduction of 50° each 10 minutes. The data appear to be linear.
y = mx + b Write the general form of a linear function.
y = –5(x) + b
y = –5(0) + b
y = 0 + 375
y = 375
Choose an x value from the table, such as 0.
The slope m is –50 divided by 10.
The starting point is b which is 375.
Holt McDougal Algebra 1
Linear, Quadratic, and Exponential Models
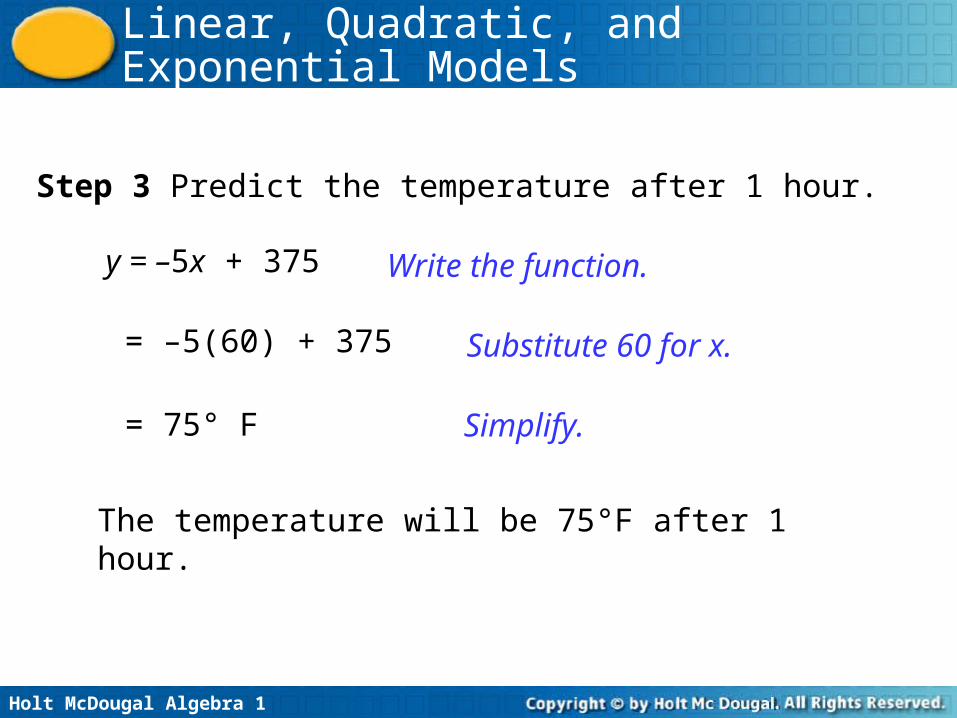
Step 3 Predict the temperature after 1 hour.
y = –5x + 375 Write the function.
= –5(60) + 375
= 75° F
The temperature will be 75°F after 1 hour.
Substitute 60 for x.
Simplify.
Holt McDougal Algebra 1
Linear, Quadratic, and Exponential Models
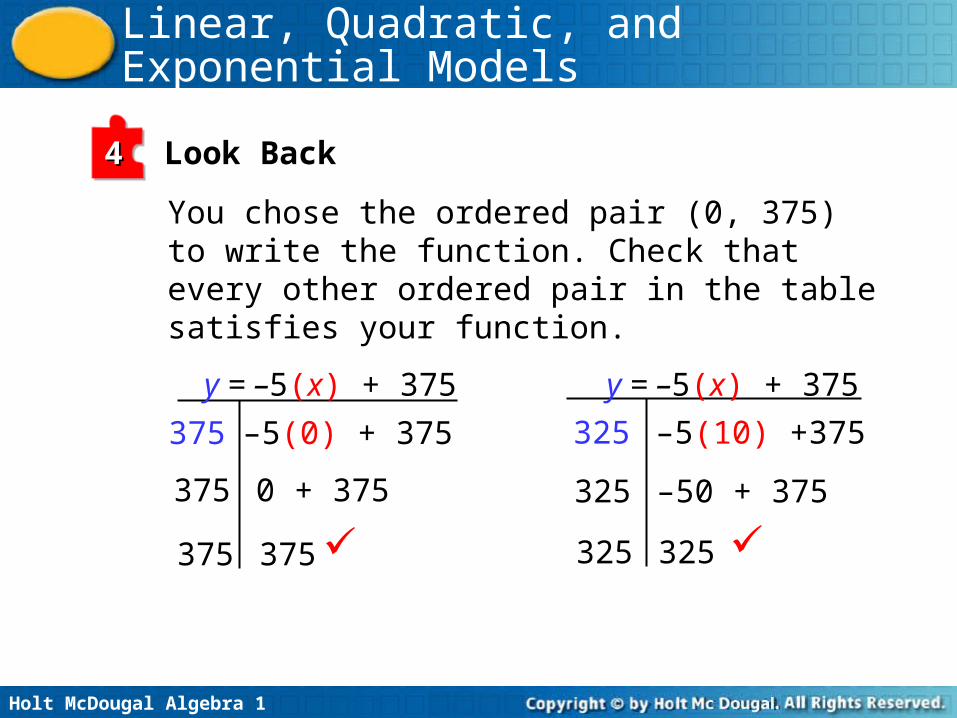
Look Back44
You chose the ordered pair (0, 375) to write the function. Check that every other ordered pair in the table satisfies your function.
375 –5(0) + 375
375 0 + 375
375 375
y = –5(x) + 375
325 –5(10) +375
325 –50 + 375
325 325
y = –5(x) + 375
Holt McDougal Algebra 1
Linear, Quadratic, and Exponential Models
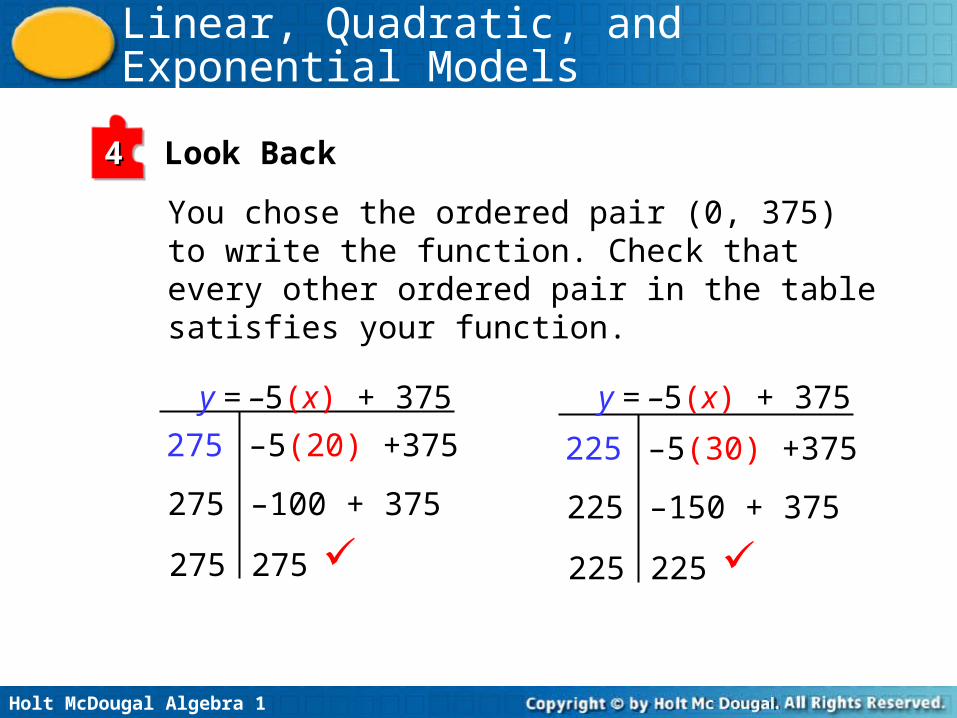
Look Back44
You chose the ordered pair (0, 375) to write the function. Check that every other ordered pair in the table satisfies your function.
275 –5(20) +375
275 –100 + 375
275 275
y = –5(x) + 375
225 –5(30) +375
225 –150 + 375
225 225
y = –5(x) + 375
Holt McDougal Algebra 1
Linear, Quadratic, and Exponential Models
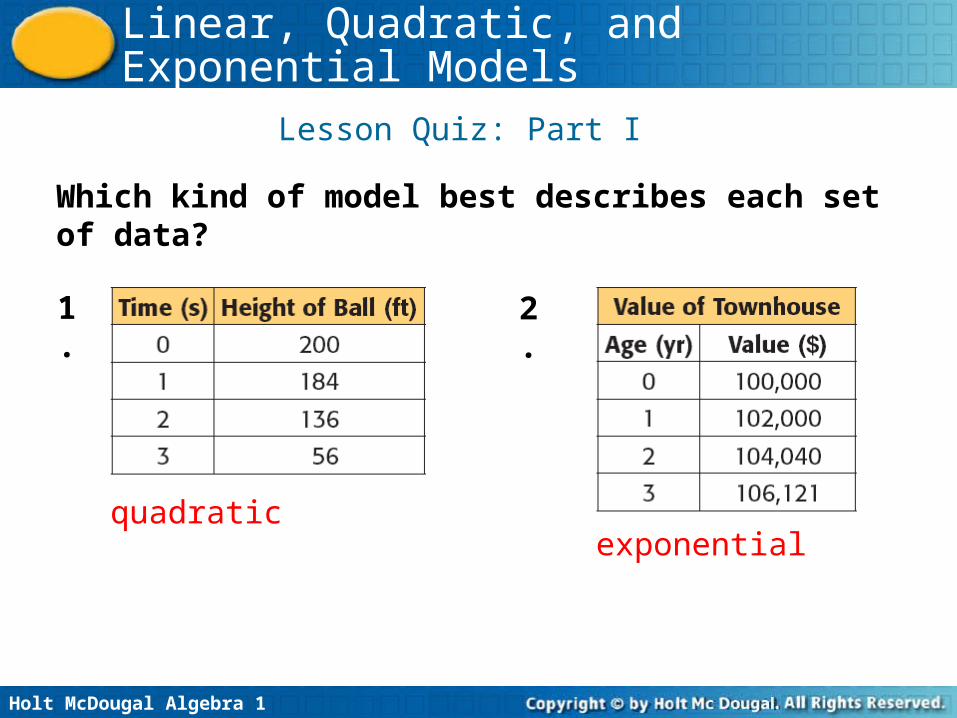
Lesson Quiz: Part I
Which kind of model best describes each set of data?
1. 2.
quadraticexponential
Holt McDougal Algebra 1
Linear, Quadratic, and Exponential Models
Lesson Quiz: Part II
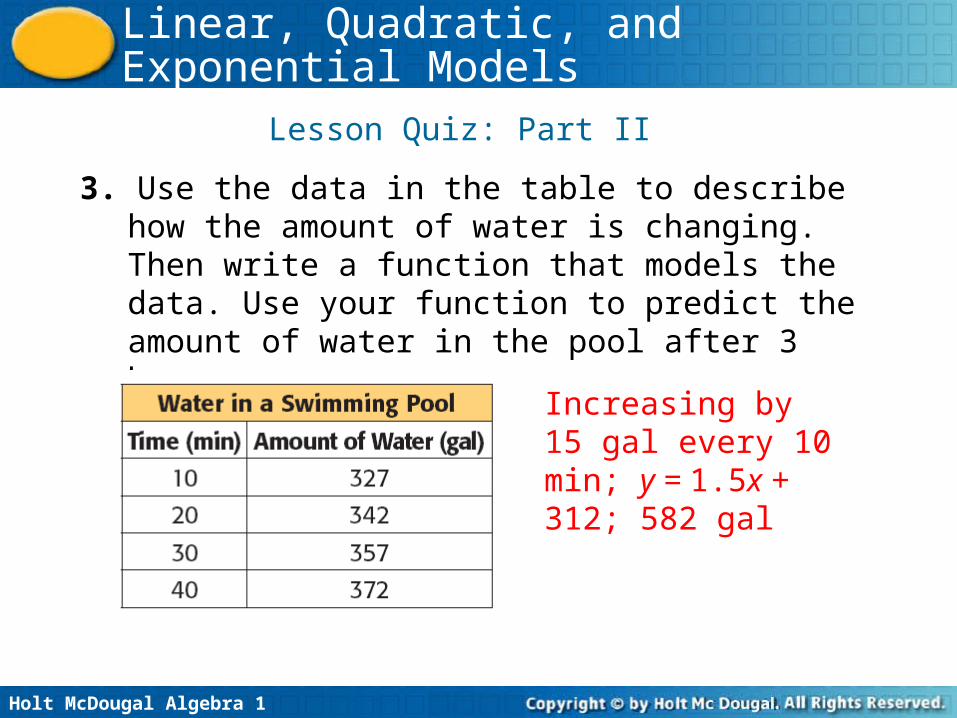
3. Use the data in the table to describe how the amount of water is changing. Then write a function that models the data. Use your function to predict the amount of water in the pool after 3 hours.
Increasing by 15 gal every 10 min; y = 1.5x + 312; 582 gal


![Exponential and quadratic functions problems [78 marks]](https://img.pdfslide.us/doc/110x75/61f269630aa44b0f991d8dd9/exponential-and-quadratic-functions-problems-78-marks.jpg)