Embed Size (px)
Citation preview
7.6Modeling Data: Exponential, Logarithmic, and Quadratic Functions
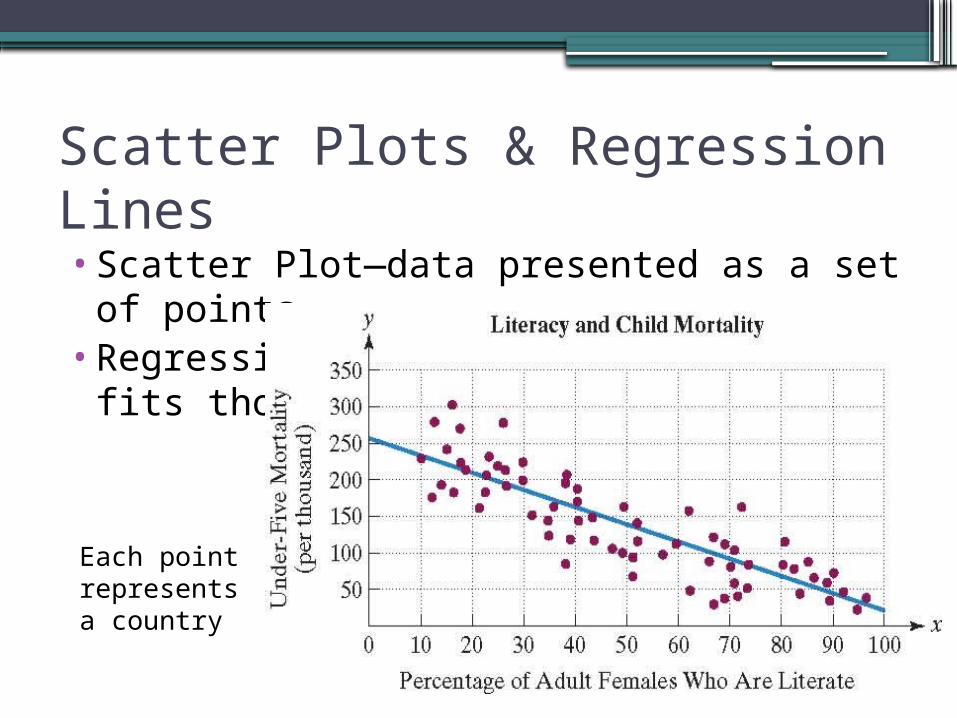
Scatter Plots & Regression Lines•Scatter Plot—data presented as a set of
points•Regression Line—the line that best fits
those points
Each point represents a country
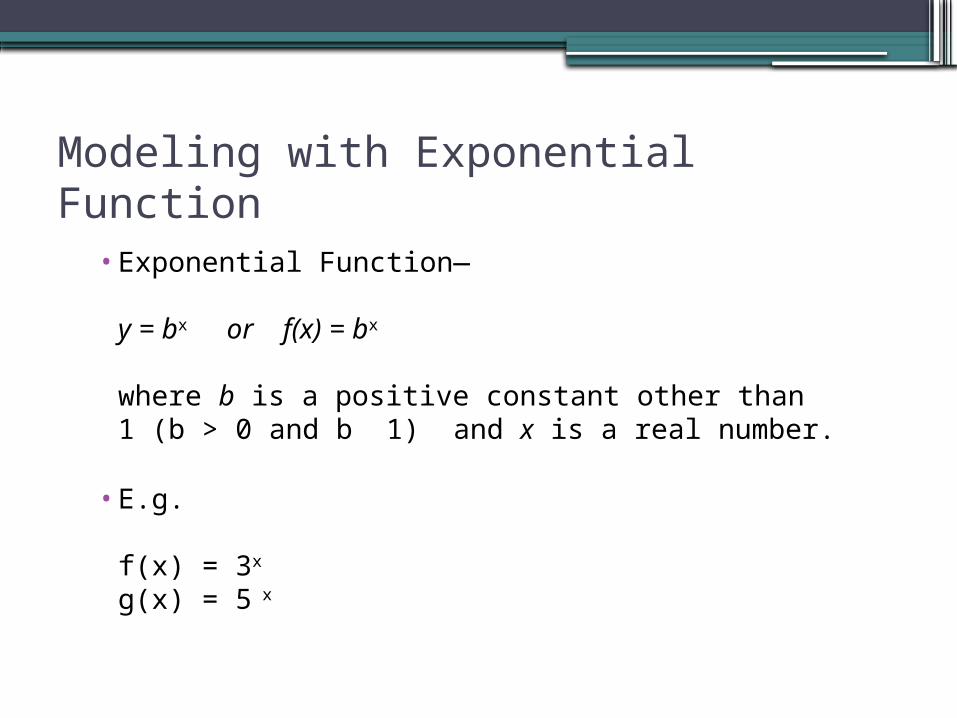
Modeling with Exponential Function
• Exponential Function—
y = bx or f(x) = bx
where b is a positive constant other than 1 (b > 0 and b 1) and x is a real number.
• E.g.
f(x) = 3x
g(x) = 5 x
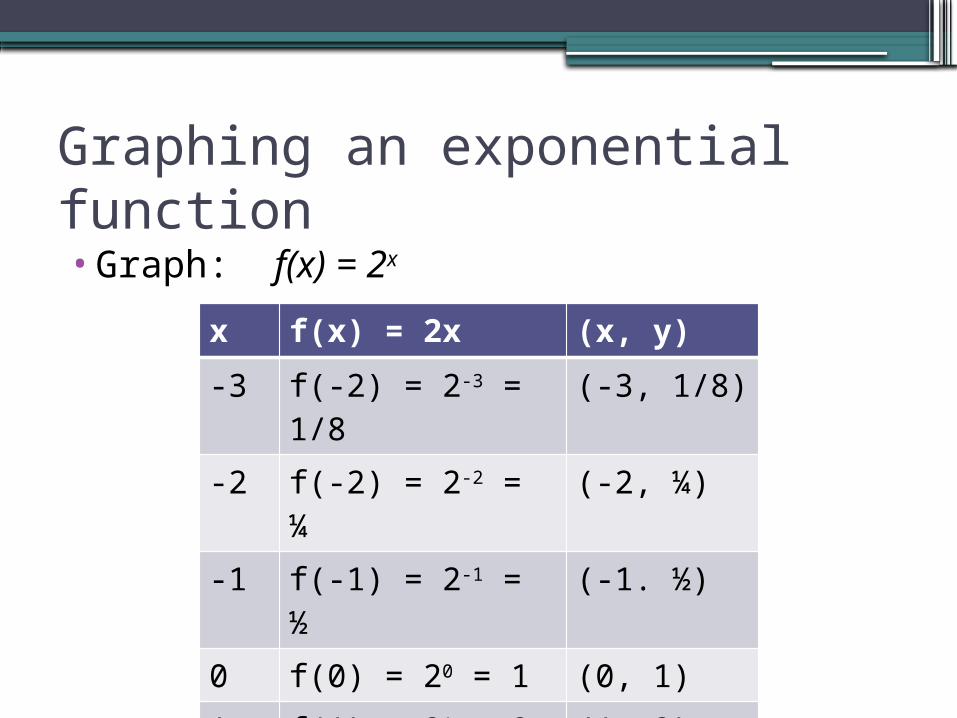
Graphing an exponential function•Graph: f(x) = 2x
x f(x) = 2x (x, y)
-3 f(-2) = 2-3 = 1/8 (-3, 1/8)
-2 f(-2) = 2-2 = ¼ (-2, ¼)
-1 f(-1) = 2-1 = ½ (-1. ½)
0 f(0) = 20 = 1 (0, 1)
1 f(1) = 21 = 2 (1, 2)
2 f(2) = 22 = 4 (2, 4)
3 f(3) = 23 = 8 (3, 8)
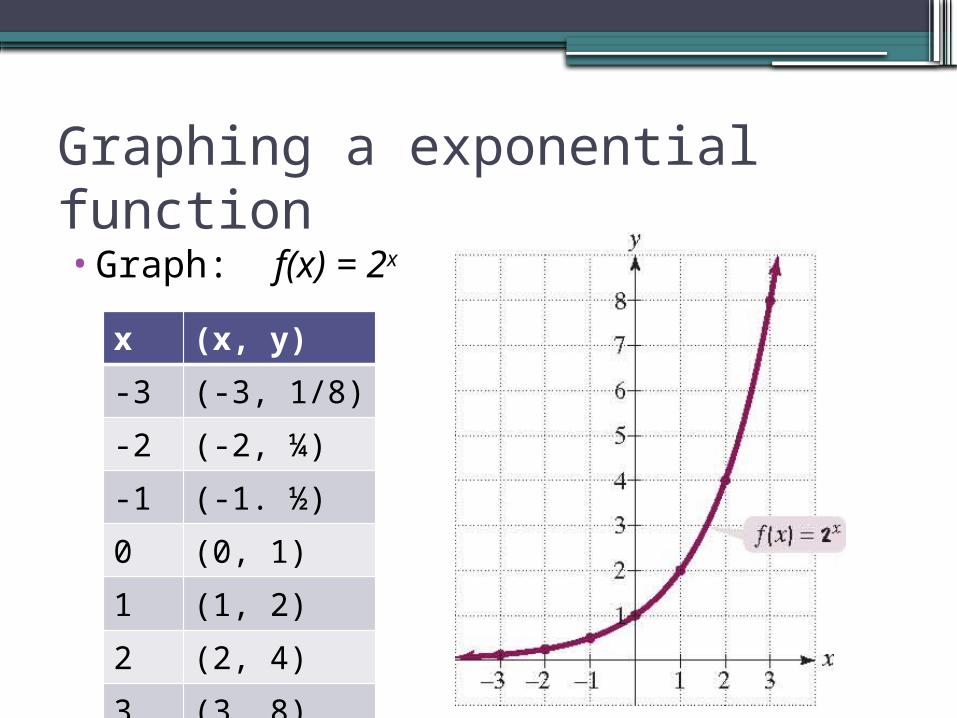
Graphing a exponential function•Graph: f(x) = 2x
x (x, y)-3 (-3, 1/8)
-2 (-2, ¼)
-1 (-1. ½)
0 (0, 1)
1 (1, 2)
2 (2, 4)
3 (3, 8)
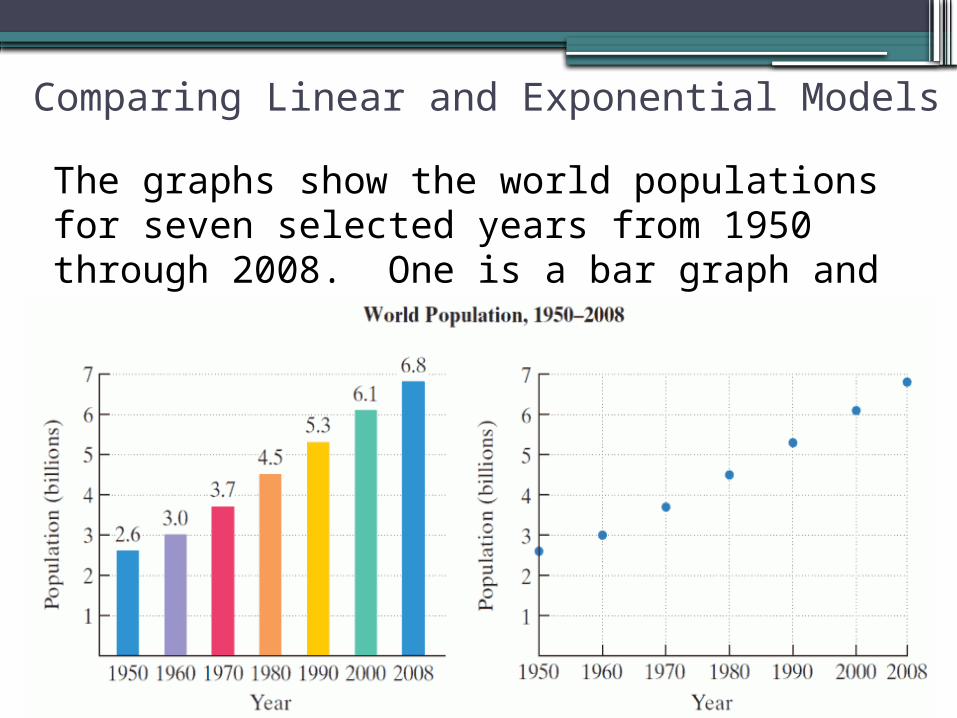
Comparing Linear and Exponential ModelsThe graphs show the world populations for seven selected years from 1950 through 2008. One is a bar graph and the other is scatter plot.
Comparing Linear and Exponential Models
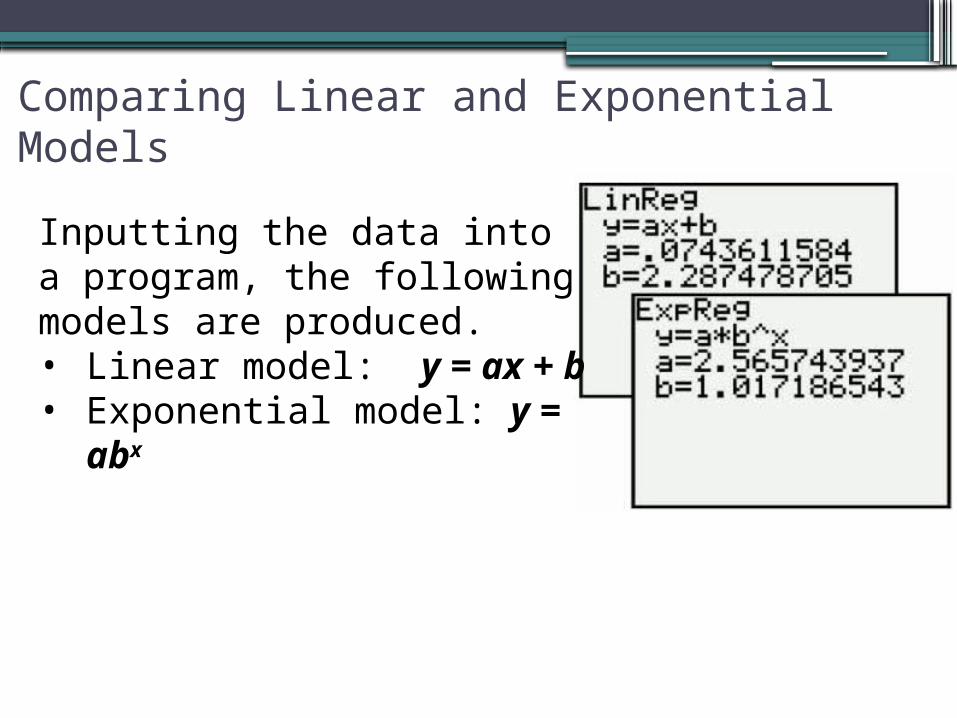
Inputting the data into a program, the following models are produced.• Linear model: y = ax + b• Exponential model: y =
abx
Comparing Linear and Exponential Models
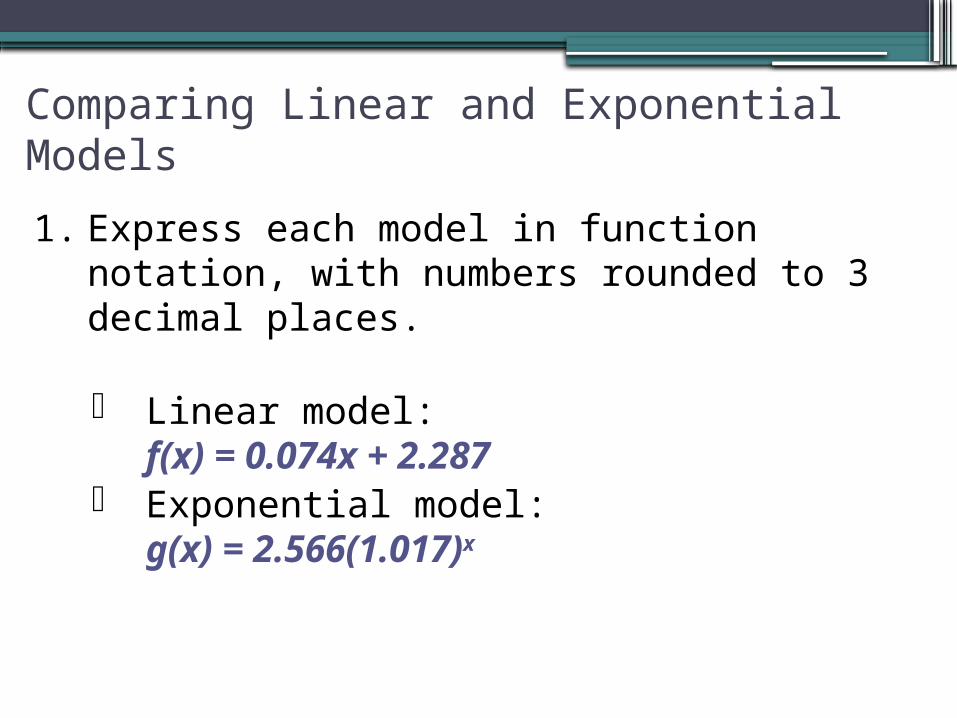
1. Express each model in function notation, with numbers rounded to 3 decimal places.
Linear model:f(x) = 0.074x + 2.287
Exponential model:g(x) = 2.566(1.017)x
Comparing Linear and Exponential Models
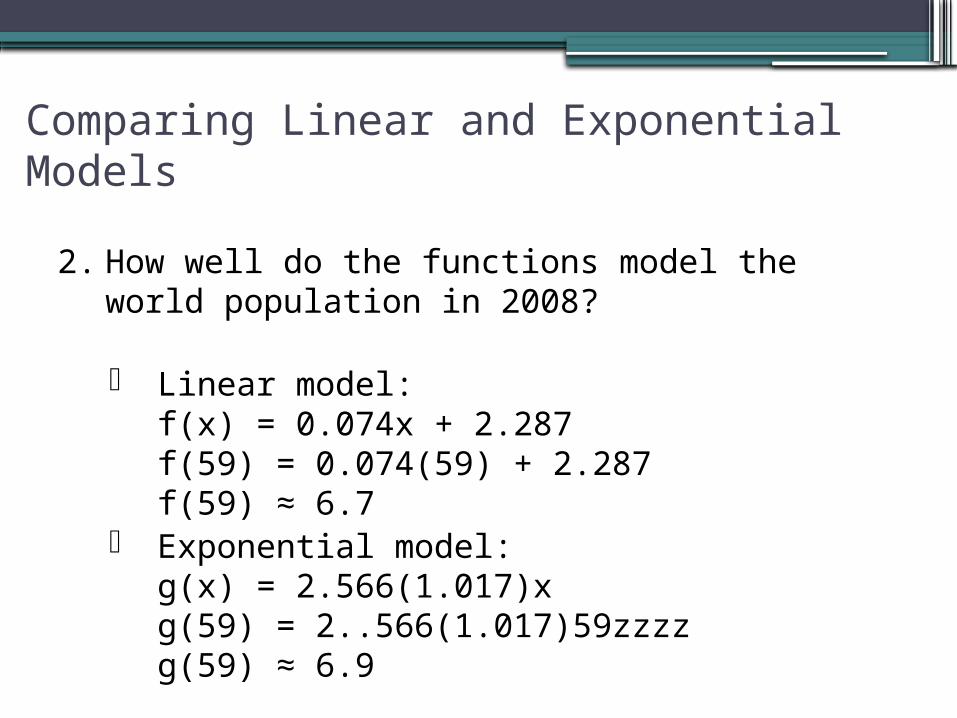
2. How well do the functions model the world population in 2008?
Linear model:f(x) = 0.074x + 2.287f(59) = 0.074(59) + 2.287f(59) ≈ 6.7
Exponential model:g(x) = 2.566(1.017)xg(59) = 2..566(1.017)59zzzzg(59) ≈ 6.9
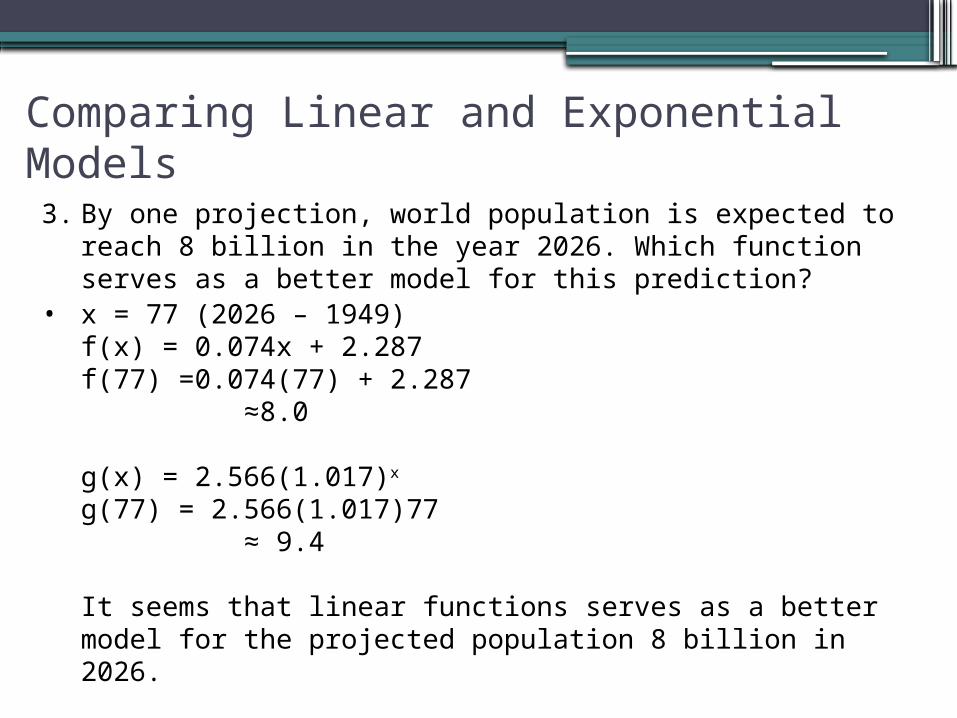
Comparing Linear and Exponential Models3. By one projection, world population is expected to
reach 8 billion in the year 2026. Which function serves as a better model for this prediction?
• x = 77 (2026 – 1949)f(x) = 0.074x + 2.287f(77) =0.074(77) + 2.287 ≈8.0
g(x) = 2.566(1.017)x
g(77) = 2.566(1.017)77 ≈ 9.4
It seems that linear functions serves as a better model for the projected population 8 billion in 2026.
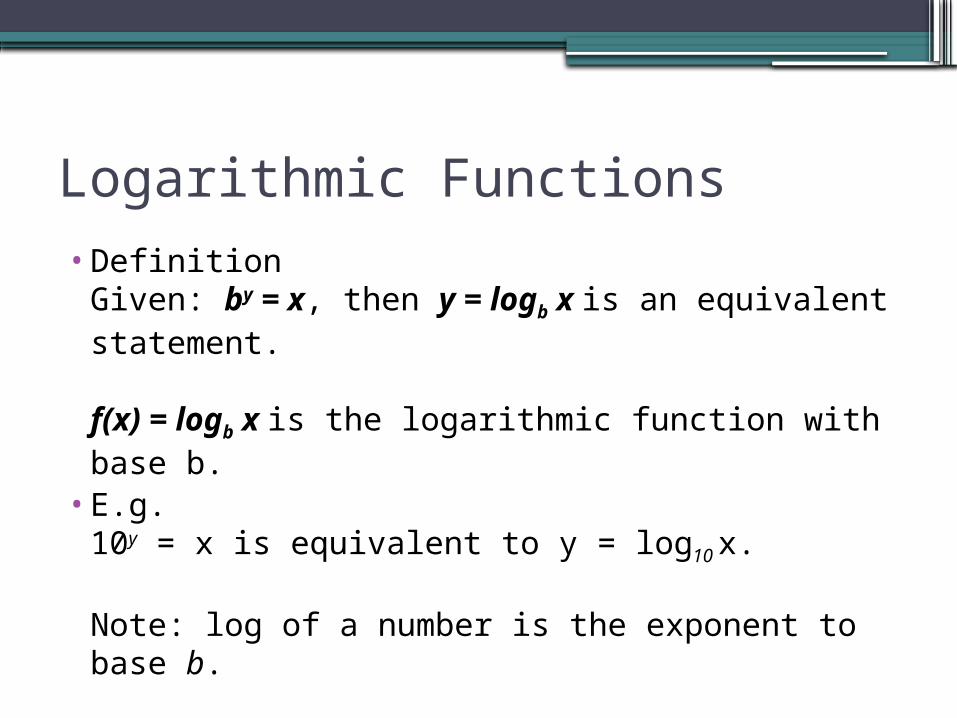
Logarithmic Functions•Definition
Given: by = x, then y = logb x is an equivalent statement.
f(x) = logb x is the logarithmic function with base b.
•E.g.10y = x is equivalent to y = log10 x.
Note: log of a number is the exponent to base b.
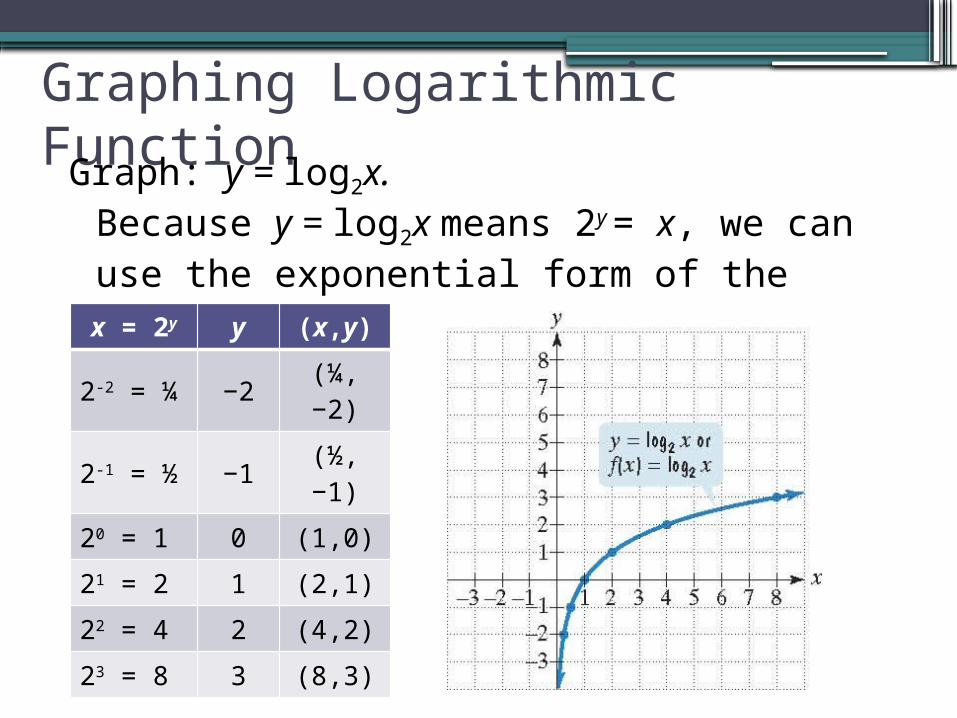
Graphing Logarithmic FunctionGraph: y = log2x.
Because y = log2x means 2y = x, we can use the exponential form of the equation. x = 2y y (x,y)
2-2 = ¼ −2 (¼,−2)
2-1 = ½ −1 (½,−1)
20 = 1 0 (1,0)
21 = 2 1 (2,1)
22 = 4 2 (4,2)
23 = 8 3 (8,3)
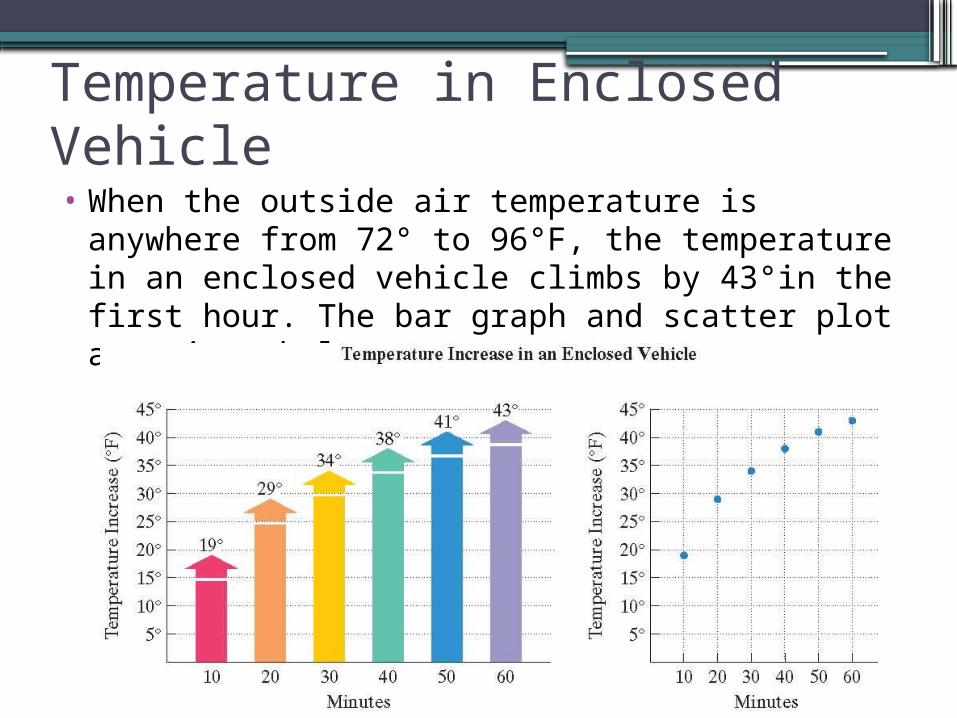
Temperature in Enclosed Vehicle• When the outside air temperature is anywhere
from 72° to 96°F, the temperature in an enclosed vehicle climbs by 43°in the first hour. The bar graph and scatter plot are given below
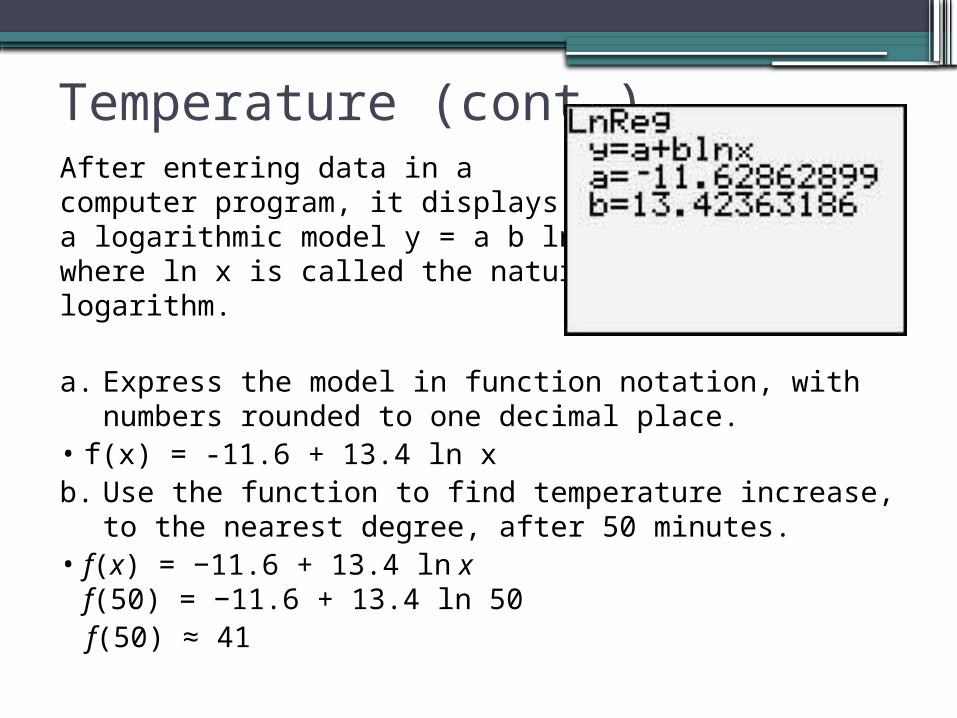
Temperature (cont.)After entering data in a computer program, it displaysa logarithmic model y = a b ln x, where ln x is called the naturallogarithm.
a. Express the model in function notation, with numbers rounded to one decimal place.
• f(x) = -11.6 + 13.4 ln xb. Use the function to find temperature increase, to
the nearest degree, after 50 minutes.• f(x) = −11.6 + 13.4 ln x
f(50) = −11.6 + 13.4 ln 50 f(50) ≈ 41
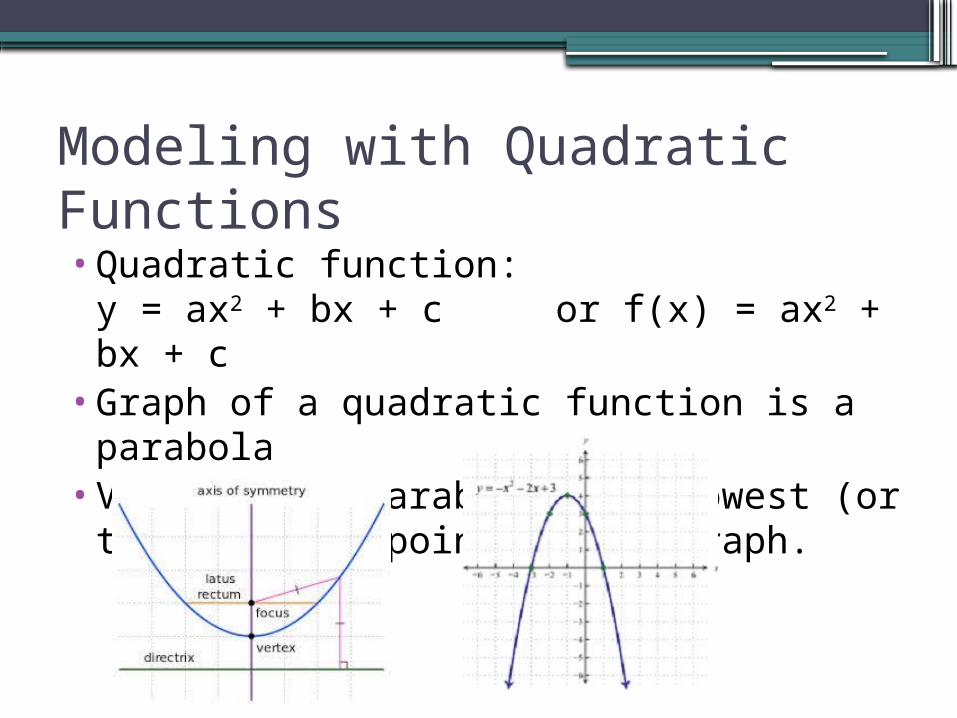
Modeling with Quadratic Functions•Quadratic function:
y = ax2 + bx + c or f(x) = ax2 + bx + c•Graph of a quadratic function is a
parabola•Vertex of a parabola: the lowest (or the
highest) point in the graph.
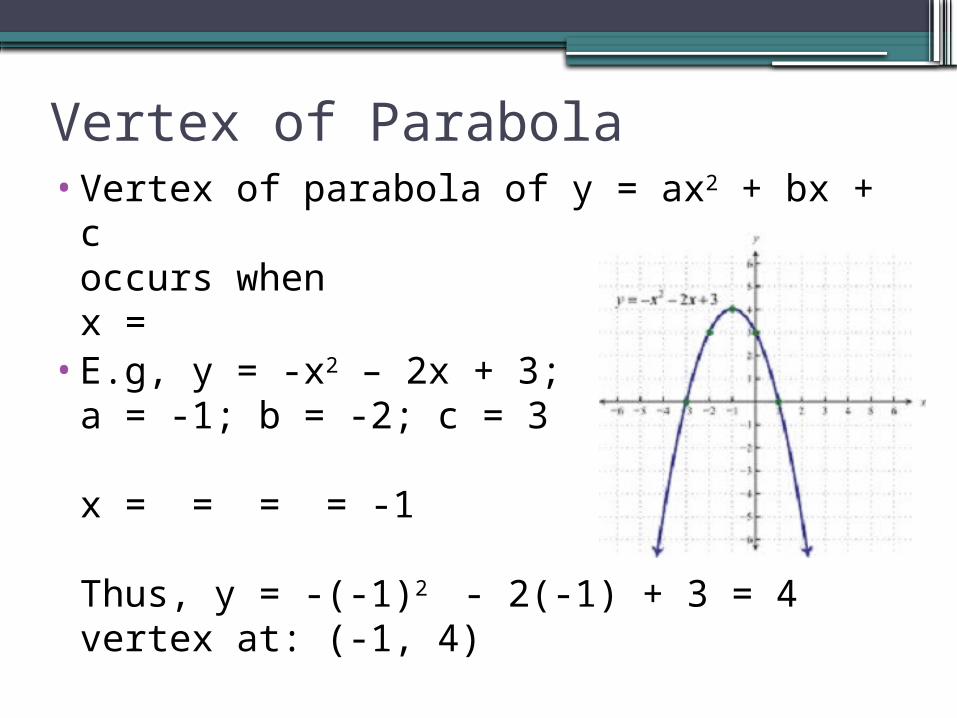
Vertex of Parabola•Vertex of parabola of y = ax2 + bx + c
occurs whenx =
•E.g, y = -x2 – 2x + 3; a = -1; b = -2; c = 3
x = = = = -1
Thus, y = -(-1)2 - 2(-1) + 3 = 4vertex at: (-1, 4)
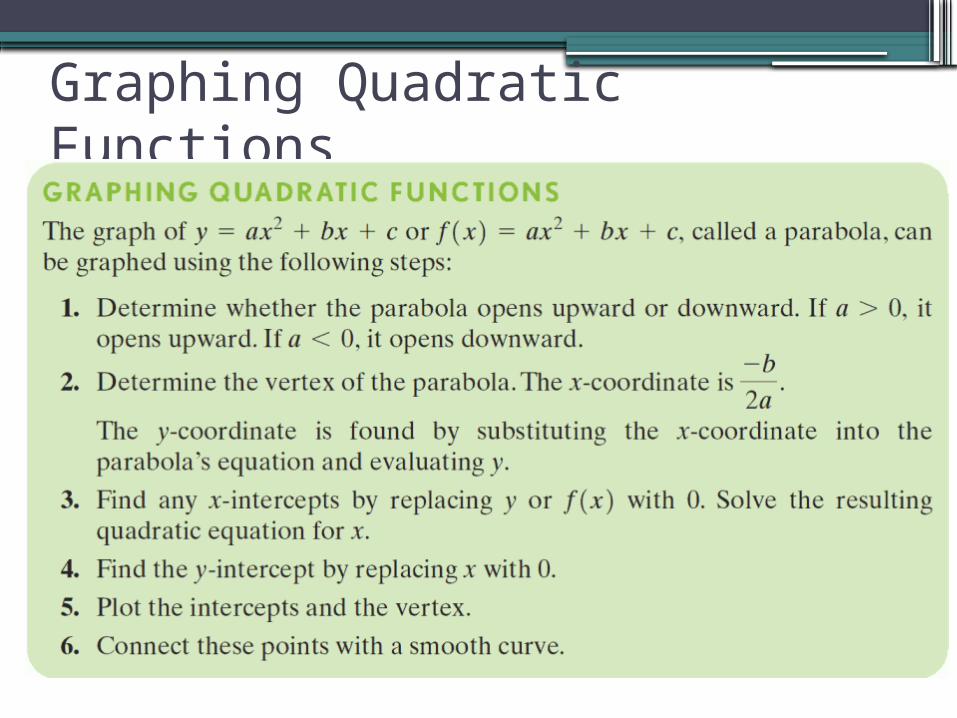
Graphing Quadratic Functions
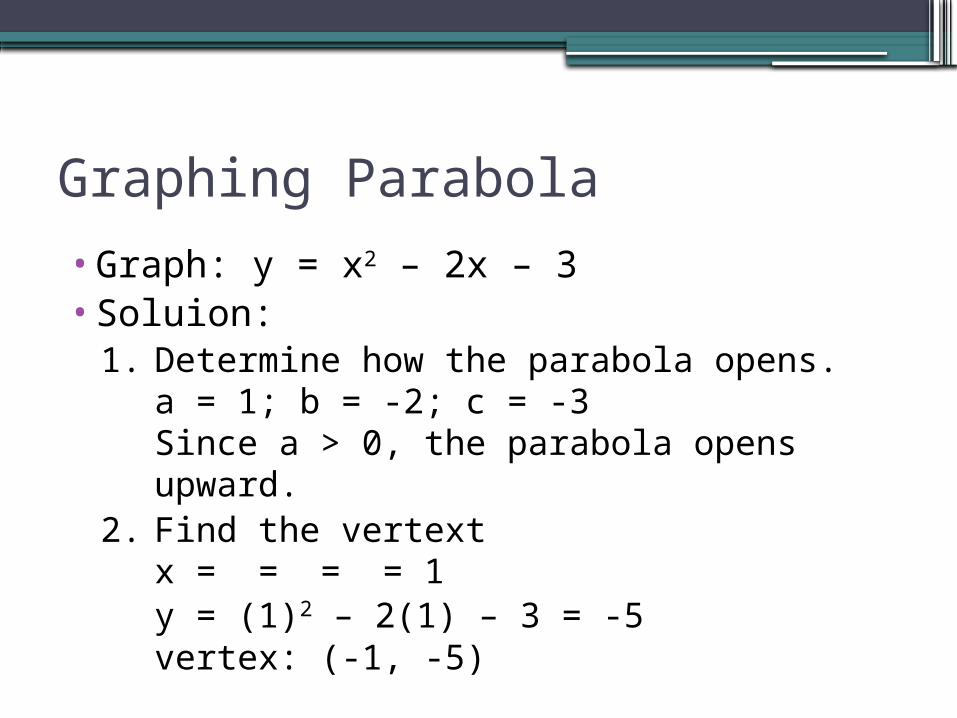
Graphing Parabola
•Graph: y = x2 – 2x – 3•Soluion:
1. Determine how the parabola opens.a = 1; b = -2; c = -3Since a > 0, the parabola opens upward.
2. Find the vertextx = = = = 1y = (1)2 – 2(1) – 3 = -5vertex: (-1, -5)
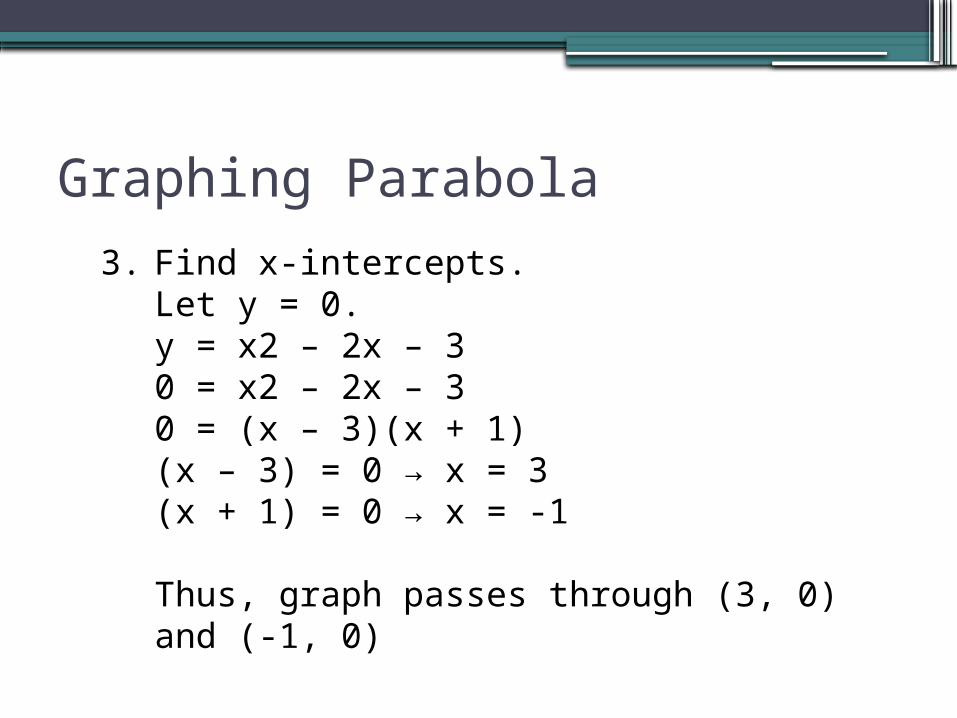
Graphing Parabola
3. Find x-intercepts.Let y = 0.y = x2 – 2x – 30 = x2 – 2x – 30 = (x – 3)(x + 1)(x – 3) = 0 → x = 3(x + 1) = 0 → x = -1
Thus, graph passes through (3, 0) and (-1, 0)
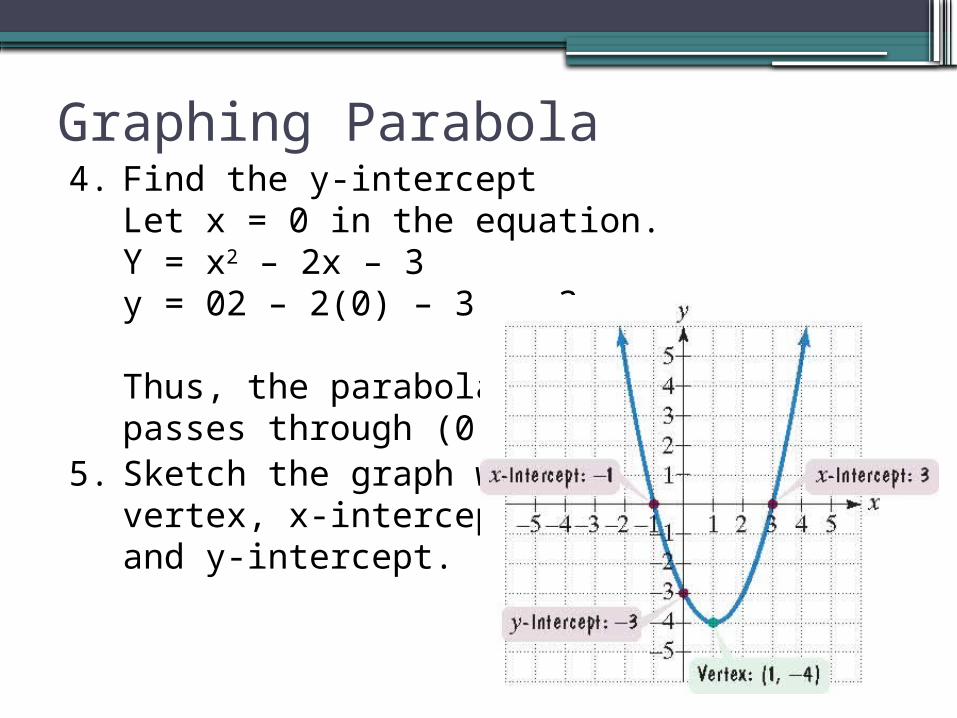
Graphing Parabola4. Find the y-intercept
Let x = 0 in the equation.Y = x2 – 2x – 3y = 02 – 2(0) – 3 = -3
Thus, the parabola passes through (0, -3)
5. Sketch the graph withvertex, x-intercepts,and y-intercept.