Embed Size (px)
Citation preview
Southern Rhode Island Regional Collaborative with process support from The Charles A. Dana Center at the University of Texas at Austin
25
Algebra 1, Quarter 3, Unit 3.1
Exponential Functions
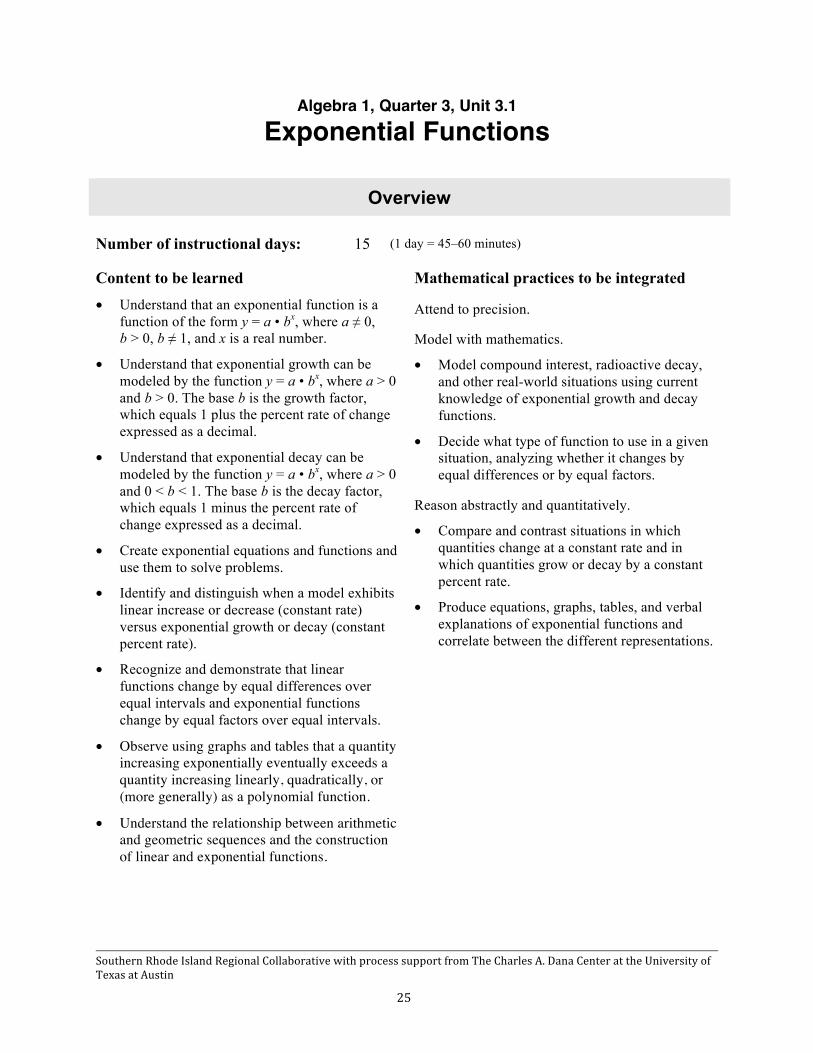
Overview Number of instructional days: 15 (1 day = 45–60 minutes)
Content to be learned Mathematical practices to be integrated • Understand that an exponential function is a
function of the form y = a • bx, where a ≠ 0, b > 0, b ≠ 1, and x is a real number.
• Understand that exponential growth can be modeled by the function y = a • bx, where a > 0 and b > 0. The base b is the growth factor, which equals 1 plus the percent rate of change expressed as a decimal.
• Understand that exponential decay can be modeled by the function y = a • bx, where a > 0 and 0 < b < 1. The base b is the decay factor, which equals 1 minus the percent rate of change expressed as a decimal.
• Create exponential equations and functions and use them to solve problems.
• Identify and distinguish when a model exhibits linear increase or decrease (constant rate) versus exponential growth or decay (constant percent rate).
• Recognize and demonstrate that linear functions change by equal differences over equal intervals and exponential functions change by equal factors over equal intervals.
• Observe using graphs and tables that a quantity increasing exponentially eventually exceeds a quantity increasing linearly, quadratically, or (more generally) as a polynomial function.
• Understand the relationship between arithmetic and geometric sequences and the construction of linear and exponential functions.
Attend to precision.
Model with mathematics.
• Model compound interest, radioactive decay, and other real-world situations using current knowledge of exponential growth and decay functions.
• Decide what type of function to use in a given situation, analyzing whether it changes by equal differences or by equal factors.
Reason abstractly and quantitatively.
• Compare and contrast situations in which quantities change at a constant rate and in which quantities grow or decay by a constant percent rate.
• Produce equations, graphs, tables, and verbal explanations of exponential functions and correlate between the different representations.

Algebra 1, Quarter 3, Unit 3.1 Exponential Functions (15 days)
Southern Rhode Island Regional Collaborative with process support from The Charles A. Dana Center at the University of Texas at Austin
26
Essential questions • What are the characteristics of exponential
functions?
• How do you identify, write, graph, and interpret quantities that grow or decay exponentially?
• What are the similarities and differences between linear and exponential functions and their graphs?
Written Curriculum
Common Core State Standards for Mathematical Content
Creating Equations★ A-CED
Create equations that describe numbers or relationships [Linear, quadratic, and exponential (integer inputs only); for A.CED.3 linear only]
A-CED.1 Create equations and inequalities in one variable and use them to solve problems. Include equations arising from linear and quadratic functions, and simple rational and exponential functions.★
Seeing Structure in Expressions A-SSE
Write expressions in equivalent forms to solve problems [Quadratic and exponential]
A-SSE.3 Choose and produce an equivalent form of an expression to reveal and explain properties of the quantity represented by the expression.★
c. Use the properties of exponents to transform expressions for exponential functions. For example the expression 1.15t can be rewritten as (1.151/12)12t ≈ 1.01212t to reveal the approximate equivalent monthly interest rate if the annual rate is 15%.
Linear, Quadratic, and Exponential Models★ F-LE
Construct and compare linear, quadratic, and exponential models and solve problems
F-LE.1 Distinguish between situations that can be modeled with linear functions and with exponential functions.★
a. Prove that linear functions grow by equal differences over equal intervals, and that exponential functions grow by equal factors over equal intervals.
b. Recognize situations in which one quantity changes at a constant rate per unit interval relative to another.
c. Recognize situations in which a quantity grows or decays by a constant percent rate per unit interval relative to another.
F-LE.2 Construct linear and exponential functions, including arithmetic and geometric sequences, given a graph, a description of a relationship, or two input-output pairs (include reading these from a table).★

Algebra 1, Quarter 3, Unit 3.1 Exponential Functions (15 days)
Southern Rhode Island Regional Collaborative with process support from The Charles A. Dana Center at the University of Texas at Austin
27
F-LE.3 Observe using graphs and tables that a quantity increasing exponentially eventually exceeds a quantity increasing linearly, quadratically, or (more generally) as a polynomial function.★
Interpret expressions for functions in terms of the situation they model [Linear and exponential of form f(x) = bx + k]
F-LE.5 Interpret the parameters in a linear or exponential function in terms of a context.★
Interpreting Functions F-IF
F-IF.8 Write a function defined by an expression in different but equivalent forms to reveal and explain different properties of the function.
b. Use the properties of exponents to interpret expressions for exponential functions. For example, identify percent rate of change in functions such as y = (1.02)t, y = (0.97)t, y = (1.01)12t, y = (1.2)t/10, and classify them as representing exponential growth or decay.
Common Core Standards for Mathematical Practice
4 Model with mathematics.
Mathematically proficient students can apply the mathematics they know to solve problems arising in everyday life, society, and the workplace. In early grades, this might be as simple as writing an addition equation to describe a situation. In middle grades, a student might apply proportional reasoning to plan a school event or analyze a problem in the community. By high school, a student might use geometry to solve a design problem or use a function to describe how one quantity of interest depends on another. Mathematically proficient students who can apply what they know are comfortable making assumptions and approximations to simplify a complicated situation, realizing that these may need revision later. They are able to identify important quantities in a practical situation and map their relationships using such tools as diagrams, two-way tables, graphs, flowcharts and formulas. They can analyze those relationships mathematically to draw conclusions. They routinely interpret their mathematical results in the context of the situation and reflect on whether the results make sense, possibly improving the model if it has not served its purpose.
6 Attend to precision.
Mathematically proficient students try to communicate precisely to others. They try to use clear definitions in discussion with others and in their own reasoning. They state the meaning of the symbols they choose, including using the equal sign consistently and appropriately. They are careful about specifying units of measure, and labeling axes to clarify the correspondence with quantities in a problem. They calculate accurately and efficiently, express numerical answers with a degree of precision appropriate for the problem context. In the elementary grades, students give carefully formulated explanations to each other. By the time they reach high school they have learned to examine claims and make explicit use of definitions.

Algebra 1, Quarter 3, Unit 3.1 Exponential Functions (15 days)
Southern Rhode Island Regional Collaborative with process support from The Charles A. Dana Center at the University of Texas at Austin
28
2 Reason abstractly and quantitatively.
Mathematically proficient students make sense of quantities and their relationships in problem situations. They bring two complementary abilities to bear on problems involving quantitative relationships: the ability to decontextualize—to abstract a given situation and represent it symbolically and manipulate the representing symbols as if they have a life of their own, without necessarily attending to their referents—and the ability to contextualize, to pause as needed during the manipulation process in order to probe into the referents for the symbols involved. Quantitative reasoning entails habits of creating a coherent representation of the problem at hand; considering the units involved; attending to the meaning of quantities, not just how to compute them; and knowing and flexibly using different properties of operations and objects.
Clarifying the Standards
Prior Learning
Students worked with radicals and integer exponents in grade 8. They applied the properties of integer exponents to generate equivalent numerical expressions. (8.EE.1) They evaluated square roots of small perfect squares and cube roots of small perfect cubes. (8.EE.2)
In Unit 2.3, students built and graphed linear, quadratic, and exponential functions. They wrote and used arithmetic and geometric sequences recursively and explicitly to model situations. Students graphed a variety of functions, including exponential using a table of values.
Current Learning
Students use the properties of exponents to transform expressions for exponential functions. (A.SSE.3c) Students distinguish between situations to model them with either linear or exponential functions. They construct linear and exponential functions given a graph, a description of a relationship, or two input-output pairs.
Future Learning
Students will expand their knowledge of exponential functions in Algebra II and Precalculus as they investigate logarithmic equations and learn methods for solving exponential equations. Analyzing functions and interpreting expressions for functions will be necessary skills for many future math and financial applications.
Additional Findings
Principles and Standards for School Mathematics notes, “Increasingly, discussions of change are found in the popular press and news reports. Students should be able to interpret statements such as ‘the rate of inflation is decreasing.’ The study of change in grades 9–12 is intended to give students a deeper understanding of the ways in which changes in quantities can be represented mathematically and of the concept of rate of change.” (p. 305)
Principles and Standards for School Mathematics continues by adding, “In high school, students should analyze situations in which quantities change in much more complex ways and in which the relationships between quantities and their rates of change are more subtle. Working problems of this type builds on the understandings of change developed in the middle grades and lays groundwork for the study of calculus.” (p. 305)

Southern Rhode Island Regional Collaborative with process support from The Charles A. Dana Center at the University of Texas at Austin
29
Algebra 1, Quarter 3, Unit 3.2
Univariate Data
Overview Number of instructional days: 10 (1 day = 45–60 minutes)
Content to be learned Mathematical practices to be integrated • Use different measures of central tendencies
and variability to summarize, interpret, and compare sets of data.
• Make and interpret frequency tables and their corresponding histograms.
• Recognize and choose appropriate ways to organize and display data (dotplot, histogram, boxplot).
• Interpret and recognize frequencies (including joint, marginal, and conditional relative frequencies) and possible associations and trends in data.
• Describe what an outlier is and how it can affect a measure of central tendency (shape, center, spread).
• Define, calculate, and interpret the standard deviation of a set of data.
• Decide when it is most appropriate to use mean and standard deviation to represent a set of data, as opposed to using median and interquartile range.
Model with mathematics.
• Explain correspondences between raw data and boxplots of the data.
• Explain correspondences between frequency tables, histograms, and raw data and search for regularity or trends within the data.
• Decide when it is most appropriate to use mean and standard deviation to represent data as opposed to when it is most appropriate to use median and interquartile range.
Use appropriate tools strategically.
• Use technology to calculate univariate statistics on large sets of data.
• Use technology to aid in the interpretation and the comparison of measures of central tendency and spread of data in two or more different data sets.
Attend to precision.
• Choose appropriate intervals when making frequency tables.
• Define and make explicit use of terms such as mode, median, mean, range, standard deviation, and interquartile range and calculate each quantity for a given data set.

Algebra 1, Quarter 3, Unit 3.2 Univariate Data (10 days)
Southern Rhode Island Regional Collaborative with process support from The Charles A. Dana Center at the University of Texas at Austin
30
Essential questions • How can categorical data be organized and
analyzed?
• How can you measure and compare the center and spread of a data set?
• Which measure of central tendency is most affected by an outlier? Why?
• What characteristics of a set of data help determine the best way to display the data?
• When is it most appropriate to use mean and standard deviation to represent a set of data as opposed to using median and interquartile range?
• How can you compare data sets using boxplots?
• How can you estimate statistics from data displayed in a histogram?
Written Curriculum
Common Core State Standards for Mathematical Content
Interpreting Categorical and Quantitative Data★ S-ID
Summarize, represent, and interpret data on a single count or measurement variable
S-ID.1 Represent data with plots on the real number line (dot plots, histograms, and box plots).★
S-ID.2 Use statistics appropriate to the shape of the data distribution to compare center (median, mean) and spread (interquartile range, standard deviation) of two or more different data sets.★
S-ID.3 Interpret differences in shape, center, and spread in the context of the data sets, accounting for possible effects of extreme data points (outliers).★
Summarize, represent, and interpret data on two categorical and quantitative variables [Linear focus, discuss general principle]
S-ID.5 Summarize categorical data for two categories in two-way frequency tables. Interpret relative frequencies in the context of the data (including joint, marginal, and conditional relative frequencies). Recognize possible associations and trends in the data.★
Common Core Standards for Mathematical Practice
4 Model with mathematics.
Mathematically proficient students can apply the mathematics they know to solve problems arising in everyday life, society, and the workplace. In early grades, this might be as simple as writing an addition equation to describe a situation. In middle grades, a student might apply proportional reasoning to plan a school event or analyze a problem in the community. By high school, a student might use geometry to solve a design problem or use a function to describe how one quantity of interest depends on another. Mathematically proficient students who can apply what they know are comfortable making assumptions and approximations to simplify a complicated situation, realizing that these may need revision later. They are able to identify important quantities in a practical situation and map their relationships using such tools as diagrams, two-way tables, graphs, flowcharts and formulas. They can analyze those relationships mathematically to draw conclusions. They routinely interpret their mathematical results in the context of

Algebra 1, Quarter 3, Unit 3.2 Univariate Data (10 days)
Southern Rhode Island Regional Collaborative with process support from The Charles A. Dana Center at the University of Texas at Austin
31
the situation and reflect on whether the results make sense, possibly improving the model if it has not served its purpose.
5 Use appropriate tools strategically.
Mathematically proficient students consider the available tools when solving a mathematical problem. These tools might include pencil and paper, concrete models, a ruler, a protractor, a calculator, a spreadsheet, a computer algebra system, a statistical package, or dynamic geometry software. Proficient students are sufficiently familiar with tools appropriate for their grade or course to make sound decisions about when each of these tools might be helpful, recognizing both the insight to be gained and their limitations. For example, mathematically proficient high school students analyze graphs of functions and solutions generated using a graphing calculator. They detect possible errors by strategically using estimation and other mathematical knowledge. When making mathematical models, they know that technology can enable them to visualize the results of varying assumptions, explore consequences, and compare predictions with data. Mathematically proficient students at various grade levels are able to identify relevant external mathematical resources, such as digital content located on a website, and use them to pose or solve problems. They are able to use technological tools to explore and deepen their understanding of concepts.
6 Attend to precision.
Mathematically proficient students try to communicate precisely to others. They try to use clear definitions in discussion with others and in their own reasoning. They state the meaning of the symbols they choose, including using the equal sign consistently and appropriately. They are careful about specifying units of measure, and labeling axes to clarify the correspondence with quantities in a problem. They calculate accurately and efficiently, express numerical answers with a degree of precision appropriate for the problem context. In the elementary grades, students give carefully formulated explanations to each other. By the time they reach high school they have learned to examine claims and make explicit use of definitions.
Clarifying the Standards
Prior Learning
Students represented and interpreted data in grades 1–8. In grades 2 and 3, students created pictures and bar graphs. In grades 4 and 5, students created line plots to display data. In grade 6, they understood that a set of data has a distribution that can be described by its center, spread, and overall shape. (6.SP.2) In grade 7, students used random sampling to draw inferences about a population (7.SP.2), and they used measures of center and measures of variability to draw informal comparative inferences about two populations. (7.SP.4) In grade 8, students constructed and interpreted a two-way table to summarize data and calculated relative frequencies for rows and columns. (8.SP.4)
Current Learning
Students represent univariate data using dotplots, histograms, one- and two-way frequency tables, and boxplots. They choose the appropriate measures of center (mean or median) and spread (interquartile range, standard deviation) distribution. Students interpret differences in shape, center, and spread and account for possible effects of outliers. They interpret relative frequencies in the data, including joint, marginal, and conditional relative frequencies.

Algebra 1, Quarter 3, Unit 3.2 Univariate Data (10 days)
Southern Rhode Island Regional Collaborative with process support from The Charles A. Dana Center at the University of Texas at Austin
32
Future Learning
Students will continue their study of statistics in Algebra II, fourth year of math (Precalculus), and AP Statistics. Analyzing and interpreting data are skills applicable to many careers and everyday life experiences.
Additional Findings
In Benchmarks for Science Literacy, the American Association for the Advancement of Science highlights the fact that “the middle of a data distribution may be misleading when the data are not distributed symmetrically, or when there are extreme high or low values, or when the distribution is not reasonably smooth. The way data are displayed can make a big difference in how they are interpreted.” It notes that, “As their mathematical sophistication grows during grades 9–12, students should be able to perform and make sense of more subtleties in collecting, describing, and interpreting data.” (p. 230)
Principles and Standards for School Mathematics sums it up by stating, “Describing center, spread, and shape is essential to the analysis of both univariate and bivariate data. Students should be able to use a variety of summary statistics and graphical displays to analyze these characteristics.” (p. 327)
A good teacher resource for examples and practice tasks is Navigating through Data Analysis in Grades 9–12 by the National Council of Teachers of Mathematics (NCTM).

Southern Rhode Island Regional Collaborative with process support from The Charles A. Dana Center at the University of Texas at Austin
33
Algebra 1, Quarter 3, Unit 3.3
Bivariate Data
Overview Number of instructional days: 10 (1 day = 45–60 minutes)
Content to be learned Mathematical practices to be integrated • Use a scatterplot to show the relationship
between two sets of data.
• Recognize when a set of data has a positive, negative, or no correlation.
• Explain how correlation describes the relationship between the independent and dependent variables.
• Draw a trend line and write an equation of that trend line.
• Use a trend line to make predictions and solve problems in the context of the data.
• Explain how residuals are plotted and use them to determine whether the model function is appropriate for the data.
• Explain how the slope and the y-intercept of a linear model can be interpreted in the context of a set of data.
• Use technology to compute and interpret the correlation coefficient of the line of the best fit.
• Use technology to fit different types of functions to a set of data and choose which best fits the set.
• Describe an experiment that could illustrate causation (e.g., class attendance and grade). Explain how that differs from correlation.
Attend to precision.
• Determine whether a set of data is univariate or bivariate.
• Distinguish between correlation and causation.
Model with mathematics.
• Fit a linear function to a scatterplot that suggests a linear association.
• Interpret what the correlation coefficient means in terms of a given situation.
Use appropriate tools strategically.
• Use technology to compute the correlation coefficient for a given set of data.
• Use technology to fit the most appropriate function to a set of bivariate data.

Algebra 1, Quarter 3, Unit 3.3 Bivariate Data (10 days)
Southern Rhode Island Regional Collaborative with process support from The Charles A. Dana Center at the University of Texas at Austin
34
Essential questions • How do you decide whether it makes sense to
model data using a linear function?
• How do you distinguish between correlation and causation?
• What are the limitations involved with using linear models to make predictions from a data set?
• How does the correlation coefficient describe the association between paired data?
• How do you use residuals to evaluate the appropriateness of the line of best fit?
Written Curriculum
Common Core State Standards for Mathematical Content
Interpreting Categorical and Quantitative Data★ S-ID
Summarize, represent, and interpret data on two categorical and quantitative variables [Linear focus, discuss general principle]
S-ID.6 Represent data on two quantitative variables on a scatter plot, and describe how the variables are related.★
a. Fit a function to the data; use functions fitted to data to solve problems in the context of the data. Use given functions or choose a function suggested by the context. Emphasize linear, quadratic, and exponential models.
b. Informally assess the fit of a function by plotting and analyzing residuals.
c. Fit a linear function for a scatter plot that suggests a linear association.
Interpret linear models
S-ID.7 Interpret the slope (rate of change) and the intercept (constant term) of a linear model in the context of the data.★
S-ID.8 Compute (using technology) and interpret the correlation coefficient of a linear fit.★
S-ID.9 Distinguish between correlation and causation.★
Common Core Standards for Mathematical Practice
4 Model with mathematics.
Mathematically proficient students can apply the mathematics they know to solve problems arising in everyday life, society, and the workplace. In early grades, this might be as simple as writing an addition equation to describe a situation. In middle grades, a student might apply proportional reasoning to plan a school event or analyze a problem in the community. By high school, a student might use geometry to solve a design problem or use a function to describe how one quantity of interest depends on another. Mathematically proficient students who can apply what they know are comfortable making assumptions and approximations to simplify a complicated situation, realizing that these may need revision later. They are able to identify important quantities in a practical situation and map their relationships using such

Algebra 1, Quarter 3, Unit 3.3 Bivariate Data (10 days)
Southern Rhode Island Regional Collaborative with process support from The Charles A. Dana Center at the University of Texas at Austin
35
tools as diagrams, two-way tables, graphs, flowcharts and formulas. They can analyze those relationships mathematically to draw conclusions. They routinely interpret their mathematical results in the context of the situation and reflect on whether the results make sense, possibly improving the model if it has not served its purpose.
5 Use appropriate tools strategically.
Mathematically proficient students consider the available tools when solving a mathematical problem. These tools might include pencil and paper, concrete models, a ruler, a protractor, a calculator, a spreadsheet, a computer algebra system, a statistical package, or dynamic geometry software. Proficient students are sufficiently familiar with tools appropriate for their grade or course to make sound decisions about when each of these tools might be helpful, recognizing both the insight to be gained and their limitations. For example, mathematically proficient high school students analyze graphs of functions and solutions generated using a graphing calculator. They detect possible errors by strategically using estimation and other mathematical knowledge. When making mathematical models, they know that technology can enable them to visualize the results of varying assumptions, explore consequences, and compare predictions with data. Mathematically proficient students at various grade levels are able to identify relevant external mathematical resources, such as digital content located on a website, and use them to pose or solve problems. They are able to use technological tools to explore and deepen their understanding of concepts.
6 Attend to precision.
Mathematically proficient students try to communicate precisely to others. They try to use clear definitions in discussion with others and in their own reasoning. They state the meaning of the symbols they choose, including using the equal sign consistently and appropriately. They are careful about specifying units of measure, and labeling axes to clarify the correspondence with quantities in a problem. They calculate accurately and efficiently, express numerical answers with a degree of precision appropriate for the problem context. In the elementary grades, students give carefully formulated explanations to each other. By the time they reach high school they have learned to examine claims and make explicit use of definitions.
Clarifying the Standards
Prior Learning
In grade 8, students constructed and interpreted scatterplots for bivariate data to investigate patterns of association between two quantities. They described patterns such as clustering, outliers, positive or negative association, linear association, and nonlinear association. (8.SP1) Students informally determined a line of best fit for a scatterplot and informally assessed the fit by judging the closeness of the data points to the line. (8.SP2) They used the equation of a linear model to solve problems in context and interpreted the slope and intercept. (8.SP3) In the previous unit of this course, students represented univariate data with dotplots, histograms, and boxplots. (S-ID.1) Students compared the center and spread of two or more sets of data, and they interpreted differences in shape, center, and spread in the context of the data sets. (S-ID.2&3)

Algebra 1, Quarter 3, Unit 3.3 Bivariate Data (10 days)
Southern Rhode Island Regional Collaborative with process support from The Charles A. Dana Center at the University of Texas at Austin
36
Current Learning
Students fit a function to data and use functions fitted to data to solve problems in the context of the data. They informally assess the fit of a function by plotting and analyzing residuals. For a scatterplot that suggests a linear association, students determine the line of best fit. Using technology, students also find regression models for quadratic and exponential functions. They interpret the slope (rate of change) and the intercept (constant term) of a linear model in the context of the data. Using technology, students compute and then interpret the correlation coefficient of a linear fit. They distinguish between correlation and causation.
Future Learning
Students will continue their study of statistics in Algebra II, Precalculus, and AP Statistics. In college, many students will be required to take additional courses in statistics. A strong foundation in statistics is essential for many careers and also for everyday life.
Additional Findings
Principles and Standards for School Mathematics notes,
“Analyses of the relationships between two sets of measurement data are central in high school mathematics.” (p. 329)
“The natural link between statistics and algebra is developed in grades 9–12, as the student’s understandings of graphs and functions is applied to their work with bivariate data.” (p. 325)
A good teacher resource for examples and practice tasks is Navigating through Data Analysis in Grades 9–12 by the National Council of Teachers of Mathematics (NCTM).