Embed Size (px)
Citation preview

Abdulganiyu, S.S. & Sodiq, O.A. (2017). J. Agric. Environ. Sci. 2(1): 35-49 ISSN: 2616-3721 (Online); 2616-3713 (Print)
Publication of College of Agriculture and Environmental Sciences, Bahir Dar University 35
Linear Approach Almost Ideal Demand System Analysis of Main Vegetables
in Lagos State, Nigeria
Salau Shehu Abdulganiyu1* and Omotosho Abiola Sodiq
1
1College of Agriculture, Kwara State University, Malete, Nigeria
*Corresponding author: [email protected]
Received: November 11, 2018 Accepted: December 28, 2018
Abstract
The World Health Organization estimated that low vegetable intake was a factor enhancing high
mortality all over the world. Studies have shown that the level of vegetable intake in Nigeria was
low. Despite relatively cheap and abundant sources of micro nutrients found in vegetables, wide
spread cases of micro nutrient deficiencies are still common in the study area. Thus, this study
examined the demand for main vegetables in Lagos state. The result revealed that the average
monthly consumption per household was 21kg and 16kg in urban and rural Lagos respectively.
However, the average monthly expenditure per household was N2, 905.83 in urban and N2,
698.60 in rural areas of Lagos state. The result indicated that the coefficient of determination
(R2) falls between 0.54 and 0.92. In both areas the coefficients of all own price, and cross price
parameters and household size are all statistically significant at varying levels of probabilities.
Own price elasticity of demand for vegetables indicated that urban and rural areas are elastic
and inelastic, respectively. The values of income elasticity of demand are positive and greater
than 1, hence the demands for all the vegetables are elastic in nature in both areas. The cross
price elasticities for both urban and rural areas have negative signs and are therefore
complementary goods. Policies and strategies that would make vegetables available throughout
the year should be vigorously pursued. Furthermore, to enhance vegetable consumption in the
area, the public should be enlightened on the health benefits of vegetables.
Keywords: Vegetables, micronutrient deficiencies, demands, price elasticity, LA-AIDS

Abdulganiyu, S.S. & Sodiq, O.A. (2017). J. Agric. Environ. Sci. 2(1): 35-49 ISSN: 2616-3721 (Online); 2616-3713 (Print)
Publication of College of Agriculture and Environmental Sciences, Bahir Dar University 36
1. Introduction
All over the world, there were 868 million people, who suffered from undernourishment, in the
period of 2010-2012 and approximately two billion people had negative health consequences
caused by micronutrient deficiencies (FAO, 2012). The demand analyses for food items play a
critical role in tackling the undernourishment issue. Nigeria is blessed with good natural
resources, in spite of her rich agro-ecological diversity (Oladele et al., 2004). The country has
fertile soil that has the potential critically to add to global food security (Ariyo and Mortimore,
2011). However, the country is listed as the 54th
poorest country in the world (UNDP, 2007).
About 70.0% of the population lives on less than US $1.25 a day (IFAD, 2012).
The predominant food items in the Nigerian diets are starchy staple foods (rice, gari and yam)
and vegetables (okra, tomatoes, onion and pepper). Vegetables are horticultural crops, which are
one of the world most important foods consumed by more than half of the world’s population
(FAO, 2007). It has been an important food commodity for most of the people in sub-Saharan
Africa particularly West Africa (FAO, 2012).Vegetables are an important component of healthy
human diet. They are good sources of vitamins and minerals, vegetable proteins, protective
micronutrients and dietary fibers, which help to prevent constipation (Balasubramanian and
Ragunathan, 2012). They are foods with low energy density, i.e. with few calories in relation to
the volume of the food consumed, which favors maintenance of healthy body weight (USDA,
2009). Eating vegetables appears to help keep the brain young and may slow the mental decline
sometimes associated with growing old (Morris et al., 2006). A diet including mainly spinach
can boost memory power and help in cognition and better learning (Vishal, 2014).
There are no fewer than 33 vegetable markets in Lagos and the most prominent is Mile 12. Lagos
markets and traders face severe problems and at the same time constitute major challenges to
smooth traffic, the environment as well as enforcement of law and order. Mile 12 Market is
typically for all fresh food items in Lagos and popular for retailing in farm produce like pepper,
tomato, onions, okra and fluted pumpkin, fruits, yam and other edible goods, which are all
beautifully stacked in heaps of unending baskets. It is so popular far beyond the South West to
the East and North Central states. Vegetables are normally cultivated in the rural areas of Lagos,

Abdulganiyu, S.S. & Sodiq, O.A. (2017). J. Agric. Environ. Sci. 2(1): 35-49 ISSN: 2616-3721 (Online); 2616-3713 (Print)
Publication of College of Agriculture and Environmental Sciences, Bahir Dar University 37
while the smallholders bring greater percentages to the state from the northern part of the
country.
In spite of the numerous uses of vegetables, literatures have indicated that consumption of
vegetables in Africa fall short of the recommended daily intake (Hall et al., 2009). Daily intake
of fruit and vegetables in sub-Saharan Africa falls between 70 to 312 g per person per day, far
below the WHO/FAO minimum recommendation of 400g per person per day or 146kg per
person per year (Ruel et al., 2004). Low vegetable intake is a critical variable influencing
malnutrition and deaths all over the world (WHO, 2003). In Nigeria, micronutrient malnutrition
is well known as a challenge with negative economic implications (Adish, 2009).
The diets of urban dwellers are generally more diverse than those of their rural counterparts
(Smith et al., 2003). It is believed that this is due to a combination of factors including the
availability of a wider variety of foods in urban markets, the availability of storage facilities,
changes in life styles and cultural patterns. According to Fabiosa and Soliman (2008), urban
households show larger differentials in the elasticities for food and non-food items with much
smaller elasticities for the food categories. Rural households on the other hand, show higher
elasticities in the food categories, especially for meat, fish and dairy. However, urban households
are less responsive to income changes than are rural households in the food categories; and more
responsive in the non-food category. The main objective of the present study was therefore to
examine the demand for vegetables in Lagos state, Nigeria.
2. Hypotheses of the Study
In this study, the following null hypotheses were tested.
HO1: there is no significant difference between the consumption of vegetables in urban
and rural areas of Lagos state;
HO2: the determinants of the consumption of vegetables are not the same in urban and
rural areas;
HO3: there is no significant difference in the demand elasticities for vegetables in urban
and rural areas of state.

Abdulganiyu, S.S. & Sodiq, O.A. (2017). J. Agric. Environ. Sci. 2(1): 35-49 ISSN: 2616-3721 (Online); 2616-3713 (Print)
Publication of College of Agriculture and Environmental Sciences, Bahir Dar University 38
3. Justification of the Study
Vegetables consist of myriads of nutrients, which are beneficial to the body and can help prevent
diseases and maintain good health conditions if adequately consumed. This could lead to a
drastic reduction in the malnourished people in the state. They are relatively cheap sources of
essential micronutrients and are therefore cost effective. Studies on demand for vegetables in
Lagos state are rear in the literature. This study will broaden the understanding of household
level factors that influence the demand for vegetables in urban and rural areas of the state. The
result will assist in the promotional efforts to enhance vegetable consumption in the nearest
future.
Consumer demand is defined as the various quantities of a particular commodity that an
individual consumer is willing and able to buy as the price of that commodity varies with other
factors that affect or influence the demand held constant (Tomek and Robinson, 1991). Many
factors are known to affect or influence the demand for a product. These factors include own
price of the product, prices of other products, consumer’s income, tastes and preference
(Koutsoyiannis, 1980). Other factors or determinants of demand include distribution of income,
total population and its composition, government policy, weather, credit availability, advertising,
past levels of demand and habits. According to Pagot (1992), factors like availability of various
commodities, eating traditions and relative prices also affect demand.
According to Davis (1982), consumer demand theory investigates the food-expenditure
relationships through Engel’s demand curve, which is a functional relationship between
households in a given period. The slope of Engel’s curve measures the expenditure (income)
elasticity of demand. A positive, negative, or zero elasticity implies normal, inferior and neutral
goods respectively. Engel’s curve shows how purchases of food commodities change when
income changes. Engel ascertained that the lower the consumer’s money income, the greater the
proportion of that income spent on food.
Abdulganiyu, S.S. & Sodiq, O.A. (2017). J. Agric. Environ. Sci. 2(1): 35-49 ISSN: 2616-3721 (Online); 2616-3713 (Print)
Publication of College of Agriculture and Environmental Sciences, Bahir Dar University 39
4. Materials and Methods
4.1 Area of study
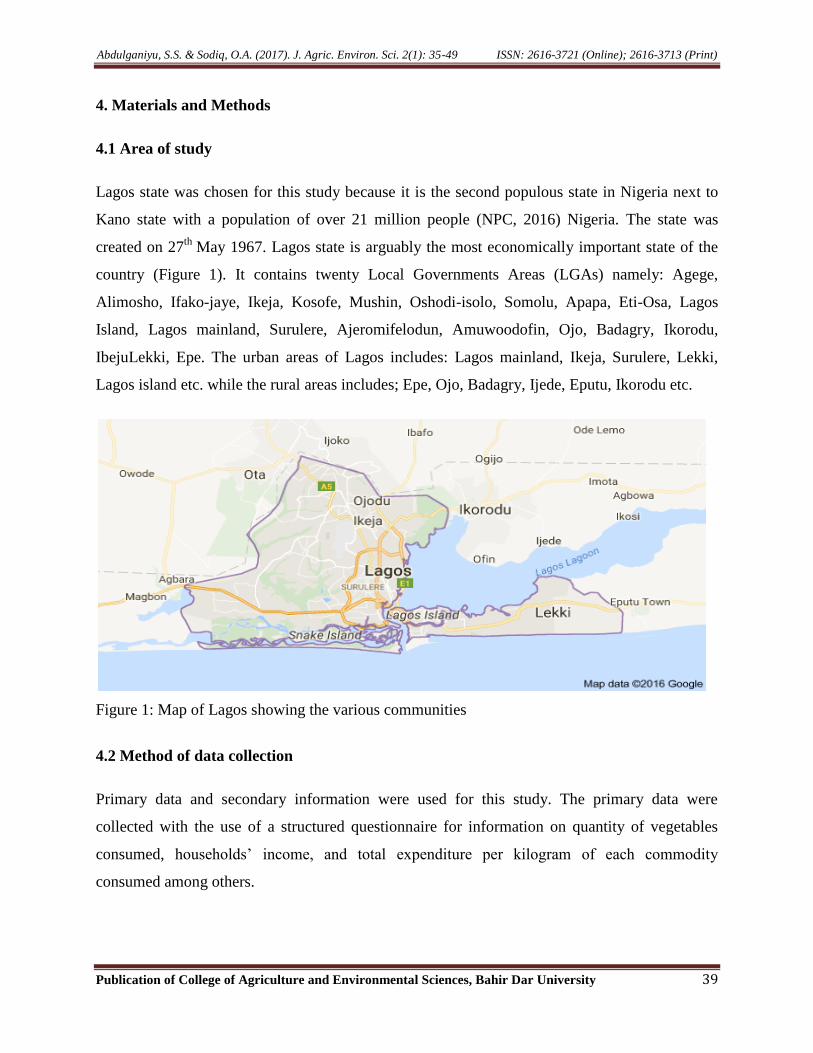
Lagos state was chosen for this study because it is the second populous state in Nigeria next to
Kano state with a population of over 21 million people (NPC, 2016) Nigeria. The state was
created on 27th
May 1967. Lagos state is arguably the most economically important state of the
country (Figure 1). It contains twenty Local Governments Areas (LGAs) namely: Agege,
Alimosho, Ifako-jaye, Ikeja, Kosofe, Mushin, Oshodi-isolo, Somolu, Apapa, Eti-Osa, Lagos
Island, Lagos mainland, Surulere, Ajeromifelodun, Amuwoodofin, Ojo, Badagry, Ikorodu,
IbejuLekki, Epe. The urban areas of Lagos includes: Lagos mainland, Ikeja, Surulere, Lekki,
Lagos island etc. while the rural areas includes; Epe, Ojo, Badagry, Ijede, Eputu, Ikorodu etc.
Figure 1: Map of Lagos showing the various communities
4.2 Method of data collection
Primary data and secondary information were used for this study. The primary data were
collected with the use of a structured questionnaire for information on quantity of vegetables
consumed, households’ income, and total expenditure per kilogram of each commodity
consumed among others.

Abdulganiyu, S.S. & Sodiq, O.A. (2017). J. Agric. Environ. Sci. 2(1): 35-49 ISSN: 2616-3721 (Online); 2616-3713 (Print)
Publication of College of Agriculture and Environmental Sciences, Bahir Dar University 40
4.3 Sampling methods
A three-stage sampling techniques was used in the selection of respondents. The first stage
involved random selection of 2 LGAs each of rural and urban areas of Lagos state. This was
followed by random selection of 2 communities each from the selected LGAs in both rural and
urban Lagos. Thirdly, 15 households were randomly selected in each community to make up a
sample size of 120 respondents each for both rural and urban areas of Lagos.
4.4 Analytical framework
Descriptive statistical tools such as mean, frequency distribution and percentages were used to
describe the socioeconomic characteristics of the respondents. Following Deaton and Muellbauer
(1980) and Afrif et al. (2014), Linear Approach Almost Ideal Demand System (LA-AIDS) was
used to examine the demand for vegetables as well as their elasticities. The model is given as:
𝑤𝑖= 𝛼𝑖 + 𝛾𝑗 𝑖𝑗 log 𝑃𝑗 + 𝛽 𝑖 log 𝑋
𝑝∗ + 𝜃𝑙𝑜𝑔𝐴𝑟𝑡 + 𝛿 log 𝐸𝑑𝑢 + 휀log Xpd
Where:
𝑤𝑖= budget share (expenditure proportion) of i community group with I =1,2,
3………………n
𝛼, 𝛽, 𝛾 = regression parameter for intercept, vegetable expenditure (with the weighing
price) and aggregate price from each commodity
𝜃, 𝛿, 휀 =regression parameter for the number of household member, education level of
household head and total expenditure of household
Pj = aggregate price of jth
commodity
X/p* = vegetable expenditure is divided by the index weighing price
Art = household size
Edu = education level of household’s head
Xpd = total expenditure of household
The formula used for calculating the demand elasticities from the model are:
Own price elasticity: 𝑒𝑖𝑖= 𝛾𝑖𝑖
𝑤𝑖− 1

Abdulganiyu, S.S. & Sodiq, O.A. (2017). J. Agric. Environ. Sci. 2(1): 35-49 ISSN: 2616-3721 (Online); 2616-3713 (Print)
Publication of College of Agriculture and Environmental Sciences, Bahir Dar University 41
Cross price elasticity: 𝑒𝑖𝑗 = 𝛾𝑖𝑗
𝑤𝑖 (𝑖 ≠ 𝑗)
Income elasticity: 𝑒𝑖𝑖 = 1 +𝛽𝑖
𝑤𝑖
5. Results and Discussion
5.1 Socioeconomic characteristics of the respondents
Majority (82.5% and 81.7%) of the respondents in urban and rural areas of Lagos respectively,
are male headed households. The average age of the respondents is 48 and 43 years in urban and
rural Lagos respectively. The average household size is 8 and 7 persons in the urban and rural
areas respectively. It is expected that the higher the household size the higher the demand for
vegetables (Table 1).
Table 1: Socio economic characteristics of respondents
Urban Rural Variable Minimum Maximum Mean Standard
deviation
Minimum Maximum Mean Standard
deviation
Age 19 60 48.01 11.504 19 60 43.18 10.586
Household Size 3 15 8 2.486 6 10 7 1.166
Years of education 6 17 9.6 4.408 6 17 9.23 4.201
Income (N) 60,000 300,000 107716 59279 40,000 250,00 90199 47121
Source: Field Survey 2017
The educational status of the household head was based on the numbers of years spent in school.
The average years of education are 9.6 years and 9.23 years in urban and rural areas of Lagos,
respectively. Ceteris paribus, the more the numbers of years spent in school the higher the
income. Furthermore, the average households’ income in rural is low (N 90,199) when
compared with N 107,716 earned by the urban households. This could play an important role in
stimulating vegetable consumption in the area.
5.2 Consumption level of five vegetable commodities in urban and rural areas of Lagos
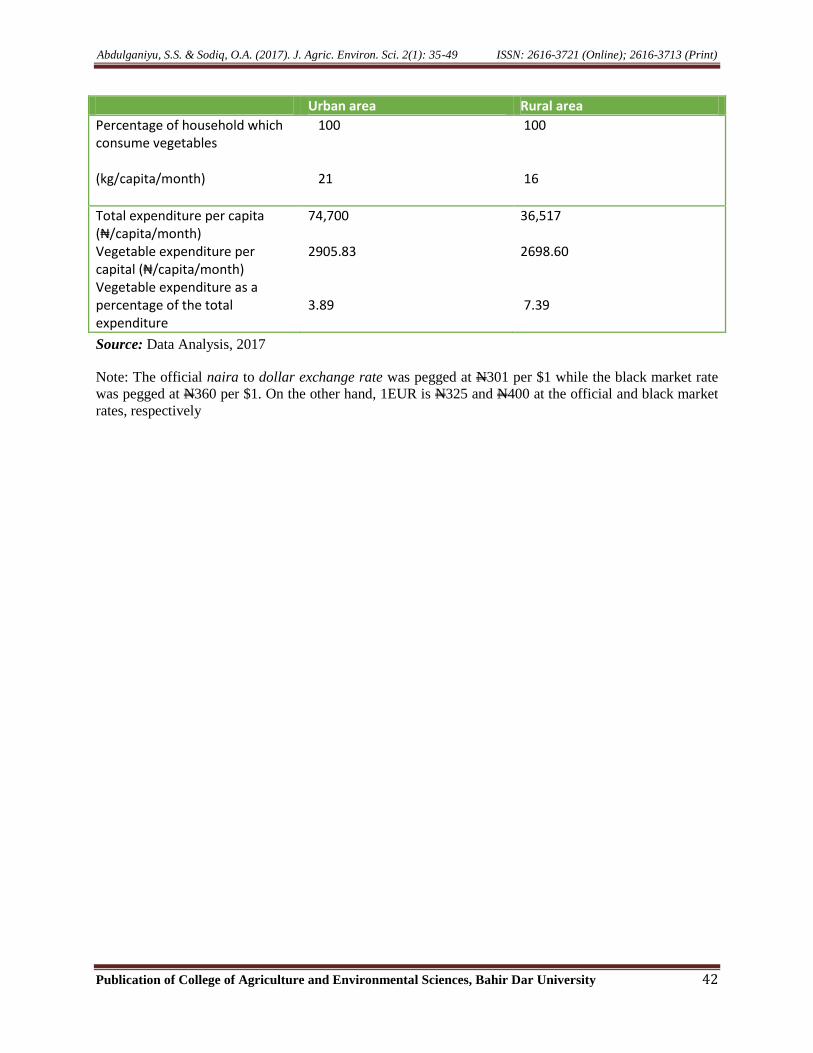
Table 2 reveals that all the households (100%) consumed vegetables. They consumed on the
average 21 kg in urban and 16 kg in rural areas of Lagos. On the average, every household
spends on monthly basis N 2,905.83 and N 2,698.60 on vegetables in urban and rural areas
respectively.
Table 2: Estimated vegetable consumption in urban and rural areas of Lagos
Abdulganiyu, S.S. & Sodiq, O.A. (2017). J. Agric. Environ. Sci. 2(1): 35-49 ISSN: 2616-3721 (Online); 2616-3713 (Print)
Publication of College of Agriculture and Environmental Sciences, Bahir Dar University 42
Urban area Rural area
Percentage of household which consume vegetables (kg/capita/month)
100 21
100 16
Total expenditure per capita (₦/capita/month) Vegetable expenditure per capital (₦/capita/month) Vegetable expenditure as a percentage of the total expenditure
74,700 2905.83 3.89
36,517 2698.60 7.39
Source: Data Analysis, 2017
Note: The official naira to dollar exchange rate was pegged at N301 per $1 while the black market rate
was pegged at N360 per $1. On the other hand, 1EUR is N325 and N400 at the official and black market
rates, respectively

Abdulganiyu, S.S. & Sodiq, O.A. (2017). J. Agric. Environ. Sci. 2(1): 35-49 ISSN: 2616-3721 (Online); 2616-3713 (Print)
Publication of College of Agriculture and Environmental Sciences, Bahir Dar University 43
5.3 Estimation of the model of complete demand of vegetables
Table 3 shows that the value of the coefficient of determination (R2) falls between 0.54 and 0.92.
Table 3: Estimates of LA-AIDS in urban areas of Lagos
Tomatoes Onion Pepper Okra Fluted pump.
Intercept 8.34154 ***
(0.480346)
12.5293 ** *
(1.50603)
13.4378 ***
(1.41676)
14.2083***
(2.16067)
14.2580 ***
(1.11455)
Ln(price of
tomatoes
0.0081***
(0.0000)
−1.20125***
(0.160261)
−1.19678 ** *
(0.158972)
−1.33176***
(0.228408)
−1.59679
***
(0.0965315)
Ln (price of
onion)
−0.279758 ***
(0.037323)
0.00175***
(0.0000)
−0.365694***
(0.0876689)
−0.429687 ***
(0.119196)
−0.530363
***
(0.0706090)
Ln (price of
pepper)
−0.282427 ***
(0.0375157)
−0.370563 ***
(0.0888362)
0.00162***
(0.000002)
−0.356811 ***
(0.122210)
−0.426415***
(0.0773418)
Ln (price of
okra)
−0.176054 ***
(0.0301948)
−0.243908 ***
(0.0676603)
−0.199879 ***
(0.0684599)
0.00175***
(0.000003)
−0.255804
***
(0.0606547)
Ln (price of
Fluted
pumpkin)
−0.445524 ***
(0.0269334)
−0.635401 ***
(0.0845930)
−0.504153 ***
(0.0914417)
−0.539894 ***
(0.128016)
0.00154**
(0.000002)
Ln(household
size)
0.0586281
(0.0522906)
0.0663392
(0.108785 )
0.214375 **
(0.106319)
0.0157076
(0.144622)
0.0500097
(0.0994405)
Ln(education) −0.0410254
(0.104411)
0.208563
(0.215601)
−0.317992
(0.212952)
0.548599 *
(0.282610)
0.213960
(0.196759)
Ln(income) −0.0333527
(0.0413330)
−0.0793321
(0.0855692)
−0.0629889
(0.0851240)
−0.244550 **
(0.111626)
−0.123114
(0.0776045)
Ln (stone price
index)
2.33344 ***
(0.0847274)
3.55509***
(0.357203)
3.30010 ** *
(0.374391)
3.55813 ***
(0.557952)
4.14702 ***
(0.215884)
Source: Data Analysis, 2017. Values in parentheses are the standard errors
The parameters are positive and significant at different levels ranging from 90%-99%. The
assumption of own price parameter is all significant at the level of 1% for both urban and rural
Lagos. This is in accordance with previous studies. The variables with positive signs suggest a
direct relationship between the price of another commodity and the commodity expenditure.
Most of the cross price parameters are negative and influences the proportion of vegetable
expenditure at 1% level. This implies that all the commodities have the opposing relation
between the expenditure proportions of one commodity with the price of another vegetable
commodity. The higher the price of another commodity the lower is the proportion of

Abdulganiyu, S.S. & Sodiq, O.A. (2017). J. Agric. Environ. Sci. 2(1): 35-49 ISSN: 2616-3721 (Online); 2616-3713 (Print)
Publication of College of Agriculture and Environmental Sciences, Bahir Dar University 44
commodity expenditure. Most of the coefficients of household size were not significant except
for the coefficient of pepper, which is positively signed and statistically significant at 5% level of
probability. The positive sign implies that an increase in household size ceteris paribus would
lead to an increase in budget share.
Also, the coefficients of education were not significant except for the coefficient of okra which is
positively signed and significant at 10% level of probability. This means education is not an
important variable as far as budget share is concerned. On the other hand, most of the
coefficients of income were negatively signed but not significant except for the coefficient of
okra, which is significant at 5% level of probability. The negative signs suggest as income
increases, the proportion of income spent on consumption decreases (Engel’s law).
In the rural areas of Lagos, the signs on the coefficients on all own price parameters are also
positive and significant at 1% level of probability. Most of the cross price parameters are
negative and important at 1% level of probability (Table 4).
Table 4: Estimates of LA-AIDS in rural areas of Lagos
Tomatoes
Onion
Pepper
Okra
Fluted pump
Intercept 8.88782*** (0.770357)
14.9338 ** *
(1.7333)
11.4328 ** *
(1.09423)
26.4045 ***
(3.21987)
13.7220 ***
(1.30277)
Ln(price of
tomatoes
0.0068*** (0.00002)
−0.824222 *** (0.168788)
−1.00903*** (0.0849777)
−2.43185 ***
(0.248285)
−1.28208 ** *
(0.0928288)
Ln (price of onion) −0.214549 *** (0.0439362)
(0.00065)** (0.0000)
−0.213305 ** (0.0621083)
−0.585159
***
(0.163800)
−0.364175 ***
(0.0700210)
Ln (price of
pepper)
−0.554505 *** (0.0466989)
−0.450320*** (0.131120)
(0.00043)*** (0.0000)
−1.23014 ***
(0.222537)
−0.783294 ***
(0.0857077)
Ln (price of okra) −0.190635 ***
(0.0194633)
−0.176221 ***
(0.0493286)
−0.175476 ***
(0.031744) (0.00038)*** (0.0000)
−0.232928 ***
(0.0367091)
Ln (price of Fluted
pumpkin)
−0.493063***
(0.0357003)
−0.538045 ***
(0.103451)
−0.548167 ***
(0.0599801)
−1.14273 ***
(0.180093) 0.00035** (0.0000)
Ln( household size) −0.105481 **
(0.0521692)
−0.177287 *
(0.102749)
0.0297328
(0.0716028)
−0.416961 **
(0.185556)
−0.170558 **
(0.0841154)
Ln(education) −0.0409277 **
(0.0338308
0.0351208
(0.0666612)
−0.0265628
(0.0458670)
−0.324411***
(0.117663)
−0.0202504
(0.0548776)
Ln(income) −0.0409277
(0.0338308)
−0.375484 ***
(0.129662)
0.0545426
(0.0924033)
−0.0650103
(0.244962)
0.110962
(0.110128)
Ln (stone price
index)
2.28736 ***
(0.0966933)
2.97302 ***
(0.370630)
2.63052 ***
(0.201112)
6.03736 ***
(0.626241)
3.38825 * **
(0.208441)

Abdulganiyu, S.S. & Sodiq, O.A. (2017). J. Agric. Environ. Sci. 2(1): 35-49 ISSN: 2616-3721 (Online); 2616-3713 (Print)
Publication of College of Agriculture and Environmental Sciences, Bahir Dar University 45
Source: Data Analysis, 2017. Values in parentheses are the standard errors
Most of the coefficients of household size were negative and important of at 5% and 10% levels
of probability. The negative signs imply that as the household size increases budget share on
vegetables also decreases. Few of the coefficients of education were negative and significant at
1% and 5% levels. This means education is an important variable influencing the budget share in
the rural areas of Lagos. On the other hand, most of the coefficients of income were negatively
signed, but not significant except for the coefficient of onion, which is important of at 1%.
5.4 Elasticity
Elasticity measures the responsiveness of quantity (demand or supply) to changes in the factors
that affect the demand or supply. Elasticity of demand is the responsiveness of quantity
demanded of a commodity to changes in the factors that cause the change in the demand. The
important elasticities of demand are: price, income and cross elasticity of demand (Table 5).
Table 5: Value of own price elasticity in rural and urban areas of Lagos
Area Tomatoes Onion Pepper Okra Fluted pumpkin
Urban area -0.87084 -0.56395 -0.76473 -0.56849 -0.74415
Rural area -0.81512 -0.23215 -0.70004 -0.67125 -0.63918
Source: Field Survey 2017
The own price elasticities for each commodity are negative for both the urban and rural areas.
This is in line with the law of demand, which states that the higher the price, the lower the
quantity demanded. Another notable characteristic is that all the price elasticities are less than 1.
This signifies that, the percentage change in quantity of each commodity is smaller than the
percentage change in price in both urban and rural Lagos. The elasticities values of all the
vegetables are higher in the urban than in the rural areas. This shows that the demand for
vegetables in urban and rural is elastic and inelastic respectively.
The income elasticity of demand is the proportionate change in the quantity demanded of a
commodity resulting from a proportionate change in the income of the consumer (Table 6). For
all the vegetables, the values are positive and greater than 1, hence the demand for all the

Abdulganiyu, S.S. & Sodiq, O.A. (2017). J. Agric. Environ. Sci. 2(1): 35-49 ISSN: 2616-3721 (Online); 2616-3713 (Print)
Publication of College of Agriculture and Environmental Sciences, Bahir Dar University 46
vegetables is elastic in nature. Income elasticity of demand is used to classify goods into
luxuries, necessities and inferior goods. Luxuries have income elasticity that is greater than 1,
necessities have income elasticity that is between 0 and 1 and inferior goods have income
elasticity that is less than 0. A good may not be superior or inferior every time, it depends on the
income level of the consumers (Engel’s law).
Table 6: Value of income elasticity in urban and rural areas of Lagos
Area Tomatoes Onion Pepper Okra Fluted
pumpkin
Urban area 1.505202 1.101812 1.153883 1.039816 1.199287
Rural area 1.436373 1.097128 1.212468 1.060899 1.203133
Source: Field Survey 2017
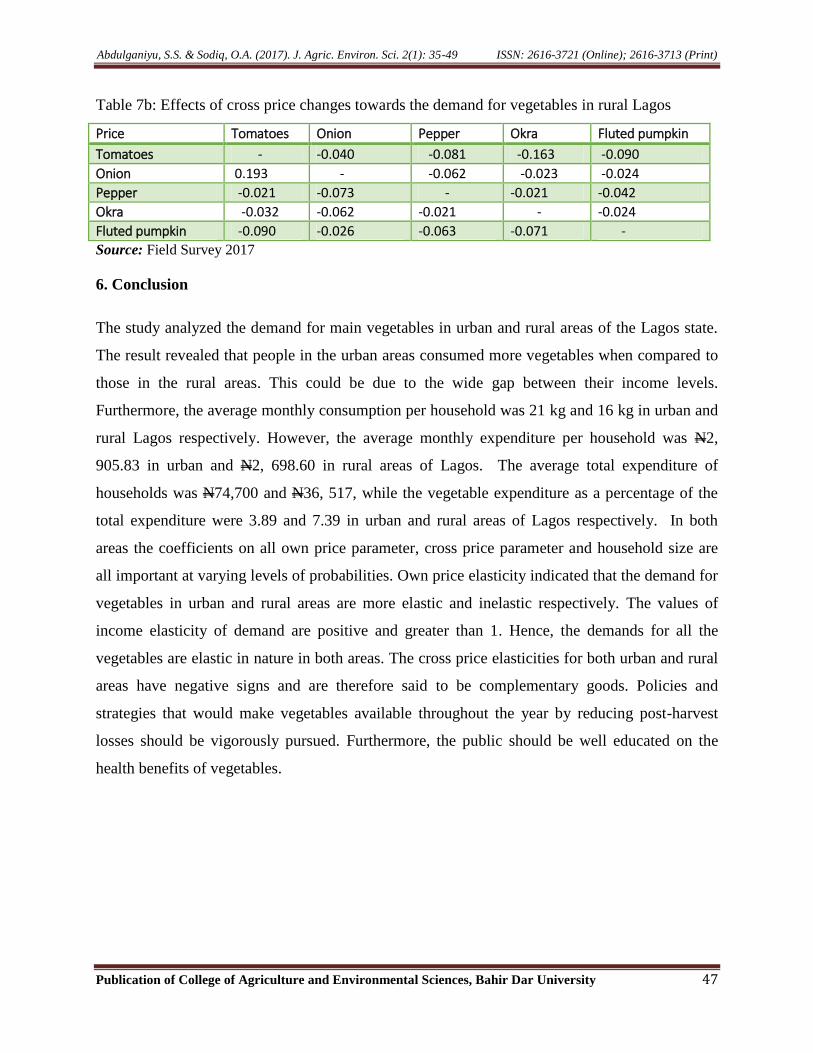
Cross elasticity is the proportionate change in the quantity demanded of a commodity (X)
resulting from a proportionate change in the price of another commodity (Y). Table 7a and Table
7b showed that the cross price elasticity for both urban and rural areas have negative signs. It is
normally used to classify goods as complementary and substitute goods. Complementary goods
have negative cross elasticity. On the other hand, substitutes have positive cross elasticity. The
higher the value of the cross elasticity, the stronger is the degree of substitutability or
complementarily of commodities X and Y.
Table 7a: Effects of cross price changes towards the demand for vegetables in urban Lagos
Price Tomatoes Onion Pepper Okra Fluted pumpkin
Tomatoes - -0.043 -0.060 -0.097 -0.027
Onion 0.0218 - -0.087 -0.027 -0.080
Pepper -0.020 -0,058 - -0.103 -0.087
Okra -0.024 -0071 -0.096 - -0.094
Fluted pumpkin -0.068 -0.039 -0.082 -0.062 -
Source: Field Survey 2017
Abdulganiyu, S.S. & Sodiq, O.A. (2017). J. Agric. Environ. Sci. 2(1): 35-49 ISSN: 2616-3721 (Online); 2616-3713 (Print)
Publication of College of Agriculture and Environmental Sciences, Bahir Dar University 47
Table 7b: Effects of cross price changes towards the demand for vegetables in rural Lagos
Price Tomatoes Onion Pepper Okra Fluted pumpkin
Tomatoes - -0.040 -0.081 -0.163 -0.090
Onion 0.193 - -0.062 -0.023 -0.024
Pepper -0.021 -0.073 - -0.021 -0.042
Okra -0.032 -0.062 -0.021 - -0.024
Fluted pumpkin -0.090 -0.026 -0.063 -0.071 -
Source: Field Survey 2017
6. Conclusion
The study analyzed the demand for main vegetables in urban and rural areas of the Lagos state.
The result revealed that people in the urban areas consumed more vegetables when compared to
those in the rural areas. This could be due to the wide gap between their income levels.
Furthermore, the average monthly consumption per household was 21 kg and 16 kg in urban and
rural Lagos respectively. However, the average monthly expenditure per household was N2,
905.83 in urban and N2, 698.60 in rural areas of Lagos. The average total expenditure of
households was N74,700 and N36, 517, while the vegetable expenditure as a percentage of the
total expenditure were 3.89 and 7.39 in urban and rural areas of Lagos respectively. In both
areas the coefficients on all own price parameter, cross price parameter and household size are
all important at varying levels of probabilities. Own price elasticity indicated that the demand for
vegetables in urban and rural areas are more elastic and inelastic respectively. The values of
income elasticity of demand are positive and greater than 1. Hence, the demands for all the
vegetables are elastic in nature in both areas. The cross price elasticities for both urban and rural
areas have negative signs and are therefore said to be complementary goods. Policies and
strategies that would make vegetables available throughout the year by reducing post-harvest
losses should be vigorously pursued. Furthermore, the public should be well educated on the
health benefits of vegetables.
Abdulganiyu, S.S. & Sodiq, O.A. (2017). J. Agric. Environ. Sci. 2(1): 35-49 ISSN: 2616-3721 (Online); 2616-3713 (Print)
Publication of College of Agriculture and Environmental Sciences, Bahir Dar University 48
References
Adish, A. (2009). Consequences of Micronutrient Deficiencies in Africa: Why we have to act.
Micronutrient initiative. www.micronutrient.org.
Afrif, I.S., Muhammed, F. and Dewi, S. (2014). Demand for the Main Vegetables in Java Island,
ISSAAS, 20 (2): 98-109
Ariyo, J.A. and Mortimore, M. (2011). “Land deals and commercial agriculture in Nigeria: the
new Nigerian farms in Shonga District, Kwara State.” In international conference
on global land grabbing, Institute of Development Studies, University of Sussex, pp.
6-8.
Balasubramanian, K. and Ragunathan, R. (2012). Study of antioxidant and anticancer activity of
natural sources. Journal of Natural Productive Plant Resources (1):192-197.
Davis, C.C. (1982). Linkages between Socio-economic Characteristics, Food Expenditure
Patterns and Nutritional Status of Low Income Households: A Critical Review. American
Journal of Agricultural Economics 64(5): 101 – 105.
Deaton, A., and Muellbauer, J. (1980). An Almost Ideal Demand System. American Economic
Review 70:312-326.
Fabiosa, J.F and Soliman, I. (2008). Egypt’s Household Expenditure Pattern: Does it alleviate a
Food Crisis? Working Paper 08-WP 475. Centre for Agriculture and Rural
Development, Iowa State University.
FAO, (2007). Food and Agriculture Organization of the United Nations Regional Office for Asia
and The Pacific, FAO, 2007. Selected Indicators of Food and Agricultural
Development in The Asia-Pacific Region, 1996-2006, Bangkok, 44p.
FAO, (2012). Food Supply, Crops Primary Equivalent, Food and Agriculture Organization of the
United Nations, Statistics Division (FAOSTAT). Available at
http://faostat.fao.org/site/609/DesktopDefault.aspx?PageID=609#ancor. (Accessed
January 14, 2015)
Hall, P. and Horowitz. J.L. (2009). Bootstrap Critical Values for Tests Based on Generalized
Method-of-Moments Estimators. Econometrica 64(4): 891-916.
IFAD, (2012). International Fund for Agricultural Development. Enabling poor rural people to
overcome poverty in Nigeria. Rome, Italy.
Koutsoyiannis, A. (1980). Modern Economic Theory, London. Macmillan Press.

Abdulganiyu, S.S. & Sodiq, O.A. (2017). J. Agric. Environ. Sci. 2(1): 35-49 ISSN: 2616-3721 (Online); 2616-3713 (Print)
Publication of College of Agriculture and Environmental Sciences, Bahir Dar University 49
NPC, (2016). National Population Commission (2016). Population Census Provisional Results –
Abuja.
Oladele, O.I., Koyoma, O. and Sakagami J.I. (2004). Africa in search of extension system:
Experience from Nigeria. Journal of Food Agriculture and Environment 2:276-280.
Pagot, J. (1992). Animal production in the Tropics and Sub-tropics. Macmillan, London and
Basingstoek/CTA Public.
Ruel, M.T., and Garrett, J.L. (2003). Features of urban food and nutrition security and
considerations for successful urban programming. Rome: FAO.
Ruel, M.T., Minot, N. and Smith L. (2005). Patterns and determinants of fruit and vegetable
consumption in sub-Saharan Africa: a multicountry comparison. World Health
Organization (WHO), Geneva.
Ruel, M.T. Minot, N. and Smith, L. (2004). Patterns and Determinants of Fruit and Vegetable
Consumption: A Multi-Country Comparison. International Food Policy Research
Institute. Washington D.C.
Smith, L.C., Ruel, M.T. and Ndiaye, A. (2003). Why is Child Malnutrition Lower in Urban than
Rural Areas? Evidence from 36 Developing Countries. Food Consumption and Nutrition
Division Discussion Paper. Washington, D.C: International Food Policy Research
Institute.
Tomek, W.G. and Robinson, K.L. (1991). Agricultural Products Prices. Third Edition. Cornel
University Press, Ithaca and London. 360p
UNDP, (2007). United Nations Development Programme (UNDP). (2007). Human Development
Report 2007/2008. New York: UNDP.
USDA (2009). Why is it important to eat fruit? http://www.mypyramid.gov. (Accessed August
01, 2012)
Vishal, I. (2014). Superfoods to boost your mental capacity. Lifehacher, India.
www.lifehacker.co.in. (Accessed March 31, 2013)
WHO, (2003). World Health Organization. Reducing Risks, Promoting Healthy Lives. WHO
Report, Geneva. www.fao.org. (Accessed June 17, 2010).