Embed Size (px)
Citation preview
I11-1©2008 PowerWorld Corporation
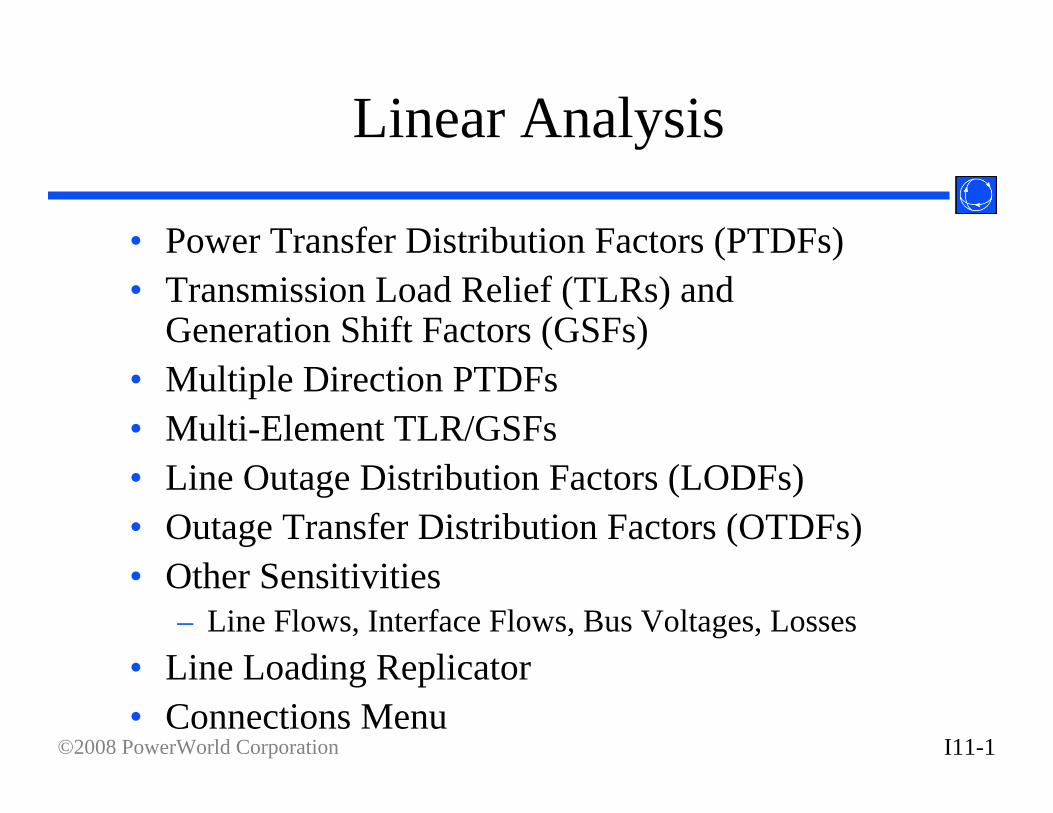
Linear Analysis
• Power Transfer Distribution Factors (PTDFs)• Transmission Load Relief (TLRs) and
Generation Shift Factors (GSFs)• Multiple Direction PTDFs• Multi-Element TLR/GSFs• Line Outage Distribution Factors (LODFs)• Outage Transfer Distribution Factors (OTDFs)• Other Sensitivities
– Line Flows, Interface Flows, Bus Voltages, Losses• Line Loading Replicator• Connections Menu
I11-2©2008 PowerWorld Corporation
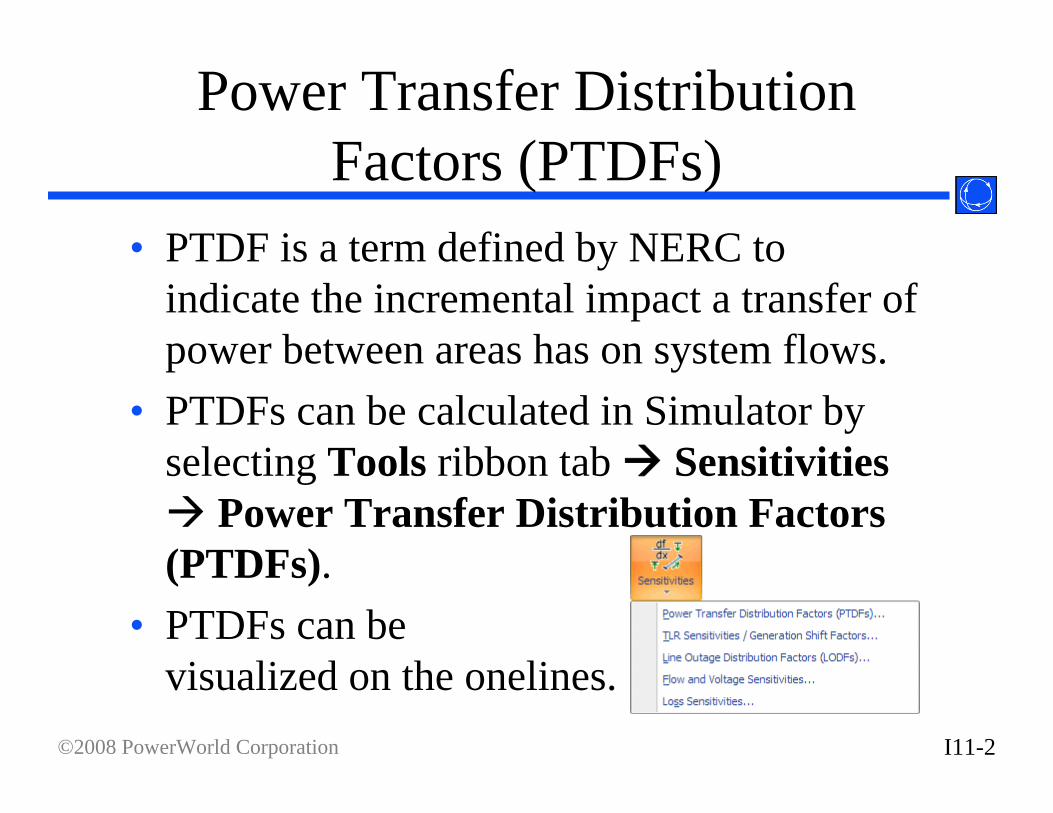
Power Transfer Distribution Factors (PTDFs)
• PTDF is a term defined by NERC to indicate the incremental impact a transfer of power between areas has on system flows.
• PTDFs can be calculated in Simulator by selecting Tools ribbon tab Sensitivities
Power Transfer Distribution Factors (PTDFs).
• PTDFs can be visualized on the onelines.
I11-3©2008 PowerWorld Corporation
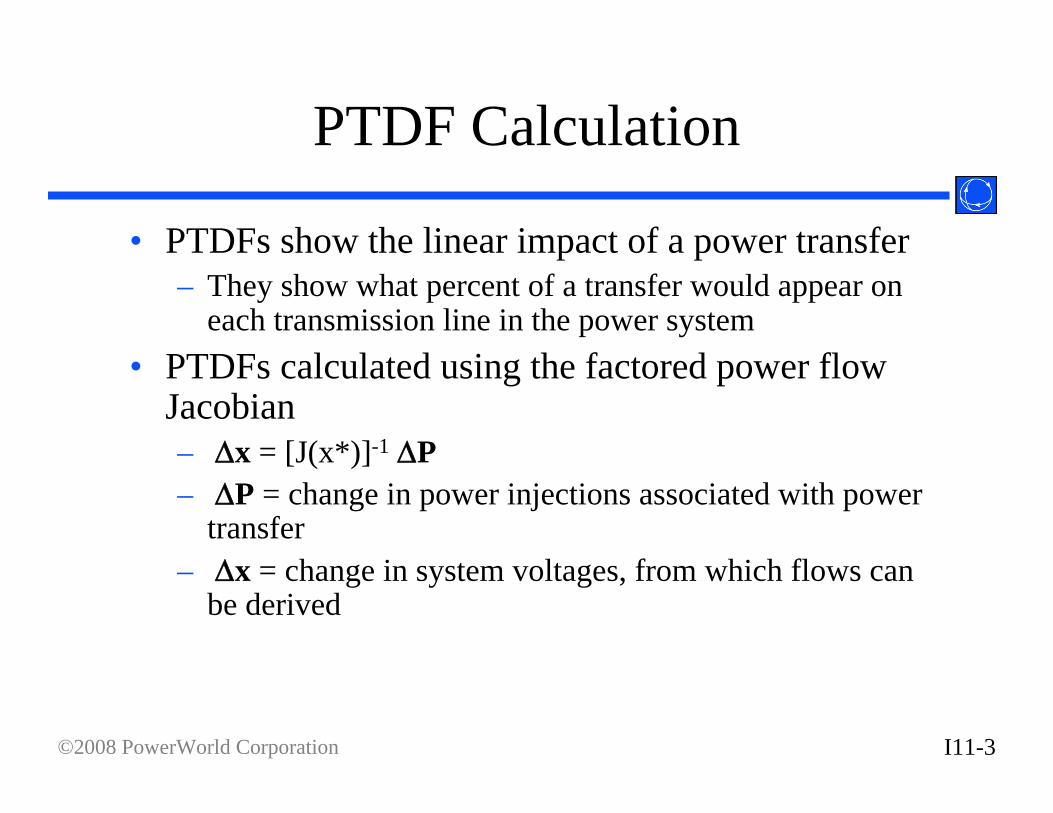
PTDF Calculation
• PTDFs show the linear impact of a power transfer– They show what percent of a transfer would appear on
each transmission line in the power system• PTDFs calculated using the factored power flow
Jacobian– ∆x = [J(x*)]-1 ∆P– ∆P = change in power injections associated with power
transfer– ∆x = change in system voltages, from which flows can
be derived
I11-4©2008 PowerWorld Corporation
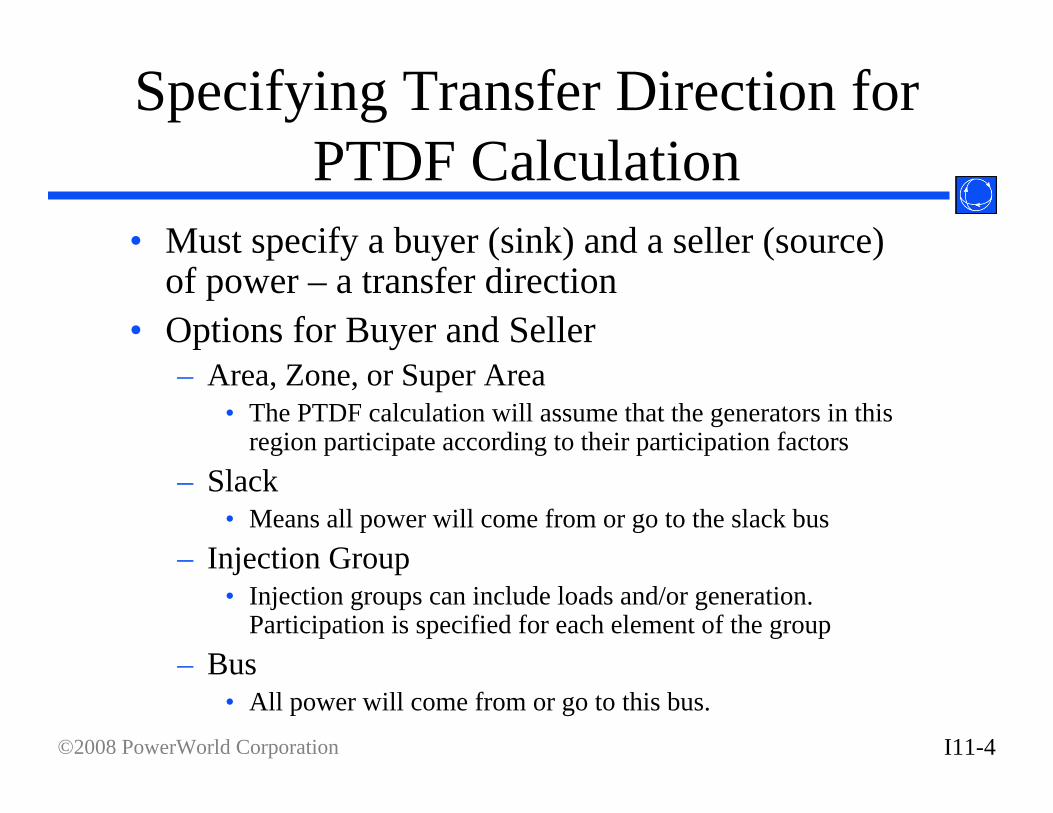
Specifying Transfer Direction for PTDF Calculation
• Must specify a buyer (sink) and a seller (source) of power – a transfer direction
• Options for Buyer and Seller– Area, Zone, or Super Area
• The PTDF calculation will assume that the generators in this region participate according to their participation factors
– Slack• Means all power will come from or go to the slack bus
– Injection Group• Injection groups can include loads and/or generation.
Participation is specified for each element of the group– Bus
• All power will come from or go to this bus.
I11-5©2008 PowerWorld Corporation
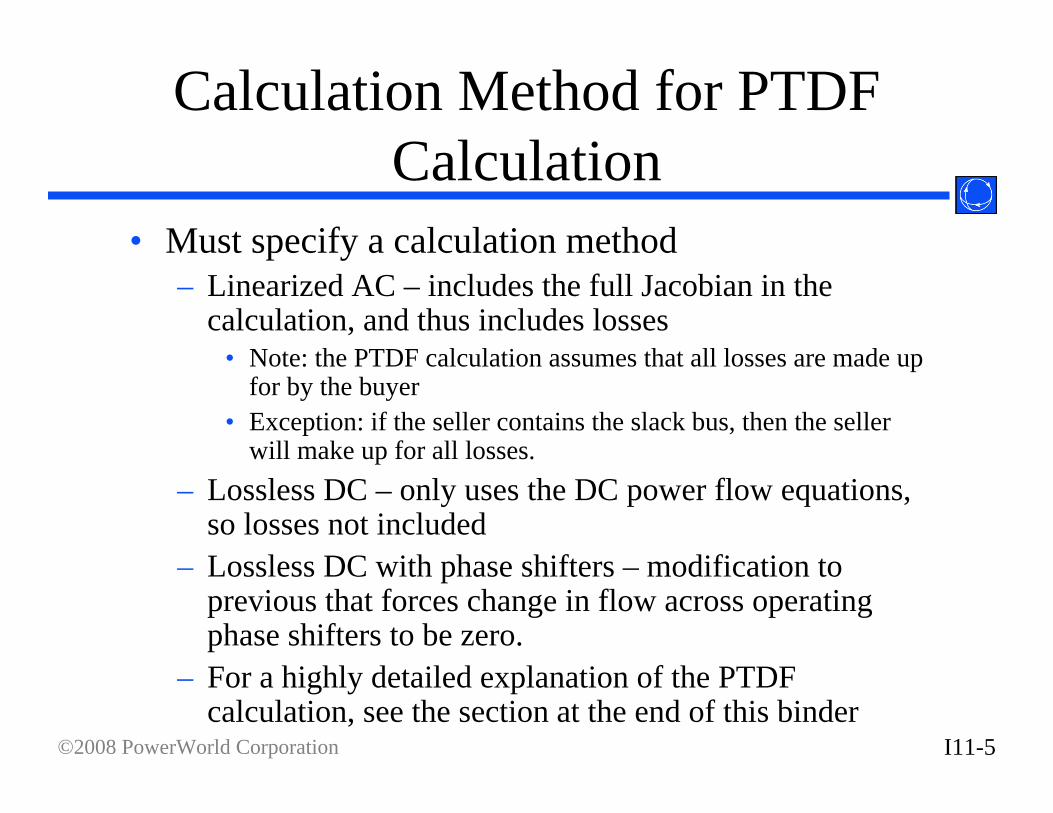
Calculation Method for PTDF Calculation
• Must specify a calculation method– Linearized AC – includes the full Jacobian in the
calculation, and thus includes losses• Note: the PTDF calculation assumes that all losses are made up
for by the buyer• Exception: if the seller contains the slack bus, then the seller
will make up for all losses.– Lossless DC – only uses the DC power flow equations,
so losses not included– Lossless DC with phase shifters – modification to
previous that forces change in flow across operating phase shifters to be zero.
– For a highly detailed explanation of the PTDF calculation, see the section at the end of this binder
I11-6©2008 PowerWorld Corporation
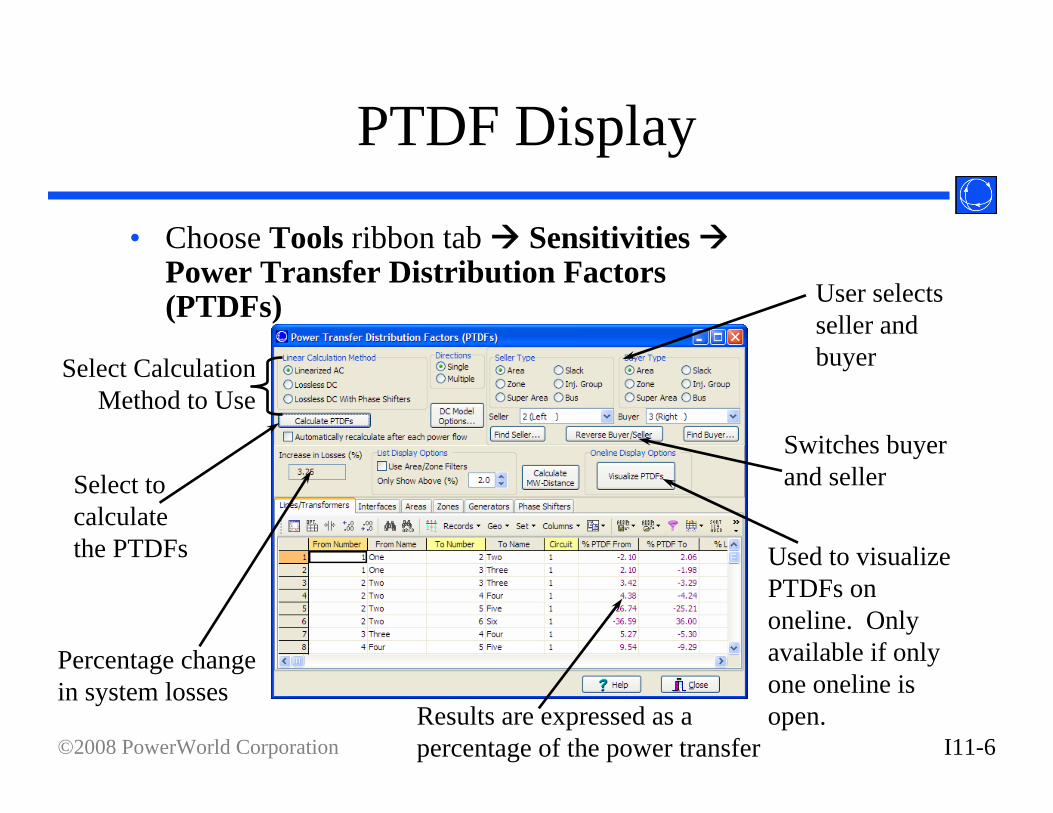
PTDF Display
• Choose Tools ribbon tab SensitivitiesPower Transfer Distribution Factors (PTDFs) User selects
seller and buyer
Select to calculatethe PTDFs Used to visualize
PTDFs ononeline. Only available if only one oneline is open.Results are expressed as a
percentage of the power transfer
Percentage change in system losses
Switches buyer and seller
Select Calculation Method to Use
I11-7©2008 PowerWorld Corporation
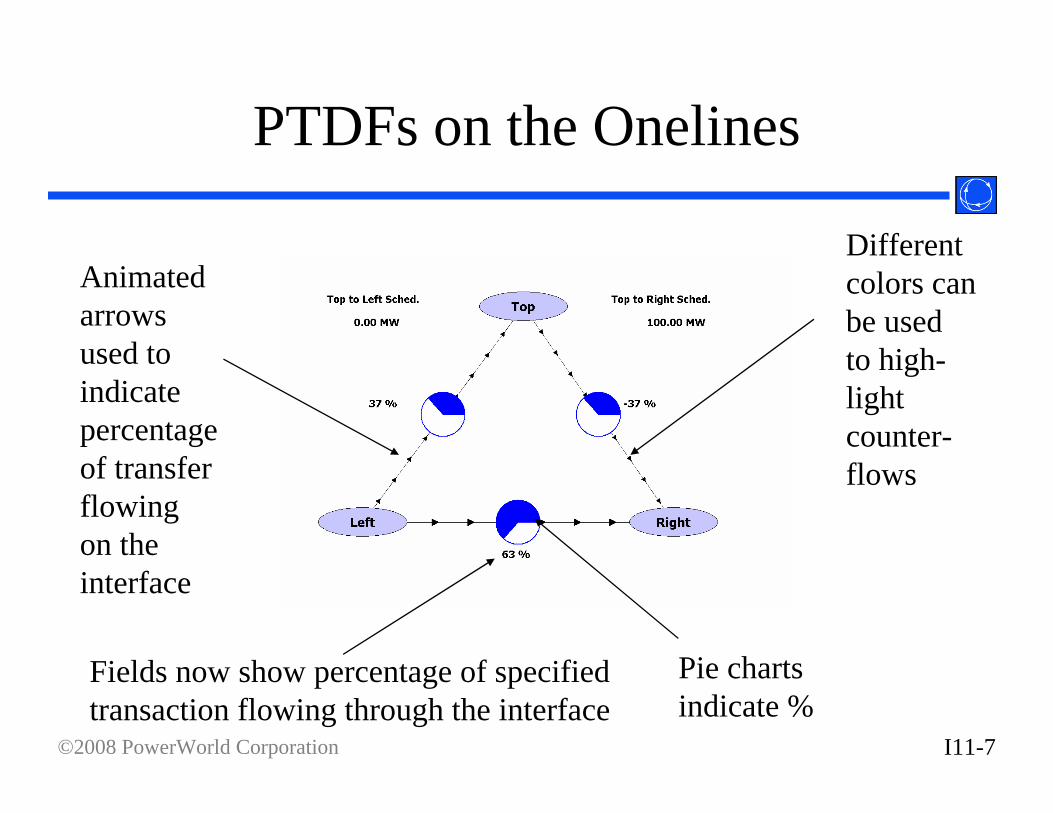
PTDFs on the Onelines
Fields now show percentage of specifiedtransaction flowing through the interface
Pie chartsindicate %
Differentcolors canbe usedto high-lightcounter-flows
Animatedarrowsused to indicatepercentageof transferflowingon theinterface
I11-8©2008 PowerWorld Corporation
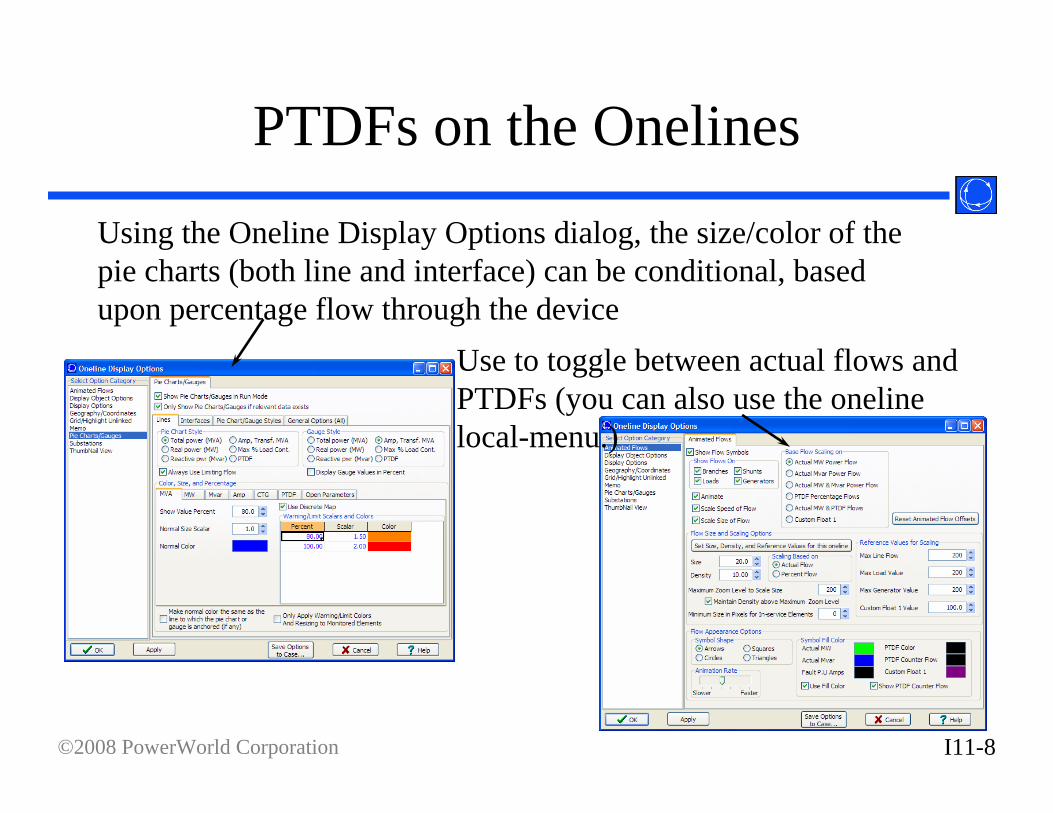
PTDFs on the Onelines
Use to toggle between actual flows and PTDFs (you can also use the onelinelocal-menu.)
Using the Oneline Display Options dialog, the size/color of the pie charts (both line and interface) can be conditional, based upon percentage flow through the device
I11-9©2008 PowerWorld Corporation
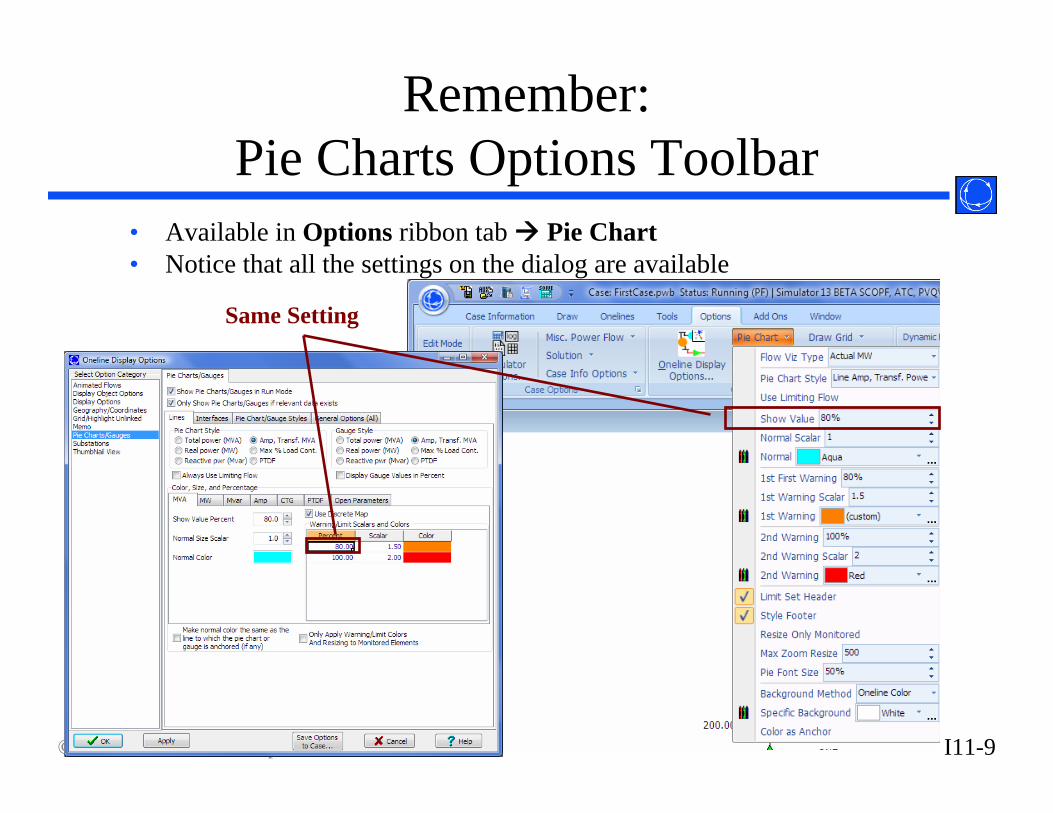
Remember: Pie Charts Options Toolbar
• Available in Options ribbon tab Pie Chart• Notice that all the settings on the dialog are available
Same Setting
I11-10©2008 PowerWorld Corporation
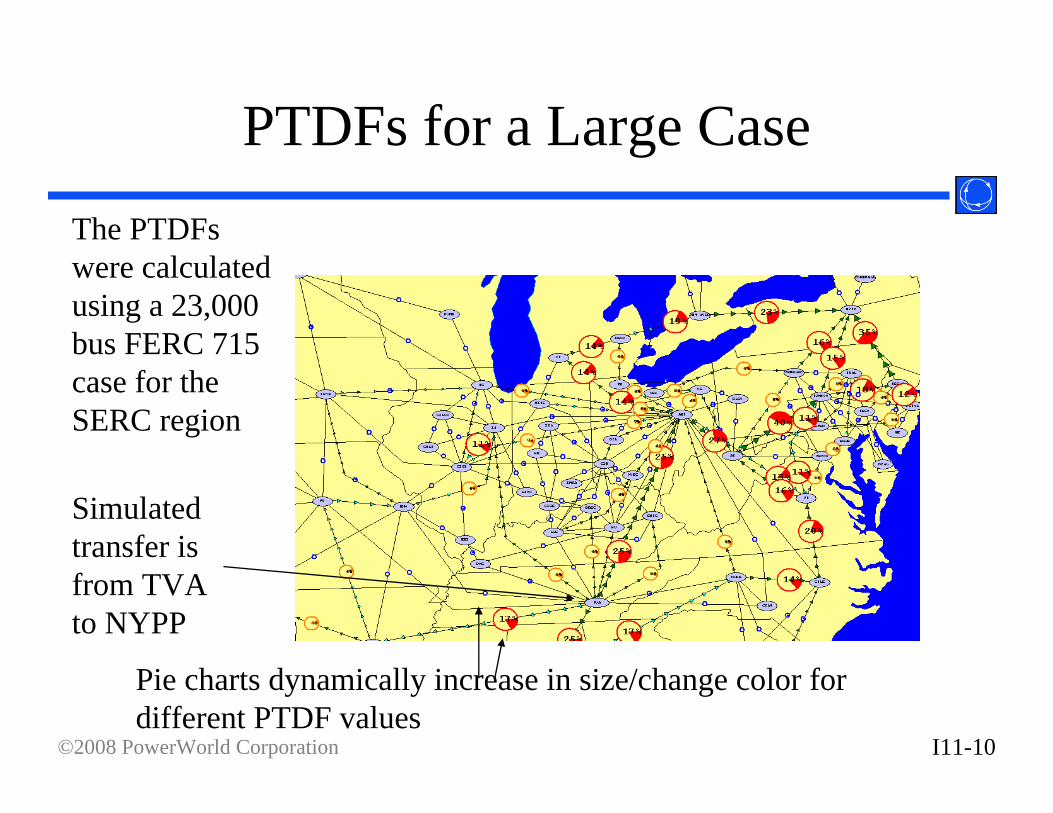
PTDFs for a Large CaseThe PTDFswere calculatedusing a 23,000bus FERC 715case for the SERC region
Simulatedtransfer isfrom TVAto NYPP
Pie charts dynamically increase in size/change color fordifferent PTDF values
I11-11©2008 PowerWorld Corporation
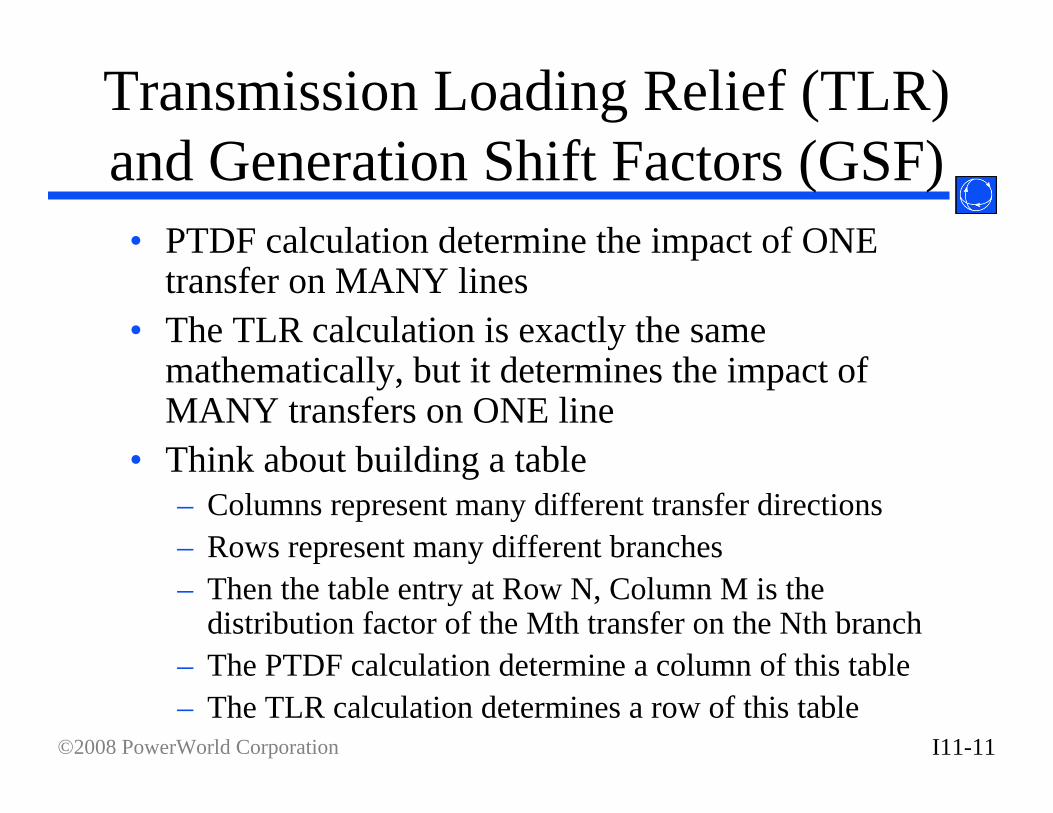
Transmission Loading Relief (TLR) and Generation Shift Factors (GSF)
• PTDF calculation determine the impact of ONE transfer on MANY lines
• The TLR calculation is exactly the same mathematically, but it determines the impact of MANY transfers on ONE line
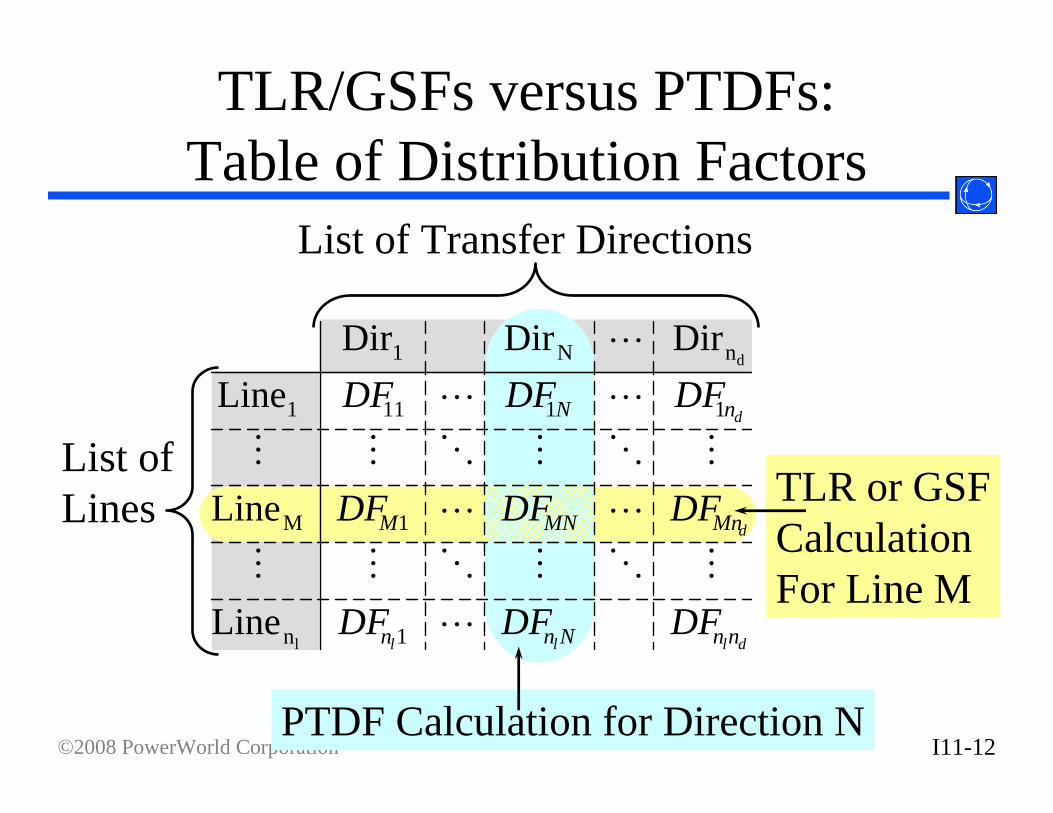
• Think about building a table – Columns represent many different transfer directions– Rows represent many different branches– Then the table entry at Row N, Column M is the
distribution factor of the Mth transfer on the Nth branch– The PTDF calculation determine a column of this table– The TLR calculation determines a row of this table
I11-12©2008 PowerWorld Corporation
dlll
d
d
nnNnn
MnMNM
nN
DFDFDF
DFDFDF
DFDFDF
L
MOMOMM
LL
MOMOMM
LL
L
1n
1M
11111
n N 1
l
d
Line
Line
LineDirDirDir
TLR/GSFs versus PTDFs:Table of Distribution Factors
List of Transfer Directions
List of Lines
PTDF Calculation for Direction N
TLR or GSFCalculationFor Line M
I11-13©2008 PowerWorld Corporation
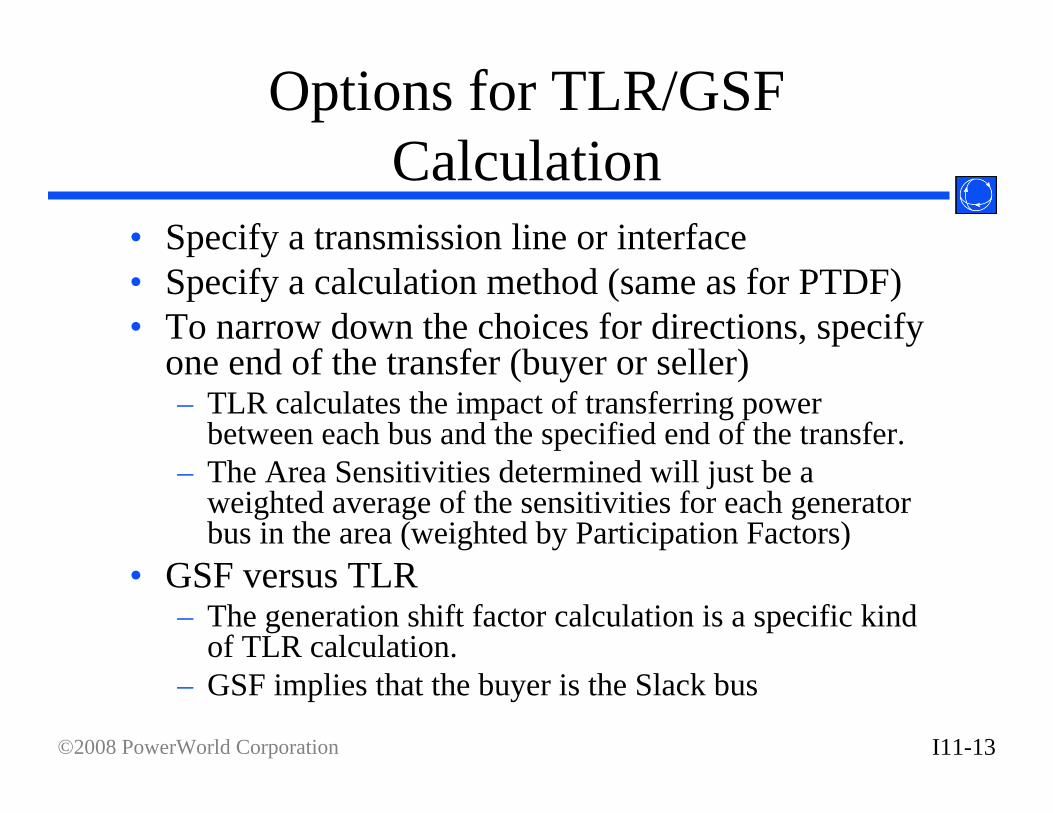
Options for TLR/GSF Calculation
• Specify a transmission line or interface• Specify a calculation method (same as for PTDF)• To narrow down the choices for directions, specify
one end of the transfer (buyer or seller)– TLR calculates the impact of transferring power
between each bus and the specified end of the transfer.– The Area Sensitivities determined will just be a
weighted average of the sensitivities for each generator bus in the area (weighted by Participation Factors)
• GSF versus TLR– The generation shift factor calculation is a specific kind
of TLR calculation.– GSF implies that the buyer is the Slack bus
I11-14©2008 PowerWorld Corporation
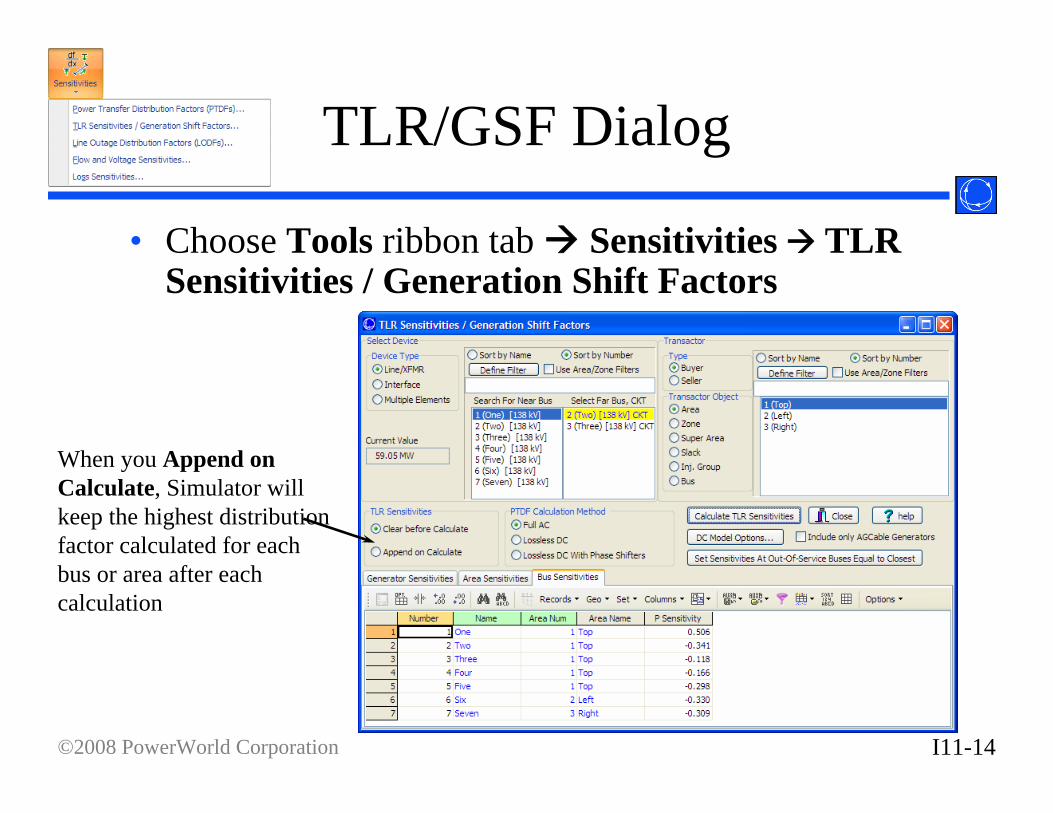
TLR/GSF Dialog
• Choose Tools ribbon tab Sensitivities TLR Sensitivities / Generation Shift Factors
When you Append on Calculate, Simulator will keep the highest distribution factor calculated for each bus or area after each calculation
I11-15©2008 PowerWorld Corporation
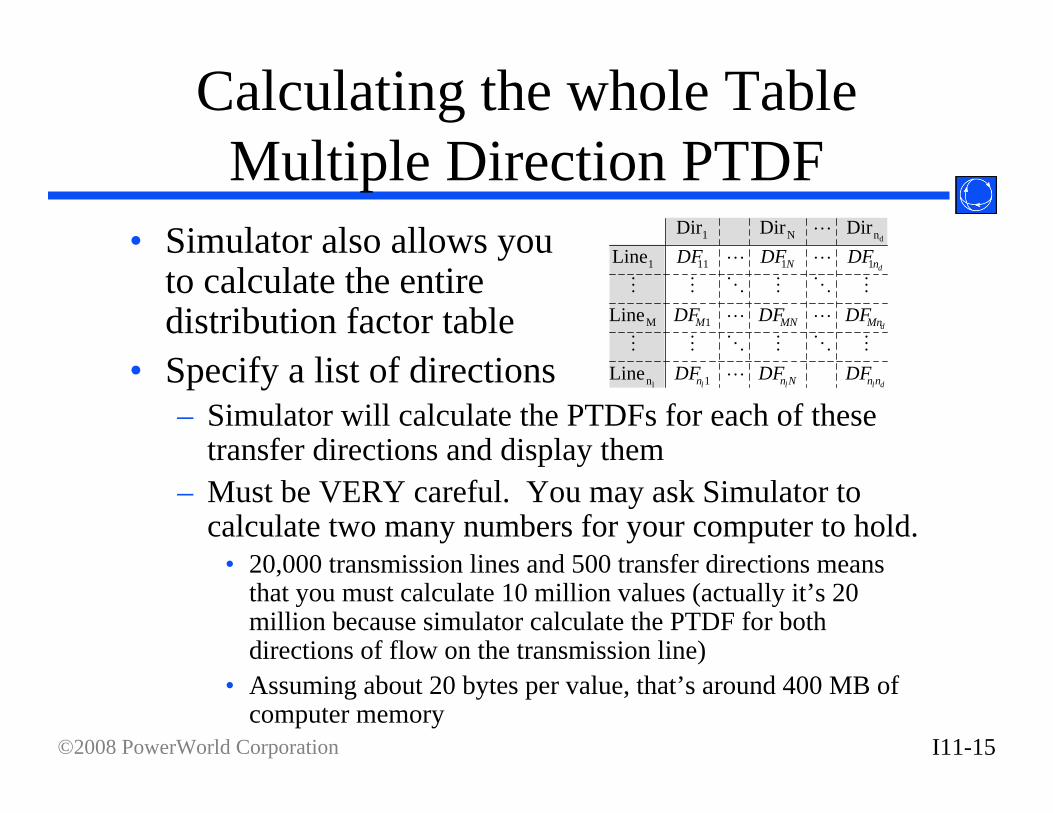
Calculating the whole TableMultiple Direction PTDF
• Simulator also allows you to calculate the entire distribution factor table
• Specify a list of directions– Simulator will calculate the PTDFs for each of these
transfer directions and display them– Must be VERY careful. You may ask Simulator to
calculate two many numbers for your computer to hold.• 20,000 transmission lines and 500 transfer directions means
that you must calculate 10 million values (actually it’s 20 million because simulator calculate the PTDF for both directions of flow on the transmission line)
• Assuming about 20 bytes per value, that’s around 400 MB of computer memory
dlll
d
d
nnNnn
MnMNM
nN
DFDFDF
DFDFDF
DFDFDF
L
MOMOMM
LL
MOMOMM
LL
L
1n
1M
11111
n N 1
l
d
Line
Line
LineDirDirDir
I11-16©2008 PowerWorld Corporation
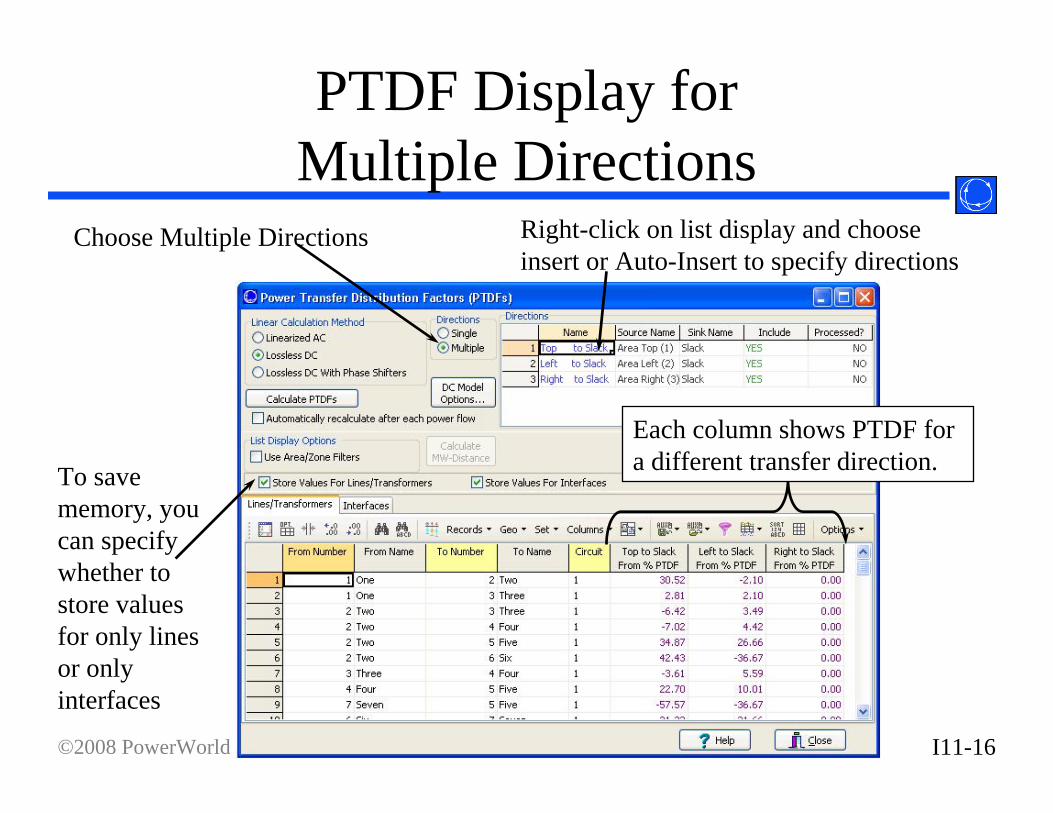
PTDF Display for Multiple Directions
Choose Multiple Directions Right-click on list display and choose insert or Auto-Insert to specify directions
To save memory, you can specify whether to store values for only lines or only interfaces
Each column shows PTDF for a different transfer direction.
I11-17©2008 PowerWorld Corporation
Calculating the whole TableTLR/GSF Multiple Elements
• Multiple Direction PTDFs work best for– A small number of Directions – A large number of lines/interfaces
• TLR/GSF Multiple Elements work best for– A large number of Directions/Buses– A small number lines/interfaces
I11-18©2008 PowerWorld Corporation
TLR/GSF Multiple Elements
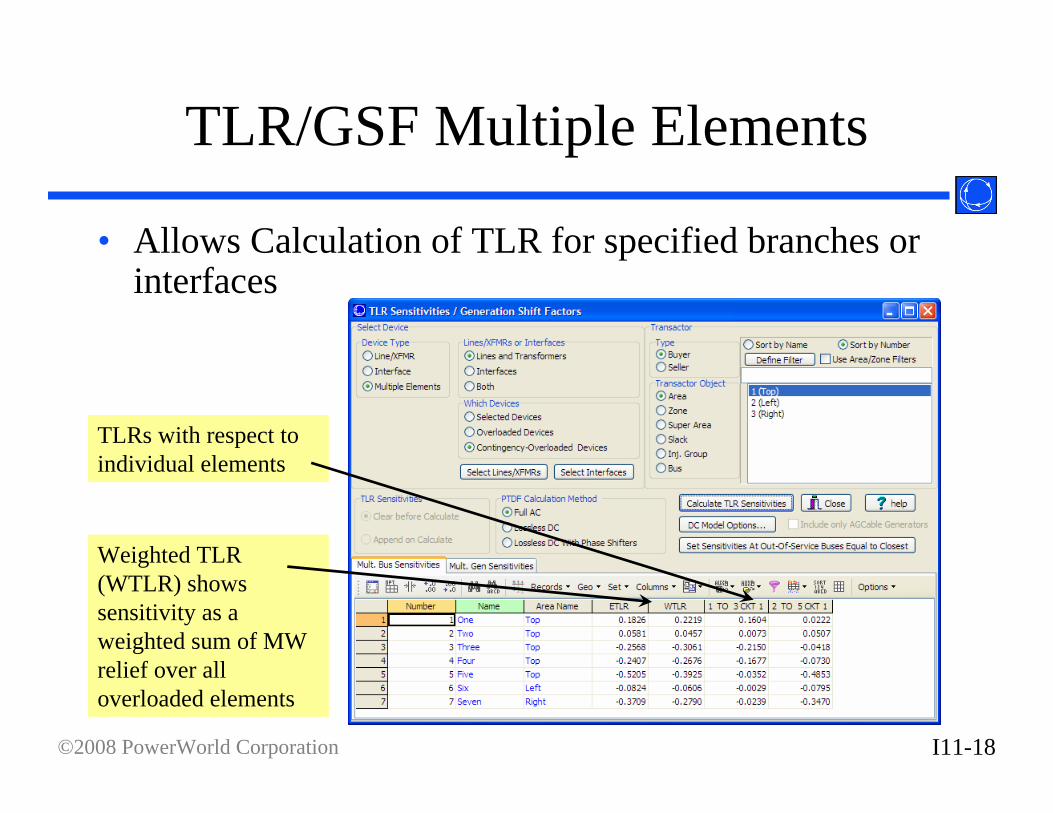
• Allows Calculation of TLR for specified branches or interfaces
Weighted TLR (WTLR) shows sensitivity as a weighted sum of MW relief over all overloaded elements
TLRs with respect to individual elements
I11-19©2008 PowerWorld Corporation
Line Outage Distribution Factors (LODFs)
• LODFs are another linearized calculation– Calculate the impact of opening (outaging) a
transmission branch on all the other branches in the case.
– Also can calculate the impact of closing in a branch (could call this called a Line Closure Distribution Factor or LCDF)
• Specify a transmission branch, and the calculation determines what percent of the flow on that line will appear on all other transmission lines– If the branch was initially open, then the LCDF will
calculate what percent of the post-closure flow on the line will appear on other lines
I11-20©2008 PowerWorld Corporation
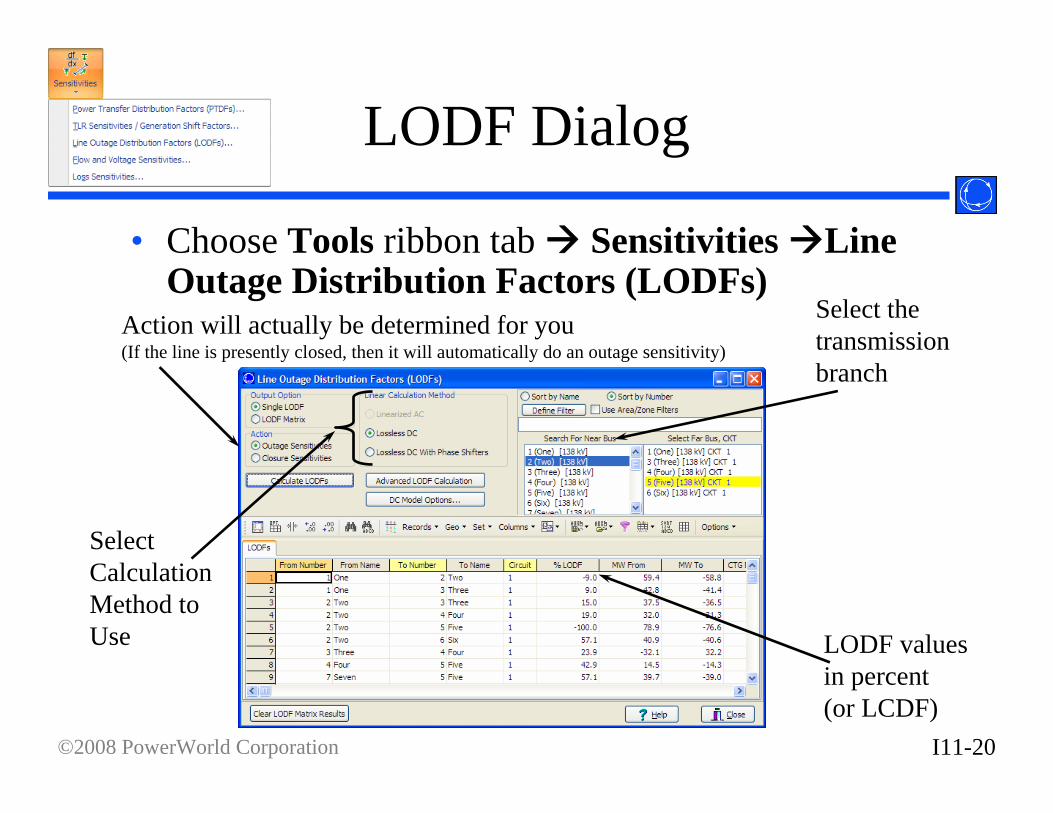
LODF Dialog
• Choose Tools ribbon tab Sensitivities Line Outage Distribution Factors (LODFs)
Select the transmission branch
Select Calculation Method to Use
Action will actually be determined for you(If the line is presently closed, then it will automatically do an outage sensitivity)
LODF values in percent (or LCDF)
I11-21©2008 PowerWorld Corporation
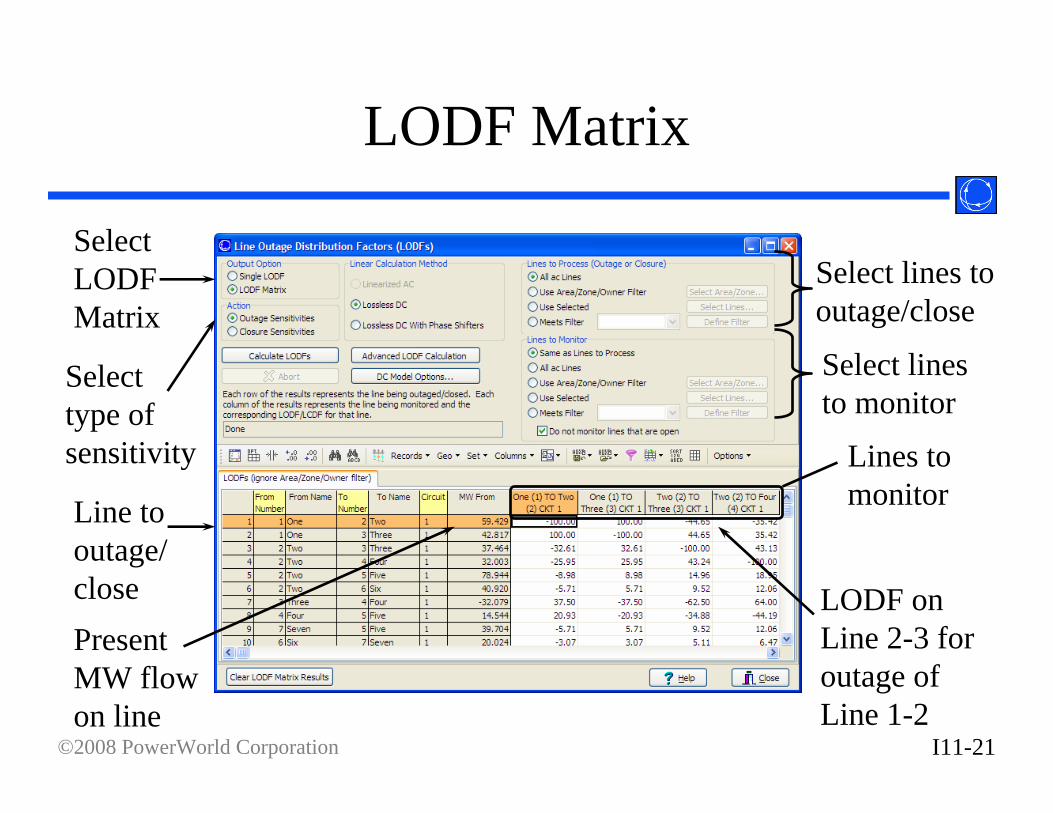
LODF Matrix
Select LODF Matrix
Select lines to outage/close
Select lines to monitor
Select type of sensitivity
Line to outage/closePresent MW flow on line
LODF on Line 2-3 for outage of Line 1-2
Lines to monitor
I11-22©2008 PowerWorld Corporation
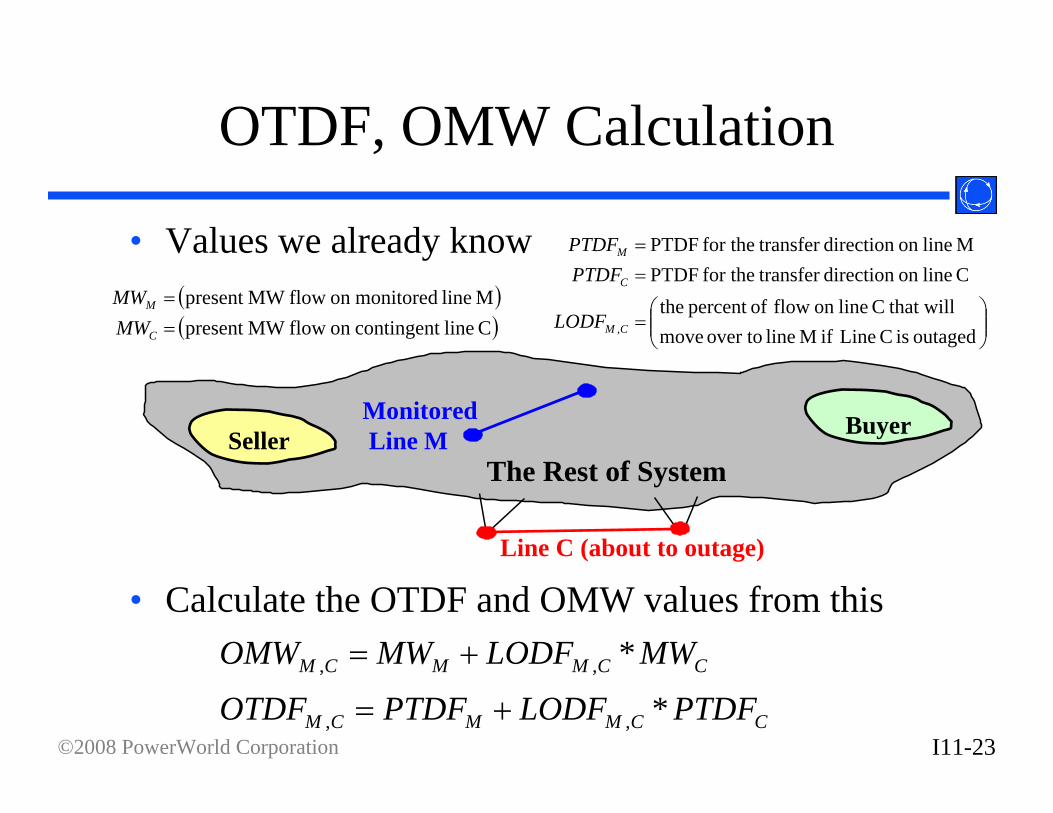
Outage Transfer Distribution Factors (OTDFs)
• Simulator finds these during ATC Calculations• The setup for the calculation
– Studying a transfer between a seller and buyer– Monitoring the flow on line M– Studying what happens after an outage of line C
• OTDF– the percent of the transfer that will flow on Line M
AFTER the outage of line C• Outage MW (OMW)
– The MW flow on line M after line C is outaged• Calculate OMW and OTDF from by using the
present flow on the lines and PTDFs and LODFs
I11-23©2008 PowerWorld Corporation
OTDF, OMW Calculation
CCMMCM PTDFLODFPTDFOTDF *,, +=CCMMCM MWLODFMWOMW *,, +=
Line C (about to outage)
MonitoredLine M
The Rest of SystemSeller Buyer
( )( )C line contingenton flowMW present
M line monitoredon flowMW present ==
C
M
MWMW
⎟⎟⎠
⎞⎜⎜⎝
⎛=
==
outaged is C Line if M line over to move that willC lineon flow ofpercent the
C lineon direction transfer for the PTDF M lineon direction transfer for the PTDF
,CM
C
M
LODF
PTDFPTDF• Values we already know
• Calculate the OTDF and OMW values from this
I11-24©2008 PowerWorld Corporation
OTDF and OMW calculation for multiple line outages
• A similar calculation can be done when trying to include multiple-line outage OTDFs– Finds the percent of a transfer that will flow on Line M
AFTER the outage of lines 1, 2, …• Simulator handles these multiple outages
internally• For more details, see the section near the end of
this binder on Linear Analysis Techniques.
I11-25©2008 PowerWorld Corporation
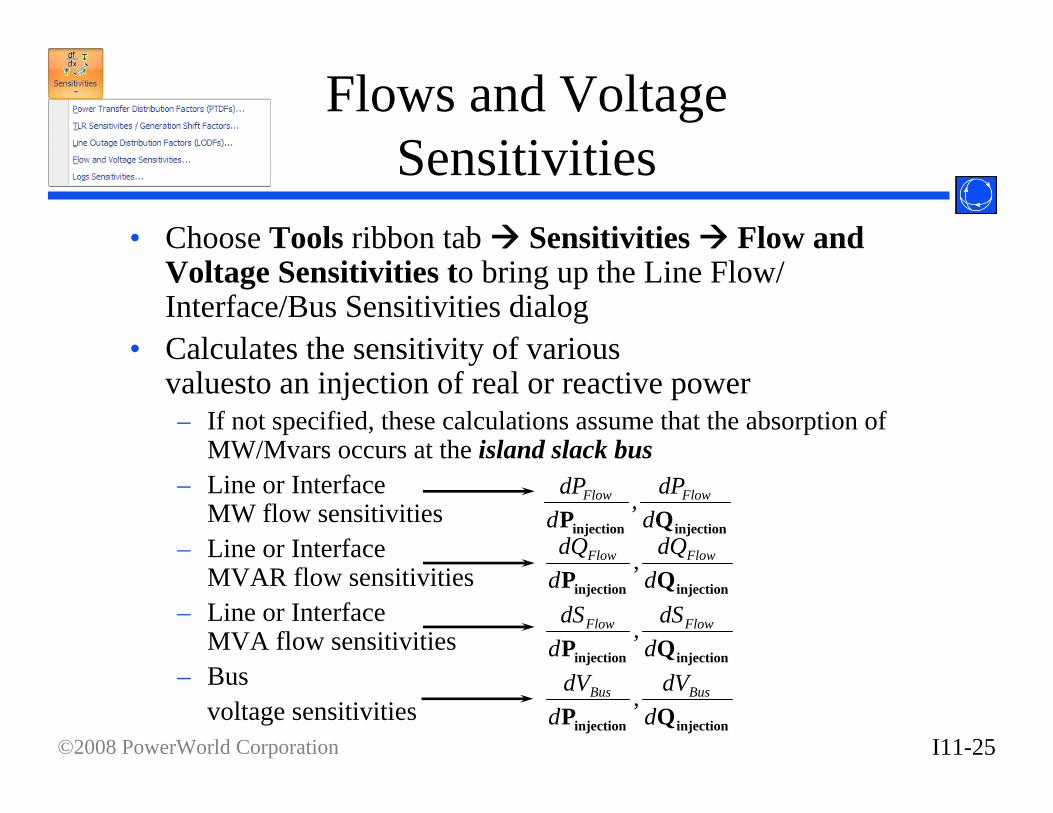
Flows and Voltage Sensitivities
• Choose Tools ribbon tab Sensitivities Flow and Voltage Sensitivities to bring up the Line Flow/Interface/Bus Sensitivities dialog
• Calculates the sensitivity of various valuesto an injection of real or reactive power– If not specified, these calculations assume that the absorption of
MW/Mvars occurs at the island slack bus– Line or Interface
MW flow sensitivities– Line or Interface
MVAR flow sensitivities– Line or Interface
MVA flow sensitivities– Bus
voltage sensitivitiesinjectioninjection QP d
dVd
dV BusBus ,
injectioninjection QP ddP
ddP FlowFlow ,
injectioninjection QP ddQ
ddQ FlowFlow ,
injectioninjection QP ddS
ddS FlowFlow ,
I11-26©2008 PowerWorld Corporation
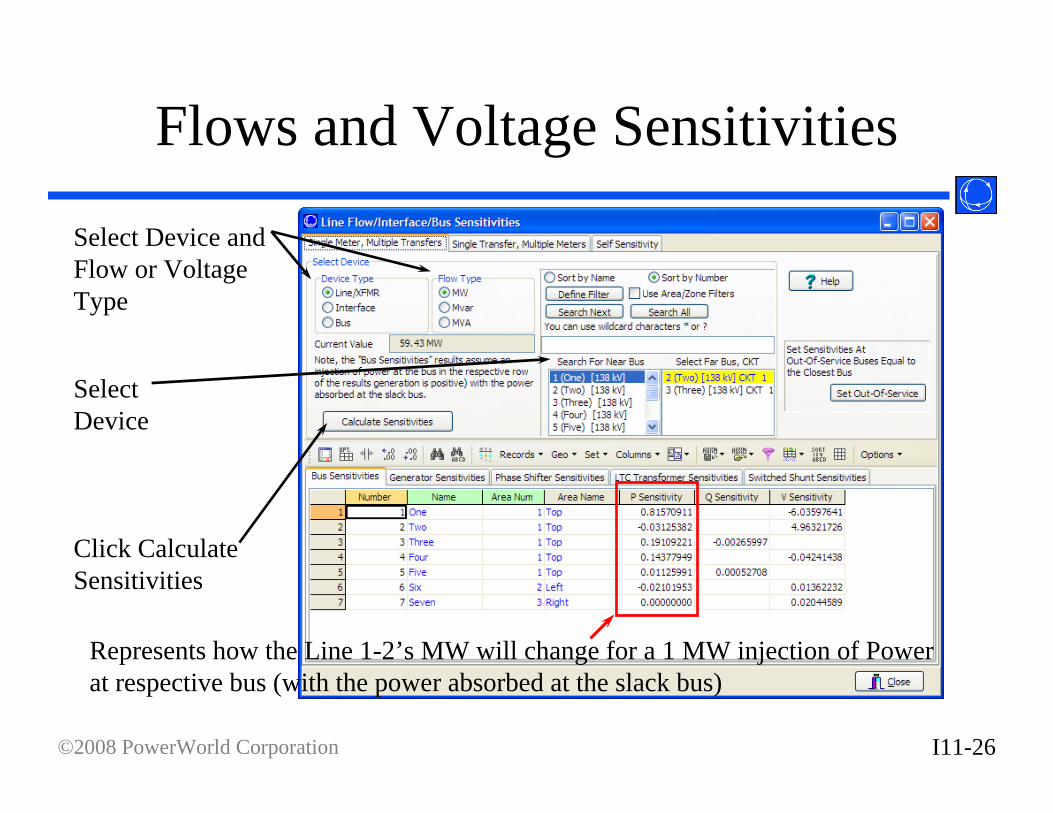
Flows and Voltage Sensitivities
Select Device and Flow or Voltage Type
Click Calculate Sensitivities
Select Device
Represents how the Line 1-2’s MW will change for a 1 MW injection of Power at respective bus (with the power absorbed at the slack bus)
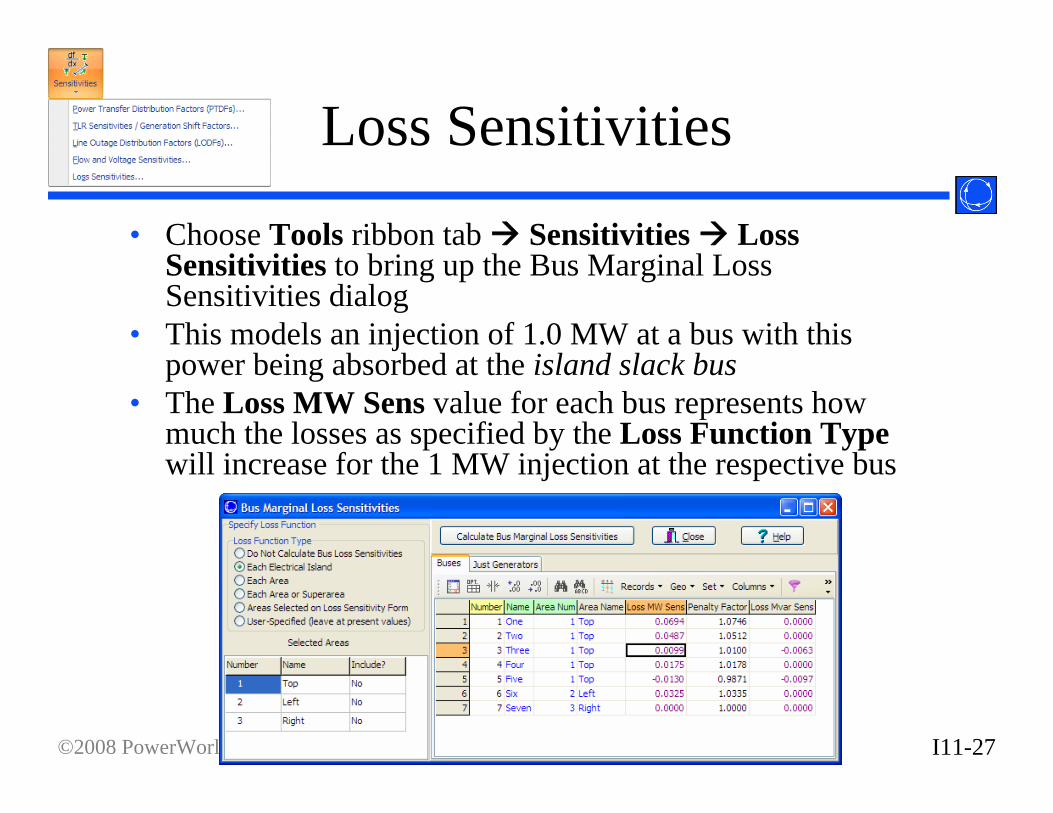
I11-27©2008 PowerWorld Corporation
Loss Sensitivities
• Choose Tools ribbon tab Sensitivities Loss Sensitivities to bring up the Bus Marginal Loss Sensitivities dialog
• This models an injection of 1.0 MW at a bus with this power being absorbed at the island slack bus
• The Loss MW Sens value for each bus represents how much the losses as specified by the Loss Function Typewill increase for the 1 MW injection at the respective bus
I11-28©2008 PowerWorld Corporation
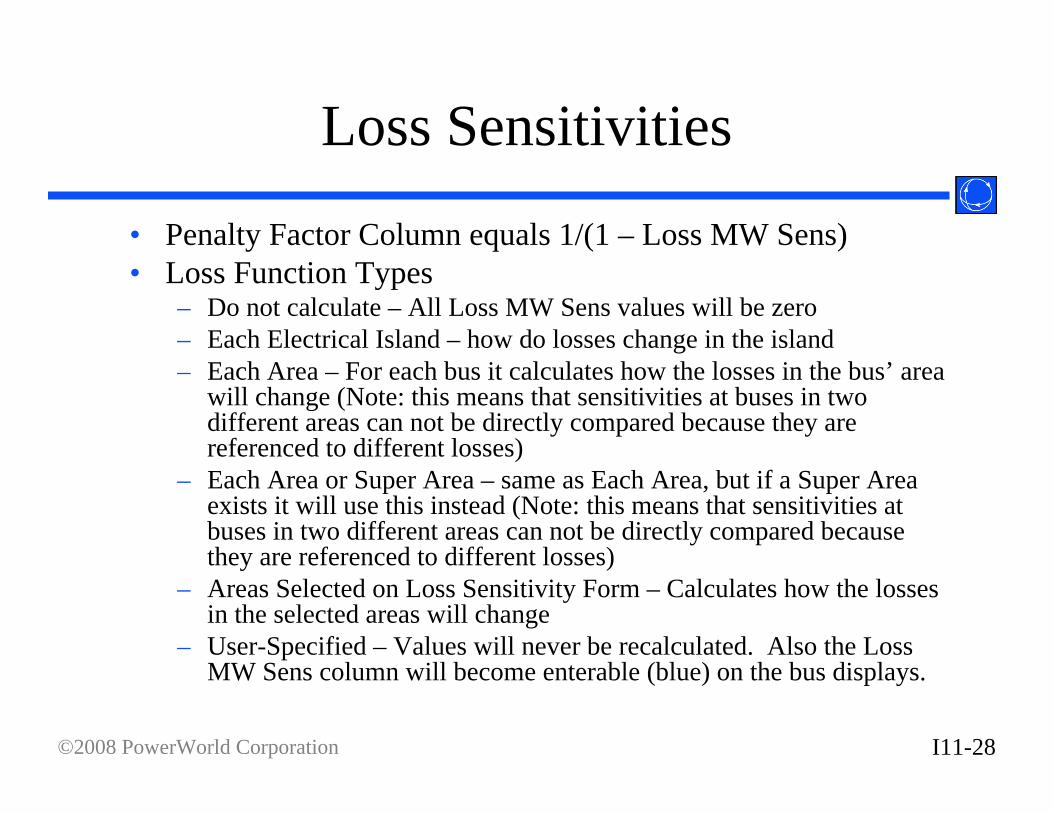
Loss Sensitivities
• Penalty Factor Column equals 1/(1 – Loss MW Sens)• Loss Function Types
– Do not calculate – All Loss MW Sens values will be zero– Each Electrical Island – how do losses change in the island– Each Area – For each bus it calculates how the losses in the bus’ area
will change (Note: this means that sensitivities at buses in twodifferent areas can not be directly compared because they are referenced to different losses)
– Each Area or Super Area – same as Each Area, but if a Super Area exists it will use this instead (Note: this means that sensitivities at buses in two different areas can not be directly compared because they are referenced to different losses)
– Areas Selected on Loss Sensitivity Form – Calculates how the losses in the selected areas will change
– User-Specified – Values will never be recalculated. Also the Loss MW Sens column will become enterable (blue) on the bus displays.
I11-29©2008 PowerWorld Corporation
Line Loading Replicator
• Available from Tools ribbon tab Line Loading Replicator
• Uses linear transfer sensitivities to calculate injection changes required to achieve desired MW flow on a selected line
• Injection groups used to select the generators and loads that can participate in the injection changes
• Net injection change is zero; same amount of MW injected into the system as taken out of the system
• Generator and load min and max always enforced• Injection changes can be implemented in the power flow
case to determine the actual impact of the changes
I11-30©2008 PowerWorld Corporation
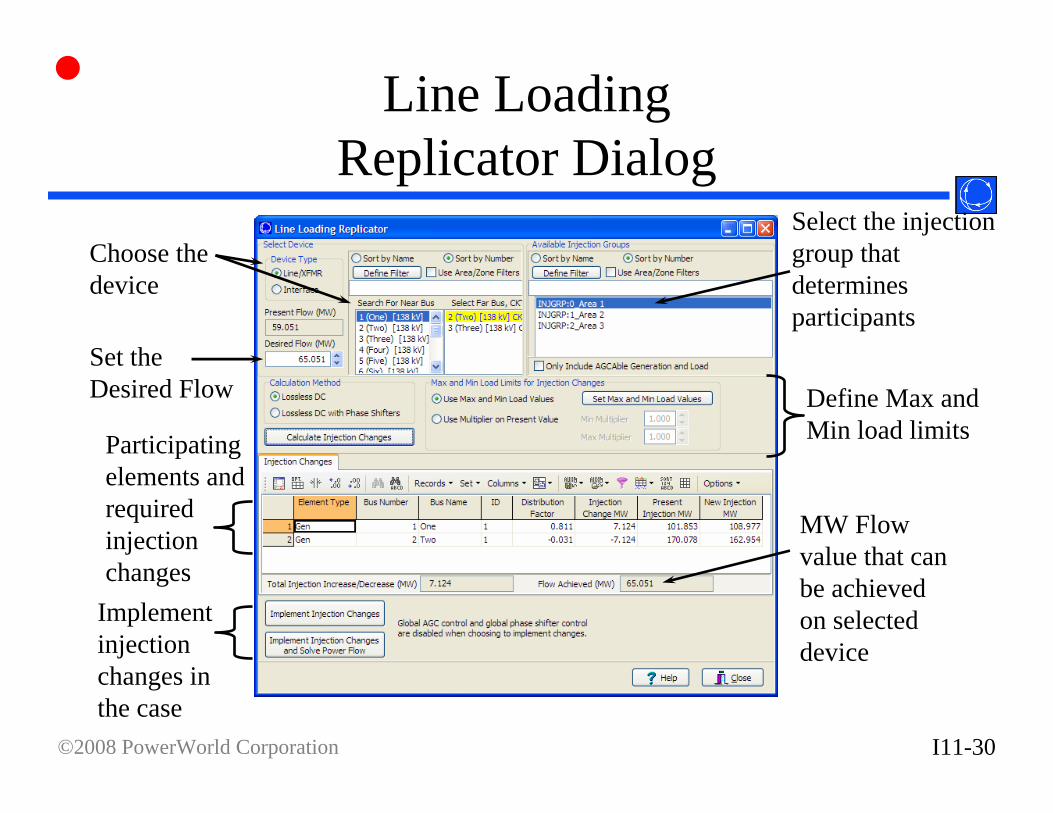
Participating elements and required injection changes
Line Loading Replicator Dialog
Choose the device
Set the Desired Flow
Select the injection group that determines participants
Define Max and Min load limits
Implement injection changes in the case
MW Flow value that can be achieved on selected device
I11-31©2008 PowerWorld Corporation
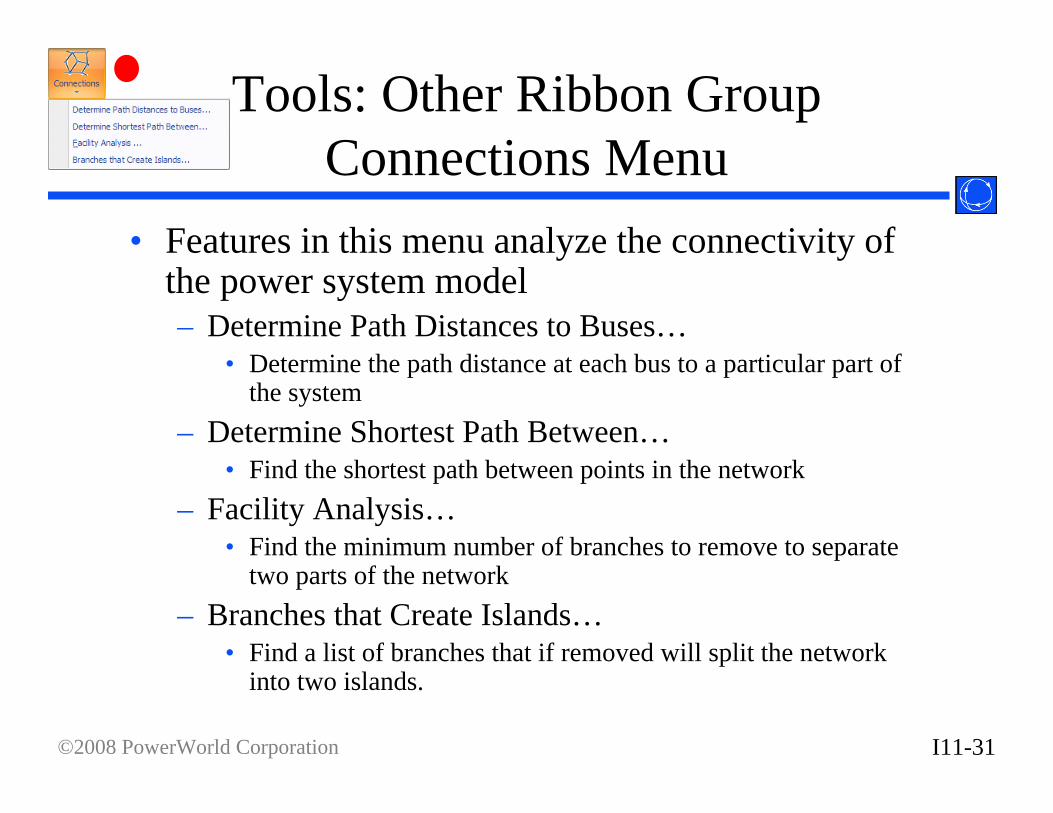
Tools: Other Ribbon GroupConnections Menu
• Features in this menu analyze the connectivity of the power system model– Determine Path Distances to Buses…
• Determine the path distance at each bus to a particular part of the system
– Determine Shortest Path Between…• Find the shortest path between points in the network
– Facility Analysis…• Find the minimum number of branches to remove to separate
two parts of the network– Branches that Create Islands…
• Find a list of branches that if removed will split the network into two islands.
I11-32©2008 PowerWorld Corporation
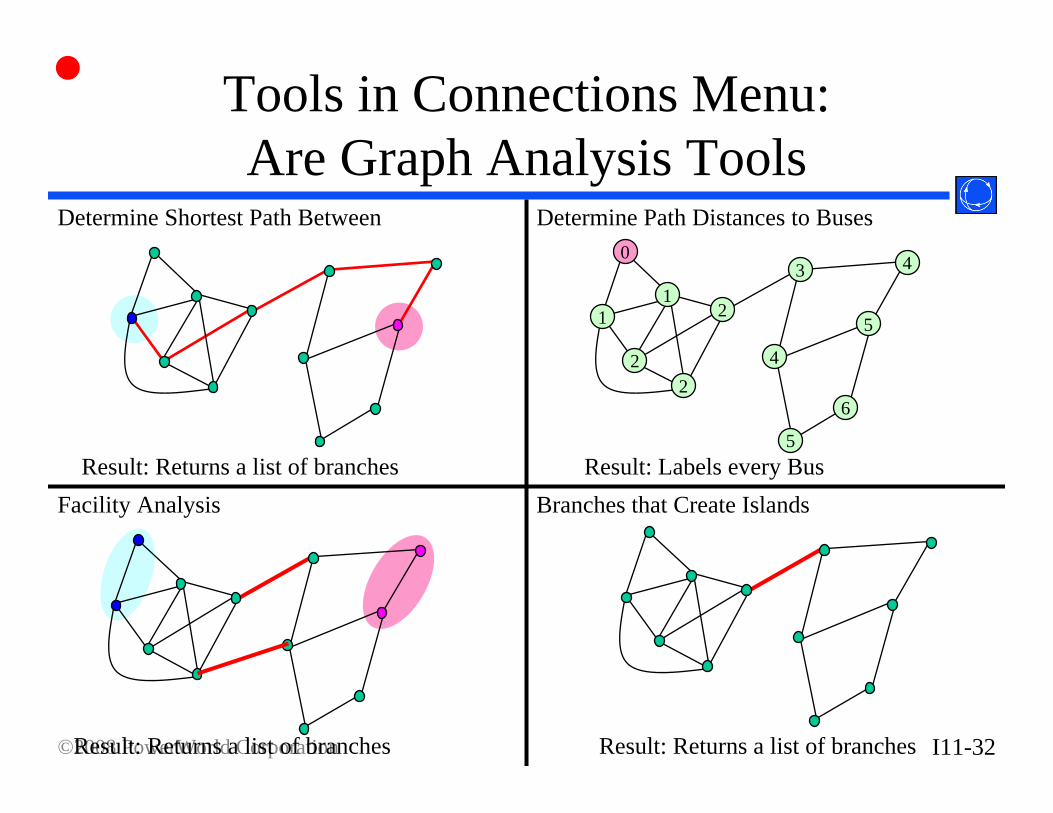
Tools in Connections Menu:Are Graph Analysis Tools
0
11
3
2
42
5
62
4
5
Determine Shortest Path Between Determine Path Distances to Buses
Branches that Create IslandsFacility AnalysisResult: Returns a list of branches
Result: Returns a list of branches Result: Returns a list of branches
Result: Labels every Bus
I11-33©2008 PowerWorld Corporation
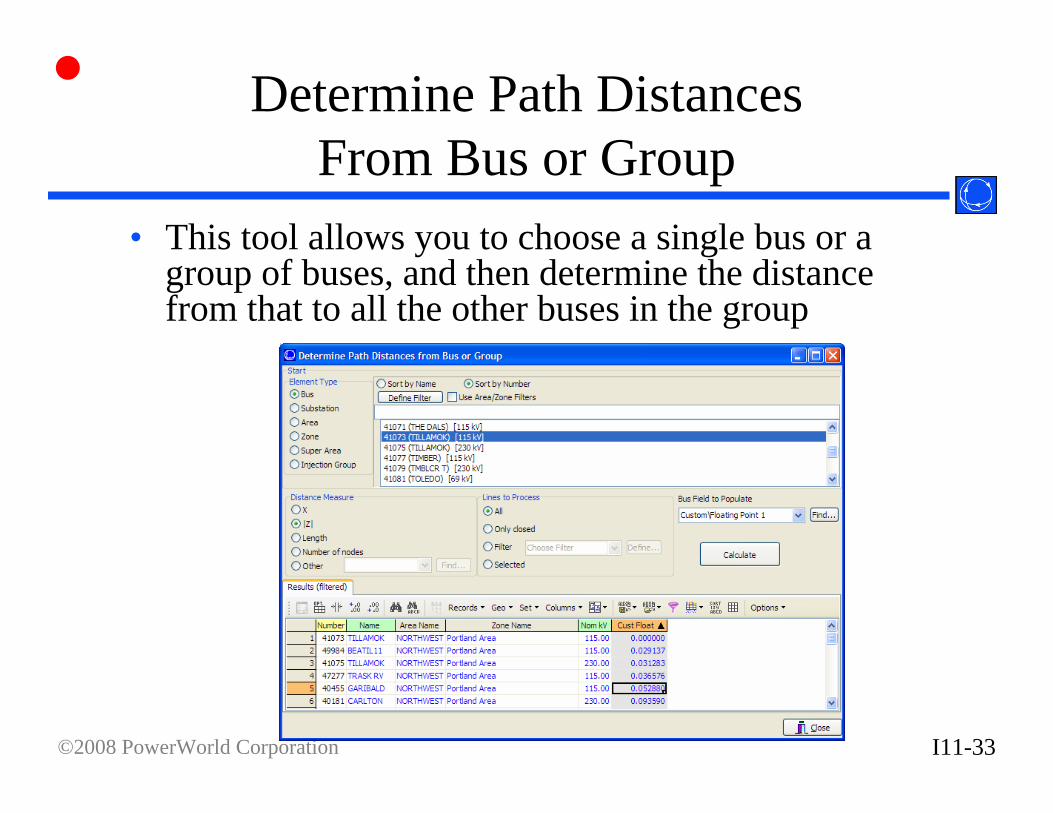
Determine Path DistancesFrom Bus or Group
• This tool allows you to choose a single bus or a group of buses, and then determine the distance from that to all the other buses in the group
I11-34©2008 PowerWorld Corporation
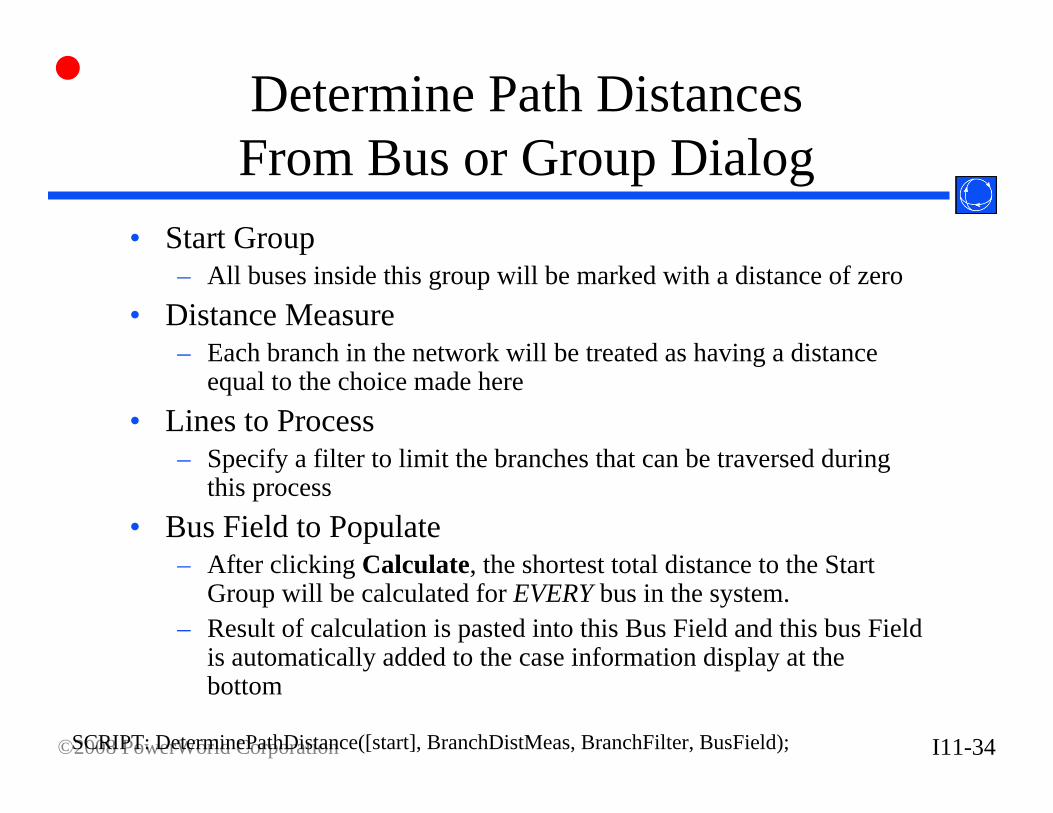
Determine Path DistancesFrom Bus or Group Dialog
• Start Group– All buses inside this group will be marked with a distance of zero
• Distance Measure– Each branch in the network will be treated as having a distance
equal to the choice made here• Lines to Process
– Specify a filter to limit the branches that can be traversed during this process
• Bus Field to Populate– After clicking Calculate, the shortest total distance to the Start
Group will be calculated for EVERY bus in the system.– Result of calculation is pasted into this Bus Field and this bus Field
is automatically added to the case information display at the bottom
SCRIPT: DeterminePathDistance([start], BranchDistMeas, BranchFilter, BusField);
I11-35©2008 PowerWorld Corporation
Determine Shortest Path From Bus or Group
• Start Group, End Group– Specify a start and end group to determine distances
between• Distance Measure
– Each branch in the network will be treated as having a distance equal to the choice made here
• Lines to Process– Specify a filter to limit the branches that can be
traversed during this process• Click calculate to determine the shortest series of
branches that goes from the Start Group to the End Group.
SCRIPT: DetermineShortestPath([start], [end], BranchDistanceMeasure, BranchFilter, Filename);
I11-36©2008 PowerWorld Corporation
Facility Analysis
• This dialog allows you to choose two sets of buses on the Select the Buses– Buses with Which System? = EXTERNAL– Buses with Selected? = YES
• When you then switch to the Facility Analysis Tab, you can click Find Minimum Cut to find the minimum number of branches to remove to separate the two sets of buses
• The results will be shown in a list of branches at the bottom of the dialog
I11-37©2008 PowerWorld Corporation
Branches that Create Islands
• Find a list of branches that if removed will split the network into two islands.
• Click Determine Branches button to execute.• Lines to Process
– Specify a filter to limit the branches that will be checked for creating islands
• Middle part of dialog will list the branches that if opened will create an island
• When you choose a branch from the middle list, the bottom portion of the dialog will list the buses that become islanded as a result of the selected branches outage


![Brochure - LanguageCourse.Net · 9lghr%urfkxuh zzz lodf frp ydqfrxyhu zzz lodf frp ydqfrxyhufdpsxv,/$&9dqfrxyhu /hduqlqjodqjxdjhlvqrwphprul]lqjzrugv /dqjxdjhohduqlqjlvolnh ... brochure](https://img.pdfslide.us/doc/110x75/5c0281b609d3f2983b8bf741/brochure-9lghrurfkxuh-zzz-lodf-frp-ydqfrxyhu-zzz-lodf-frp-ydqfrxyhufdpsxv9dqfrxyhu.jpg)
![Tutorial Powerworld Ingles[1]](https://img.pdfslide.us/doc/110x75/55721341497959fc0b91ef24/tutorial-powerworld-ingles1.jpg)