Embed Size (px)
Citation preview
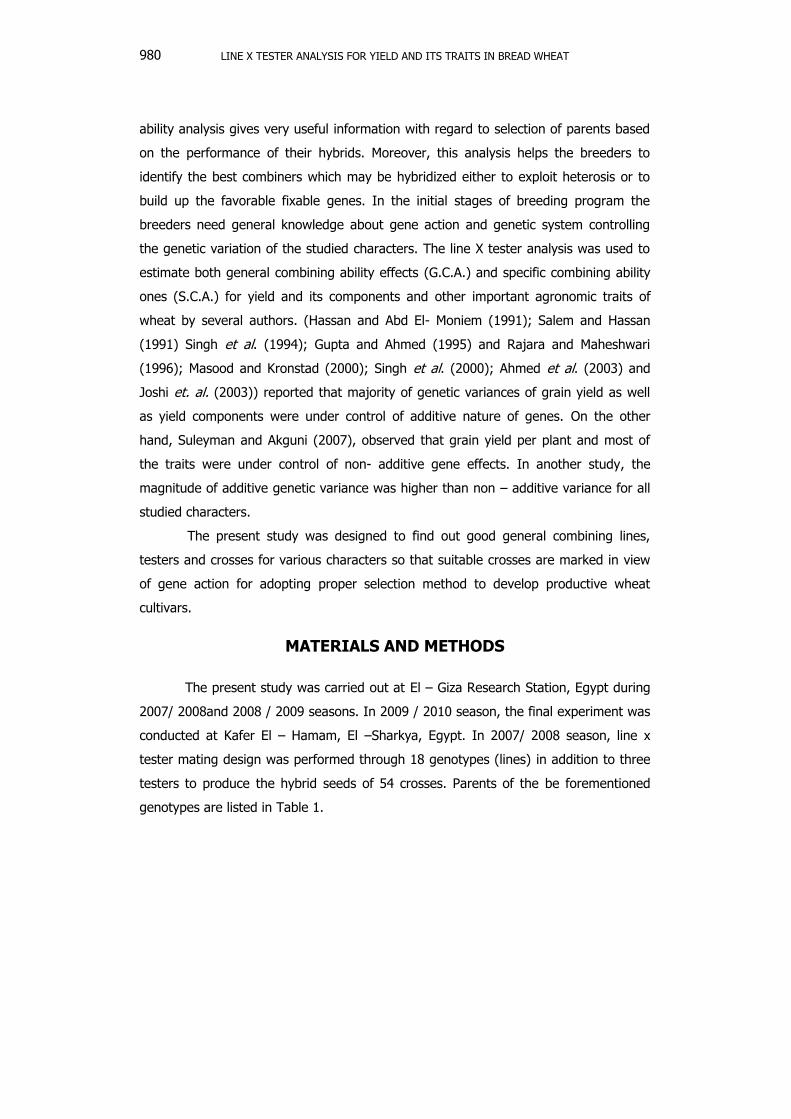
Egypt. J. Agric. Res., 89 (3), 2011
979
LINE X TESTER ANALYSIS FOR YIELD AND ITS TRAITS IN BREAD WHEAT
ABDEL NOUR, NADYA A. R.1, HAYAM S.A.EL–FATEH2 AND A.K.MOSTAFA1
1. Wheat Research Dep., Field Crops Research Institute, ARC, Giza, Egypt. 2. Lab. for Design and Statistical Analysis Research, ARC. Giza.
(Manuscript received 3 March 2011)
Abstract
The present study was carried out in three successive seasons from
2007 to 2010.The first and second seasons were at El-Giza Research
Station while the third season was at Kafr El- Hamam Research Station.
The main objective of this study was to estimate combining ability
variances and effects of eighteen wheat genotypes which were crossed to
three local wheat cultivars, i.e., Gemmiza 9, Sakha 93 and Giza 169 as
testers using Line x Tester analysis in F1 and F2 populations for grain
yield and its components. The differences among genotypes, parents and
crosses were highly significant for all studied characters. Both general and
specific combining ability variances were highly significant for all
characters. The results revealed that non additive gene effects were larger
than those of the additive ones and played the major role in the
inheritance of all studied characters. Also, the maximum contribution to
total variance of grain yield per plant and other traits was made by female
lines. The parental lines 3, 4, 14 and 15 proved to have better general
combiners for grain yield per plant and most of its components in grain
yield improvement. Hence, four female parents could be used in future
programs to improve grain yield. Tester number 1 appeared to have
better general combiner for grain yield per plant and some other traits.
These parents presumed to have a relatively large number of favorable
alleles for these traits. However, the hybrids (L3 X T3), (L4 X T1), (L14 X
T2) and (L15 X T2) were excellent harmonious combinars for specific
combining ability effects for all characters including grain yield per plant.
Hence, it would result in transgressive segregants for grain yield per plant
in late segregating generations due to the predominant non – additive
gene action.
Key Words: Genotypes, Combining ability, Gene action
INTRODUCTION
Bread wheat (Triticum aestivum L.) is a major food crop in the world. In
Egypt, it is used as a stable food grain for urban, rural and bediwin societies and as a
major source of straw for animal feedins. However, geometrical increase in the
Egyptian population has been a challenge for agricultural scientists. To feed
burgeoning population of Egypt, there is a dire need to develop wheat genotypes
having high yield potential. This could be achieved by exploring maximum genetic
potential from available wheat germplasm. Breeders should concentrate on
development of productive wheat varieties by crossing good general combining lines
for grain yield and selecting transgressive segregnts from resulting hybrids. Combining
LINE X TESTER ANALYSIS FOR YIELD AND ITS TRAITS IN BREAD WHEAT
980
ability analysis gives very useful information with regard to selection of parents based
on the performance of their hybrids. Moreover, this analysis helps the breeders to
identify the best combiners which may be hybridized either to exploit heterosis or to
build up the favorable fixable genes. In the initial stages of breeding program the
breeders need general knowledge about gene action and genetic system controlling
the genetic variation of the studied characters. The line X tester analysis was used to
estimate both general combining ability effects (G.C.A.) and specific combining ability
ones (S.C.A.) for yield and its components and other important agronomic traits of
wheat by several authors. (Hassan and Abd El- Moniem (1991); Salem and Hassan
(1991) Singh et al. (1994); Gupta and Ahmed (1995) and Rajara and Maheshwari
(1996); Masood and Kronstad (2000); Singh et al. (2000); Ahmed et al. (2003) and
Joshi et. al. (2003)) reported that majority of genetic variances of grain yield as well
as yield components were under control of additive nature of genes. On the other
hand, Suleyman and Akguni (2007), observed that grain yield per plant and most of
the traits were under control of non- additive gene effects. In another study, the
magnitude of additive genetic variance was higher than non – additive variance for all
studied characters.
The present study was designed to find out good general combining lines,
testers and crosses for various characters so that suitable crosses are marked in view
of gene action for adopting proper selection method to develop productive wheat
cultivars.
MATERIALS AND METHODS
The present study was carried out at El – Giza Research Station, Egypt during
2007/ 2008and 2008 / 2009 seasons. In 2009 / 2010 season, the final experiment was
conducted at Kafer El – Hamam, El –Sharkya, Egypt. In 2007/ 2008 season, line x
tester mating design was performed through 18 genotypes (lines) in addition to three
testers to produce the hybrid seeds of 54 crosses. Parents of the be forementioned
genotypes are listed in Table 1.
ABDEL NOUR, NADYA A. R., et. al. 981
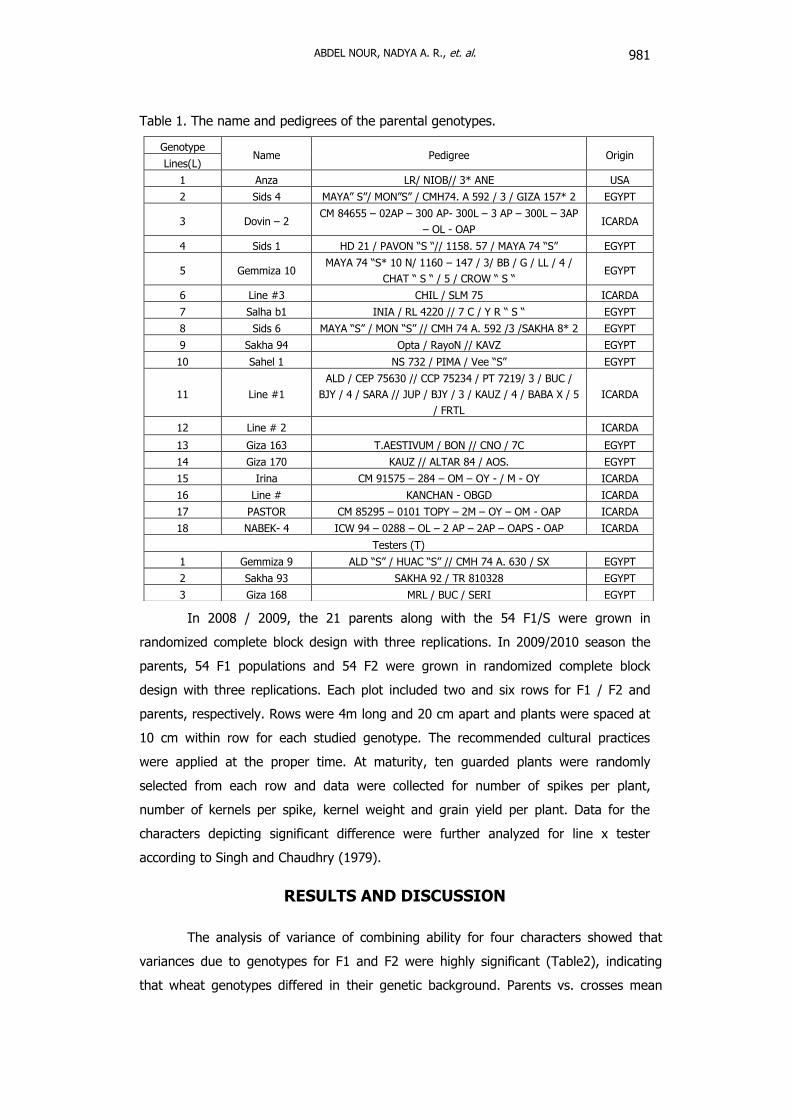
Table 1. The name and pedigrees of the parental genotypes.
In 2008 / 2009, the 21 parents along with the 54 F1/S were grown in
randomized complete block design with three replications. In 2009/2010 season the
parents, 54 F1 populations and 54 F2 were grown in randomized complete block
design with three replications. Each plot included two and six rows for F1 / F2 and
parents, respectively. Rows were 4m long and 20 cm apart and plants were spaced at
10 cm within row for each studied genotype. The recommended cultural practices
were applied at the proper time. At maturity, ten guarded plants were randomly
selected from each row and data were collected for number of spikes per plant,
number of kernels per spike, kernel weight and grain yield per plant. Data for the
characters depicting significant difference were further analyzed for line x tester
according to Singh and Chaudhry (1979).
RESULTS AND DISCUSSION
The analysis of variance of combining ability for four characters showed that
variances due to genotypes for F1 and F2 were highly significant (Table2), indicating
that wheat genotypes differed in their genetic background. Parents vs. crosses mean
Origin PedigreeName Genotype
Lines(L)
USALR/ NIOB// 3* ANEAnza1
EGYPTMAYA” S”/ MON”S” / CMH74. A 592 / 3 / GIZA 157* 2Sids 42
ICARDACM 84655 – 02AP – 300 AP- 300L – 3 AP – 300L – 3AP
– OL - OAPDovin – 23
EGYPTHD 21 / PAVON “S “// 1158. 57 / MAYA 74 “S”Sids 14
EGYPTMAYA 74 “S* 10 N/ 1160 – 147 / 3/ BB / G / LL / 4 /
CHAT “ S “ / 5 / CROW “ S “Gemmiza 105
ICARDACHIL / SLM 75Line #36
EGYPTINIA / RL 4220 // 7 C / Y R “ S “Salha b17
EGYPTMAYA “S” / MON “S” // CMH 74 A. 592 /3 /SAKHA 8* 2Sids 68
EGYPTOpta / RayoN // KAVZSakha 949
EGYPTNS 732 / PIMA / Vee “S”Sahel 110
ICARDA
ALD / CEP 75630 // CCP 75234 / PT 7219/ 3 / BUC /
BJY / 4 / SARA // JUP / BJY / 3 / KAUZ / 4 / BABA X / 5
/ FRTL
Line #111
ICARDALine # 212
EGYPTT.AESTIVUM / BON // CNO / 7CGiza 16313
EGYPTKAUZ // ALTAR 84 / AOS.Giza 17014
ICARDACM 91575 – 284 – OM – OY - / M - OYIrina15
ICARDAKANCHAN - OBGDLine #16
ICARDA CM 85295 – 0101 TOPY – 2M – OY – OM - OAPPASTOR17
ICARDAICW 94 – 0288 – OL – 2 AP – 2AP – OAPS - OAPNABEK- 418
Testers (T)
EGYPTALD “S” / HUAC “S” // CMH 74 A. 630 / SXGemmiza 91
EGYPT SAKHA 92 / TR 810328Sakha 932
EGYPTMRL / BUC / SERIGiza 1683
LINE X TESTER ANALYSIS FOR YIELD AND ITS TRAITS IN BREAD WHEAT
982
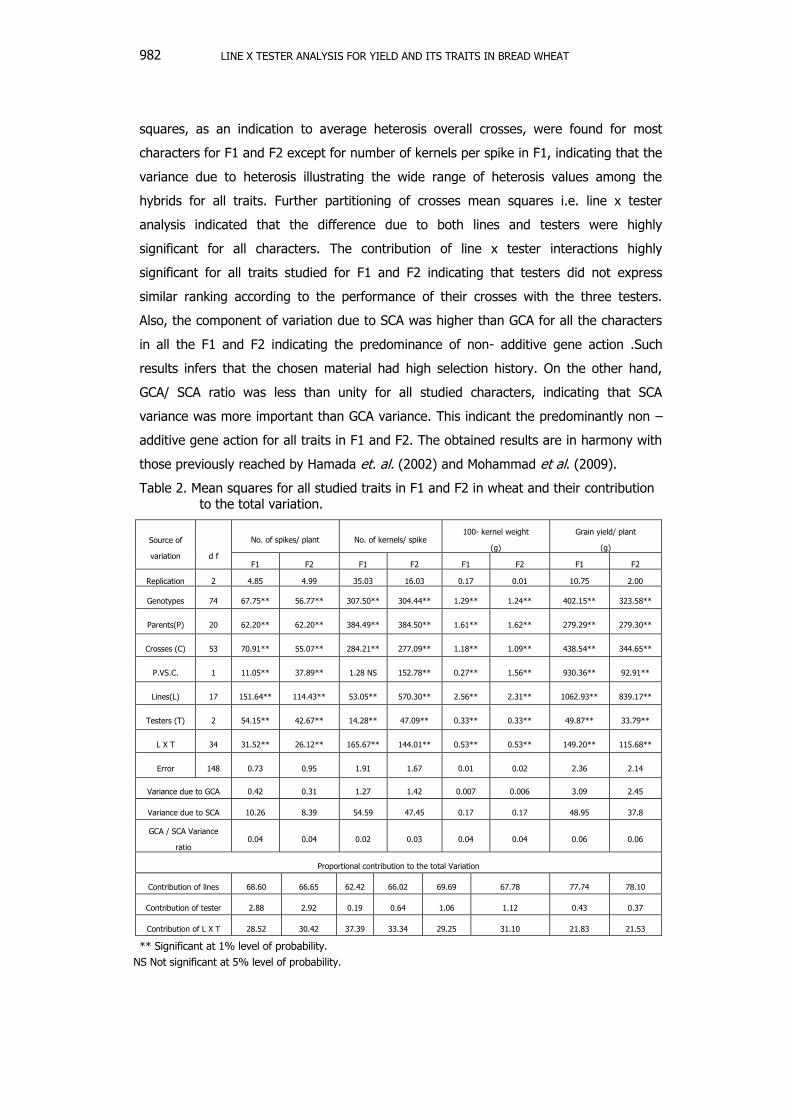
squares, as an indication to average heterosis overall crosses, were found for most
characters for F1 and F2 except for number of kernels per spike in F1, indicating that the
variance due to heterosis illustrating the wide range of heterosis values among the
hybrids for all traits. Further partitioning of crosses mean squares i.e. line x tester
analysis indicated that the difference due to both lines and testers were highly
significant for all characters. The contribution of line x tester interactions highly
significant for all traits studied for F1 and F2 indicating that testers did not express
similar ranking according to the performance of their crosses with the three testers.
Also, the component of variation due to SCA was higher than GCA for all the characters
in all the F1 and F2 indicating the predominance of non- additive gene action .Such
results infers that the chosen material had high selection history. On the other hand,
GCA/ SCA ratio was less than unity for all studied characters, indicating that SCA
variance was more important than GCA variance. This indicant the predominantly non –
additive gene action for all traits in F1 and F2. The obtained results are in harmony with
those previously reached by Hamada et. al. (2002) and Mohammad et al. (2009).
Table 2. Mean squares for all studied traits in F1 and F2 in wheat and their contribution to the total variation.
** Significant at 1% level of probability.
NS Not significant at 5% level of probability.
Grain yield/ plant
(g)
100- kernel weight
(g)No. of kernels/ spikeNo. of spikes/ plant
d f
Source of
variationF2F1F2F1F2F1F2 F1
2.0010.750.010.1716.0335.034.994.852Replication
323.58**402.15**1.24**1.29**304.44**307.50**56.77**67.75**74Genotypes
279.30**279.29**1.62**1.61**384.50**384.49**62.20**62.20**20Parents(P)
344.65**438.54**1.09**1.18**277.09**284.21**55.07**70.91**53Crosses (C)
92.91**930.36**1.56**0.27**152.78**1.28 NS37.89**11.05**1P.VS.C.
839.17**1062.93**2.31**2.56**570.30**53.05**114.43**151.64**17Lines(L)
33.79**49.87**0.33**0.33**47.09**14.28**42.67**54.15**2Testers (T)
115.68**149.20**0.53**0.53**144.01**165.67**26.12**31.52**34L X T
2.142.360.020.011.671.910.950.73148Error
2.453.090.0060.0071.421.270.310.42Variance due to GCA
37.848.950.170.1747.4554.598.3910.26Variance due to SCA
0.060.060.040.040.030.020.040.04GCA / SCA Variance
ratio
Proportional contribution to the total Variation
78.10 77.74 67.78 69.69 66.02 62.42 66.65 68.60 Contribution of lines
0.37 0.43 1.12 1.06 0.64 0.19 2.92 2.88 Contribution of tester
21.5321.8331.1029.2533.3437.3930.4228.52Contribution of L X T
ABDEL NOUR, NADYA A. R., et. al. 983
The proportional contribution of lines (females), testers (males) and their
interactions (Crosses) to total variance for different traits in F1 and F2 (Table2 )revealed
that maximum contribution to total variance of grain yield per plant, number of spikes
per plant, number of kernels per spike and kernel weight were made by female lines.
Similar results were obtained by Hamada et al. 2002.
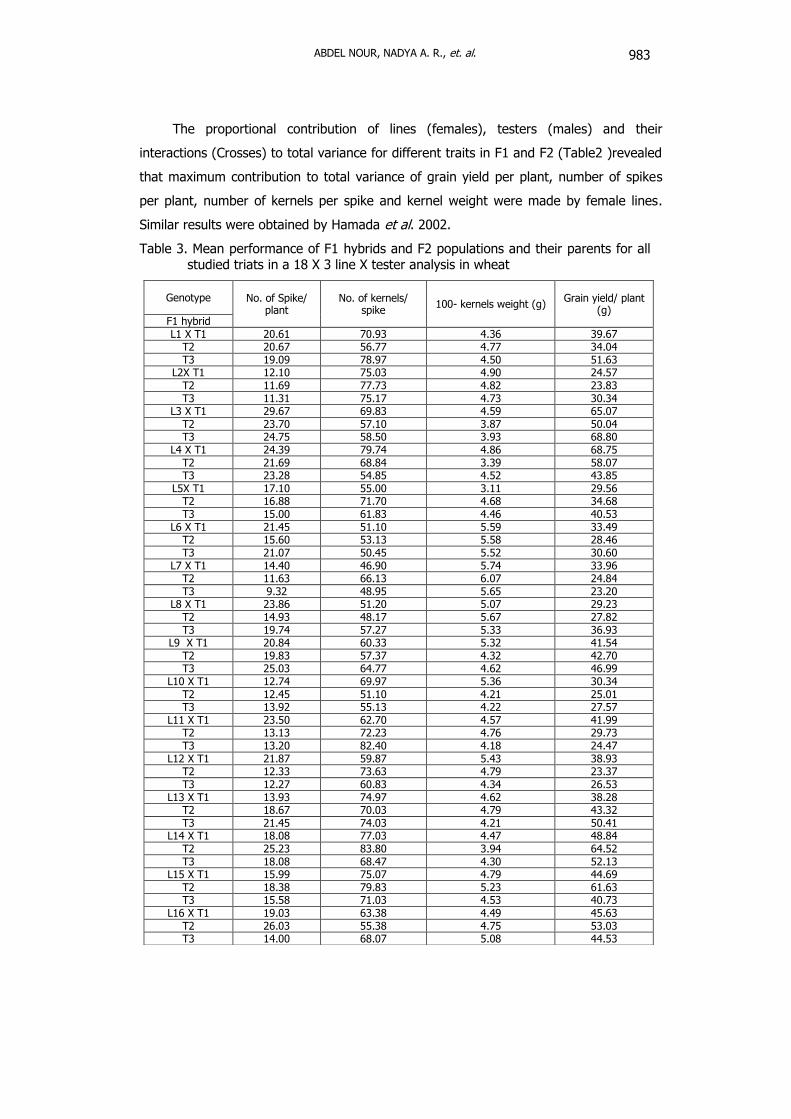
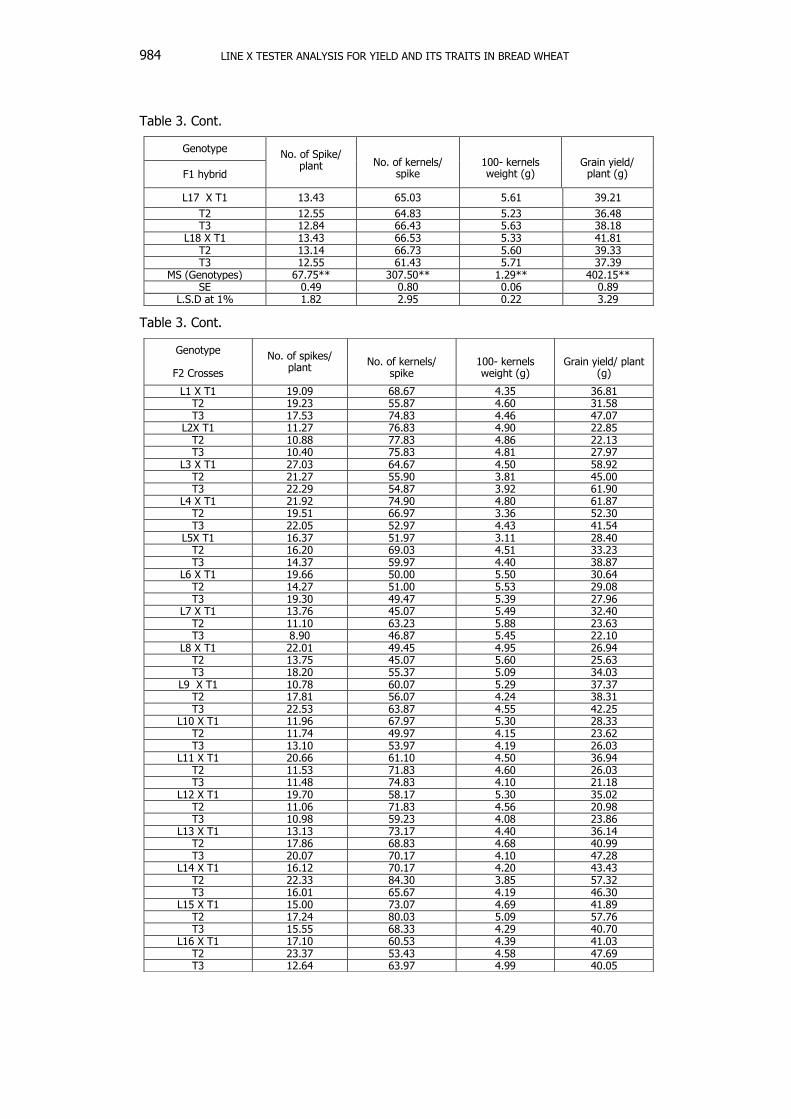
Table 3. Mean performance of F1 hybrids and F2 populations and their parents for all studied triats in a 18 X 3 line X tester analysis in wheat
Grain yield/ plant (g)
100- kernels weight (g)No. of kernels/
spikeNo. of Spike/
plantGenotype
F1 hybrid39.674.3670.9320.61L1 X T134.044.7756.7720.67T251.634.5078.9719.09T324.574.9075.0312.10L2X T123.834.8277.7311.69T230.344.7375.1711.31T365.074.5969.8329.67L3 X T150.043.8757.1023.70T268.803.9358.5024.75T368.754.8679.7424.39L4 X T158.073.3968.8421.69T243.854.5254.8523.28T329.563.1155.0017.10L5X T134.684.6871.7016.88T240.534.4661.8315.00T333.495.5951.1021.45L6 X T128.465.5853.1315.60T230.605.5250.4521.07T333.965.7446.9014.40L7 X T124.846.0766.1311.63T223.205.6548.959.32T329.235.0751.2023.86L8 X T127.825.6748.1714.93T236.935.3357.2719.74T341.545.3260.3320.84L9 X T142.704.3257.3719.83T246.994.6264.7725.03T330.345.3669.9712.74L10 X T125.014.2151.1012.45T227.574.2255.1313.92T341.994.5762.7023.50L11 X T129.734.7672.2313.13T224.474.1882.4013.20T338.935.4359.8721.87L12 X T123.374.7973.6312.33T226.534.3460.8312.27T338.284.6274.9713.93L13 X T143.324.7970.0318.67T250.414.2174.0321.45T348.844.4777.0318.08L14 X T164.523.9483.8025.23T252.134.3068.4718.08T344.694.7975.0715.99L15 X T161.635.2379.8318.38T240.734.5371.0315.58T345.634.4963.3819.03L16 X T153.034.7555.3826.03T244.535.0868.0714.00T3
LINE X TESTER ANALYSIS FOR YIELD AND ITS TRAITS IN BREAD WHEAT
984
Table 3. Cont.
Table 3. Cont.
Grain yield/
plant (g)
100- kernels weight (g)
No. of kernels/
spike
No. of Spike/
plant
Genotype
F1 hybrid
39.215.6165.0313.43L17 X T1
36.485.2364.8312.55T238.185.6366.4312.84T341.815.3366.5313.43L18 X T139.335.6066.7313.14T237.395.7161.4312.55T3
402.15**1.29**307.50**67.75**MS (Genotypes)0.890.060.800.49SE3.290.222.951.82L.S.D at 1%
Grain yield/ plant
(g)
100- kernels weight (g)
No. of kernels/
spike
No. of spikes/
plant
Genotype
F2 Crosses
36.814.3568.6719.09L1 X T131.584.6055.8719.23T247.074.4674.8317.53T322.854.9076.8311.27L2X T122.134.8677.8310.88T227.974.8175.8310.40T358.924.5064.6727.03L3 X T145.003.8155.9021.27T261.903.9254.8722.29T361.874.8074.9021.92L4 X T152.303.3666.9719.51T241.544.4352.9722.05T328.403.1151.9716.37L5X T133.234.5169.0316.20T238.874.4059.9714.37T330.645.5050.0019.66L6 X T129.085.5351.0014.27T227.965.3949.4719.30T332.405.4945.0713.76L7 X T123.635.8863.2311.10T222.105.4546.878.90T326.944.9549.4522.01L8 X T125.635.6045.0713.75T234.035.0955.3718.20T337.37 5.2960.0710.78L9 X T138.314.2456.0717.81T242.254.5563.8722.53T328.335.3067.9711.96L10 X T123.624.1549.9711.74T226.034.1953.9713.10T336.944.5061.1020.66L11 X T126.034.6071.8311.53T221.184.1074.8311.48T335.025.3058.1719.70L12 X T120.984.5671.8311.06T223.864.0859.2310.98T336.144.4073.1713.13L13 X T140.994.6868.8317.86T247.284.1070.1720.07T343.434.2070.1716.12L14 X T157.323.8584.3022.33T246.304.1965.6716.01T341.894.6973.0715.00L15 X T157.765.0980.0317.24T240.704.2968.3315.55T341.034.3960.5317.10L16 X T147.694.5853.4323.37T240.054.9963.9712.64T3
ABDEL NOUR, NADYA A. R., et. al. 985
Table 3. Cont.
Table 3. Cont.
Grain yield/ plant
(g)
100- kernels
weight (g)
No. of kernels/
spike
No. of spikes/
plant
Genotype
F2 Crosses
37.055.3864.7712.70L17 X T1
34.515.1563.3711.89T2
36.155.5565.1712.15T3
39.585.2064.4312.70L18 X T1
37.215.4064.2712.44T2
35.405.5060.0711.89T3
323.58**1.24**304.44**56.77**MS (Genotypes)
0.840.080.750.56SE
3.100.302.772.07L.S.D at 1%
Grain yield/ plant
(g)
100- kernel
weight (g)No. of kernels/ spike
No. of spikes/
plantGenotype
38.475.4472.6317.93Line 1
20.065.4498.277.572
49.175.1268.8318.723
57.204.7888.6719.394
27.254.9875.6716.655
29.945.4159.0317.096
28.065.2954.3326.477
31.406.7856.6719.938
39.775.1867.2717.239
15.234.4159.678.9310
28.554.8856.6714.4311
28.345.8359.3015.9412
47.564.8862.0323.7313
36.403.5268.4315.8714
32.484.0757.2716.3815
33.733.9952.6723.0016
38.265.6862.0713.0217
39.395.6362.0712.2518
39.614.4262.7721.53Tester 1
37.554.3059.8715.232
42.964.1556.3116.933
LINE X TESTER ANALYSIS FOR YIELD AND ITS TRAITS IN BREAD WHEAT
986
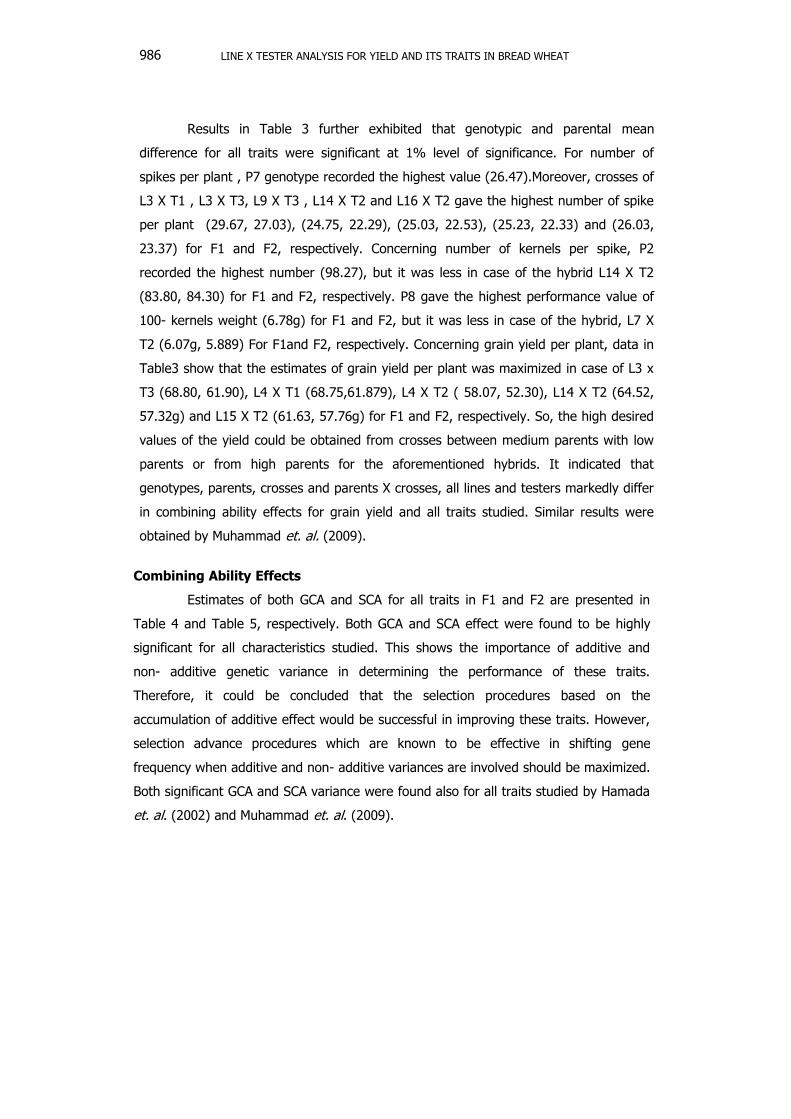
Results in Table 3 further exhibited that genotypic and parental mean
difference for all traits were significant at 1% level of significance. For number of
spikes per plant , P7 genotype recorded the highest value (26.47).Moreover, crosses of
L3 X T1 , L3 X T3, L9 X T3 , L14 X T2 and L16 X T2 gave the highest number of spike
per plant (29.67, 27.03), (24.75, 22.29), (25.03, 22.53), (25.23, 22.33) and (26.03,
23.37) for F1 and F2, respectively. Concerning number of kernels per spike, P2
recorded the highest number (98.27), but it was less in case of the hybrid L14 X T2
(83.80, 84.30) for F1 and F2, respectively. P8 gave the highest performance value of
100- kernels weight (6.78g) for F1 and F2, but it was less in case of the hybrid, L7 X
T2 (6.07g, 5.889) For F1and F2, respectively. Concerning grain yield per plant, data in
Table3 show that the estimates of grain yield per plant was maximized in case of L3 x
T3 (68.80, 61.90), L4 X T1 (68.75,61.879), L4 X T2 ( 58.07, 52.30), L14 X T2 (64.52,
57.32g) and L15 X T2 (61.63, 57.76g) for F1 and F2, respectively. So, the high desired
values of the yield could be obtained from crosses between medium parents with low
parents or from high parents for the aforementioned hybrids. It indicated that
genotypes, parents, crosses and parents X crosses, all lines and testers markedly differ
in combining ability effects for grain yield and all traits studied. Similar results were
obtained by Muhammad et. al. (2009).
Combining Ability Effects
Estimates of both GCA and SCA for all traits in F1 and F2 are presented in
Table 4 and Table 5, respectively. Both GCA and SCA effect were found to be highly
significant for all characteristics studied. This shows the importance of additive and
non- additive genetic variance in determining the performance of these traits.
Therefore, it could be concluded that the selection procedures based on the
accumulation of additive effect would be successful in improving these traits. However,
selection advance procedures which are known to be effective in shifting gene
frequency when additive and non- additive variances are involved should be maximized.
Both significant GCA and SCA variance were found also for all traits studied by Hamada
et. al. (2002) and Muhammad et. al. (2009).
ABDEL NOUR, NADYA A. R., et. al. 987
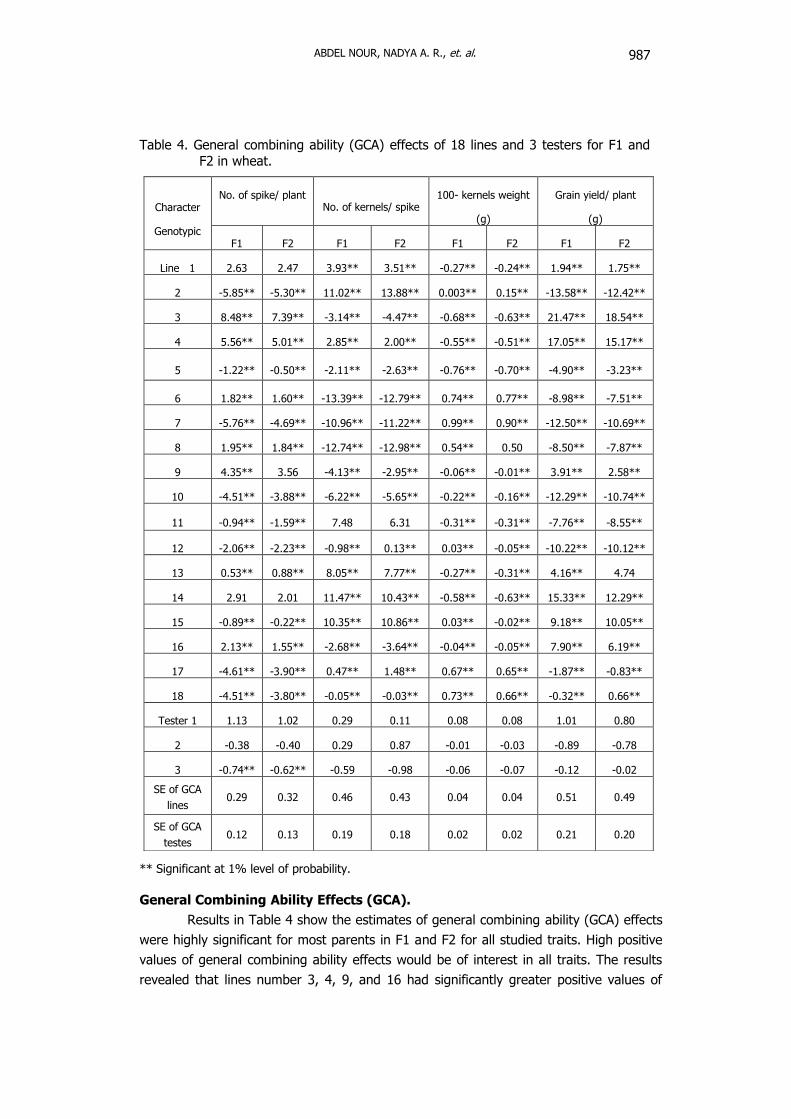
Table 4. General combining ability (GCA) effects of 18 lines and 3 testers for F1 and
F2 in wheat.
** Significant at 1% level of probability.
General Combining Ability Effects (GCA).
Results in Table 4 show the estimates of general combining ability (GCA) effects
were highly significant for most parents in F1 and F2 for all studied traits. High positive
values of general combining ability effects would be of interest in all traits. The results
revealed that lines number 3, 4, 9, and 16 had significantly greater positive values of
Grain yield/ plant
(g)
100- kernels weight
(g)No. of kernels/ spike
No. of spike/ plant Character
GenotypicF2F1F2F1F2F1F2F1
1.75**1.94**-0.24**-0.27**3.51**3.93**2.472.63Line 1
-12.42**-13.58**0.15**0.003**13.88**11.02**-5.30**-5.85**2
18.54**21.47**-0.63**-0.68**-4.47**-3.14**7.39**8.48**3
15.17**17.05**-0.51**-0.55**2.00**2.85**5.01**5.56**4
-3.23**-4.90**-0.70**-0.76**-2.63**-2.11**-0.50**-1.22**5
-7.51**-8.98**0.77**0.74**-12.79**-13.39**1.60**1.82**6
-10.69**-12.50**0.90**0.99**-11.22**-10.96**-4.69**-5.76**7
-7.87**-8.50**0.500.54**-12.98**-12.74**1.84**1.95**8
2.58**3.91**-0.01**-0.06**-2.95**-4.13**3.564.35**9
-10.74**-12.29**-0.16**-0.22**-5.65**-6.22**-3.88**-4.51**10
-8.55**-7.76**-0.31**-0.31**6.317.48-1.59**-0.94**11
-10.12**-10.22**-0.05**0.03**0.13**-0.98**-2.23**-2.06**12
4.744.16**-0.31**-0.27**7.77**8.05**0.88**0.53**13
12.29**15.33**-0.63**-0.58**10.43**11.47**2.012.9114
10.05**9.18**-0.02**0.03**10.86**10.35**-0.22**-0.89**15
6.19**7.90**-0.05**-0.04**-3.64**-2.68**1.55**2.13**16
-0.83**-1.87**0.65**0.67**1.48**0.47**-3.90**-4.61**17
0.66**-0.32**0.66**0.73**-0.03**-0.05**-3.80**-4.51**18
0.801.010.080.080.110.291.021.13Tester 1
-0.78-0.89-0.03-0.010.870.29-0.40-0.382
-0.02-0.12-0.07-0.06-0.98-0.59-0.62**-0.74**3
0.490.510.040.040.430.460.320.29SE of GCA
lines
0.200.210.020.020.180.190.130.12SE of GCA
testes
LINE X TESTER ANALYSIS FOR YIELD AND ITS TRAITS IN BREAD WHEAT
988
GCA for number of spike per plant than the other parents, that these cultivars are good
donors for improving this trait. Meantime, wheat lines 2, 11, 13, 14 and 15 showed
desirable general combining ability effects for number of kernels per spike, while lines
number 6, 7, 8, 17 and 18 for 100- kernels weight. Obviously, wheat lines number 3, 4,
14, 15 and 16 were good donors for grain yield per plant. The tester cultivar number 1
proved to be good general combiner for all traits. For GCA effects of females and males,
four lines number 3,4,14 and 15 proved as better general combiners for grain yield per
plant and most of other traits, which are important components in grain yield
improvement. These parents also contributed a large number of favorable genes for
high grain yield per plant and other related traits. Hence, four female parents could be
used in future programs to improve grain yield.
Tester number 1 appeared to be better general combiner for grain yield per
plant and some other traits. These parents presumed to have a relatively large number of
favorable alleles for these traits.
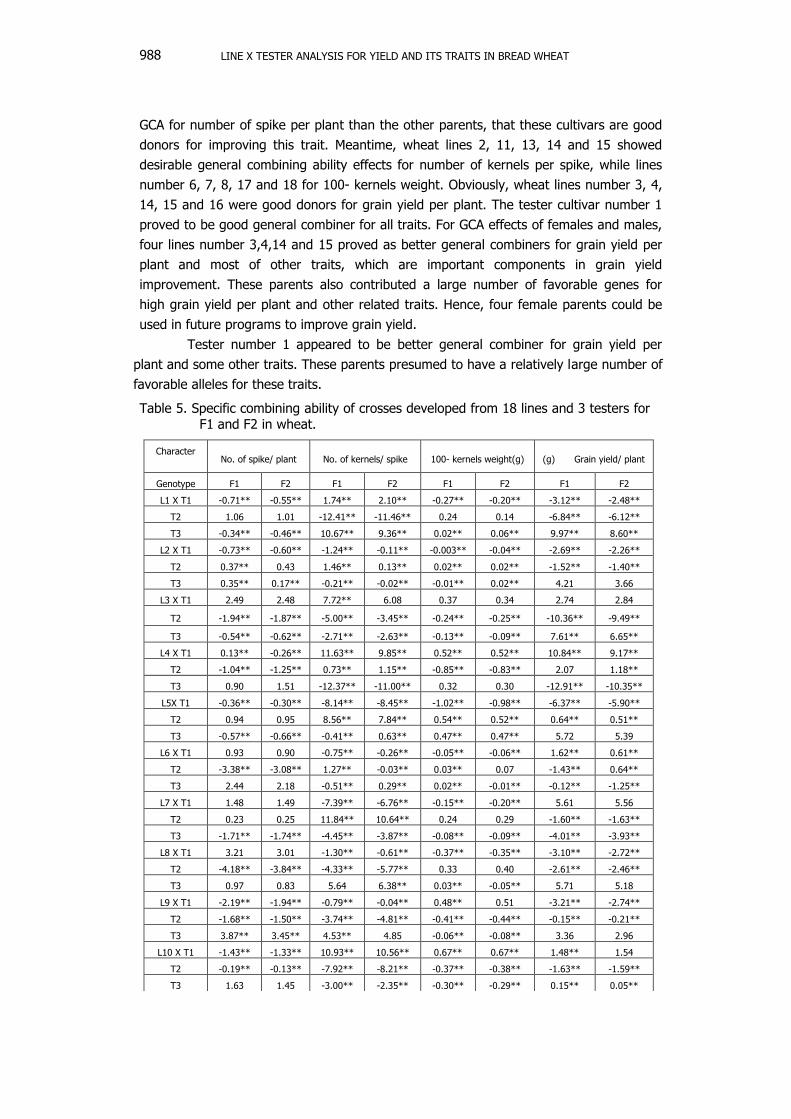
Table 5. Specific combining ability of crosses developed from 18 lines and 3 testers for F1 and F2 in wheat.
(g) Grain yield/ plant100- kernels weight(g)No. of kernels/ spikeNo. of spike/ plantCharacter
F2F1F2F1F2F1F2F1Genotype
-2.48**-3.12**-0.20**-0.27**2.10**1.74**-0.55**-0.71**L1 X T1
-6.12**-6.84**0.140.24-11.46**-12.41**1.011.06T2
8.60**9.97**0.06**0.02**9.36**10.67**-0.46**-0.34**T3
-2.26**-2.69**-0.04**-0.003**-0.11**-1.24**-0.60**-0.73**L2 X T1
-1.40**-1.52**0.02**0.02**0.13**1.46**0.430.37**T2
3.664.210.02**-0.01**-0.02**-0.21**0.17**0.35**T3
2.842.740.340.376.087.72**2.482.49L3 X T1
-9.49**-10.36**-0.25**-0.24**-3.45**-5.00**-1.87**-1.94**T2
6.65**7.61**-0.09**-0.13**-2.63**-2.71**-0.62**-0.54**T3
9.17**10.84**0.52**0.52**9.85**11.63**-0.26**0.13**L4 X T1
1.18**2.07-0.83**-0.85**1.15**0.73**-1.25**-1.04**T2
-10.35**-12.91**0.300.32-11.00**-12.37**1.510.90T3
-5.90**-6.37**-0.98**-1.02**-8.45**-8.14**-0.30**-0.36**L5X T1
0.51**0.64**0.52**0.54**7.84**8.56**0.950.94T2
5.395.720.47**0.47**0.63**-0.41**-0.66**-0.57**T3
0.61**1.62**-0.06**-0.05**-0.26**-0.75**0.900.93L6 X T1
0.64**-1.43**0.070.03**-0.03**1.27**-3.08**-3.38**T2
-1.25**-0.12**-0.01**0.02**0.29**-0.51**2.182.44T3
5.565.61-0.20**-0.15**-6.76**-7.39**1.491.48L7 X T1
-1.63**-1.60**0.290.2410.64**11.84**0.250.23T2
-3.93**-4.01**-0.09**-0.08**-3.87**-4.45**-1.74**-1.71**T3
-2.72**-3.10**-0.35**-0.37**-0.61**-1.30**3.013.21L8 X T1
-2.46**-2.61**0.400.33-5.77**-4.33**-3.84**-4.18**T2
5.185.71-0.05**0.03**6.38**5.640.830.97T3
-2.74**-3.21**0.510.48**-0.04**-0.79**-1.94**-2.19**L9 X T1
-0.21**-0.15**-0.44**-0.41**-4.81**-3.74**-1.50**-1.68**T2
2.963.36-0.08**-0.06**4.854.53**3.45**3.87**T3
1.541.48**0.67**0.67**10.56**10.93**-1.33**-1.43**L10 X T1
-1.59**-1.63**-0.38**-0.37**-8.21**-7.92**-0.13**-0.19**T2
0.05**0.15**-0.29**-0.30**-2.35**-3.00**1.451.63T3
ABDEL NOUR, NADYA A. R., et. al. 989
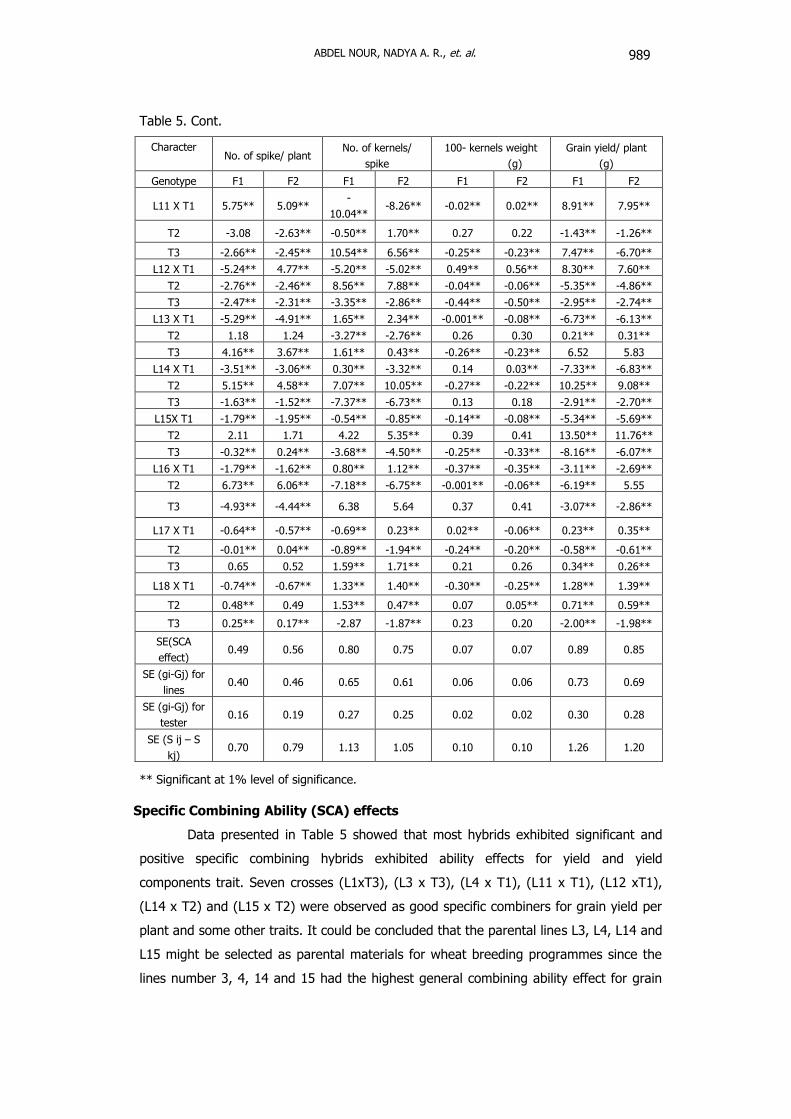
Table 5. Cont.
** Significant at 1% level of significance.
Specific Combining Ability (SCA) effects
Data presented in Table 5 showed that most hybrids exhibited significant and
positive specific combining hybrids exhibited ability effects for yield and yield
components trait. Seven crosses (L1xT3), (L3 x T3), (L4 x T1), (L11 x T1), (L12 xT1),
(L14 x T2) and (L15 x T2) were observed as good specific combiners for grain yield per
plant and some other traits. It could be concluded that the parental lines L3, L4, L14 and
L15 might be selected as parental materials for wheat breeding programmes since the
lines number 3, 4, 14 and 15 had the highest general combining ability effect for grain
Grain yield/ plant
(g)
100- kernels weight
(g)
No. of kernels/
spikeNo. of spike/ plant
Character
F2F1F2F1F2F1F2F1Genotype
7.95**8.91**0.02**-0.02**-8.26**-
10.04**5.09**5.75**L11 X T1
-1.26**-1.43**0.220.271.70**-0.50**-2.63**-3.08T2
-6.70**7.47**-0.23**-0.25**6.56**10.54**-2.45**-2.66**T3
7.60**8.30**0.56**0.49**-5.02**-5.20**4.77**-5.24**L12 X T1
-4.86**-5.35**-0.06**-0.04**7.88**8.56**-2.46**-2.76**T2
-2.74**-2.95**-0.50**-0.44**-2.86**-3.35**-2.31**-2.47**T3
-6.13**-6.73**-0.08**-0.001**2.34**1.65**-4.91**-5.29**L13 X T1
0.31**0.21**0.300.26-2.76**-3.27**1.241.18T2
5.836.52-0.23**-0.26**0.43**1.61**3.67**4.16**T3
-6.83**-7.33**0.03**0.14-3.32**0.30**-3.06**-3.51**L14 X T1
9.08**10.25**-0.22**-0.27**10.05**7.07**4.58**5.15**T2
-2.70**-2.91**0.180.13-6.73**-7.37**-1.52**-1.63**T3
-5.69**-5.34**-0.08**-0.14**-0.85**-0.54**-1.95**-1.79**L15X T1
11.76**13.50**0.410.395.35**4.221.712.11T2
-6.07**-8.16**-0.33**-0.25**-4.50**-3.68**0.24**-0.32**T3
-2.69**-3.11**-0.35**-0.37**1.12**0.80**-1.62**-1.79**L16 X T1
5.55-6.19**-0.06**-0.001**-6.75**-7.18**6.06**6.73**T2
-2.86**-3.07**0.410.375.646.38-4.44**-4.93**T3
0.35**0.23**-0.06**0.02**0.23**-0.69**-0.57**-0.64**L17 X T1
-0.61**-0.58**-0.20**-0.24**-1.94**-0.89**0.04**-0.01**T2
0.26**0.34**0.260.211.71**1.59**0.520.65T3
1.39**1.28**-0.25**-0.30**1.40**1.33**-0.67**-0.74**L18 X T1
0.59**0.71**0.05**0.070.47**1.53**0.490.48**T2
-1.98**-2.00**0.200.23-1.87**-2.870.17**0.25**T3
0.850.890.070.070.750.800.560.49SE(SCA
effect)
0.690.730.060.060.610.650.460.40 SE (gi-Gj) for
lines
0.280.300.020.020.250.270.190.16SE (gi-Gj) for
tester
1.201.260.100.101.051.130.790.70SE (S ij – S
kj)
LINE X TESTER ANALYSIS FOR YIELD AND ITS TRAITS IN BREAD WHEAT
990
yield per plant and some other traits. Other crosses had worthless to mention because
these were found as poor combiner especially for grain yield per plant .Better specific
combining crosses might involved four good general combining parents, but this is not a
rule for all cross . It can be concluded that crosses (L3 x T3), (L4 x T1), (L14 x T2) and
(L15 x T2) were excellent harmonious combinations for SCA effects for all traits
including grain yield per plant. It would yield transgressive segregants for grain yield
plant in late segregating generations. Mass selection would be effective in late
segregating generations in these crosses due to predominant non – additive gene action
being operated for all traits. Such results were in agreement with those reported by
Hamada et. al. (2002) and Muhammad et al. (2009). From the above – mentioned
results it could be suggested that one or more of these hybrids might be in corporated in
wheat breeding program to improve grain yield and its components.
REFERENCES
1. Ahmed, J. A. A. Z., B. Y. Samadi, A. Talaie, M. R. Channadha and A. Saeidi. 2003.
A study of combining ability and gene effect in bread wheat under drought stress
conditions by diallel method. Iranian J.Agri. Sci. 34: 1-8.
2. Gupta, R. R., and Z. Ahmed 1995. Line X tester analysis for some metric traits in
macroni wheat. Crop Improvement, 22 (2): 224-249.
3. Hamada, A. A., E.H.Seidy and H. I. Hendawy. 2002. Breeding measurements for
heading date, yield and yield components in wheat using line X tester analysis.
Annals Agric. Sci., Ain Shams Univ, Cairo.47(2), 587-609.
4. Hassan, E. E. and A. M. Abd El- Moniem. 1991. Combining ability, heterosis and
gene action of some quantitave characters in wheat. Zagazig J. Agric. Res. 18(5):
1369 – 1381.
5. Joshi S. K., S. N. Sharma, D. L. Singhania and R. S. Sain.2003.Genetic analysis of
yield and its component traits in spring wheat, Triticum aestivum L. Acta
Agronomica Hungarica.51: 139- 147.
6. Masood, M. S. and W. E. Kronstad. 2000. Combining ability analysis over various
generations in a diallel cross of bread wheat. Pak. J.Agric. Res. 16:1-4.
7. Muhammad, A., J. Anwar, M. Hussain, M. H. Qureshi and S. Khan. 2009. Line X
tester analysis in bread wheat (Triticum aestivum L.). J.Agric. Res. 47 (1): 411-
420.
8. Rajara, M. P. and R. V. Maheshwari. 1996. Combining ability in wheat using line x
tester analysis. Madras, Agric. J. 33(2): 107-110.
ABDEL NOUR, NADYA A. R., et. al. 991
9. Salem, A. H. and E. E. Hassan. 1991. Estimates of some breeding Parameters for
yield and its attributes in wheat using line x tester analysis. Zagazig J. Agric. Res,
18 (5): 1357-1368.
10. Sing, R. K. and B. D. Chaudhry. 1979. Biometrical methods in quantitative genetics
analysis. 191-199. 2nd Ed. Kalyan: Publishers, New Delhi, India.
11. Singh, B. D., P. K. Majumdar and K. K. Prasad. 2000. Combining ability for yield
and its components in late sown wheat. J. Appl. Biol.10:119-126.
12. Singh, R. P., I. Singh, S. C. Sharman and L. D. Tripathi. 1994. Impact of Genetic
background of testers on some biometrical Parameters in wheat (Triticum
aestivum L.). Indian J.Agric.Res.28 (2):93-98.
13. Suleyman, S. and N. Akguni. 2007. Combining ability and inheritance of some
agronomic traits in bread wheat (Triticum aestivium L.). Ziraat Fakultesi Dergisi.
21(41): 104-108.
LINE X TESTER ANALYSIS FOR YIELD AND ITS TRAITS IN BREAD WHEAT
992
X
/
X /
/
,,
L4XT1, L14XT3,
L15XT2 L3XT3,