Embed Size (px)
Citation preview
LIMESTONE CRUSHING PLANT LOAD MANAGEMENT
Jaco Snyman
2012-08-15
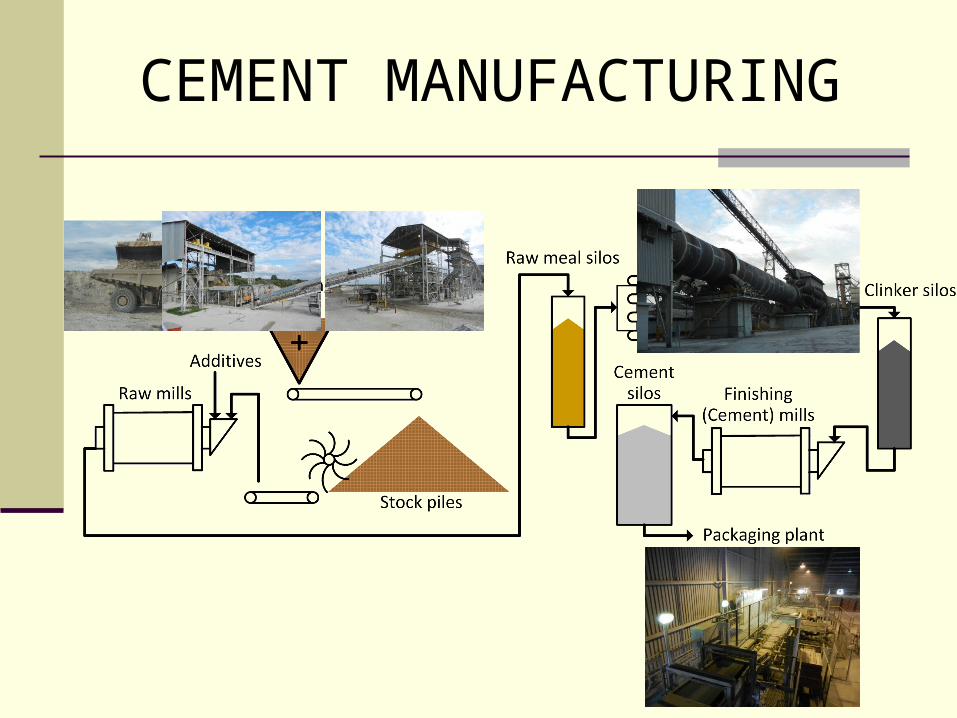
CEMENT MANUFACTURING
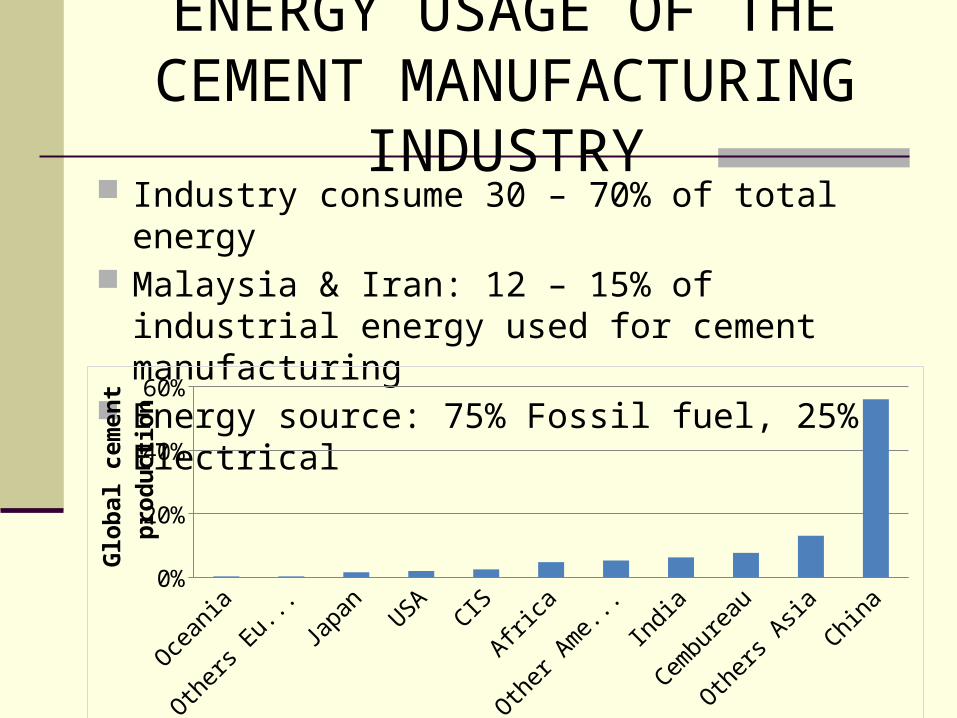
ENERGY USAGE OF THE CEMENT MANUFACTURING
INDUSTRY Industry consume 30 – 70% of total energy Malaysia & Iran: 12 – 15% of industrial energy
used for cement manufacturing Energy source: 75% Fossil fuel, 25% Electrical
Ocean
ia
Others
Europe
Japan USA CIS
Africa
Other A
merica
India
Cembureau
Others
AsiaChina
0%10%20%30%40%50%60%
Glo
bal c
emen
t pr
oduc
tion
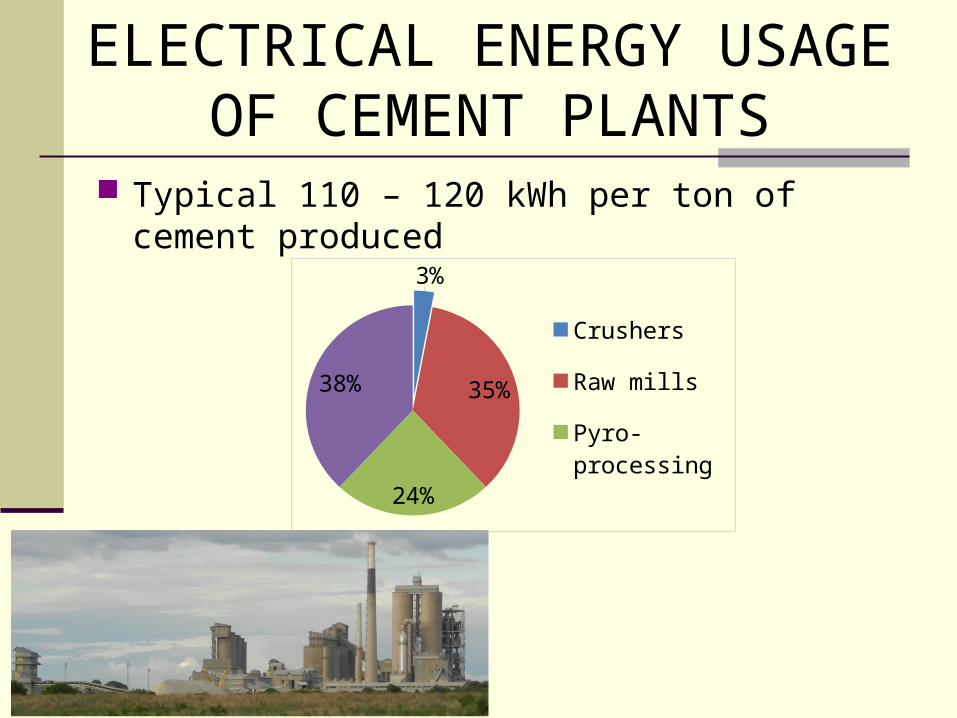
ELECTRICAL ENERGY USAGE OF CEMENT PLANTS
Typical 110 – 120 kWh per ton of cement produced
3%
35%
24%
38%
Crushers
Raw mills
Pyro-processing
Finnishing mills and packaging
ENERGY SAVINGS – PREVIOUS STUDIES
No comprehensive review on energy usage & savings up to 2012
Recent studies estimate: Grinding energy can be reduced with 10 – 20%
by increasing mill efficiency & schedules. Waste heat from pyro processing can be used
to increase efficiency with 2 - 10%.
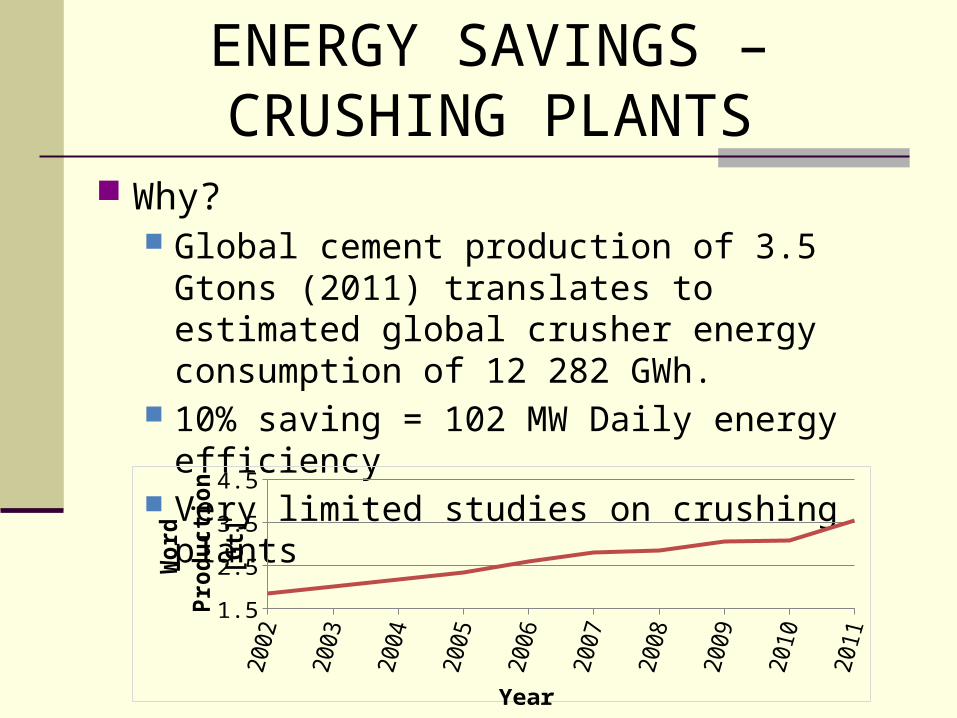
ENERGY SAVINGS – CRUSHING PLANTS
Why? Global cement production of 3.5 Gtons (2011)
translates to estimated global crusher energy consumption of 12 282 GWh.
10% saving = 102 MW Daily energy efficiency Very limited studies on crushing plants
1.52.02.53.03.54.0
Year
Wor
d Pr
oduc
tion
[Gt]
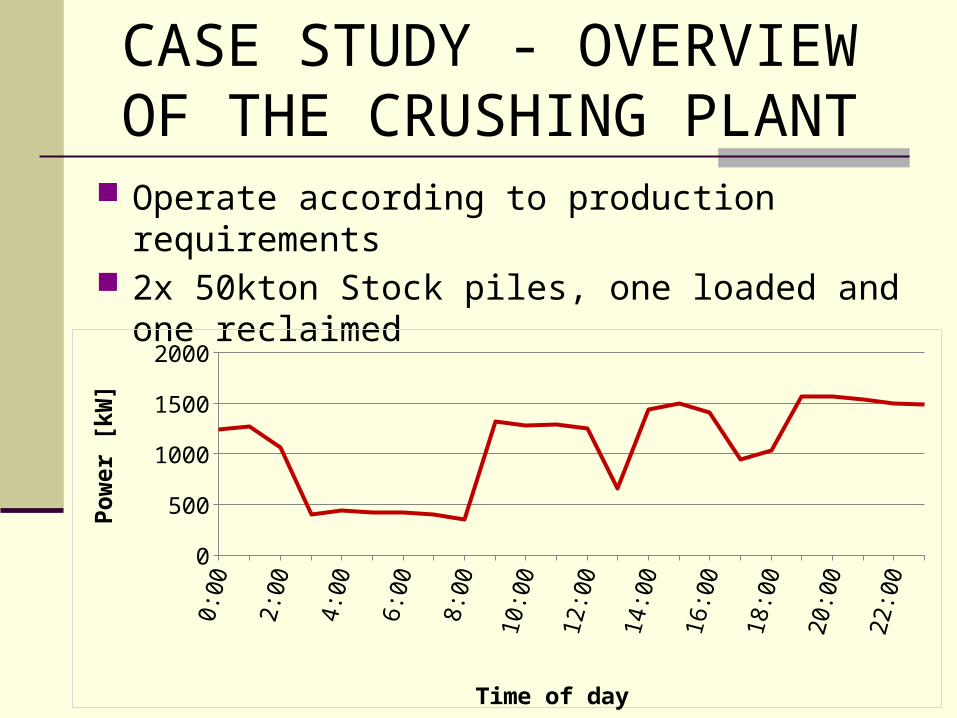
CASE STUDY - OVERVIEW OF THE CRUSHING PLANT
Operate according to production requirements 2x 50kton Stock piles, one loaded and one
reclaimed
0200400600800
10001200140016001800
Time of day
Pow
er [k
W]
REDUCING ENERGY COST OF THE CRUSHING PLANT
1. Determine required stock-pile levels using: Present stock levels (raw meal, clinker &
cement) Sales forecast
2. Optimise crusher running schedule to: Avoid running during Eskom peak periods Maintain minimum required stock Accommodate optimised maintenance
schedules
3. Update proposed daily, weekly and monthly schedules on a daily basis
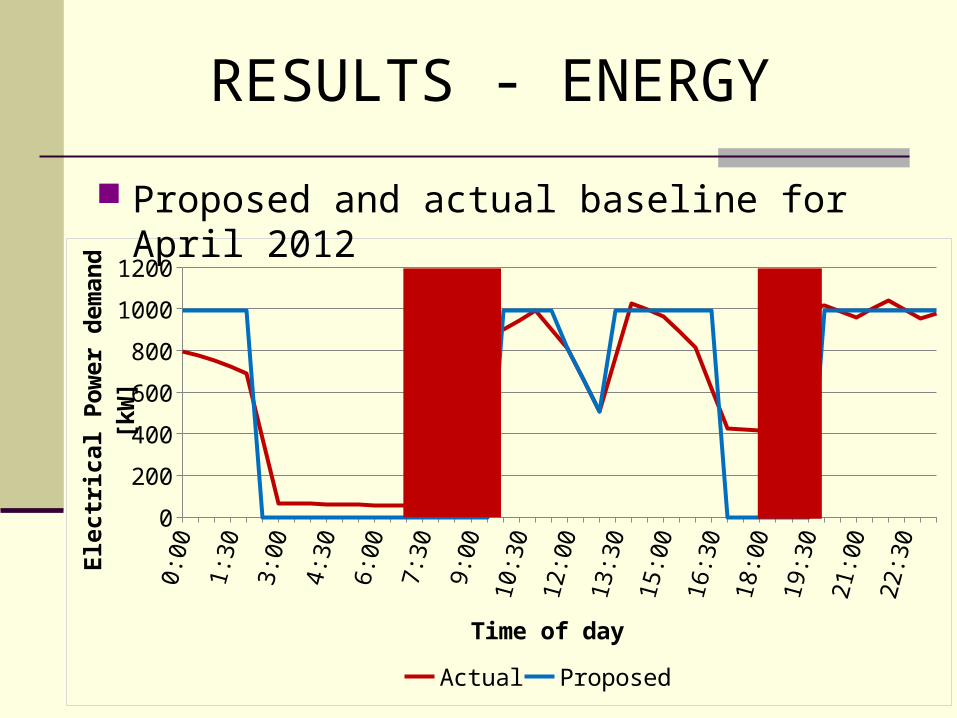
RESULTS - ENERGY0:
001:
002:
003:
004:
005:
006:
007:
008:
009:
0010
:00
11:0
012
:00
13:0
014
:00
15:0
016
:00
17:0
018
:00
19:0
020
:00
21:0
022
:00
23:0
0
0
200
400
600
800
1000
1200
Actual Proposed
Time of day
Ele
ctri
cal
Po
wer
dem
and
[kW
]
Proposed and actual baseline for April 2012
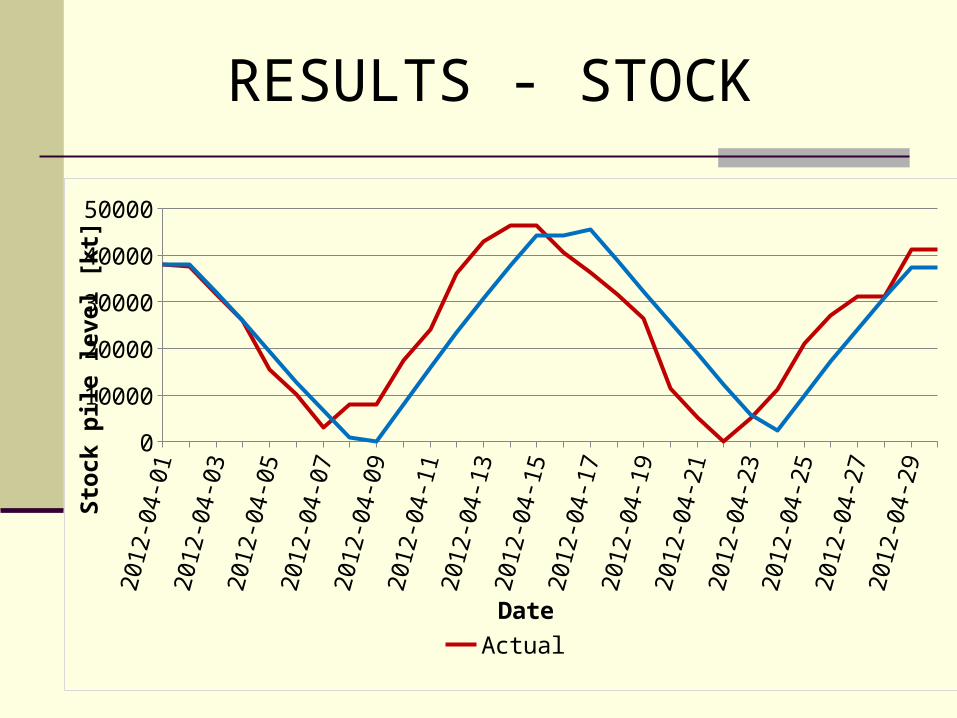
RESULTS - STOCK20
12-0
4-01
2012
-04-
0220
12-0
4-03
2012
-04-
0420
12-0
4-05
2012
-04-
0620
12-0
4-07
2012
-04-
0820
12-0
4-09
2012
-04-
1020
12-0
4-11
2012
-04-
1220
12-0
4-13
2012
-04-
1420
12-0
4-15
2012
-04-
1620
12-0
4-17
2012
-04-
1820
12-0
4-19
2012
-04-
2020
12-0
4-21
2012
-04-
2220
12-0
4-23
2012
-04-
2420
12-0
4-25
2012
-04-
2620
12-0
4-27
2012
-04-
2820
12-0
4-29
2012
-04-
30
0
10000
20000
30000
40000
50000
Actual Proposed
Date
Stoc
k pi
le le
vel [
kt]
CONCLUSION
Savings not realised due to: Unexpected equipment failure Unexpected sales & lack of confidence in
proposed schedules Negative attitude from personnel
Average peak time saving of 1.2 MW possible in this study
Global saving of 102MW possible, 50% in China
Address challenges to realise potential savings

QUESTIONS ?