Embed Size (px)
Citation preview
Light a lamp and look at the stock marketRadeef Chundakkadan*
IntroductionThe Coronavirus (COVID-19) outbreak in China at the end of 2019 spread around the globe and infected millions of people. The World Health Organization (WHO) declared COVID-19 a pandemic on March 11, 2020, and several countries opted for nation-wide lockdowns. As a result, economic activities were adversely affected, and major stock markets indices plunged (IMF 2020; Zhang et al. 2020; Phan and Narayan 2020). The case of India was not different; the government declared a lockdown and imposed social distancing and isolation measures. As a consequence, on the one hand, economic growth projection fell to 1.9%, and the stock market was drastically affected (IMF 2020; Mishra et al. 2020). On the other hand, the lockdown affected the mental health of peo-ple because of (1) the loss of livelihood or lack of employment, and (2) depressing news on COVID-19.1
During this challenging time, the government of India called for the light-a-lamp event. This event urged people to switch off all of the lights in their house and to light a lamp, candle, or mobile flashlight for nine minutes. The aim of the event was to express solidarity in the fight against the pandemic, and a vast multitude of the popu-lation participated. We hypothesize that the event may have provided psychological relief to the people during the pandemic period and that their positive mood might have been reflected in the stock market. More specifically, we link the event to stock market behavior.
Abstract
In this study, we investigate the impact of the light-a-lamp event that occurred in India during the COVID-19 lockdown. This event happened across the country, and millions of people participated in it. We link this event to the stock market through investor sentiment and misattribution bias. We find a 9% hike in the market return on the post-event day. The effect is heterogeneous in terms of beta, downside risk, volatility, and financial distress. We also find an increase (decrease) in long-term bond yields (price), which together suggests that market participants demanded risky assets in the post-event day.
Keywords: Event effect, Investor sentiment, Stock market, Behavioral finance, Lockdown, Covid-19
Open Access
© The Author(s) 2021. Open Access This article is licensed under a Creative Commons Attribution 4.0 International License, which permits use, sharing, adaptation, distribution and reproduction in any medium or format, as long as you give appropriate credit to the original author(s) and the source, provide a link to the Creative Commons licence, and indicate if changes were made. The images or other third party material in this article are included in the article’s Creative Commons licence, unless indicated otherwise in a credit line to the mate-rial. If material is not included in the article’s Creative Commons licence and your intended use is not permitted by statutory regulation or exceeds the permitted use, you will need to obtain permission directly from the copyright holder. To view a copy of this licence, visit http:// creat iveco mmons. org/ licen ses/ by/4. 0/.
RESEARCH
Chundakkadan Financ Innov (2021) 7:19 https://doi.org/10.1186/s40854-021-00232-6 Financial Innovation
*Correspondence: [email protected] Department of Liberal Arts, Indian Institute of Technology Bhilai, Raipur, Chhattisgarh 492015, India
1 WHO (2020) has advised paying little attention to COVID-19 news to reduce stress and anxiety.
Page 2 of 21Chundakkadan Financ Innov (2021) 7:19
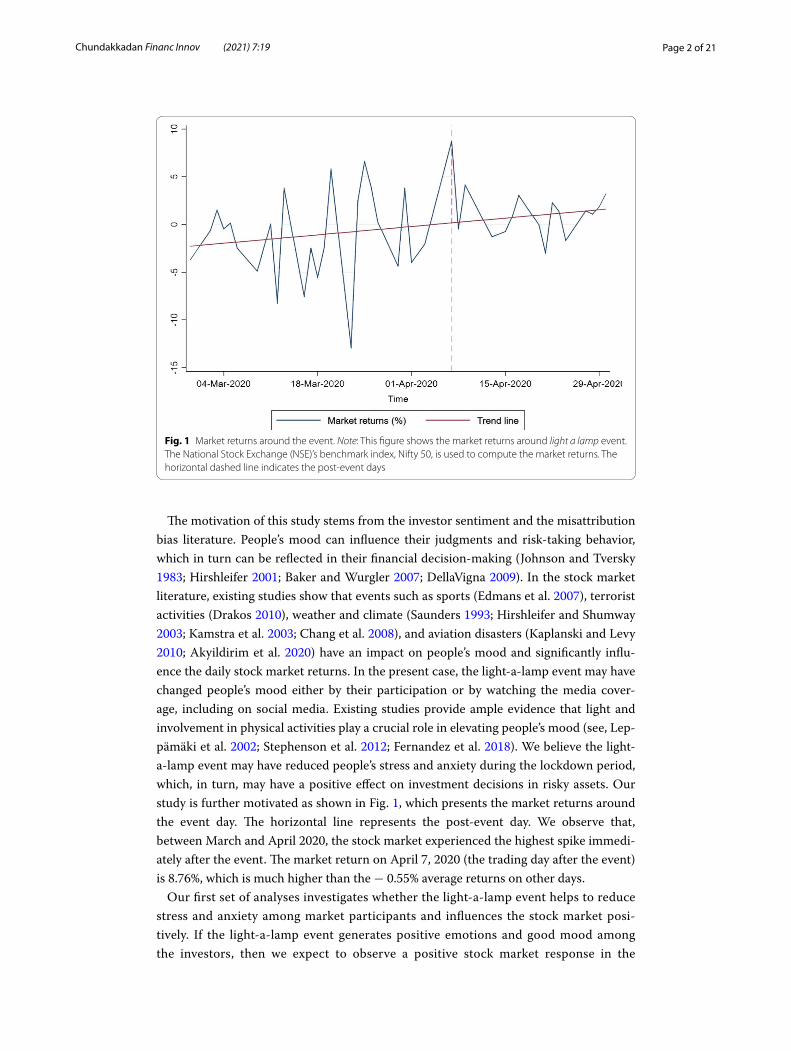
The motivation of this study stems from the investor sentiment and the misattribution bias literature. People’s mood can influence their judgments and risk-taking behavior, which in turn can be reflected in their financial decision-making (Johnson and Tversky 1983; Hirshleifer 2001; Baker and Wurgler 2007; DellaVigna 2009). In the stock market literature, existing studies show that events such as sports (Edmans et al. 2007), terrorist activities (Drakos 2010), weather and climate (Saunders 1993; Hirshleifer and Shumway 2003; Kamstra et al. 2003; Chang et al. 2008), and aviation disasters (Kaplanski and Levy 2010; Akyildirim et al. 2020) have an impact on people’s mood and significantly influ-ence the daily stock market returns. In the present case, the light-a-lamp event may have changed people’s mood either by their participation or by watching the media cover-age, including on social media. Existing studies provide ample evidence that light and involvement in physical activities play a crucial role in elevating people’s mood (see, Lep-pämäki et al. 2002; Stephenson et al. 2012; Fernandez et al. 2018). We believe the light-a-lamp event may have reduced people’s stress and anxiety during the lockdown period, which, in turn, may have a positive effect on investment decisions in risky assets. Our study is further motivated as shown in Fig. 1, which presents the market returns around the event day. The horizontal line represents the post-event day. We observe that, between March and April 2020, the stock market experienced the highest spike immedi-ately after the event. The market return on April 7, 2020 (the trading day after the event) is 8.76%, which is much higher than the − 0.55% average returns on other days.
Our first set of analyses investigates whether the light-a-lamp event helps to reduce stress and anxiety among market participants and influences the stock market posi-tively. If the light-a-lamp event generates positive emotions and good mood among the investors, then we expect to observe a positive stock market response in the
Fig. 1 Market returns around the event. Note: This figure shows the market returns around light a lamp event. The National Stock Exchange (NSE)’s benchmark index, Nifty 50, is used to compute the market returns. The horizontal dashed line indicates the post-event days

Page 3 of 21Chundakkadan Financ Innov (2021) 7:19
post-event days. On the contrary, the positive relationship between people’s mood and stock returns cannot be generalized globally (Pizzutilo and Roncone 2017). If the stock market behaves efficiently in accordance with economic fundamentals, then the event has an insignificant effect on the returns (see, Fama 1970; Fama and French 2015). Using daily market returns data for the period from March 1 to April 30, 2020, we present evidence for sentiment-driven stock market movements. Our econometric analysis suggests that there is a 9% hike in the returns on the next trading day of the event.
There is a broad consensus that sentiment-led stock movements reverse in the follow-ing days (Tetlock 2007; Garcia 2013; Da et al. 2015). If the market gain is due to the actual economic benefit resulting from the event, then we do not expect to find a rever-sal. But, if the change in the returns is due to the mood and emotions, we would expect to see an immediate reversal. Since the event under study does not have explicit eco-nomic significance, we expect to see a price reversal in the following days. Following Da et al. (2015), we test the price reversal for the following 5 days. Indeed, we find signifi-cant evidence for a reversal on the fourth day after the event. One possible explanation for the reversal is that market participants may react immediately after the event and return to their regular trading behavior after a few days (Lee et al. 1991; Kaplanski and Levy 2010). Another explanation, according to cognitive ease and cognitive strain theo-ries (Kahneman 2011), is that investors may have made mistakes in a relaxed environ-ment after the event and then rectified this mistake in the following days.
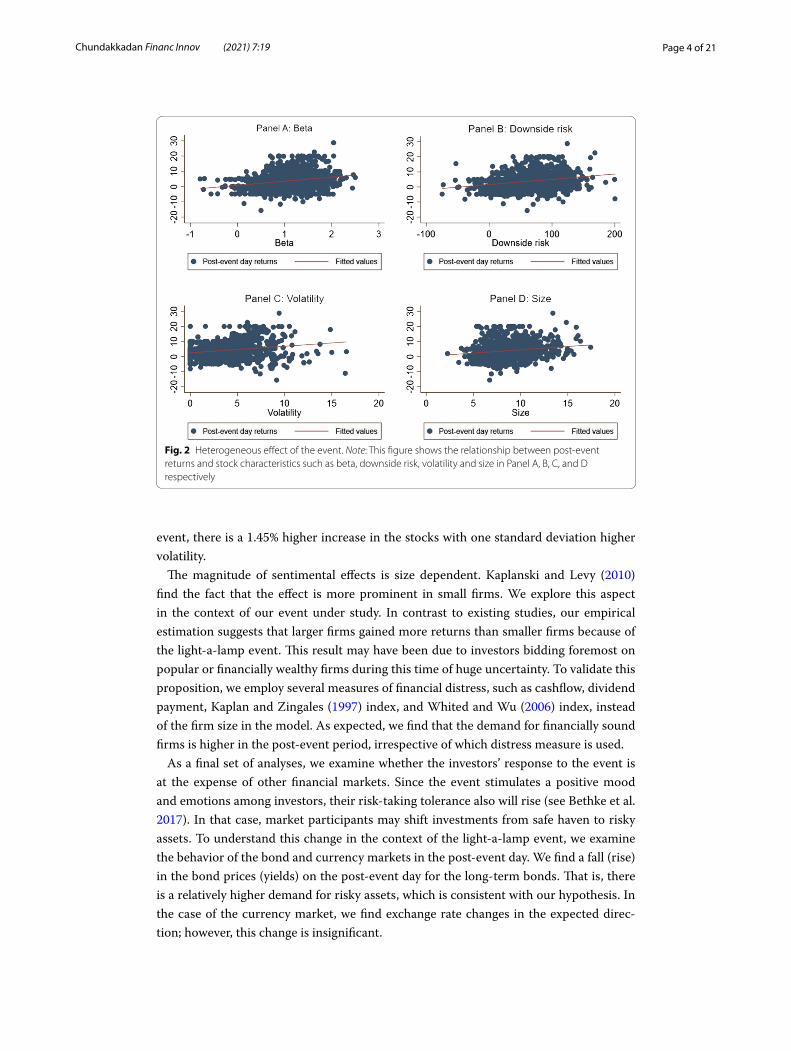
Furthermore, the effect of sentiments may not be uniform across the stocks. This effect will be higher for assets with valuations that are highly subjective and difficult to arbitrage (Shleifer and Vishny 1997; Baker and Wurgler 2006, 2007). In that case, we sus-pect that the magnitude of sentiment effect of the light-a-lamp event will be different for stocks with a higher degree of so-called limit to arbitrage. Figure 2 shows the relation-ship between post-event returns and stock characteristics. We use beta, downside risk, volatility, and size as stock characteristics in Panel A, B, C, and D, respectively. A clear-cut heterogeneity is evident in the returns. A higher beta, downside risk, volatility, and size are associated with a higher return on the next day of the event. We analyze these relationships more rigorously using econometric tools.
Using firm-level data, we first examine the differential impact of sentiment on stocks with different beta. The stocks with a higher beta are more subject to speculative trad-ing of sentimental investors (Baker et al. 2011). As a result, they may be unattractive to arbitrageurs who take advantage of investors’ irrational behavior. We find that stocks with one standard deviation higher beta are associated with a 1.45% higher return on the immediate day of the event. Since the standard capital asset pricing model (CAPM) beta does not account for the downside risk (Ang et al. 2006), we follow Bawa and Lindenberg (1977) to construct “downside beta” as a proxy for downside risk. Our empirical findings reveal that a one standard deviation increase in the downward risk is associated with 2.4% higher returns on the immediate day of the event. Another heterogeneous effect that we explore is in terms of return volatility. Existing studies show that the sentimen-tal effect is more substantial on a stock with higher volatility (Wurgler and Zhuravs-kaya 2002; Da et al. 2015). Therefore, we examine the differential impact of light-a-lamp event sentiments on returns of low- and high-volatility stocks. On the next day of the
Page 4 of 21Chundakkadan Financ Innov (2021) 7:19
event, there is a 1.45% higher increase in the stocks with one standard deviation higher volatility.
The magnitude of sentimental effects is size dependent. Kaplanski and Levy (2010) find the fact that the effect is more prominent in small firms. We explore this aspect in the context of our event under study. In contrast to existing studies, our empirical estimation suggests that larger firms gained more returns than smaller firms because of the light-a-lamp event. This result may have been due to investors bidding foremost on popular or financially wealthy firms during this time of huge uncertainty. To validate this proposition, we employ several measures of financial distress, such as cashflow, dividend payment, Kaplan and Zingales (1997) index, and Whited and Wu (2006) index, instead of the firm size in the model. As expected, we find that the demand for financially sound firms is higher in the post-event period, irrespective of which distress measure is used.
As a final set of analyses, we examine whether the investors’ response to the event is at the expense of other financial markets. Since the event stimulates a positive mood and emotions among investors, their risk-taking tolerance also will rise (see Bethke et al. 2017). In that case, market participants may shift investments from safe haven to risky assets. To understand this change in the context of the light-a-lamp event, we examine the behavior of the bond and currency markets in the post-event day. We find a fall (rise) in the bond prices (yields) on the post-event day for the long-term bonds. That is, there is a relatively higher demand for risky assets, which is consistent with our hypothesis. In the case of the currency market, we find exchange rate changes in the expected direc-tion; however, this change is insignificant.
Fig. 2 Heterogeneous effect of the event. Note: This figure shows the relationship between post-event returns and stock characteristics such as beta, downside risk, volatility and size in Panel A, B, C, and D respectively

Page 5 of 21Chundakkadan Financ Innov (2021) 7:19
This paper contributes to the pandemic literature in the following ways. The first is the uniqueness of the event during the pandemic time. Even though several other festivals such as Easter and Eid appeared during the lockdown, they mostly cater to a specific group of people. The light-a-lamp event, however, grabbed the attention of the entire country and flooded the related news in the media outlets. Second, we link this event with the stock market. The existing studies during the pandemic largely focus on its adverse effect on stock market (Ali et al. 2020; Haroon and Rizvi 2020a; Mishra et al. 2020; Phan and Narayan 2020; Salisu and Akanni 2020). We focus, however, on a par-ticular event that may alter the behavior of financial asset traders during the pandemic. Because this event happened when most people faced a depressing and challenging time, the psychological relief from this event should be substantial, and thus, its sentiment-led impact on the stock market requires special attention (Edmans et al. 2007; Drakos 2010; Akyildirim et al. 2020). Finally, we provide robust evidence for a stock market boost in the post-event day combined with an adverse effect on the long-term bond yields. In light of limit to arbitrage, we also find immense heterogeneity in the event effect.
The remainder of this paper is organized as follows. "The event and the review of liter-ature" section provides an overview of the event and trace out relevant existing studies. "Data and methodology" section explains the data and empirical framework. "Results" section presents our estimation findings. "The event and other financial markets" pro-vides evidence of the impact of the event on bond and currency markets. Finally, "Con-clusion" concludes the study.
The event and the review of literatureLight‑a‑lamp event: an overview
To control the spread of COVID-19 across the country, the Indian government declared a lockdown and adopted strict quarantine measures beginning March 24, 2020. The lockdown initially was announced for a period of 21 days and was later extended until the end of May. The social distancing and isolation measures imposed during these days led to spike in the rate of unemployment and people lost their livelihood. These meas-ures also became one of the main reasons for psychological stress among people. In addi-tion, the mental health of people was influenced by depressing news on COVID-19 too. During this disappointing time, the prime minister of India addressed the nation and called for the light-a-lamp event. The event urged the people to switch off all lights in their house and to light a lamp, candle, or mobile flashlight for nine minutes at 9:00 p.m. on April 5, 2020. Although the purpose of the event was to show solidarity and unity in the fight against the pandemic,2 it has also provided psychological relief to the people.3
2 The event received considerable criticism in terms of (a) avoiding real issues, (b) being unscientific, and (c) gathering of people during the time of lockdown. The objective of this paper is not to assess whether this was a good or bad event, but rather to evaluate investor sentiment following the light-a-lamp event.3 The event received international attention in terms of boosting India’s spirit. See https:// www. busin ess- stand ard. com/ artic le/ news- ani/ pm- modi- boost ing- india-s- spirit- to- fight- covid- 19- say- exper ts- 12004 03007 84_1. html. Many people participated in the event with devotional songs, mantras, and national anthem. See pictures https:// www. thewe ek. in/ news/ enter tainm ent/ 2020/ 04/ 06/ in- pics- celeb rities- light- candl es- diyas- parti cipate- modi- initi ative. html? utm_ source= dlvr. it& utm_ medium= faceb ook.

Page 6 of 21Chundakkadan Financ Innov (2021) 7:19
Millions of people participated in the event. The following are some of the news head-lines from the day after the event.4
“Millions of Indians respond to PM’s appeal; light candles, diyas, turn on mobile phone torches” (Economic Times, April 6, 2020)“Coronavirus: India holds lights-off vigil as Modi calls for unity” (BBC, April 6, 2020)“Nine minutes of cheer even as coronavirus cases spiral” (Live Mint, April 6, 2020)“Coronavirus: India lights up to heed Modi’s call for unity” (Al-Jazeera, April 6, 2020)
Review of literature
Before the outbreak of COVID-19, pandemic related studies on stock market were largely focused on influenza and SARS. Mctier et al. (2011) examine the reaction of the U.S. stock market to the flu. They argue that the rate of increase in the flu is negatively associated with stock returns. Chen et al. (2007) provide evidence for the stock market plunge in the Taiwan stock market during the SARS outbreak, especially in the hotel industry. In a similar line, Mei-Ping et al. (2018) find that the SARS outbreak weakens the integration of Asian stock markets.
The recent outbreak of COVID-19 gained significant attention in the literature on financial markets. The initial studies exploring the impact of the pandemic have identi-fied a drastic plummet in the stock market (Phan and Narayan 2020; Zhang et al. 2020), and this result is supported by the findings of succeeding studies. Narayan and Phan (2020) find that the lockdown of economic activities globally has been reflected signifi-cantly in the stock market. Ali et al. (2020) explores the effect of the pandemic on differ-ent financial securities and compares the situation of the Chinese economy with other economies. They find a significant adverse effect of COVID-19 in the financial market, including the commodities market. Haroon and Rizvi (2020a) find the media coverage on the pandemic has significantly increased the volatility in the equity market. The fall in the number of confirmed COVID-19 cases leads to an improvement in market liquidity in the financial market (Haroon and Rizvi 2020b). During this challenging time, Salisu and Sikiru (2020) also find that Islamic stocks serve as a good hedge against the crisis. The peril of the pandemic on Indian markets is not different. A recent study by Mishra et al. (2020) finds that the impact of the current crisis on the Indian stock market is more severe than during the time of demonetization and implementation of the goods and services tax.
Unlike these studies, using a time-varying parameter vector autoregression model, Liu et al. (2020) find a positive reaction of the stock market for the pandemic crisis. In the same fashion, He et al. (2020) find a positive stock market response in the Chinese stock exchange, especially in the manufacturing, information technology, education, and
4 On the day of the event, the hashtag on the event was one of the top Twitter trends. See https:// www. livem int. com/ news/ india/ modi-s- covid- 19- call- for- sunday- lights- up- twitt er- india- with- multi ple- trends- 11586 10541 4011. html.

Page 7 of 21Chundakkadan Financ Innov (2021) 7:19
health industries. Furthermore, the impact of the pandemic is observed not only in the stock market but also in other financial markets, such as oil market (e.g., see Qin et al. 2020; Apergis and Apergis 2020; Fu and Shen 2020; Gil-Alana and Monge 2020; Narayan 2020a, b; Huang and Zheng 2020; Devpura and Narayan 2020) and foreign exchange market (Iyke 2020; Narayan 2020a, b). In general, no studies explore the effect of an event that happened during the time of COVID-19 on financial market in response to people’s emotions.
Data and methodologyData
To study the impact of the event on stock market, we use both market index data and firm-level data from CMIE-Prowess for the period from March, 1 to April 30, 2020. The study period includes 39 trading days. Our dataset has both trading-related and account-ing measures (as on March 2020). To analyze the event effect on the fixed-income mar-ket, we use bond yields of 3-month, 6-month, 1-year, 3-year, 10-year, 15-year, 19-year, 24-year, and 30-year government securities. The bond yields are based on trade that happened in the National Stock Exchange and are collected from investing.com. Finally, we obtain exchange rate data from the Reserve Bank of India database to investigate the effect of event on currency market.
Methodology
The event and stock market reaction
To investigate the sentiment-driven effect of the event on the stock market, similar to Kaplanski and Levy (2010), we estimate the following model:
where rt is the daily returns at time t, calculated as log change of Nifty 50 index. Fol-lowing Da et al. (2015), k takes a value from 1 to 5. Event is a dummy variable that takes a value equal to 1 for the post-event trading day (April 7, 2020); zero otherwise. Our control variables include past returns; day-of-the-week and month fixed effects; trading-related variables such as price-to-earnings ratio, price-to-book value ratio, and volume; and trend.5 Our main variable of interest is Event. If the event under consideration posi-tively influences people’s mood during the difficult time of the lockdown, we expect a positive and significant value for β . On the contrary, if the event is not sufficient to boost investor sentiment in the market, we expect an insignificant reaction from the stock market.
Limit to arbitrage and heterogenous effect
Our next set of analyses investigates the heterogeneous effect of the event on different stocks. For that, we use firm-level data and estimate the following model:
(1)rt+k = α + βEventt + Controls + εt+k ,
(2)ri,t+k = α + βEventt + γXi,t + δEventt ∗ Xi,t + Controls + εi,t+k , k = 1 to 5,
5 The descriptive statistics of the variables are provided in Table 8 in “Appendix”.

Page 8 of 21Chundakkadan Financ Innov (2021) 7:19
where rit is the daily returns of firm i at time t; and X is the set of main firm-level explan-atory variables. The set X includes beta (Beta), downside risk (DS_Beta), volatility (Vola-tility), size (Size), and financial distress measures.6 The main variable of interest is the interaction between Event and X. Beta is a risk factor from the capital asset pricing model (Sharpe 1964; Lintner 1965). Following Bawa and Lindenberg (1977), we use downside beta as a proxy for downside risk, measured as follows: DS_Betai =
cov(ri,rm|rm<average_rm)
var(rm|rm<average_rm), where DS_Beta is the downside risk; ri and rm are
individual stock and market returns respectively; and average_rm is the average market return. This measure is constructed using the data in our sample.
The volatility of the return is calculated by Garman and Klass (1980) method, as follows:
where h, l, o, and c are the highest, lowest, opening, and closing prices, respectively. Size of the firm is measured as log of total assets. We use several proxies to account for financial distress of a firm, including cashflow, dividend, Kaplan and Zingales index, and Whited and Wu index (Fazzari et al. 1988; Kaplan and Zingales 1997; Whited and Wu 2006).
where KZI is the Kaplan and Zingales index, and WWI is the Whited and Wu index. Cashflow is the cashflow measured by the ratio of the sum of profit after tax, depre-ciation, and amortization to total assets. Debt is measured by total debts to total assets. Dividend is a dummy variable that takes a value equal to 1 if the firm pays the dividend; zero otherwise. Cash is measured as the ratio of total cash in hand to the total assets. Tobin’s Q is measured by the ratio of market capitalization to the total assets. Total Assets (a proxy for firm size) is measured by the log of total assets. SG is the annual sales growth, and ISG denotes industry sales growth. To calculate ISG, we divide firms into different industry groups based on the 2-digit National Industrial Classification (NIC).
Our analysis includes several trade-related variables and firm characteristics as addi-tional control variables. The trading-related controls include past returns, price-to-earnings ratio (P/E), price-to-book value ratio (P/B), log of turnover (Turnover), and log of market capitalization (MarketCap). We employ the price-to-earnings ratio after it is
Volatilityi,t = 0.511 ln
(
hi,t
li,t
)
− 0.019
[
ln
(
ci,t
oi,t
)
ln
(
hi,t li,t
o2i,t
)
− 2 ln
(
hi,t
oi,t
)
ln
(
li,t
oi,t
)
]
− 0.383
[
ln
(
ci,t
oi,t
)]2
,
KZIi,t = − 1.001909 ∗ Cashflowi,2019 + 3.139193 ∗ Debti,2019 − 39.36780 ∗ Dividendi,2019
− 1.314759 ∗ Cashi,2019 + 0.2826389 ∗ Tobin′sQi,2019
WWIi,t = − 0.091 ∗ Cashflowi,2019 + 0.021 ∗ Debti,2019 − 0.062 ∗ Dividendi,2019
− 0.044 ∗ TotalAssetsi,2019 − 0.035 ∗ SGi,2019 + 0.102 ∗ ISGi,2019,
6 Recent studies (Narayan et al. 2016; Devpura et al. 2018) have suggested combining macroeconomic variables along with firm-level variables in the stock market analysis. Because we are using panel data model along with daily data of 39 trading days, these measures are omitted in the estimation process and are not included in the analysis.

Page 9 of 21Chundakkadan Financ Innov (2021) 7:19
winsorized at the 1% level on both sides. The firm-specific control variables include size measured by log of total assets (Size), age of the firm is measured by the log of number of years since incorporated (Age), return on asset is measured by the ratio of profit after tax to total assets (ROA), and debt of the firm is measured by ratio of total debt to total asset (Debt).
The event and other financial markets
To study the impact of event on bond market, we run a regression of the percentage change in the yields on its past value, month dummies, day-of-the-week dummies, and Event. Furthermore, to examine the impact of the light-a-lamp event on the currency market, we run a regression of percentage change in the exchange rate (the value of the Indian rupees against U.S. dollars) on its past value, month dummies, day-of-the-week dummies, and Event.
ResultsThe event and stock market reaction
We first examine the impact of the light-a-lamp event on the stock market. We ana-lyze this in light of investor sentiments and misattribution bias. If the event influences people’s mood positively, it affects the risk-taking behavior of market participants. As a result, investors demand more assets, and, in the presence of limits to arbitrage, this pushes the asset prices forward. To examine this impact, we estimate Eq. 1.
Table 1 reports the estimation result of Eq. 1. In Panel A, Column 1 reports the most parsimonious specification results of our model. We find that the coefficient of Event is positive and statistically significant at the 1% level. On an immediate day after the event, the market has gains above 9% returns compared with other days, which is close to hit-ting the 10% circuit breaker. This result is consistent with what we observe in Fig. 1. Col-umn 2 of Table 1 reports the estimation result with past returns as a control variable. The inclusion of past returns helps to offset the problem of serial correlation that may arise because of a weak tendency of price movements (Schwert 1990a, b; Fisher 1966; Kaplanski and Levy 2010). Furthermore, to offset “weekend effect” or “Monday effect” (French 1980; Cho et al. 2007), we include dummy variables for the day of the week as an additional control measure. In the same way, we include month dummies to alleviate the month-fixed effect. In Column 3, we examine the impact of the event on the stock mar-ket after controlling for the day-of-the-week and month effects. The estimation results imply that the inclusion of control variables does not change our main findings. To check the consistency of our result further, we include trade-related control variables. Since the daily return is also a function of liquidity, we plug market volume (Volume) to our model. Apart from that, we also include P/E and P/B (Fama and French 2006). Column 4 shows that our main finding is unaffected by the inclusion of trade-related variables. As a final specification, we control for market trends. The trend line in Fig. 1 indicates an upward stock market movement around the event day. To confirm that our result is not merely the result of an upward trend in the stock market, we include a time variable in our model. The result, given in Column 5 of Table 1, suggests that, consistent with the

Page 10 of 21Chundakkadan Financ Innov (2021) 7:19
reported results, a positive correlation exists between Event and market returns.7 These findings align with the existing studies that show investors’ good mood has a positive impact on the stock market (Kamstra et al. 2003; Chang et al. 2008). In other words, investors become less risk averse and bid risky assets at the time of positive emotions (Johnson and Tversky 1983; Hirshleifer 2001; Baker and Wurgler 2007; DellaVigna 2009).
We observed a stock market boost on the day after the event. This effect may be due to the positive sentiments and changes in the risk-taking behavior of market participants. The sentiment-driven price movements, however, do not persist for a
Table 1 Light a lamp and stock market returns
This table shows the estimation result of rt+k = α + βEventt + Controls+ εt+k to explore the impact of light a lamp event on the stock market. Panel A uses returns at time t + 1 (k = 1) and Panel B uses returns at time t + 2 to t + 5 (k = 2 to 5). Event is a dummy variable that take value 1 for the post-event trading day; zero otherwise. Controls includes past returns, day of the week and month fixed effects; trading related variables such as price-to-earnings ratio (P/E), price-to-book value ratio (P/B) and volume and trend (Time). Robust standard errors in parentheses ***p < 0.01, **p < 0.05, *p < 0.1.
Variables (1) (2) (3) (4) (5)
Returnst+1 Returnst+1 Returnst+1 Returnst+1 Returnst+1
Panel A: Market reaction to the event
Event 9.317*** 8.930*** 7.403*** 8.336*** 9.153***
(0.648) (0.589) (1.528) (1.683) (2.207)
Past returns − 0.180 − 0.168 − 0.260* − 0.265*
(0.157) (0.169) (0.150) (0.153)
P/E − 14.96*** − 13.09**
(4.010) (4.849)
P/B 129.3*** 114.6***
(33.51) (39.82)
Volume 2.242 1.394
(3.034) (3.589)
Time 0.0852
(0.114)
Constant − 0.557 − 0.541 − 9.309* − 50.87 − 38.19
(0.648) (0.684) (5.340) (40.46) (48.38)
Day of the week dummies No Yes Yes Yes Yes
Month dummies No Yes Yes Yes Yes
Observations 39 39 39 39 39
R-squared 0.122 0.154 0.338 0.569 0.574
Variables Returnst+2 Returnst+3 Returnst+4 Returnst+5
Panel B: Reversal
Event − 2.583 4.506 − 7.790** 3.200
(2.606) (2.853) (3.723) (3.264)
Controls Yes Yes Yes Yes
Observations 38 37 36 35
R-squared 0.279 0.460 0.462 0.392
7 Since this event was held at night, there is a possibility for reflecting the sentiment effect in the beginning of the next trading day. To test this possibility, we use returns from the previous day’s closing price and the next day’s opening price. We find a positive coefficient of the event dummy, and it is statistically significant at conventional levels. Results are available upon request.

Page 11 of 21Chundakkadan Financ Innov (2021) 7:19
long time, and they revert over the period (Tetlock 2007; Garcia 2013). Because the light-a-lamp event does not hold economic importance, the chance of price reversal is higher. To test this, we explore the behavior of market returns until the fifth day after the event. Panel B of Table 1 reports the estimation result, and we observe a reversal on the fourth day, which is consistent with sentiment-induced temporary mispricing (Da et al. 2015). Specifically, we observe a fall of around 8% returns in Nifty 50 at k = 4. Because the sentiment-driven hike in the stock market is around 9% at k = 1, we do not observe a complete reversal. The coefficient of Event is insignificant on the other days. We find two possible explanations for the return reversal in the follow-ing days. The first one is overreaction (Lee et al. 1991; Kaplanski and Levy 2010); that is, investors become overly enthusiastic after the event and start bidding on assets beyond their economic rationale, and they rectify their mistakes in the following days. Another explanation stems from cognitive ease and cognitive strain theories (Kahne-man 2011). That is, investors may make mistakes in a relaxed environment after the event and correct these mistakes in the following trading days.
Limit to arbitrage and heterogeneous effect
Previous findings show that the sentiment effects are not uniform across the stocks (Baker and Wurgler 2006, 2007). One reason for the differential effect is the limit to arbi-trage (Pontiff 1996; Shleifer and Vishny 1997). The arbitrageurs try to take advantage of sentiment-led mispricing. This advantage is limited, however, to a certain set of assets. Therefore, we estimate Eq. 2 and extend our analysis to explore the impact of the light-a-lamp event on stocks that have different characteristics.
Beta
We next investigate the heterogeneous impact of the event on stocks with different beta. Existing studies present evidence that high-beta stocks are more sensitive to investor sentiment (Baker et al. 2011). Therefore, we believe that the sentiment-driven effect of the light-a-lamp event may have a larger impact on high-beta stocks. Table 2 reports the estimation results. Consistent with Baker et al. (2011), we find evidence for a higher sentiment effect on high-beta stocks the day after the event. The interaction between the event measure beta is positive and statistically significant at conventional levels. More specifically, an increase of one standard deviation of beta is associated with 1.52% of a higher return on the immediate day of the event. When we extend k, we find evidence for the persistence of this sentiment effect. This result aligns with the existing studies that high-beta stocks are off-limits for arbitrageurs.
Turning toward the other variables in Column 1 of Table 2, the coefficient of Event and Beta is positive and statistically significant. This result indicates that higher beta is asso-ciated with higher returns irrespective of whether it is an event or a nonevent day. This result is consistent with the classic CAPM model (Sharpe 1964; Lintner 1965). The posi-tive coefficient of Event indicates that the return boost is not only subject to high-beta stock but also for low-beta stocks; however, the effect is more pronounced in the high-beta firms. The coefficient of size indicates that there is a size premium for relatively

Page 12 of 21Chundakkadan Financ Innov (2021) 7:19
small firms (Banz 1981). The older firms receive relatively lower returns compared with larger firms; however, this effect is not statistically significant.
Downside risk
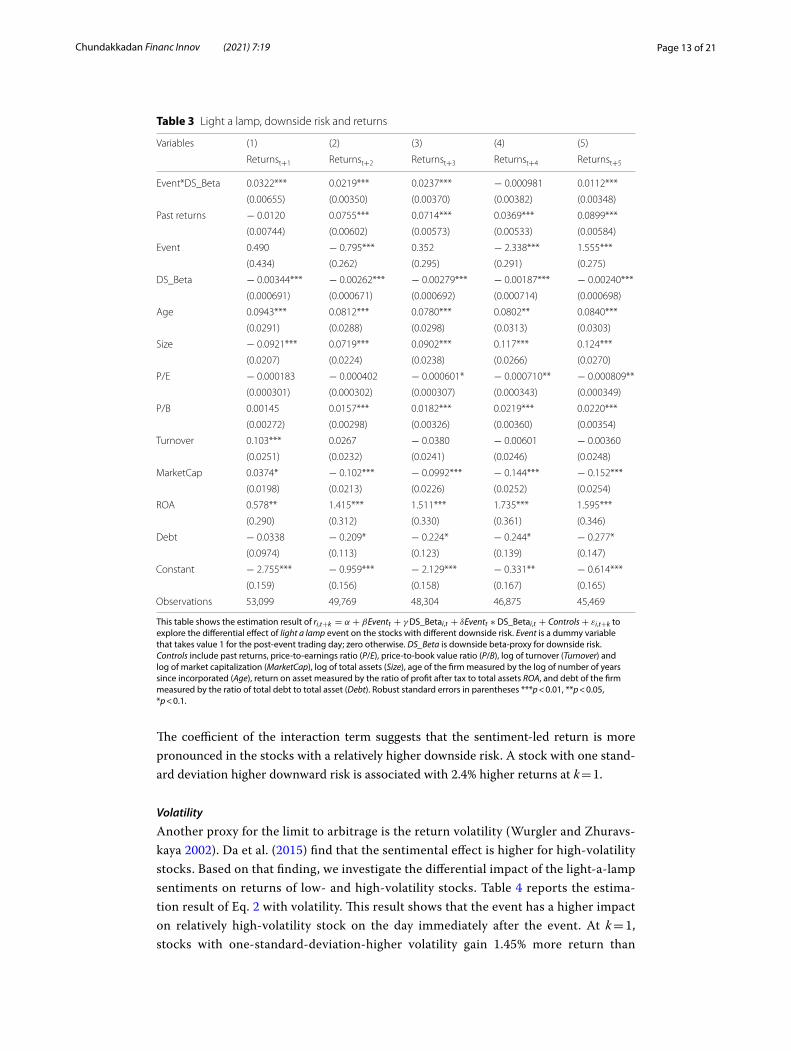
Even though CAPM beta accounts for overall market risk, there is considerable criti-cism in capturing downside risk (Ang et al. 2006). As a result, this section examines the investor sentiment effect on various downside risk stocks. In particular, we investigate whether the returns are different for stocks with different levels of downside risk in the post-event days. Table 3 reports the estimation result of Eq. 2 using downside risk. The main variable of interest in this analysis is the interaction between Event and DS_Beta.
Table 2 Light a lamp, beta and returns
This table shows the estimation result of ri,t+k = α + βEventt + γ Betai,t + δEventt ∗ Betai,t + Controls+ εi,t+k to explore the differential effect of light a lamp event on the stocks with different beta. Event is a dummy variable that takes value 1 for the post-event trading day; zero otherwise. Beta is the CAPM risk factor. Controls include past returns, price-to-earnings ratio (P/E), price-to-book value ratio (P/B), log of turnover (Turnover) and log of market capitalization (MarketCap), log of total assets (Size), age of the firm measured by the log of number of years since incorporated (Age), return on asset measured by the ratio of profit after tax to total assets ROA, and debt of the firm measured by the ratio of total debt to total asset (Debt). Robust standard errors in parentheses ***p < 0.01, **p < 0.05, *p < 0.1.
Variables (1) (2) (3) (4) (5)
Returnst+1 Returnst+2 Returnst+3 Returnst+4 Returnst+5
Event*Beta 2.610*** 1.432*** 2.569*** 0.0378 0.452*
(0.282) (0.269) (0.263) (0.290) (0.260)
Past returns − 0.0205*** 0.0735*** 0.0697*** 0.0357*** 0.0899***
(0.00753) (0.00611) (0.00589) (0.00548) (0.00601)
Event − 0.250 − 0.934*** − 0.939*** − 2.365*** 1.803***
(0.341) (0.327) (0.324) (0.359) (0.333)
Beta 0.117** − 0.0295 − 0.0602 0.0252 − 0.00654
(0.0503) (0.0461) (0.0464) (0.0487) (0.0474)
Age 0.0473 0.0645* 0.0624* 0.0497 0.0463
(0.0358) (0.0334) (0.0346) (0.0364) (0.0360)
Size − 0.119*** 0.0693*** 0.0871*** 0.104*** 0.110***
(0.0243) (0.0257) (0.0269) (0.0294) (0.0302)
P/E − 7.84e−05 − 0.000219 − 0.000471 − 0.000556 − 0.000603*
(0.000348) (0.000317) (0.000318) (0.000357) (0.000358)
P/B 0.00878* 0.0132*** 0.0183*** 0.0198*** 0.0178***
(0.00464) (0.00448) (0.00522) (0.00571) (0.00550)
Turnover 0.132*** 0.0252 − 0.0338 0.00207 0.00394
(0.0295) (0.0265) (0.0273) (0.0277) (0.0278)
MarketCap 0.0224 − 0.108*** − 0.110*** − 0.149*** − 0.153***
(0.0215) (0.0226) (0.0238) (0.0262) (0.0268)
ROA 0.223 1.419*** 1.470*** 1.716*** 1.605***
(0.353) (0.353) (0.371) (0.393) (0.385)
Debt − 0.0803 − 0.230* − 0.243* − 0.274* − 0.305*
(0.102) (0.126) (0.136) (0.153) (0.161)
Constant − 2.594*** − 0.990*** − 2.057*** − 0.234 − 0.516***
(0.180) (0.166) (0.170) (0.180) (0.178)
Observations 49,234 46,322 44,932 43,597 42,272
Page 13 of 21Chundakkadan Financ Innov (2021) 7:19
The coefficient of the interaction term suggests that the sentiment-led return is more pronounced in the stocks with a relatively higher downside risk. A stock with one stand-ard deviation higher downward risk is associated with 2.4% higher returns at k = 1.
Volatility
Another proxy for the limit to arbitrage is the return volatility (Wurgler and Zhuravs-kaya 2002). Da et al. (2015) find that the sentimental effect is higher for high-volatility stocks. Based on that finding, we investigate the differential impact of the light-a-lamp sentiments on returns of low- and high-volatility stocks. Table 4 reports the estima-tion result of Eq. 2 with volatility. This result shows that the event has a higher impact on relatively high-volatility stock on the day immediately after the event. At k = 1, stocks with one-standard-deviation-higher volatility gain 1.45% more return than
Table 3 Light a lamp, downside risk and returns
This table shows the estimation result of ri,t+k = α + βEventt + γDS_Betai,t + δEventt ∗ DS_Betai,t + Controls+ εi,t+k to explore the differential effect of light a lamp event on the stocks with different downside risk. Event is a dummy variable that takes value 1 for the post-event trading day; zero otherwise. DS_Beta is downside beta-proxy for downside risk. Controls include past returns, price-to-earnings ratio (P/E), price-to-book value ratio (P/B), log of turnover (Turnover) and log of market capitalization (MarketCap), log of total assets (Size), age of the firm measured by the log of number of years since incorporated (Age), return on asset measured by the ratio of profit after tax to total assets ROA, and debt of the firm measured by the ratio of total debt to total asset (Debt). Robust standard errors in parentheses ***p < 0.01, **p < 0.05, *p < 0.1.
Variables (1) (2) (3) (4) (5)
Returnst+1 Returnst+2 Returnst+3 Returnst+4 Returnst+5
Event*DS_Beta 0.0322*** 0.0219*** 0.0237*** − 0.000981 0.0112***
(0.00655) (0.00350) (0.00370) (0.00382) (0.00348)
Past returns − 0.0120 0.0755*** 0.0714*** 0.0369*** 0.0899***
(0.00744) (0.00602) (0.00573) (0.00533) (0.00584)
Event 0.490 − 0.795*** 0.352 − 2.338*** 1.555***
(0.434) (0.262) (0.295) (0.291) (0.275)
DS_Beta − 0.00344*** − 0.00262*** − 0.00279*** − 0.00187*** − 0.00240***
(0.000691) (0.000671) (0.000692) (0.000714) (0.000698)
Age 0.0943*** 0.0812*** 0.0780*** 0.0802** 0.0840***
(0.0291) (0.0288) (0.0298) (0.0313) (0.0303)
Size − 0.0921*** 0.0719*** 0.0902*** 0.117*** 0.124***
(0.0207) (0.0224) (0.0238) (0.0266) (0.0270)
P/E − 0.000183 − 0.000402 − 0.000601* − 0.000710** − 0.000809**
(0.000301) (0.000302) (0.000307) (0.000343) (0.000349)
P/B 0.00145 0.0157*** 0.0182*** 0.0219*** 0.0220***
(0.00272) (0.00298) (0.00326) (0.00360) (0.00354)
Turnover 0.103*** 0.0267 − 0.0380 − 0.00601 − 0.00360
(0.0251) (0.0232) (0.0241) (0.0246) (0.0248)
MarketCap 0.0374* − 0.102*** − 0.0992*** − 0.144*** − 0.152***
(0.0198) (0.0213) (0.0226) (0.0252) (0.0254)
ROA 0.578** 1.415*** 1.511*** 1.735*** 1.595***
(0.290) (0.312) (0.330) (0.361) (0.346)
Debt − 0.0338 − 0.209* − 0.224* − 0.244* − 0.277*
(0.0974) (0.113) (0.123) (0.139) (0.147)
Constant − 2.755*** − 0.959*** − 2.129*** − 0.331** − 0.614***
(0.159) (0.156) (0.158) (0.167) (0.165)
Observations 53,099 49,769 48,304 46,875 45,469

Page 14 of 21Chundakkadan Financ Innov (2021) 7:19
their counterparts. This result is consistent with the findings of Da et al. (2015); that is, the sentimental effect is relatively higher on high-volatility stocks. Similar to other risk measures, we observe a price reversal on the fourth trading day after the event.
Size and financial distress
Investor sentiment is higher in smaller firms for which the opportunity for arbitrage is limited (Baker and Wurgler 2006; Wurgler and Zhuravskaya 2002). Kaplanski and Levy (2010) show that evidence for sentiment is more pronounced in small firms. As a result, we extend our study to explore the heterogeneous effects of sentiments on small and large firms. In other words, we study whether the impact of the light-a-lamp event is
Table 4 Light a lamp, volatility and returns
This table shows the estimation result of ri,t+k = α + βEventt + γVolatilityi,t + δEventt ∗ Volatilityi,t + Controls+ εi,t+k to explore the differential effect of light a lamp event on the stocks with different volatility levels. Event is a dummy variable that takes value 1 for the post-event trading day; zero otherwise. Volatility is a measure of stock volatility. Controls include past returns, price-to-earnings ratio (P/E), price-to-book value ratio (P/B), log of turnover (Turnover) and log of market capitalization (MarketCap), log of total assets (Size), age of the firm measured by the log of number of years since incorporated (Age), return on asset measured by the ratio of profit after tax to total assets ROA, and debt of the firm measured by the ratio of total debt to total asset (Debt). Robust standard errors in parentheses ***p < 0.01, **p < 0.05, *p < 0.1
Variables (1) (2) (3) (4) (5)
Returnst+1 Returnst+2 Returnst+3 Returnst+4 Returnst+5
Event*Volatility 0.485*** 0.0965 0.140** − 0.125** − 0.0566
(0.0824) (0.0675) (0.0641) (0.0558) (0.0517)
Event 1.140*** 0.377 1.572*** − 1.892*** 2.522***
(0.252) (0.234) (0.243) (0.237) (0.219)
Volatility − 0.0477*** 0.0493*** 0.0188* 0.00666 0.0187*
(0.0109) (0.00996) (0.0101) (0.0101) (0.00962)
Past returns − 0.0215*** 0.0751*** 0.0708*** 0.0358*** 0.0906***
(0.00750) (0.00610) (0.00589) (0.00545) (0.00600)
Age 0.0465 0.0594* 0.0583* 0.0496 0.0448
(0.0358) (0.0332) (0.0343) (0.0364) (0.0359)
Size − 0.122*** 0.0749*** 0.0881*** 0.105*** 0.112***
(0.0241) (0.0268) (0.0272) (0.0295) (0.0306)
Beta 0.210*** − 0.0268 − 0.00912 0.0235 − 0.00528
(0.0502) (0.0462) (0.0462) (0.0483) (0.0468)
P/E − 0.000154 − 0.000100 − 0.000417 − 0.000550 − 0.000563
(0.000347) (0.000322) (0.000318) (0.000357) (0.000358)
P/B 0.00732 0.0143*** 0.0185*** 0.0200*** 0.0182***
(0.00456) (0.00476) (0.00532) (0.00576) (0.00561)
Turnover 0.139*** 0.00861 − 0.0405 0.00163 − 0.00104
(0.0287) (0.0267) (0.0271) (0.0275) (0.0276)
MarketCap 0.0213 − 0.102*** − 0.106*** − 0.149*** − 0.151***
(0.0214) (0.0234) (0.0241) (0.0263) (0.0270)
ROA 0.327 1.341*** 1.442*** 1.708*** 1.576***
(0.349) (0.362) (0.373) (0.394) (0.386)
Age − 0.0708 − 0.239* − 0.243* − 0.275* − 0.307*
(0.102) (0.138) (0.141) (0.153) (0.165)
Constant − 2.458*** − 1.292*** − 2.228*** − 0.266 − 0.627***
(0.187) (0.173) (0.178) (0.188) (0.183)
Observations 49,234 46,322 44,932 43,597 42,272

Page 15 of 21Chundakkadan Financ Innov (2021) 7:19
different across firms of different sizes. Table 5 reports the estimation result. Unlike the existing studies, we find that larger firms reap greater returns on the post-event days than smaller firms. For a standard deviation increase in the size measure, we find a 1.23% higher return on the immediate post-event day.8
This result may be due to the fact that market participants are looking for sound com-panies to invest in, particularly given that size is a proxy for financial distress (Hadlock and Pierce 2010). To check whether investors are avoiding distressed firms, we use alter-native measures of financial distress (cashflow, dividend, KZI, and WWI) in Eq. 2 (Faz-zari et al. 1988; Kaplan and Zingales 1997; Whited and Wu 2006).
Table 5 Light a lamp, size and returns
This table shows the estimation result of ri,t+k = α + βEventt + γ Sizei,t + δEventt ∗ Sizei,t + Controls+ εi,t+k to explore the differential effect of light a lamp event on the stocks with different size. Event is a dummy variable that takes value 1 for the post-event trading day; zero otherwise. Size is log of total assets. Controls include past returns, price-to-earnings ratio (P/E), price-to-book value ratio (P/B), log of turnover (Turnover) and log of market capitalization (MarketCap), age of the firm measured by the log of number of years since incorporated (Age), return on asset measured by the ratio of profit after tax to total assets ROA, and debt of the firm measured by the ratio of total debt to total asset (Debt). Robust standard errors in parentheses ***p < 0.01, **p < 0.05, *p < 0.1.
Variables (1) (2) (3) (4) (5)
Returnst+1 Returnst+2 Returnst+3 Returnst+4 Returnst+5
Event*Size 0.463*** 0.0575 0.239*** − 0.128** 0.0332
(0.0712) (0.0621) (0.0660) (0.0631) (0.0574)
Event − 1.308** 0.238 − 0.0481 − 1.183** 2.041***
(0.648) (0.583) (0.636) (0.600) (0.550)
Size − 0.129*** 0.0674*** 0.0793*** 0.108*** 0.109***
(0.0243) (0.0256) (0.0269) (0.0296) (0.0302)
Past returns − 0.0196*** 0.0739*** 0.0704*** 0.0356*** 0.0900***
(0.00753) (0.00611) (0.00589) (0.00548) (0.00601)
Beta − 7.51e−05 − 0.000215 − 0.000468 − 0.000554 − 0.000601*
(0.000347) (0.000317) (0.000318) (0.000357) (0.000358)
P/E 0.00867* 0.0131*** 0.0181*** 0.0198*** 0.0177***
(0.00461) (0.00446) (0.00517) (0.00571) (0.00549)
P/B 0.131*** 0.0255 − 0.0324 0.00185 0.00415
(0.0293) (0.0264) (0.0270) (0.0277) (0.0277)
Turnover 0.0217 − 0.108*** − 0.109*** − 0.149*** − 0.153***
(0.0213) (0.0225) (0.0237) (0.0262) (0.0268)
MarketCap 0.250 1.426*** 1.481*** 1.717*** 1.608***
(0.352) (0.352) (0.370) (0.394) (0.384)
ROA 0.0458 0.0634* 0.0604* 0.0494 0.0459
(0.0356) (0.0333) (0.0344) (0.0364) (0.0360)
Age − 0.0786 − 0.228* − 0.239* − 0.274* − 0.304*
(0.102) (0.126) (0.136) (0.153) (0.161)
Debt − 2.561*** − 1.015*** − 2.067*** − 0.268 − 0.520***
(0.179) (0.165) (0.168) (0.179) (0.176)
Constant − 7.51e−05 − 0.000215 − 0.000468 − 0.000554 − 0.000601*
(0.000347) (0.000317) (0.000318) (0.000357) (0.000358)
Observations 49,234 46,322 44,932 43,597 42,272
8 This finding remains robust when we employ market capitalization as a proxy for size, not reported for brevity.
Page 16 of 21Chundakkadan Financ Innov (2021) 7:19
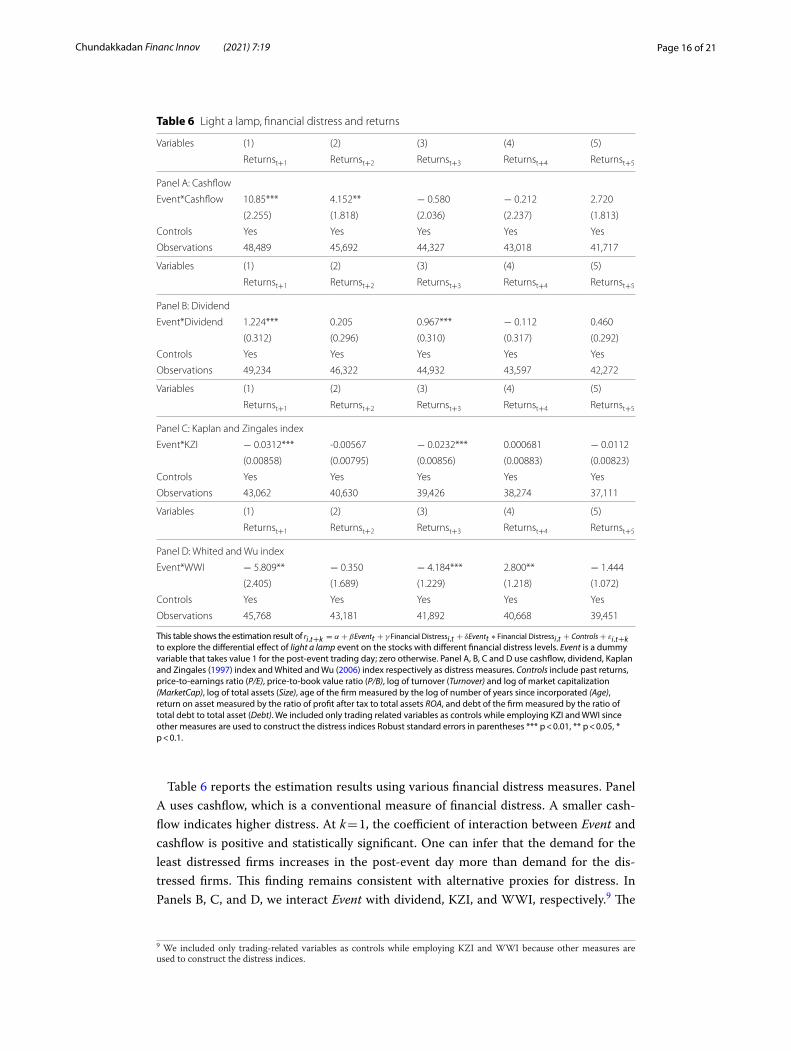
Table 6 reports the estimation results using various financial distress measures. Panel A uses cashflow, which is a conventional measure of financial distress. A smaller cash-flow indicates higher distress. At k = 1, the coefficient of interaction between Event and cashflow is positive and statistically significant. One can infer that the demand for the least distressed firms increases in the post-event day more than demand for the dis-tressed firms. This finding remains consistent with alternative proxies for distress. In Panels B, C, and D, we interact Event with dividend, KZI, and WWI, respectively.9 The
Table 6 Light a lamp, financial distress and returns
This table shows the estimation result of ri,t+k = α + βEventt + γ Financial Distressi,t + δEventt ∗ Financial Distressi,t + Controls+ εi,t+k to explore the differential effect of light a lamp event on the stocks with different financial distress levels. Event is a dummy variable that takes value 1 for the post-event trading day; zero otherwise. Panel A, B, C and D use cashflow, dividend, Kaplan and Zingales (1997) index and Whited and Wu (2006) index respectively as distress measures. Controls include past returns, price-to-earnings ratio (P/E), price-to-book value ratio (P/B), log of turnover (Turnover) and log of market capitalization (MarketCap), log of total assets (Size), age of the firm measured by the log of number of years since incorporated (Age), return on asset measured by the ratio of profit after tax to total assets ROA, and debt of the firm measured by the ratio of total debt to total asset (Debt). We included only trading related variables as controls while employing KZI and WWI since other measures are used to construct the distress indices Robust standard errors in parentheses *** p < 0.01, ** p < 0.05, * p < 0.1.
Variables (1) (2) (3) (4) (5)
Returnst+1 Returnst+2 Returnst+3 Returnst+4 Returnst+5
Panel A: Cashflow
Event*Cashflow 10.85*** 4.152** − 0.580 − 0.212 2.720
(2.255) (1.818) (2.036) (2.237) (1.813)
Controls Yes Yes Yes Yes Yes
Observations 48,489 45,692 44,327 43,018 41,717
Variables (1) (2) (3) (4) (5)
Returnst+1 Returnst+2 Returnst+3 Returnst+4 Returnst+5
Panel B: Dividend
Event*Dividend 1.224*** 0.205 0.967*** − 0.112 0.460
(0.312) (0.296) (0.310) (0.317) (0.292)
Controls Yes Yes Yes Yes Yes
Observations 49,234 46,322 44,932 43,597 42,272
Variables (1) (2) (3) (4) (5)
Returnst+1 Returnst+2 Returnst+3 Returnst+4 Returnst+5
Panel C: Kaplan and Zingales index
Event*KZI − 0.0312*** -0.00567 − 0.0232*** 0.000681 − 0.0112
(0.00858) (0.00795) (0.00856) (0.00883) (0.00823)
Controls Yes Yes Yes Yes Yes
Observations 43,062 40,630 39,426 38,274 37,111
Variables (1) (2) (3) (4) (5)
Returnst+1 Returnst+2 Returnst+3 Returnst+4 Returnst+5
Panel D: Whited and Wu index
Event*WWI − 5.809** − 0.350 − 4.184*** 2.800** − 1.444
(2.405) (1.689) (1.229) (1.218) (1.072)
Controls Yes Yes Yes Yes Yes
Observations 45,768 43,181 41,892 40,668 39,451
9 We included only trading-related variables as controls while employing KZI and WWI because other measures are used to construct the distress indices.

Page 17 of 21Chundakkadan Financ Innov (2021) 7:19
coefficient of the interaction is positive in Panel B and negative in Panels C and D, which suggests that the returns from the least distressed firms are relatively higher than the returns from the distressed firms.
The event and other financial marketsThis analysis presents robust evidence that the light-a-lamp event significantly changed people’s moods, which is reflected in the stock market through investor sentiment. We examine whether the overly enthusiastic market participants move their investments from safe assets to risky assets. For that, we extend our analysis to other financial markets.
First, we test the impact of the event on bond yields. If investors shift their investment for bonds to stocks, then the demand for bonds reduces, and we expect to observe a price (yield) fall (rise) on the post-event day. In this analysis, we use bond yields of 3-month, 6-month, 1-year, 3-year, 10-year, 15-year, 19-year, 24-year, and 30-year government securi-ties. Panel A of Table 7 provides the regression result of the percentage change in the yields on its past value, month dummies, day-of-the-week dummies, and Event. The result indi-cates that there is a significant fall in the bond prices (or increased bond yields) of long-term bonds. The coefficient of Event is positive and statistically significant for the bonds with 19- to 30-year maturity periods. This finding aligns with our hypothesis that market
Table 7 Light a lamp, bond yields and exchange rate
Panel A provides the regression result of the percentage change in the yields on its past value, month dummies, day of the week dummies and Event. Yields of 3-month, 6-month, 1-year, 3-year, 10-year, 15-year, 19-year, 24-year and 30-year government securities are used. Panel B provides a regression result of the percentage change in the exchange rate (USD/INR) on its past value, month dummies, day of the week dummies and Event. Event is a dummy variable that takes value 1 for the post-event trading day; zero otherwise. Robust standard errors in parentheses ***p < 0.01, **p < 0.05, *p < 0.1
Variables Event Controls Observations R-squared
Panel A: Bond
3-Month − 5.773 (3.800) Yes 36 0.208
6-Month − 0.972 (2.913) Yes 36 0.272
1-Year − 1.006 (3.059) Yes 36 0.378
3-Year 1.179 (1.968) Yes 36 0.237
5-Year 2.908 (2.845) Yes 36 0.100
10-Year 2.813 (1.696) Yes 36 0.133
15-Year 1.561 (1.229) Yes 36 0.087
19-Year 2.411* (1.216) Yes 36 0.236
24-Year 2.723** (1.090) Yes 36 0.216
30-Year 2.709*** (0.975) Yes 36 0.288
Panel B: Exchange rate
USD/INR 0.0100 (0.038) Yes 36 0.106

Page 18 of 21Chundakkadan Financ Innov (2021) 7:19
participants are more willing to take risks when they are in a good mood. On the contrary, the coefficient of our main variable is statistically insignificant for the other bonds.
Second, we examine the impact of the light-a-lamp event on the currency market. We test whether there is an event effect in the value of the Indian rupees against U.S. dollars. If investors withdraw money from the currency market to invest in the equity market, we expect to find a decrease in the value of Indian currency. To test that, we run a regression of percentage change in the exchange rate on its past value, month dummies, day-of-the-week dummies, and Event. Panel B of Table 7 shows a rupee depreciation on the immediate day of the event, which is in line with the expected results; however, the coefficient is not statis-tically significant.
ConclusionThis study investigates the impact of the light-a-lamp event in India that was held during the COVID-19 lockdown. The event urged people to switch off the lights in their homes and light a lamp for nine minutes on April 5 at 9:00 p.m. This study links this event with the stock market through investor sentiment and misattribution bias. We observe senti-ment-driven stock market movement in the post-event day. There was approximately a 9% higher return on the immediate day of the event compared to other days. Since inves-tor sentiment causes this effect, we see a reversal on the fourth day following the event, which is consistent with sentiment-induced temporary mispricing. We extend this study to identify the heterogeneous effect of the event. Consistent with the limit-to-arbitrage literature, we find the effect is more prominent on stocks with high beta, downside risk, and return volatility. In addition, we find that the effect is more pronounced on the least distressed firms. Furthermore, we investigate the impact of the event on bond and cur-rency markets. We find a fall in the long-term bond prices on the post-event day. In the case of U.S. dollar–Indian rupee exchange rate, we find an insignificant effect of the event. To further analyze the behavior of financial markets, this study leaves room to extend future work to use more advanced methods, such as machine learning and inter-net search frequency (Wen et al. 2019; Kou et al. 2019).
AppendixSee Table 8.

Page 19 of 21Chundakkadan Financ Innov (2021) 7:19
Table 8 Descriptive statistics
Variable Mean Std. Dev Min Max
Index data
Returns − 0.237 4.228 − 12.980 8.760
Event 0.026 0.160 0.000 1.000
P/E 20.916 2.272 17.150 25.730
P/B 2.627 0.263 2.170 3.180
Volume 13.090 0.163 12.672 13.391
Firm-level data
Returns − 0.338 5.373 − 72.710 45.070
Event 0.026 0.159 0.000 1.000
Beta 1.172 0.491 − 0.880 2.620
DS_Beta 68.191 38.587 − 134.032 200.184
Volatility 3.825 2.920 0.000 22.171
Size 8.816 2.091 0.095 17.421
Cashflow 0.084 0.067 − 0.314 0.614
Dividend 0.683 0.465 0.000 1.000
WWI − 0.432 0.114 − 2.897 − 0.087
KZI − 26.538 18.112 − 39.560 6.436
Debt 0.214 0.192 0.000 2.596
Cash 0.002 0.009 0.000 0.192
Tobin’s Q 1.137 3.897 0.002 144.854
Industry sales growth 0.090 0.082 − 0.471 0.282
Sale growth 0.276 1.840 − 0.968 75.619
Age 3.475 0.522 0.693 5.050
P/E 24.817 54.212 0.750 480.000
P/B 1.800 3.212 0.010 73.790
Turnover 0.861 1.335 0.000 11.625
MarketCap 8.084 2.430 1.348 16.046
ROA 0.061 0.063 − 0.455 0.601
Other financial markets
3-Month − 0.925 3.443 − 16.814 6.758
6-Month − 0.951 2.762 − 10.213 4.569
1-Year − 0.773 2.945 − 10.663 5.523
3-Year − 0.487 1.814 − 4.576 2.938
5-Year − 0.342 2.338 − 6.257 3.488
10-Year − 0.105 1.386 − 2.670 2.700
15-Year − 0.093 1.022 − 1.712 2.242
19-Year − 0.048 1.127 − 2.656 2.412
24-Year − 0.031 0.973 − 1.744 2.483
30-Year − 0.070 0.922 − 1.789 2.426
USD/INR 0.108 0.570 − 1.206 1.187

Page 20 of 21Chundakkadan Financ Innov (2021) 7:19
FundingNo funding is received for this study.
Received: 12 August 2020 Accepted: 5 March 2021
ReferencesAkyildirim E, Corbet S, Efthymiou M, Guiomard C, O’Connell JF, Sensoy A (2020) The financial market effects of interna-
tional aviation disasters. Int Rev Financ Anal 69:101468Ali M, Alam N, Rizvi SAR (2020) Coronavirus (COVID-19)—an epidemic or pandemic for financial markets. J Behav Exp
Finance 27:100341Ang A, Chen J, Xing Y (2006) Downside risk. Rev Financ Studes 19:1191–1239Apergis E, Apergis N (2020) Can the COVID-19 pandemic and oil prices drive the US Partisan Conflict Index? Energy Res
Lett 1(1):13144Baker M, Wurgler J (2006) Investor sentiment and the cross-section of stock returns. J Finance 61:1645–1680Baker M, Wurgler J (2007) Investor sentiment in the stock market. J Econ Perspect 21(2):129–152Baker M, Bradley B, Wurgler J (2011) Benchmarks as limits to arbitrage: understanding the low volatility anomaly. Financ
Anal J 67:40–54Banz RW (1981) The relationship between return and market value of common stocks. J Financ Econ 9(1):3–18Bawa VS, Lindenberg EB (1977) Capital market equilibrium in a mean-lower partial moment framework. J Financ Econ
5:189–200Bethke S, Gehde-Trapp M, Kempf A (2017) Investor sentiment, flight-to-quality, and corporate bond comovement. J Bank
Finance 82:112–132Chang SC, Chen SS, Chou RK, Lin YH (2008) Weather and intraday patterns in stock returns and trading activity. J Bank
Finance 32(9):1754–1766Chen MH, Jang SC, Kim WG (2007) The impact of the SARS outbreak on Taiwanese hotel stock performance: an event-
study approach. Int J Hosp Manag 26(1):2000–2212Cho YH, Linton O, Whang YJ (2007) Are there Monday effects in stock markets? A stochastic dominance approach. J
Empir Finance 14:736–755Da Z, Engelberg J, Gao P (2015) The sum of All FEARS—investor sentiment and asset prices. Rev Financ Stud 28(1):1–32DellaVigna S (2009) Psychology and economics: evidence from the field. J Econ Lit 47(2):315–372Devpura N, Narayan PK (2020) Hourly oil price volatility: the role of COVID-19. Energy Res Lett 1(2):13683Devpura N, Narayan PK, Sharma SS (2018) Is stock return predictability time varying? J Int Financ Market Inst Money
52:152–172Drakos K (2010) Terrorism activity, investor sentiment, and stock returns. Rev Financ Econ 19(3):128–135Edmans A, Garcia D, Norli Ø (2007) Sports sentiment and stock returns. J Finance 62(4):1967–1998Fama EF (1970) Efficient capital markets: a review of theory and empirical work. J Finance 25(2):383–417Fama EF, French KR (2006) The value premium and the CAPM. J Finance 61(5):2163–2185Fama EF, French KR (2015) A five-factor asset pricing model. J Financ Econ 116(1):1–22Fazzari SM, Hubbard RG, Petersen BC, Blinder AS, Poterba JM (1988) Financing constraints and corporate investment. Brook
Pap Econ Act 19(1):141–206Fernandez DC, Fogerson PM, Ospri LL, Thomsen MB, Layne RM, Severin D, Zhan J, Singer JH, Kirkwood A, Zhao H, Berson DM
(2018) Light affects mood and learning through distinct retina-brain pathways. Cell 175(1):71–84Fisher L (1966) Some new stock-market indexes. J Bus 29:191–225French KR (1980) Stock returns and the weekend effect. J Financ Econ 8:55–69Fu M, Shen H (2020) COVID-19 and corporate performance in the energy industry. Energy Res Lett 1(1):12967Garcia D (2013) Sentiment during recessions. J Finance 68(3):1267–1300Garman MB, Klass MJ (1980) On the estimation of security price volatilities from historical data. J Bus 53:67–78Gil-Alana LA, Monge M (2020) Crude oil prices and COVID-19: persistence of the shock. Energy Res Lett 1(1):13200Hadlock CJ, Pierce JR (2010) New evidence on measuring financial constraints: moving beyond the KZ index. Rev Financ Stud
23(5):1909–1940Haroon O, Rizvi SAR (2020a) COVID-19: Media coverage and financial markets behavior—a sectoral inquiry. J Behav Exp
Finance 27:100343Haroon O, Rizvi SAR (2020b) Flatten the curve and stock market liquidity—an inquiry into emerging economies. Emerg Mark
Finance Trade 56(10):2151–2161He P, Sun Y, Zhang Y, Li T (2020) COVID-19’s impact on stock prices across different sectors—an event study based on the
Chinese stock market. Emerg Mark Finance Trade 56(10):2198–2212Hirshleifer D (2001) Investor psychology and asset pricing. J Finance 56(4):1533–1597Hirshleifer D, Shumway T (2003) Good day sunshine: stock returns and the weather. J Finance 58(3):1009–1032Huang W, Zheng Y (2020) COVID-19: structural changes in the relationship between investor sentiment and crude oil futures
price. Energy Res Lett 1(2):13685IMF (2020) World Economic Outlook. Retrieved from https:// www. imf. org/ en/ Publi catio ns/ WEO/ Issues/ 2020/ 04/ 14/
weo- april- 2020Iyke BN (2020) The disease outbreak channel of exchange rate return predictability: evidence from COVID-19. Emerg Mark
Finance Trade 56(10):2277–2297Johnson EJ, Tversky A (1983) Affect, generalization, and the perception of risk. J Pers Soc Psychol 45(1):20Kahneman D (2011) Thinking, fast and slow. MacmillanKamstra MJ, Kramer LA, Levi MD (2003) Winter blues: a SAD stock market cycle. Am Econ Rev 93(1):324–343

Page 21 of 21Chundakkadan Financ Innov (2021) 7:19
Kaplan SN, Zingales L (1997) Do investment-cash flow sensitivities provide useful measures of financing constraints? Quart J Econ 112(1):169–215
Kaplanski G, Levy H (2010) Sentiment and stock prices: the case of aviation disasters. J Financ Econ 95(2):174–201Kou G, Chao X, Peng Y, Alsaadi FE, Herrera-Viedma E (2019) Machine learning methods for systemic risk analysis in financial
sectors. Technol Econ Dev Econ 25(5):716–742Lee CMC, Shleifer A, Thaler RH (1991) Investor sentiment and the closed-end fund puzzle. J Finance 46:75–109Leppämäki S, Partonen T, Lönnqvist J (2002) Bright-light exposure combined with physical exercise elevates mood. J Affect
Disord 72(2):139–144Lintner J (1965) The valuation of risk assets on the selection of risky investments in stock portfolios and capital budgets. Rev
Econ Stat 47:13–37Liu H, Manzoor A, Wang C, Zhang L, Manzoor Z (2020) The COVID-19 outbreak and affected countries stock markets
response. Int J Environ Res Public Health 17(8):2800Mctier BC, Tse Y, Wald JK (2011) Do stock markets catch the flu? J Financ Quant Anal 48(3):979–1000Mei-Ping C, Chien-Chiang L, Yu-Hui L, Wen-Yi C (2018) Did the S.A.R.S. epidemic weaken the integration of Asian stock mar-
kets? Evidence from smooth time-varying cointegration analysis. Econ Res-Ekonomska Istraivanja 31(1):908–926Mishra AK, Rath BN, Dash AK (2020) Does the Indian Financial Market Nosedive because of the COVID-19 Outbreak, in Com-
parison to after Demonetisation and the GST? Emerg Mark Finance Trade 56(10):2162–2180Narayan PK (2020a) Has COVID-19 changed exchange rate resistance to shocks? Asian Econ Lett. https:// doi. org/ 10. 46557/
001c. 17389Narayan PK (2020b) Oil price news and COVID-19—is there any connection? Energy Res Lett 1(1):13176Narayan PK, Phan DHB (2020) Country responses and the reaction of the stock market to COVID-19—a preliminary exposi-
tion. Emerg Mark Finance Trade 56(10):2138–2150Narayan PK, Phan DHB, Sharma SS, Westerlund J (2016) Are Islamic stock returns predictable? A global perspective. Pac Basin
Finance J 40(A):210–223Phan DHB, Narayan PK (2020) Country responses and the reaction of the stock market to COVID-19—a preliminary exposi-
tion. Emer Mark Finance Trade 56(10):2138–2150. https:// doi. org/ 10. 1080/ 15404 96X. 2020. 17847 19Pizzutilo F, Roncone V (2017) Red sky at night or in the morning, to the equity market neither a delight nor a warning: the
weather effect re-examined using intraday stock data. Eur J Finance 23(14):1280–1310Pontiff J (1996) Costly arbitrage: evidence from closed-end funds. Quart J Econ 111(4):1135–1151Qin M, Zhang YC, Su CW (2020) The essential role of pandemics: a fresh insight into the oil market. Energy Res Lett 1(1):13166Salisu AA, Akanni LO (2020) Constructing a global fear index for COVID-19 pandemic. Emerg Mark Finance Trade
56(10):2213–2230Salisu AA, Sikiru AA (2020) Pandemics and the Asia-Pacific Islamic Stocks. Asian Econ Lett. https:// doi. org/ 10. 46557/ 001c.
17413Saunders EM (1993) Stock prices and Wall Street weather. Am Econ Rev 83(5):1337–1345Schwert GW (1990a) Indexes of United States stock prices from 1802 to 1987. J Bus 63:399–426Schwert GW (1990b) Stock volatility and the crash of 87. Rev Financ Stud 3:77–102Sharpe WF (1964) Capital asset prices: a theory of market equilibrium under conditions of risk. J Finance 19(3):425–442Shleifer A, Vishny RW (1997) The limits of arbitrage. J Finance 52:35–55Stephenson KM, Schroder CM, Bertschy G, Bourgin P (2012) Complex interaction of circadian and non-circadian effects of
light on mood: shedding new light on an old story. Sleep Med Rev 16(5):445–454Tetlock PC (2007) Giving content to investor sentiment: the role of media in the stock market. J Finance 62(3):1139–1168Wen F, Xu L, Ouyang G, Kou G (2019) Retail investor attention and stock price crash risk: evidence from China. Int Rev Financ
Anal 65:101376Whited TM, Wu G (2006) Financial constraints risk. Rev Financ Stud 19(2):531–559Wurgler J, Zhuravskaya K (2002) Does arbitrage flatten demand curves for stocks? J Bus 75:583–608Zhang D, Hu M, Ji Q (2020) Financial markets under the global pandemic of COVID-19. Finance Res Lett 36:101528
Publisher’s NoteSpringer Nature remains neutral with regard to jurisdictional claims in published maps and institutional affiliations.