Embed Size (px)
Citation preview
1
Lifetime Prediction of Bidirectional Transient Voltage Suppression Diodes Using Highly-Accelerated Temperature and Humidity Stress Test
Jung-Chi Chang1, Siao-Syun Lin1, Lian-Di Yao2, and Kuan-Jung Chung3, *
1Engineer/Automotive Research & Testing Center
1No.6, Lugong S. 7th Rd., Lukang Township, Changhua County 505, Taiwan (R.O.C.)
2General Manager/Yea Shin Technology Co., Ltd.
2No.51, Neixi Rd., Luzhu Township, Taoyuan County 338, Taiwan (R.O.C.) 3Associate Professor/Dept. of Mechatronics Engineering, National Changhua University of Education
3No. 2 Shida Rd., Changhua city 500, Taiwan (R.O.C.), [email protected]
ABSTRACT
Recently a two-way structure transient voltage suppression diode (TVS) is widely used as an electrical protected device for a power conversion (buck / regulation). In this study, a highly-accelerated temperature and humidity stress test was performed to predict the lifetimes of the new TVS product with the package type of DO-218AB. The Arrhenius equation regarding with Weibull life distribution were applied to be the acceleration model. An activation energy was determined by the cross-sectional observation of failure mechanism for test vehicles. Finally a lifetime was inferred by defining the use condition of the test samples.
Keywords: Transient Voltage Suppressor, Highly-Accelerated Temperature and Humidity Stress Test
INTRODUCTION
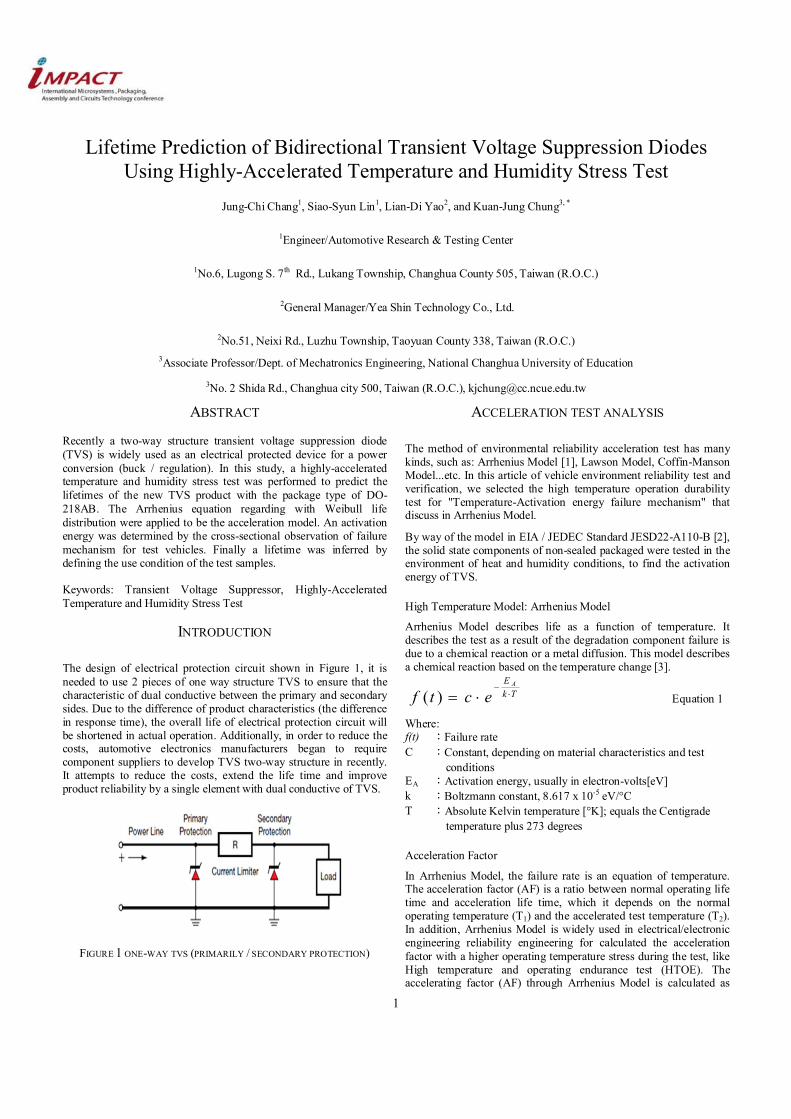
The design of electrical protection circuit shown in Figure 1, it is needed to use 2 pieces of one way structure TVS to ensure that the characteristic of dual conductive between the primary and secondary sides. Due to the difference of product characteristics (the difference in response time), the overall life of electrical protection circuit will be shortened in actual operation. Additionally, in order to reduce the costs, automotive electronics manufacturers began to require component suppliers to develop TVS two-way structure in recently. It attempts to reduce the costs, extend the life time and improve product reliability by a single element with dual conductive of TVS.
FIGURE 1 ONE-WAY TVS (PRIMARILY / SECONDARY PROTECTION)
ACCELERATION TEST ANALYSIS
The method of environmental reliability acceleration test has many kinds, such as: Arrhenius Model [1], Lawson Model, Coffin-Manson Model...etc. In this article of vehicle environment reliability test and verification, we selected the high temperature operation durability test for "Temperature-Activation energy failure mechanism" that discuss in Arrhenius Model.
By way of the model in EIA / JEDEC Standard JESD22-A110-B [2], the solid state components of non-sealed packaged were tested in the environment of heat and humidity conditions, to find the activation energy of TVS.
High Temperature Model: Arrhenius Model
Arrhenius Model describes life as a function of temperature. It describes the test as a result of the degradation component failure is due to a chemical reaction or a metal diffusion. This model describes a chemical reaction based on the temperature change [3].
TkE A
ectf
)( Equation 1
Where: f(t) :Failure rate C :Constant, depending on material characteristics and test
conditions EA :Activation energy, usually in electron-volts[eV] k :Boltzmann constant, 8.617 x 10⁻⁵ eV/°C T :Absolute Kelvin temperature [°K]; equals the Centigrade
temperature plus 273 degrees
Acceleration Factor
In Arrhenius Model, the failure rate is an equation of temperature. The acceleration factor (AF) is a ratio between normal operating life time and acceleration life time, which it depends on the normal operating temperature (T1) and the accelerated test temperature (T2). In addition, Arrhenius Model is widely used in electrical/electronic engineering reliability engineering for calculated the acceleration factor with a higher operating temperature stress during the test, like High temperature and operating endurance test (HTOE). The accelerating factor (AF) through Arrhenius Model is calculated as
2
follows[1]:
21
11
1
2
)()( TTk
E A
etftfAF Equation 2
Where: AF :Acceleration factor between test and normal operating
conditions f(t)1 :Failure rate of normal operating conditions f(t)2 :Failure rate of use accelerated conditions T1 :Absolute Kelvin temperature, °K for normal operating
conditions T2 :Absolute Kelvin temperature, °K for accelerated test
conditions EA :Activation energy, usually in electron-volts[eV] k :Boltzmann constant, 8.617 x 10⁻⁵ eV/°C
High Temperature/Humidity Model: Exponential Humidity Model
In the Arrhenius Model-, it was only contain a parameter of temperature. According to Norris and Landzberg model[5][6], Equation 2 can be revise into two parameters equation of temperature and humidity. The N-L equation can be showed as following:
acc.nor.
11
nor.
acc. exp TTkEn A
RHRHAF Equation 3
Where: AF :Acceleration factor between test and normal Operating
conditions RHacc. :Relative humidity expressed as a percentage, % for
accelerated conditions RHnor. :Relative humidity expressed as a percentage, % for
normal operating conditions Tnor. :Absolute Kelvin temperature, °K for normal
operating conditions Tacc. :Absolute Kelvin temperature, °K for accelerated
conditions EA :Apparent activation energy, 0.7 to 0.8 electron-
volts[eV] (typical for aluminum corrosion when chlorides are present)
k :Boltzmann constant, 8.617 x 10⁻⁵ eV/°C n :Peck RH exponent, 2.7 (experimentally determined
for Al corrosion)
Highly-Accelerated Temp. And Humidity Stress Test (HAST)[2]
Highly-Accelerated Temp. And Humidity Stress Test (HAST) is a highly Accelerated test including temperature, relative humidity and an electrical bias. The tests conditions as shown in Table 1. , which is reference EIA / JEDEC Standard, test Method A110-B.
TABLE 1 TEST CONDITION OF HAST Temp.
(dry,°C) Humidity
(%) Temp.
(wet,°C) Vapor pressure
(psia/kpa) Duration (hours)
130 ± 2 85 ± 5 124.7 33.3/230 96(-0, +2)
110 ± 2 85 ± 5 105.2 17.7/122 264(-0, +2)
Transient Voltage Suppressor specifications
(1) TVS Primary Characteristics, see Table 2.
TABLE 2. TVS PRIMARY CHARACTERISTICS VWM 22 V VBR 27 V
PPPM (10 x 1000 µs) 6600 W PPPM (10 x 10000 µs) 5200 W
PD 8 W IFSM 700 A
Polarity Uni-directional Diode variation Single
(2) Maximum Ratings (TA=25°C unless otherwise noted), see Table 3.
TABLE 3. MAXIMUM POWER USE STATE Parameter Symbol Value Units
Peak pulse power dissipation
10/1000 µs waveform PPPM
6600 W
10/10000 µs waveform 5200
Power dissipation on infinite heatsink at TC = 25°C PD 8.0 W
Peak forward surge current 8.3 ms single half sine-wave IFSM 700 A
Operating junction and storage temperature range TJ, TSTG -55 to +175 °C
(3) Electrical Characteristics (TA=25°C unless otherwise noted), see Table 4.
TABLE 4. ELECTRICAL CHARACTERISTICS
Part Number
Breakdown Voltage VBR
(V) Test Current IT
(mA)
Stand-OFF Voltage VWM
(V) Min. Max. YSM8W27 24 30 10.0 22.0
Max. Reverse
Leakage at VWM
ID(uA)
Max. Leakage at VWM
TJ=175°C ID(uA)
Max. Peak Pulse Current at 10/1000µs
Waveform (A)
Max. Clamping
Voltage at IPPM VC(V)
1.0 50.0 75 40
HAST Condition Set Up
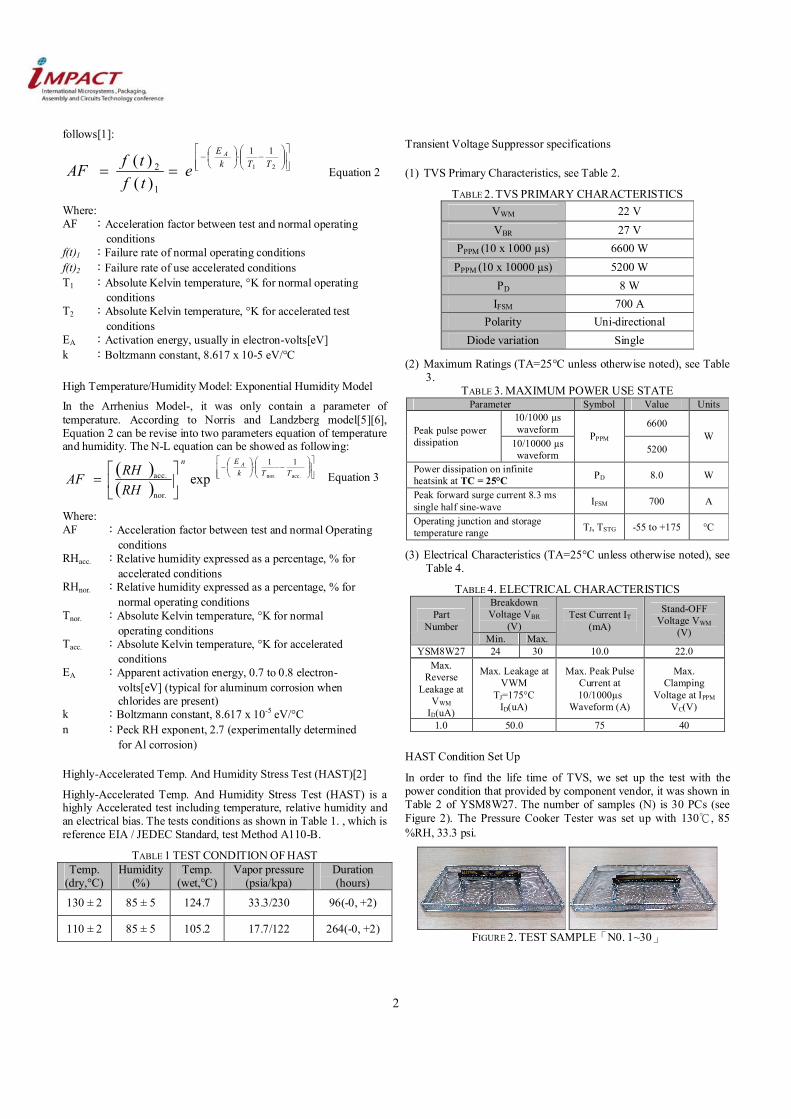
In order to find the life time of TVS, we set up the test with the power condition that provided by component vendor, it was shown in Table 2 of YSM8W27. The number of samples (N) is 30 PCs (see Figure 2). The Pressure Cooker Tester was set up with 130℃, 85 %RH, 33.3 psi.
FIGURE 2. TEST SAMPLE「N0. 1~30」

3
INSTRUMENTS AND EQUIPMENT
Base on the operating environment, we assume that the temperature and humidity will be an important factor that can affect the life of TVS. According to the EIA / JEDEC Standard, test Method A110-B[2], a normal pressure temperature and humidity chamber was too slow to make test samples weakening. So we choose the pressure cooker tester to enforce this test, as Figure 3.
FIGURE 3. HAST CHAMBER-130°C/RH 85%
TEST RESULT ANALYSIS
After 624 hours test duration of HAST, the failure data as show as Table 5. The failure criterion is the reverse current no more than 1 uA.
TABLE 5. THE FAILURE DATA OF HAST Test duration Failure Q’ty Cumulative failure number
48hr 1pc 1pc 144hr 0 1pc 192hr 0 1pc 240hr 1pc 2pc 336hr 0pc 2pc 432hr 1pc 3pc 528hr 1pc 4pc 624hr 1pc 5pc
Base on the Log-likelihood value(LKV) of each failure distribution mode (as shown in TABLE 6), the Weibull 3-parameter mode is more suitable than Weibull 2-parameter mode for this test result.
TABLE 6. LKV of distribution Distribution Rankings LKV
Exponential 1 5 -45.83696 Exponential 2 6 -45.82264
Normal 2 -46.20381 Lognormal 9 -46.48641 Weibull 2 8 -46.34268 Weibull 3 1 -46.1776 Gamma 10 -1135.321 Logistic 4 -46.22149
Loglogistic 7 -46.38192 Gumbel 3 -46.21366
Weibull 3 Parameter Model Analysis
The weibull 3-parameter model is calculated as follows:
T
eTTf1
)( Equation 4
0,0)( TTf or ,0,0,
Where β :the shape parameter, also known as the Weibull
slope η :the scale parameter γ :the location parameter Due to the calculate processes is too complicated. We used the application software (Weibull++7) to solve the weibull 3-parameter model. The result as following data and plot, as Figure 4 and Figure 5:
Mean-life: 1,738 hours
Beta (β): 2.0261
Eta (η): 2314.1137
Gamma (γ): -312.38 ReliaSoft Weibull++ 7 - www.ReliaSoft.com
Probability - Weibull
Time, (t)
Unr
elia
bilit
y, F
(t)
10.000 1000.000100.0001.000
5.000
10.000
50.000
90.000
99.000 Probability-Weibull
Data 1Weibull-3PRRX SRM MED FMF=5/S=25
Adj PointsUnadj PointsAdjusted LineUnadjusted Line
FIGURE 4. Weibull-3 Probability plot
ReliaSoft Weibull++ 7 - www.ReliaSoft.comReliability vs Time Plot
Time, (t)
Rel
iabi
lity,
R(t
)=1-
F(t
)
0.000 6000.0001200.000 2400.000 3600.000 4800.0000.000
1.000
0.200
0.400
0.600
0.800
Reliability
Data 1Weibull-3PRRX SRM MED FMF=5/S=25
Data PointsReliability Line
FIGURE 5. Weibull-3 reliability vs time
Base on the test data that we has calculated, it can be considered that the TVS’s mean-life is 1,738 hours in the HAST condition (130℃, 85 %RH, 33.3 psi). In order to fine the real operating life time, we have to choose the appropriate acceleration factor (AF). The real operating life time can be calculated by multiply the accelerated life time and acceleration factor together.
The Relation Between Failure Mechanisms And Activation Energy
According to the test experience which provides by vendors, some conclusion has been summarized about the relation between failure
4
mechanisms and activation energy (EA) in the field of electronic products[3]. The relationship between failure mechanisms and activation energy (EA), as shown in Table 7.
TABLE 7. Relationship between failure mechanisms and activation energy (EA).
Failure Mechanism EA [eV] Dielectric breakdown 0.3 to 0.6 Diffusion failures 0.5 Corrosion – electrolysis 0.3 to 0.6 Corrosion – chemical and galvanic 0.6 to 0.7 Electro-migration 0.5 to 1.2 Charge loss (MOS/EPROM) 0.8 Ionic contamination 1.0 Surface charge accumulation in silicon oxide 1.0 to 1.05 Aluminum penetration into silicon 1.4 to 1.6
Assuming the failure mechanisms in TVS is electrolytic-corrosion, the the parameter of formula 3.1 can be used for peck RH exponent (n) = 2.7, activation energy (EA) = 0.55[3][7]. The AF can be calculated as 71.50. Base on the operating time per years about 8000 hours, the real operating life time of TVS can be ratiocinated to 15.53years.
TABLE 8. HAST 130°C / RH 85%
Acceleration factor Calculation Value
EA :Apparent activation energy, 0.3 electron-volts[eV] (typical for aluminum corrosion when chlorides are present)
0.55
k :Boltzmann constant, 8.617 x 10⁻⁵ eV/°C 0.00008617 Tnor. :Absolute Kelvin temperature, °K for
normal operating conditions 333
Tacc. :Absolute Kelvin temperature, °K for accelerated conditions 403
RHacc. :Relative humidity expressed as a percentage, % for accelerated conditions
85
RHnor. :Relative humidity expressed as a percentage, % for normal operating conditions
60
n :Peck RH exponent 2.7 AF :Acceleration factor between test and
normal Operating conditions 71.50
Cross-section analysis
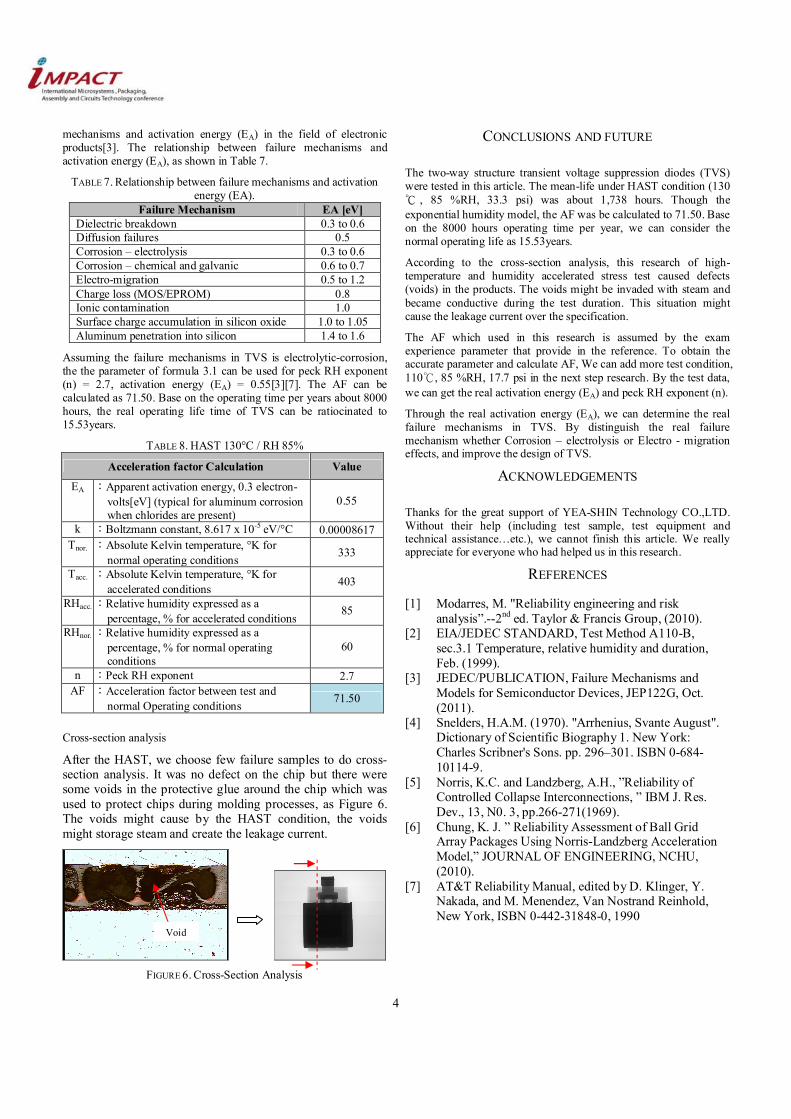
After the HAST, we choose few failure samples to do cross-section analysis. It was no defect on the chip but there were some voids in the protective glue around the chip which was used to protect chips during molding processes, as Figure 6. The voids might cause by the HAST condition, the voids might storage steam and create the leakage current.
FIGURE 6. Cross-Section Analysis
CONCLUSIONS AND FUTURE
The two-way structure transient voltage suppression diodes (TVS) were tested in this article. The mean-life under HAST condition (130℃ , 85 %RH, 33.3 psi) was about 1,738 hours. Though the exponential humidity model, the AF was be calculated to 71.50. Base on the 8000 hours operating time per year, we can consider the normal operating life as 15.53years.
According to the cross-section analysis, this research of high-temperature and humidity accelerated stress test caused defects (voids) in the products. The voids might be invaded with steam and became conductive during the test duration. This situation might cause the leakage current over the specification.
The AF which used in this research is assumed by the exam experience parameter that provide in the reference. To obtain the accurate parameter and calculate AF, We can add more test condition, 110℃, 85 %RH, 17.7 psi in the next step research. By the test data, we can get the real activation energy (EA) and peck RH exponent (n).
Through the real activation energy (EA), we can determine the real failure mechanisms in TVS. By distinguish the real failure mechanism whether Corrosion – electrolysis or Electro - migration effects, and improve the design of TVS.
ACKNOWLEDGEMENTS
Thanks for the great support of YEA-SHIN Technology CO.,LTD. Without their help (including test sample, test equipment and technical assistance…etc.), we cannot finish this article. We really appreciate for everyone who had helped us in this research.
REFERENCES
[1] Modarres, M. "Reliability engineering and risk analysis”.--2nd ed. Taylor & Francis Group, (2010).
[2] EIA/JEDEC STANDARD, Test Method A110-B, sec.3.1 Temperature, relative humidity and duration, Feb. (1999).
[3] JEDEC/PUBLICATION, Failure Mechanisms and Models for Semiconductor Devices, JEP122G, Oct. (2011).
[4] Snelders, H.A.M. (1970). "Arrhenius, Svante August". Dictionary of Scientific Biography 1. New York: Charles Scribner's Sons. pp. 296–301. ISBN 0-684-10114-9.
[5] Norris, K.C. and Landzberg, A.H., ”Reliability of Controlled Collapse Interconnections, ” IBM J. Res. Dev., 13, N0. 3, pp.266-271(1969).
[6] Chung, K. J. ” Reliability Assessment of Ball Grid Array Packages Using Norris-Landzberg Acceleration Model,” JOURNAL OF ENGINEERING, NCHU, (2010).
[7] AT&T Reliability Manual, edited by D. Klinger, Y. Nakada, and M. Menendez, Van Nostrand Reinhold, New York, ISBN 0-442-31848-0, 1990
Void