Embed Size (px)
Citation preview

Life Data Analysis for Maintenance Optimization & Reliability Improvement
Dr. Albert H.C. Tsangemail: [email protected]
12 July 2018
Agenda
© 2018 Albert TsangLife Data Analysis for Maintenance Optimization & Reliability Improvement 2
1. Evidence-based Maintenance Decision Models
2. Characterizing the Risk of Failure
3. Life Data Analysis
4. Statistical Tools for Reliability Improvement

1. Evidence-based Maintenance Decision Models
© 2018 Albert TsangLife Data Analysis for Maintenance Optimization & Reliability Improvement 3
Typical Maintenance Decisions
© 2018 Albert TsangLife Data Analysis for Maintenance Optimization & Reliability Improvement 4
When (how frequent) to:
Do preventive replacement Inspect the item
What action to take after knowing the results of an inspection?
What level of resources should be provided to support maintenance work?

Optimizing Maintenance Decisions
© 2018 Albert TsangLife Data Analysis for Maintenance Optimization & Reliability Improvement 5
We WantEvidence-based arguments
(data driven decisions)
NOTIntuition-based pronouncements
(strength of personalities, # of mechanics’ complaints)
Maintenance Policies
Run to FailureThe unscheduled actions taken, as a result of failure, to
restore a system to a specified level of performance
Preventive ReplacementThe scheduled actions taken, not as a result of failure,
to retain a system at a specified level of performance by such functions as scheduled replacement of critical items and overhauls
© 2018 Albert TsangLife Data Analysis for Maintenance Optimization & Reliability Improvement 6
Maintenance Policies
Use Preventive Replacement only if :
the risk of failure increases with age or usage, i.e., wear-out effect is occurring
total cost of a failure replacement is greater than total cost of a preventive replacement
© 2018 Albert TsangLife Data Analysis for Maintenance Optimization & Reliability Improvement 7
Preventive Replacement
© 2018 Albert TsangLife Data Analysis for Maintenance Optimization & Reliability Improvement 8
0
0.2
0.4
0.6
0.8
1
1.2
tr
time
Haz
ard
Rat
e
Preventive replacement will make sense only ifit can reduce the risk of failure (hazard rate)

Preventive Replacement Cost Conflicts
© 2018 Albert TsangLife Data Analysis for Maintenance Optimization & Reliability Improvement 9
0
Total Cost Per Week
Failure ReplacementCost per Week
Preventive ReplacementCost per Week
Optimal preventive replacement age0
Co
st p
er
We
ek
Preventive Replacement Age
Optimizing Preventive Replacement Costs
© 2018 Albert TsangLife Data Analysis for Maintenance Optimization & Reliability Improvement 10
Maintenance data are stored in databases of CMM/EAM/ERP system
A typical scenario:
Data Rich, Information Poor
The risk of failure can be determined from analysis of the item’s failure data

2. Characterizing the Risk of Failure
© 2018 Albert TsangLife Data Analysis for Maintenance Optimization & Reliability Improvement 11
Why Do Things Fail?
© 2018 Albert TsangLife Data Analysis for Maintenance Optimization & Reliability Improvement 12
Applied Stresses (Load) > Strength
Stresses applied to an item are generally due to environmental and operational factors

Criteria of a Reliable Design
© 2018 Albert TsangLife Data Analysis for Maintenance Optimization & Reliability Improvement 13
Margin of Safety
Safety Factor
Safety Factor and Margin of Safety do not consider uncertainty of both strength and load
Uncertainty of Load and Strength
© 2018 Albert TsangLife Data Analysis for Maintenance Optimization & Reliability Improvement 14
Uncertainty of load is due to variability of operating environment and usage
Variability of strength is due to the uncertain impact of operating environments on the inherent failure modes of the item
Environmental Stresses: temperature, humidity, contamination, vibration and other conditions that action on the component
Operational Stresses: voltage, current, flow, amplitude, dynamic loading and other stresses that manifest themselves during operation when the item is active

Probability Density Function (Failure Density / Mortality function)
© 2018 Albert TsangLife Data Analysis for Maintenance Optimization & Reliability Improvement 15
tjti
p.d.f. or f (t ) is the number of failures per unit time, expressed as a fraction or original total of parts under examination
f (
t )
Time to failure, t
Failure Rate (Hazard Rate), r(t )
© 2018 Albert TsangLife Data Analysis for Maintenance Optimization & Reliability Improvement 16
This is a conditional probability, with r(t )dt being theprobability that an item fails during the interval [ t, t + dt ],given that it has survived to time t.
This is also known as the instantaneous failure rate, or mortality rate

Load-Strength Interference
© 2018 Albert TsangLife Data Analysis for Maintenance Optimization & Reliability Improvement 17
Which Design is More Reliable?
© 2018 Albert TsangLife Data Analysis for Maintenance Optimization & Reliability Improvement 18
Design I
S.F. = 2
Design II
S.F. = 2
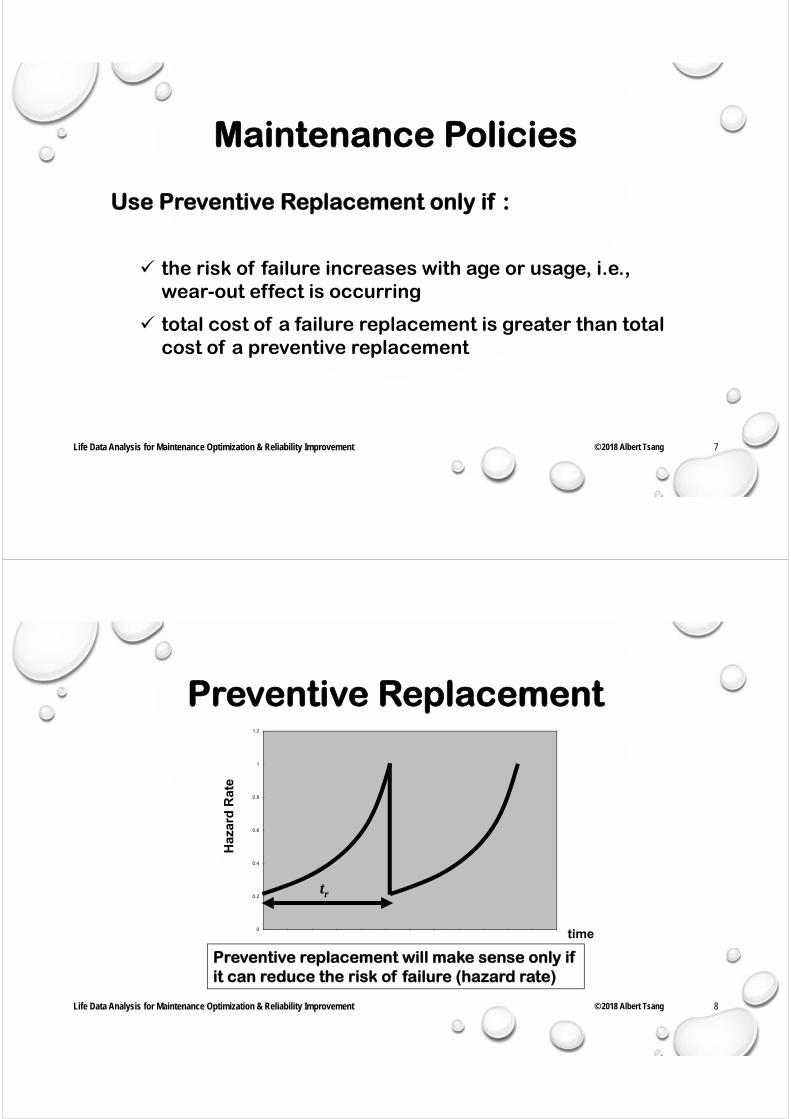
Time-Based Degradation
© 2018 Albert TsangLife Data Analysis for Maintenance Optimization & Reliability Improvement 19
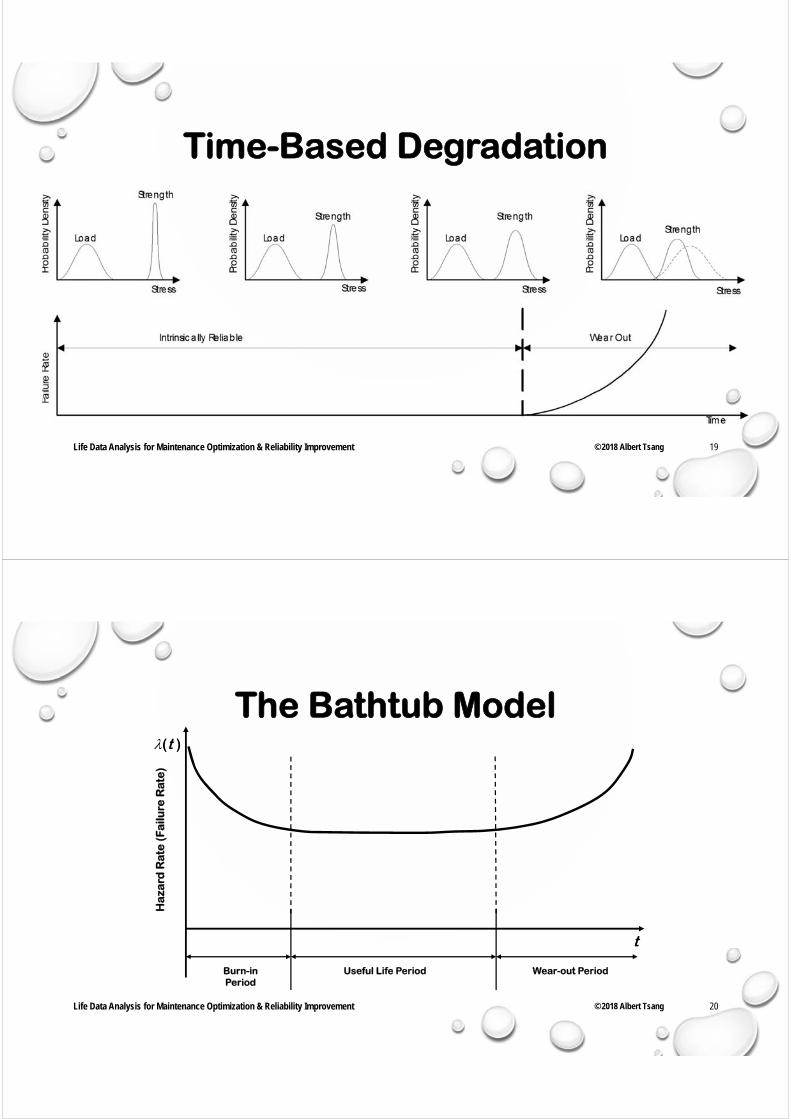
The Bathtub Model
© 2018 Albert TsangLife Data Analysis for Maintenance Optimization & Reliability Improvement 20
t
(t )
Burn-inPeriod
Useful Life Period Wear-out Period
Ha
zard
Rat
e (
Fa
ilure
Rat
e)
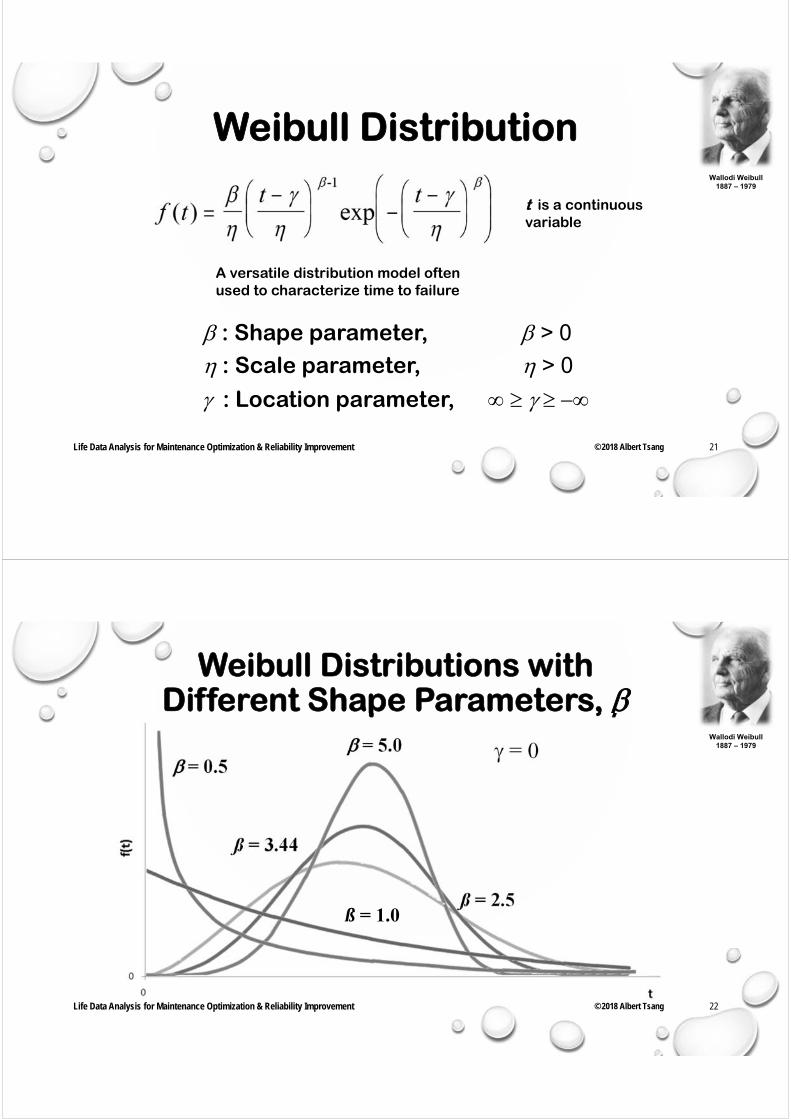
Weibull Distribution
© 2018 Albert TsangLife Data Analysis for Maintenance Optimization & Reliability Improvement 21
: Shape parameter, > 0 : Scale parameter, > 0
: Location parameter,
A versatile distribution model often used to characterize time to failure
t is a continuous variable
Wallodi Weibull 1887 – 1979
ß = 2.5
ß = 3.44
= 5.0
Weibull Distributions with Different Shape Parameters,
© 2018 Albert TsangLife Data Analysis for Maintenance Optimization & Reliability Improvement 22
Wallodi Weibull 1887 – 1979 = 0
= 0.5
ß = 1.0

Weibull Distributions with Different Shape Parameters,
© 2018 Albert TsangLife Data Analysis for Maintenance Optimization & Reliability Improvement 23
Wallodi Weibull 1887 – 1979
ß = 1.0
ß = 0.5
= 2.5
3. Life Data Analysis
© 2018 Albert TsangLife Data Analysis for Maintenance Optimization & Reliability Improvement 24

Life Data Analysis for Maintenance Optimization & Reliability Improvement 25
Life Data Analysis
Techniques for determining an item’s reliability function:
Weibull Analysis Maximum Likelihood Estimation (MLE)
© 2018 Albert Tsang
Life Data Analysis for Maintenance Optimization & Reliability Improvement 26
Sources of Product Life Data
• In-house laboratory testing
• Beta site testing
• Audit testing
• Warranty and other field data
© 2018 Albert Tsang

Life Data Analysis for Maintenance Optimization & Reliability Improvement 27
Two Types of Failure
Hard FailuresComplete loss of function
Soft FailuresOccur when a critical performance parameter has degraded to a predefined level – the item continues to function, but unsatisfactorily
© 2018 Albert Tsang
Life Data Analysis for Maintenance Optimization & Reliability Improvement 28© 2018 Albert Tsang
Lamp Failure Data
Source: Jardine & Tsang (2013) Maintenance, Replacement and Reliability: Theory & Applications, page 239
Time to Failureti-1<ti
Cumulative ProbabilityF(ti) (%)
00<04 5
04<08 14
08<12 20
12<16 25
16<20 32
20<24 38
24<28 46
28<32 48
32<36 54
36<40 60
40<44 64
44<48 66
……
56<60 78
……
76<80 86

Life Data Analysis for Maintenance Optimization & Reliability Improvement 29
Weibull Plot of Lamp Failure Data
© 2018 Albert Tsang
The Weibull model:1.243 43
.
exp43
.
Source: Jardine & Tsang (2013) Maintenance, Replacement and Reliability: Theory & Applications, page 240
Life Data Analysis for Maintenance Optimization & Reliability Improvement 30
Conclusions That Can be Drawn From a Weibull Plot / MLE
Hazard rate of the item –constant or age-dependent
Risk of failure at a specified age The age at which a specified percentage
of the item will have failed – the Bq Life
© 2018 Albert Tsang
The Point Estimates and Confidence Intervals of these Parameters
Life Data Analysis for Maintenance Optimization & Reliability Improvement 31
Assumptions of the Conclusions Drawn From a Weibull Plot / MLE
The sampled items and the environment under which they are operated are representative of those covered by the conclusions
Failures are due to a single failure mode, or set of failure modes that lead to the same form of statistical distribution
The censored observations are uninformative – items were not removed from observation and declared unfailed when they provided an indication of imminent failure
© 2018 Albert Tsang
4. Statistical Tools for ReliabilityImprovement
© 2018 Albert TsangLife Data Analysis for Maintenance Optimization & Reliability Improvement 32
Life Data Analysis for Maintenance Optimization & Reliability Improvement 33
Statistical Tools for Reliability Improvement
Beware of extrapolating beyond the range of the available life data
Evaluating individual failure modes Stratified and regression analysis Degradation analysis Accelerated testing Robust-design experiments
© 2018 Albert Tsang
Life Data Analysis for Maintenance Optimization & Reliability Improvement 34
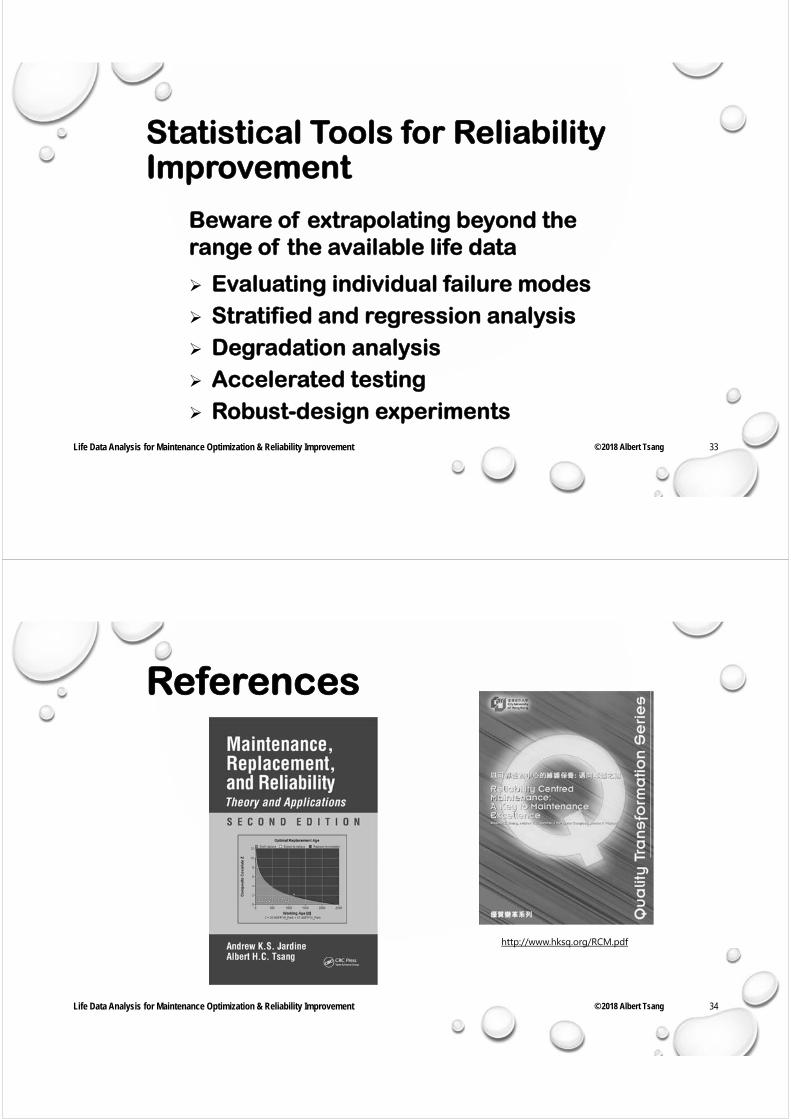
References
© 2018 Albert Tsang
http://www.hksq.org/RCM.pdf

Life Data Analysis for Maintenance Optimization & Reliability Improvement 35
The Speaker
© 2018 Albert Tsang
Dr. Albert H.C. Tsang is an advocate of quality and reliability in Hong Kong. He is the representative of American Society for Quality (ASQ) in Hong Kong, a former Chairman, founding member, and Fellow of Hong Kong Society for Quality (HKSQ). He had developed and conducted many customized training courses on various aspects of quality and engineering asset management for many organizations and professional bodies in Hong Kong, the Americas, Middle East and South Africa. He has also provided consultancy services to organizations in the public, governmental, business and industrial sectors on matters related to quality, reliability, maintenance and performance management.
Dr. Tsang is a co-author of the best selling book: Maintenance, Replacement, and Reliability: Theory and Applications, the 2nd edition of which was published in 2013. He is also the author of “WeibullSoft”, a computer-aided self learning package on Weibull analysis.