Embed Size (px)
Citation preview
Life Cycle Inventory and Impact Assessment Datafor 2014 Ingeo� Polylactide Production
Erwin T.H. Vink1 and Steve Davies2
1NatureWorks BV, Naarden, The Netherlands2NatureWorks LLC, Minnetonka, MN
AbstractIngeo polylactides are versatile biopolymers made from annu-ally renewable resources and produced since 2001 by Nature-Works at what is now a 150,000 t/y facility in Blair, NE.NatureWorks published ecoprofile data for Ingeo production in2003, 2007, and 2010. All the ecoprofiles were calculated usingthe Boustead Model, which has also been used by the Europeantrade group PlasticsEurope (Brussels) since the early 1990s.Since 2011, PlasticsEurope has been updating the ecoprofilesfor major fossil-based polymers using different life cycle as-sessment (LCA) consultants and updated databases. To ensureconsistency and ease of comparison, NatureWorks has just up-dated the Ingeo ecoprofile it published in 2010 using the GaBi(version 6.3) LCA software and the latest available databases.This paper provides a description of the Ingeo production sys-tem, the 2014 Ingeo ecoprofile, and the calculation and evalu-ation of different environmental indicators. The results forprimary, nonrenewable energy and greenhouse gas emissionsare compared with the latest available data for a selection offossil-based polymers produced in Europe and the US. Thiswork also discusses topics such as the value proposition ofbiobased materials, land use for Ingeo production, land-usechange, and water use, and also provides remarks about theinterpretation of some life cycle impact assessment indicators.
Key words: NatureWorks, polylactic acid, polylactide, Ingeo,life cycle assessment (LCA), ecoprofile, biobased plastic,bioplastic, biopolymer.
Introduction
Society has slowly begun to realize over the last few de-cades that it needs to put more effort into sustainabledevelopment from an economic(demand for food, feed,energy, and materials), social (need to boost employment
and economic development), and environmental (greater empha-sis on protection and renewable resources) standpoint. Action isneeded to mitigate global climate change and become less de-pendent on fossil resources. To this end, national and internationalauthorities, non-governmental organizations, and corporations areincreasingly recognizing the need to move to a more biobasedeconomy. Rapid technology innovation is enabling this processand making it possible to convert all kinds of biomass into usefulmaterials and products. Bioplastics are recognized as one of themain building blocks in the new bioeconomy.
Ingeo biopolymers, developed by NatureWorks LLC, arebiobased polylactide polymers produced in the US and 100%derived from locally abundant, renewable resources. They areused in a wide range of applications, including food serviceware; films and sheets; rigid, thermoformed packaging; fibersand nonwovens; three-dimensional printing; and durable products.The intermediate, Ingeo lactide, is used in polymer additives, ad-hesives, coatings, printing toners, lactates, and surfactants. Ingeobiopolymers are also referred to as polylactic acid (PLA) or poly(2-hydroxy propionic acid). They are produced at NatureWorks’150,000-t/y manufacturing facility in Blair, NE.
In 2003, NatureWorks published the first cradle-(cornproduction)-to-polymer factory-to-exit gate life cycle inventorydata, also often referred to as an ecoprofile, for Ingeo polylactideproduction.1 That paper also gave an introduction to Ingeoproduction technology, applications, and the life cycle assess-ment tool as applied to Ingeo. The 2003 data were based ona proposed 140,000-t/y plant design. In 2007, NatureWorkspublished an updated ecoprofile based on actual data collectedfrom the production facilities, and newer data for the upstreamand supporting processes.2 The 2007 paper also gave a moreaccurate description of the Ingeo manufacturing system andlife cycle assessment (LCA) calculation procedure. It also in-cluded NatureWorks’s first report on the use of renewableenergy certificates based on wind power and the resulting eco-profile impact. These data, however, are no longer applicablesince renewable energy certificates are no longer in use.
In 2010, NatureWorks published its latest ecoprofile.3 Thispublication was based on a package of technology improvements,especially advances in lactic acid production made since 1998 aspart of a collaboration between NatureWorks and Cargill (Min-netonka, MN). This new lactic acid production technology was
ª Erwin T.H. Vink and Steve Davies 2015; Published by Mary Ann Liebert, Inc. This Open Access article is distributed under the terms of the
Creative Commons License (http://creativecommons.org/licenses/by/4.0), which permits unrestricted use, distribution, and reproduction in any
medium, provided the original work is properly credited.
DOI: 10.1089/ind.2015.0003 VOL. 11 NO. 3 � JUNE 2015 INDUSTRIAL BIOTECHNOLOGY 167

implemented in December 2008 and re-sulted in a reduced environmental foot-print. The 2010 publication provided theecoprofile for Ingeo produced starting in2009.3 It also provided a description ofthe 2009 Ingeo production system andcompared the energy requirements andgreenhouse gas (GHG) emissions withprevious and future Ingeo productionsystems. The paper also benchmarked theresults for energy requirements and GHGemissions with data for a selection offossil-based polymers.
The data provided in the underlying2014 report are specific to the cornfeedstock currently in use by NatureWorks, and the data are onlyvalid for Ingeo and not for polylactide production in general. Theecoprofile data for polylactides produced elsewhere will be differentdue to the use of different feedstocks (i.e., sugarcane, sugar beets)and local production practices; different logistics; different tech-nologies for processing sugars for fermentation; different fermen-tation and polymerization technologies; and different data forelectricity and fuels used at all stages. For these reasons, the specificnomenclature ‘‘Ingeo’’ is used in this paper to clearly delineatewherever NatureWorks’ polylactide biopolymer is being referenced.
Since the beginning of the 1990s all ecoprofiles published byPlasticsEurope were calculated by Boustead Consulting (WestSussex, UK). In order to make direct comparisons with fossil-based polymers, NatureWorks worked with the same consul-tancy and used the same methodology, databases, and datalay-out to generate the Ingeo polylactide ecoprofiles. In 2011,PlasticsEurope decided to update the ecoprofiles for the fossil-based polymers using different LCA consultants—Institute forEnergy and Environmental Research (IFEU; Heidelberg, Ger-many) for polyethylene terephthalate; PE International (Leinfel-den-Echterdingen, Germany) for polystyrene and polycarbonate;and PriceWaterhouseCooper (London) for polyamides. Thus,NatureWorks began working with PE International to update theIngeo ecoprofile using PE International’s LCA software GaBi(version 6.3) to ensure that meaningful comparisons could bemade with the new PlasticsEurope data.
Up-to-date life cycle inventory data are needed by research in-stitutes, universities, retailers, brand owners, and authorities toprovide better insights into the environmental performance of theproducts they use and to investigate and make meaningful com-parisons between products. The objective of this paper is to providedetailed ecoprofile data for Ingeo biopolymers of sufficient ro-bustness, integrity, and quality so that LCA practitioners andstakeholders can confidently use the data in their own LCA studies.It must be noted, however, that the production and use of Ingeobiopolymers and products made from Ingeo biopolymers are still intheir infancy compared with traditional petroleum-based polymersand products. Therefore, there is significant potential for furtherreduction in the environmental footprint of Ingeo biopolymers andproducts made from them over their complete life cycle. This paperreports on the life cycle performance/impacts of the 2014 Ingeopolylactide manufacturing system from cradle-to-polymer factory-exit gate for a 150,000-t production facility.
Switching manufacturing processes (and products) fromfossil-based carbon feedstock (oil, gas, coal) to biobased carbonfeedstock provides an opportunity for a zero material carbonfootprint.4 Figure 1 illustrates the major flows in the globalcarbon cycle. In the atmosphere, carbon is present primarily ascarbon dioxide (CO2). CO2 in the atmosphere is fixed as biomassduring photosynthesis; this process has been going on for hun-dreds of millions of years and led to the vast resources of oil, gas,and coal that our society relies on at present. Since the beginningof the industrial revolution, these resources have been used at anincreasing rate to produce materials, chemicals, and fuels. As aresult, much of the carbon stored millions of years ago is nowbeing released into the atmosphere in a very short period of time,geologically speaking. The result is that there is a net translo-cation of vast quantities of carbon from the earth into the at-mosphere, leading to the above-mentioned increase in CO2
levels, which recently passed 400 ppm and continue to rise.5 Theincreasing level of CO2 and other GHGs such as methane andnitrous oxide trap more of the sun’s heat, thereby raising theaverage temperature of the atmosphere—including the land andoceans—and leading to global climate change. This process willdramatically affect life on this planet.
The use of fossil resources can, from a carbon point of view,be considered as a simple, linear process. The biobased industryoffers an alternative and more sustainable route in terms ofmaterial carbon, with biobased resources utilized in a more
Carbon dioxidein the
atmosphere1 year
Bio-based industry
Biomass
Fossilresources(oil, coal)
Hundreds ofmillions of years
Traditional chemical industryPolymers,
chemicals &fuels
1-10 years
Fig. 1. Global carbon cycles. The fossil carbon cycle versus the biological carbon cycle.
fossil product
biobased product
1 2 3 4 5
number of items used
Net flux ofmaterial Cinto theatmosphere
Fig. 2. The net flux of material carbon into the atmosphere forfossil- and bio-based products.
VINK AND DAVIES
168 INDUSTRIAL BIOTECHNOLOGY JU NE 2015
circular process. The carbon harnessed during photosynthesis isused to produce biomaterials and, depending on the application,is released back into the atmosphere within a period of 1–10years. Each year, plants once again harness this CO2 to producebiomass, closing the material carbon loop. The key value prop-osition of biobased materials, like Ingeo biopolymers, is theirintrinsic zero material carbon footprint, assuming that after usethe carbon in the polymer flows back to the atmosphere bycomposting or incineration. In other words, the fundamental in-trinsic material carbon footprint value proposition for PLA is theCO2 removal from the environment and incorporation into thepolymer molecule in harmony with nature’s biological carboncycles. Specifically, the value for PLA is 1.83 kg of CO2/kg PLA.Plastics made from fossil resources cannot be credited with anyCO2 removal.6 The net flux of material carbon for a fossil- and abio-based product into the atmosphere is illustrated in Figure2. The figure assumes that both materials are incinerated at theend of their useful life. With each fossil-based item used, thematerial carbon released to the atmosphere increases by an
amount equivalent to the quantity of fossil carbon present inthe product, whereas the material carbon released in the case ofthe biobased product remains zero, since the biobased carbon isagain taken up from the atmosphere for the next product cycle.Recycling of fossil-based materials has been considered along-term solution, but from a material carbon point of view itis just a minimal delay in the process of translocating the fossilcarbon from the earth into the atmosphere.
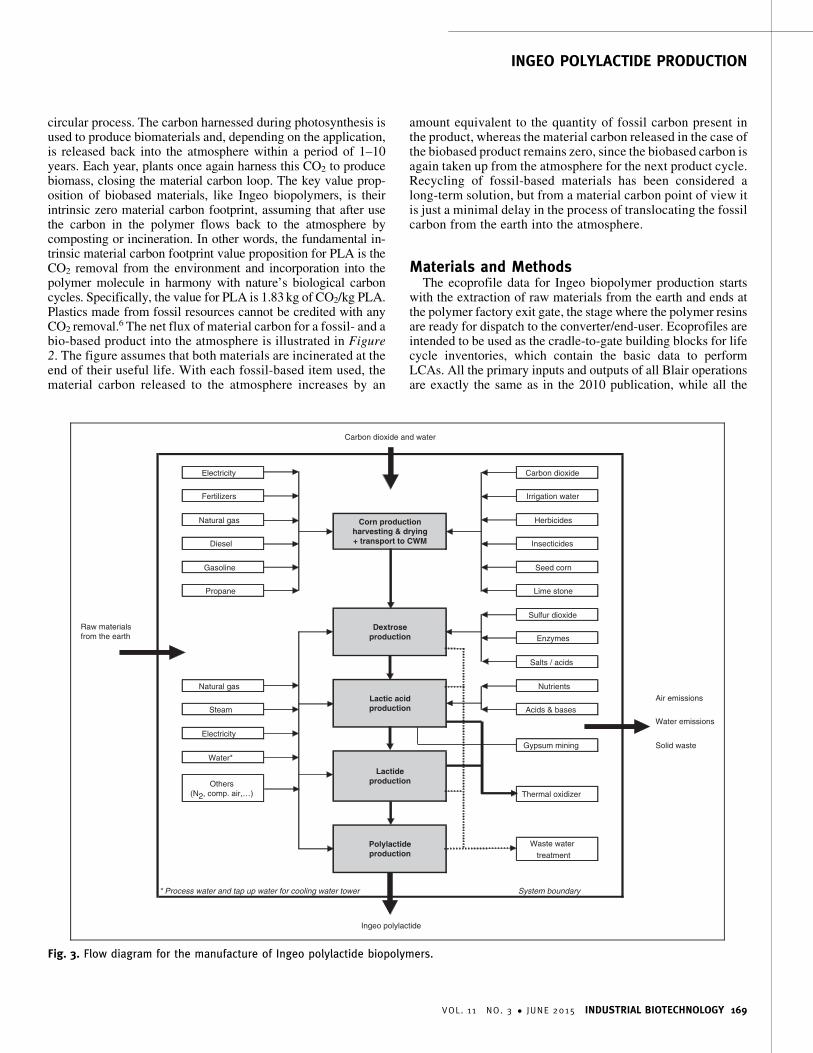
Materials and MethodsThe ecoprofile data for Ingeo biopolymer production starts
with the extraction of raw materials from the earth and ends atthe polymer factory exit gate, the stage where the polymer resinsare ready for dispatch to the converter/end-user. Ecoprofiles areintended to be used as the cradle-to-gate building blocks for lifecycle inventories, which contain the basic data to performLCAs. All the primary inputs and outputs of all Blair operationsare exactly the same as in the 2010 publication, while all the
Carbon dioxide and water
Electricity Carbon dioxide
Fertilizers Irrigation water
Natural gas Corn productionharvesting & drying+ transport to CWM
Herbicides
Diesel Insecticides
Gasoline Seed corn
Propane Lime stone
Sulfur dioxide
Raw materialsfrom the earth
Dextroseproduction Enzymes
Salts / acids
Natural gas Nutrients
Lactic acidproduction
Air emissions
Steam Acids & bases
Water emissions
Electricity
Gypsum mining Solid waste
Water*
LactideproductionOthers
(N2, comp. air,…) Thermal oxidizer
Polylactideproduction
Waste water
treatment
* Process water and tap up water for cooling water tower System boundary
Ingeo polylactide
Fig. 3. Flow diagram for the manufacture of Ingeo polylactide biopolymers.
INGEO POLYLACTIDE PRODUCTION
VOL. 11 NO. 3 � JUNE 2015 INDUSTRIAL BIOTECHNOLOGY 169
upstream data (e.g., electricity andfertilizer production) are now ta-ken from the GaBi6.3 databases.The final model was built in closecooperation with PE International.In 2014, after finalization of theGaBi modeling work, Kupfer re-viewed the model and selecteddatasets.7 This report contains newecoprofile data. The reference flowreferred to in this study is 1 kg In-geo biopolymer, at the polymerfactory exit gate of NatureWorks’Blair facility. The study was con-ducted according to the require-ments of ISO14040 and 14044.
The simplified process flow di-agram for the production of Ingeo isgiven in Figure 3. The productionsystem is divided into five steps:corn production and transport ofcorn to the corn wet mill; cornprocessing and the conversion ofthe corn starch into dextrose; con-version of dextrose into lactic acid;conversion of lactic acid into lac-tide; and polymerization of lactideinto Ingeo polymer pellets. Theprimary inputs to these five steps are listed on the right and leftsides of the flow diagram. In the final ecoprofile all primary inputsare traced back to the extraction of the raw materials from theearth. All the processes included in the calculation of the Ingeoecoprofile are given within the black lined box in Figure 3. Thebox surrounding all of the processes represents the systemboundary; the ecoprofile is the inventory of all the flows (inputsand outputs) passing this system boundary, including the rawmaterials from the earth, CO2, water, and the emissions to air,water, and soil. Here only aggregated data are provided to protectthe proprietary information of Cargill and NatureWorks.
The life cycle of Ingeo starts with corn production; all freeenergy consumed by the corn plant comes from solar energycaptured by photosynthesis. The basic stoichiometric equationfor photosynthesis is:
nH2O + nCO2
light/ (CH2O)n + nO2
In this equation, (CH2O)n represents simple sugars that are thebasic building blocks for all the substances present in the cornplant, such as starch, sugar, and cellulose. Therefore, all thecarbon, hydrogen, and oxygen found in the starch molecule andthe final Ingeo polymer originates from water and CO2. The datainclude all the relevant inputs for corn production, includingproduction of corn seed, fertilizers, lime stone, electricity, andfuels (natural gas, diesel, propane, and gasoline) used on the farm;the atmospheric CO2 used through photosynthesis; the irrigationwater applied to the corn field; and the production of the herbi-cides and insecticides used to protect the corn. On the output side,
emissions including dinitrogen oxide, nitrogen oxides, nitrates,and phosphates are taken into account. The production of the farmequipment (tractors and harvest combines) employed was in-vestigated, but their contributions are negligible.
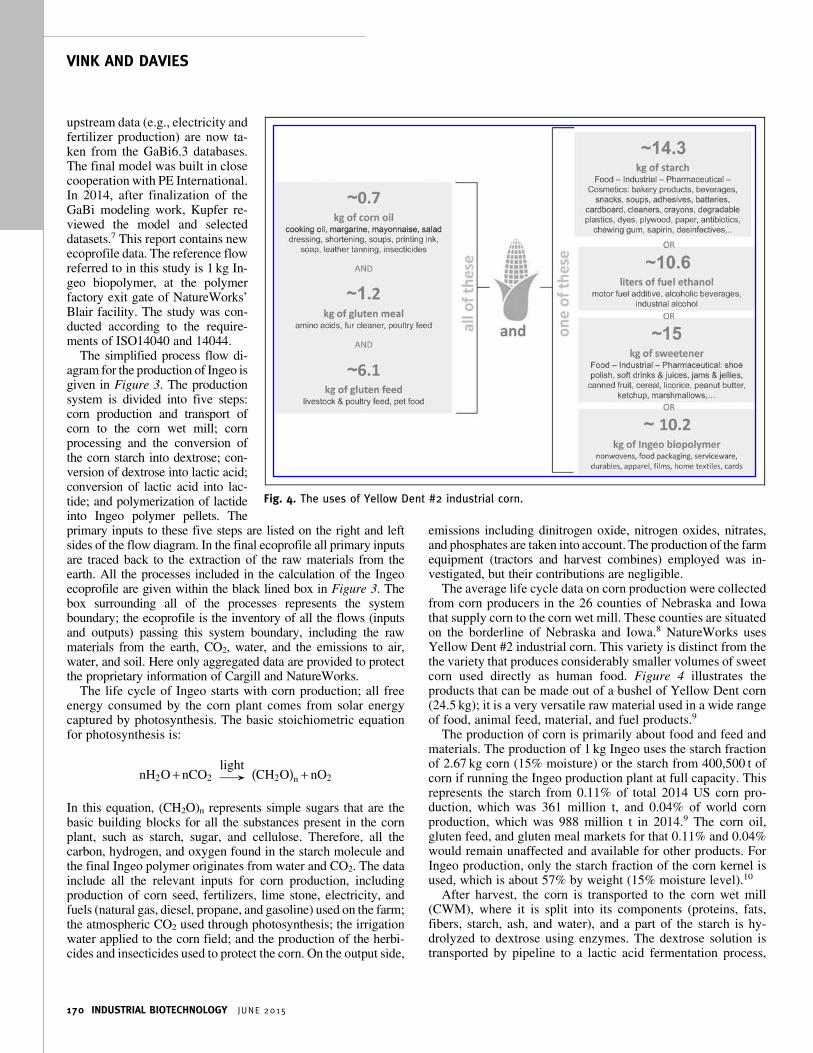
The average life cycle data on corn production were collectedfrom corn producers in the 26 counties of Nebraska and Iowathat supply corn to the corn wet mill. These counties are situatedon the borderline of Nebraska and Iowa.8 NatureWorks usesYellow Dent #2 industrial corn. This variety is distinct from thethe variety that produces considerably smaller volumes of sweetcorn used directly as human food. Figure 4 illustrates theproducts that can be made out of a bushel of Yellow Dent corn(24.5 kg); it is a very versatile raw material used in a wide rangeof food, animal feed, material, and fuel products.9
The production of corn is primarily about food and feed andmaterials. The production of 1 kg Ingeo uses the starch fractionof 2.67 kg corn (15% moisture) or the starch from 400,500 t ofcorn if running the Ingeo production plant at full capacity. Thisrepresents the starch from 0.11% of total 2014 US corn pro-duction, which was 361 million t, and 0.04% of world cornproduction, which was 988 million t in 2014.9 The corn oil,gluten feed, and gluten meal markets for that 0.11% and 0.04%would remain unaffected and available for other products. ForIngeo production, only the starch fraction of the corn kernel isused, which is about 57% by weight (15% moisture level).10
After harvest, the corn is transported to the corn wet mill(CWM), where it is split into its components (proteins, fats,fibers, starch, ash, and water), and a part of the starch is hy-drolyzed to dextrose using enzymes. The dextrose solution istransported by pipeline to a lactic acid fermentation process,
Fig. 4. The uses of Yellow Dent #2 industrial corn.
VINK AND DAVIES
170 INDUSTRIAL BIOTECHNOLOGY JUNE 2015
which is colocated at the biorefinery site. The other products ofthe modeled CWM are corn gluten feed, corn gluten meal, heavysteep water, and corn germ. To allocate all the inputs and outputs tothese products, the CWM production process was divided as muchas possible, resulting in the identification of 11 sub-processes. Foreach sub-process, allocation was based on the dry mass of thefinal and/or intermediate products. The data include all relevantinputs for dextrose production such as the production and deliveryof natural gas, electricity, and steam, as well as the production ofpotable and cooling water, compressed air, chemicals (sulfur di-oxide and calcium hydroxide), and enzymes.10
The CWM, as used in Blair, is an example of a modern, zero-waste biorefinery in which 100% of the feedstock is convertedinto a portfolio of food, feed, and industrial products. Thismakes it possible to coproduce food, feed, and materials at thelowest costs possible. The CWM as well as the lactic acid,lactide, and polymer plants are all situated at Cargill’s Blair site.Thus, up to the polymer resin, the only significant transportationstep is the relatively short distance from the field to the CWM.This is significantly different than fossil-based polymers, forwhich the carbon source—crude oil—is often transported overlong distances to the refineries. Data for a modern CWM rep-resentative of the Cargill CWM that supplies NatureWorks werecompiled and used for the dextrose-production step.10
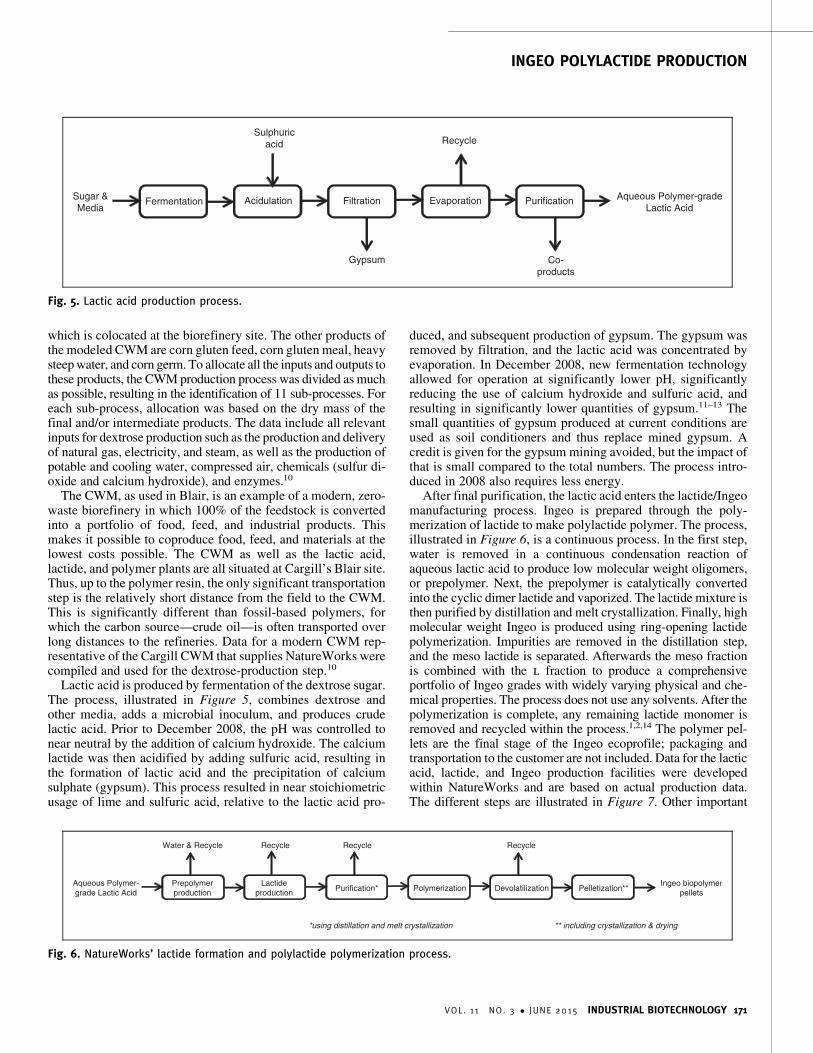
Lactic acid is produced by fermentation of the dextrose sugar.The process, illustrated in Figure 5, combines dextrose andother media, adds a microbial inoculum, and produces crudelactic acid. Prior to December 2008, the pH was controlled tonear neutral by the addition of calcium hydroxide. The calciumlactide was then acidified by adding sulfuric acid, resulting inthe formation of lactic acid and the precipitation of calciumsulphate (gypsum). This process resulted in near stoichiometricusage of lime and sulfuric acid, relative to the lactic acid pro-
duced, and subsequent production of gypsum. The gypsum wasremoved by filtration, and the lactic acid was concentrated byevaporation. In December 2008, new fermentation technologyallowed for operation at significantly lower pH, significantlyreducing the use of calcium hydroxide and sulfuric acid, andresulting in significantly lower quantities of gypsum.11–13 Thesmall quantities of gypsum produced at current conditions areused as soil conditioners and thus replace mined gypsum. Acredit is given for the gypsum mining avoided, but the impact ofthat is small compared to the total numbers. The process intro-duced in 2008 also requires less energy.
After final purification, the lactic acid enters the lactide/Ingeomanufacturing process. Ingeo is prepared through the poly-merization of lactide to make polylactide polymer. The process,illustrated in Figure 6, is a continuous process. In the first step,water is removed in a continuous condensation reaction ofaqueous lactic acid to produce low molecular weight oligomers,or prepolymer. Next, the prepolymer is catalytically convertedinto the cyclic dimer lactide and vaporized. The lactide mixture isthen purified by distillation and melt crystallization. Finally, highmolecular weight Ingeo is produced using ring-opening lactidepolymerization. Impurities are removed in the distillation step,and the meso lactide is separated. Afterwards the meso fractionis combined with the l fraction to produce a comprehensiveportfolio of Ingeo grades with widely varying physical and che-mical properties. The process does not use any solvents. After thepolymerization is complete, any remaining lactide monomer isremoved and recycled within the process.1,2,14 The polymer pel-lets are the final stage of the Ingeo ecoprofile; packaging andtransportation to the customer are not included. Data for the lacticacid, lactide, and Ingeo production facilities were developedwithin NatureWorks and are based on actual production data.The different steps are illustrated in Figure 7. Other important
Sulphuricacid Recycle
Sugar &Media
Fermentation Acidulation Filtration Evaporation Purification Aqueous Polymer-gradeLactic Acid
Gypsum Co-products
Fig. 5. Lactic acid production process.
Water & Recycle Recycle Recycle Recycle
Aqueous Polymer-grade Lactic Acid
Prepolymerproduction
Lactideproduction Purification* Polymerization Devolatilization Pelletization**
Ingeo biopolymerpellets
*using distillation and melt crystallization ** including crystallization & drying
Fig. 6. NatureWorks’ lactide formation and polylactide polymerization process.
INGEO POLYLACTIDE PRODUCTION
VOL. 11 NO. 3 � JUNE 2015 INDUSTRIAL BIOTECHNOLOGY 171
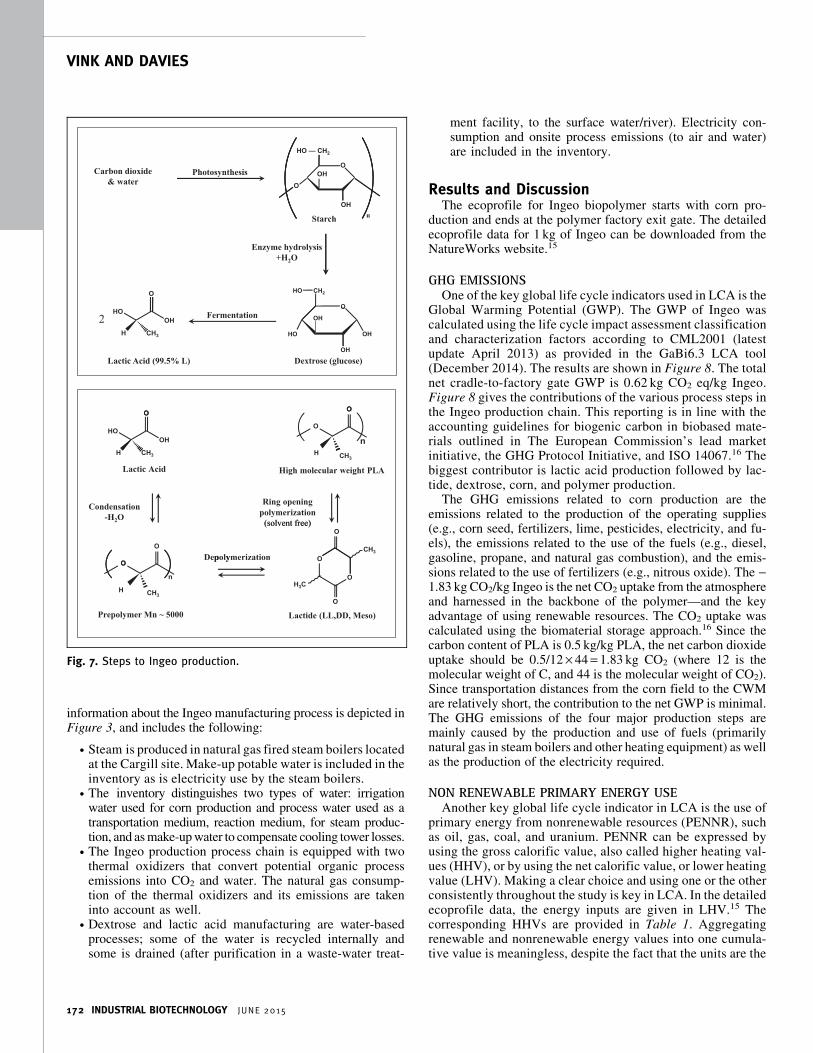
information about the Ingeo manufacturing process is depicted inFigure 3, and includes the following:
. Steam is produced in natural gas fired steam boilers locatedat the Cargill site. Make-up potable water is included in theinventory as is electricity use by the steam boilers.
. The inventory distinguishes two types of water: irrigationwater used for corn production and process water used as atransportation medium, reaction medium, for steam produc-tion, and as make-up water to compensate cooling tower losses.
. The Ingeo production process chain is equipped with twothermal oxidizers that convert potential organic processemissions into CO2 and water. The natural gas consump-tion of the thermal oxidizers and its emissions are takeninto account as well.
. Dextrose and lactic acid manufacturing are water-basedprocesses; some of the water is recycled internally andsome is drained (after purification in a waste-water treat-
ment facility, to the surface water/river). Electricity con-sumption and onsite process emissions (to air and water)are included in the inventory.
Results and DiscussionThe ecoprofile for Ingeo biopolymer starts with corn pro-
duction and ends at the polymer factory exit gate. The detailedecoprofile data for 1 kg of Ingeo can be downloaded from theNatureWorks website.15
GHG EMISSIONSOne of the key global life cycle indicators used in LCA is the
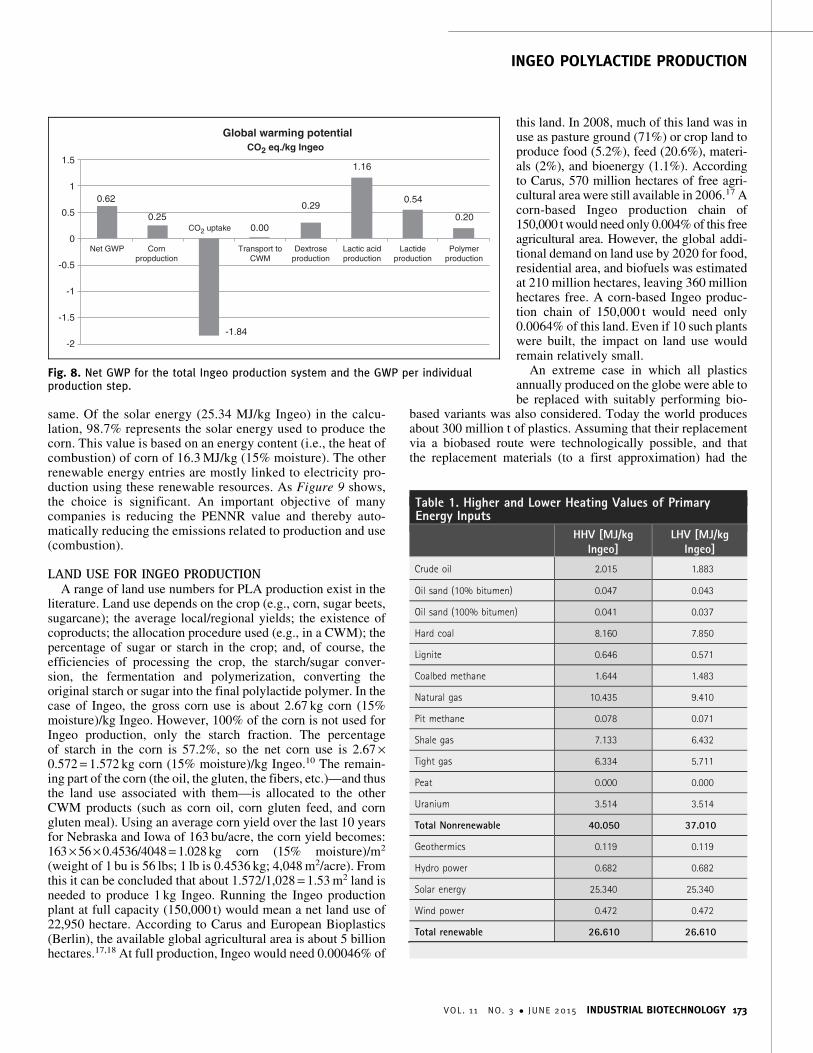
Global Warming Potential (GWP). The GWP of Ingeo wascalculated using the life cycle impact assessment classificationand characterization factors according to CML2001 (latestupdate April 2013) as provided in the GaBi6.3 LCA tool(December 2014). The results are shown in Figure 8. The totalnet cradle-to-factory gate GWP is 0.62 kg CO2 eq/kg Ingeo.Figure 8 gives the contributions of the various process steps inthe Ingeo production chain. This reporting is in line with theaccounting guidelines for biogenic carbon in biobased mate-rials outlined in The European Commission’s lead marketinitiative, the GHG Protocol Initiative, and ISO 14067.16 Thebiggest contributor is lactic acid production followed by lac-tide, dextrose, corn, and polymer production.
The GHG emissions related to corn production are theemissions related to the production of the operating supplies(e.g., corn seed, fertilizers, lime, pesticides, electricity, and fu-els), the emissions related to the use of the fuels (e.g., diesel,gasoline, propane, and natural gas combustion), and the emis-sions related to the use of fertilizers (e.g., nitrous oxide). The -1.83 kg CO2/kg Ingeo is the net CO2 uptake from the atmosphereand harnessed in the backbone of the polymer—and the keyadvantage of using renewable resources. The CO2 uptake wascalculated using the biomaterial storage approach.16 Since thecarbon content of PLA is 0.5 kg/kg PLA, the net carbon dioxideuptake should be 0.5/12 · 44 = 1.83 kg CO2 (where 12 is themolecular weight of C, and 44 is the molecular weight of CO2).Since transportation distances from the corn field to the CWMare relatively short, the contribution to the net GWP is minimal.The GHG emissions of the four major production steps aremainly caused by the production and use of fuels (primarilynatural gas in steam boilers and other heating equipment) as wellas the production of the electricity required.
NON RENEWABLE PRIMARY ENERGY USEAnother key global life cycle indicator in LCA is the use of
primary energy from nonrenewable resources (PENNR), suchas oil, gas, coal, and uranium. PENNR can be expressed byusing the gross calorific value, also called higher heating val-ues (HHV), or by using the net calorific value, or lower heatingvalue (LHV). Making a clear choice and using one or the otherconsistently throughout the study is key in LCA. In the detailedecoprofile data, the energy inputs are given in LHV.15 Thecorresponding HHVs are provided in Table 1. Aggregatingrenewable and nonrenewable energy values into one cumula-tive value is meaningless, despite the fact that the units are the
Fig. 7. Steps to Ingeo production.
VINK AND DAVIES
172 INDUSTRIAL BIOTECHNOLOGY JUNE 2015
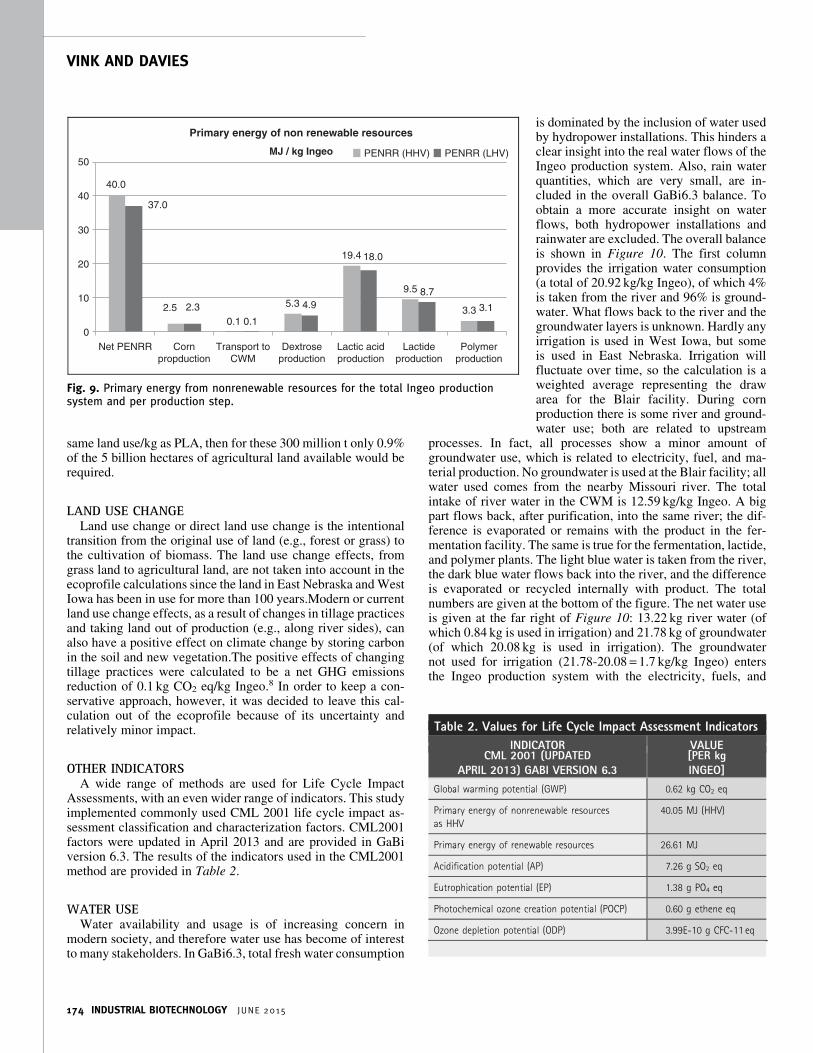
same. Of the solar energy (25.34 MJ/kg Ingeo) in the calcu-lation, 98.7% represents the solar energy used to produce thecorn. This value is based on an energy content (i.e., the heat ofcombustion) of corn of 16.3 MJ/kg (15% moisture). The otherrenewable energy entries are mostly linked to electricity pro-duction using these renewable resources. As Figure 9 shows,the choice is significant. An important objective of manycompanies is reducing the PENNR value and thereby auto-matically reducing the emissions related to production and use(combustion).
LAND USE FOR INGEO PRODUCTIONA range of land use numbers for PLA production exist in the
literature. Land use depends on the crop (e.g., corn, sugar beets,sugarcane); the average local/regional yields; the existence ofcoproducts; the allocation procedure used (e.g., in a CWM); thepercentage of sugar or starch in the crop; and, of course, theefficiencies of processing the crop, the starch/sugar conver-sion, the fermentation and polymerization, converting theoriginal starch or sugar into the final polylactide polymer. In thecase of Ingeo, the gross corn use is about 2.67 kg corn (15%moisture)/kg Ingeo. However, 100% of the corn is not used forIngeo production, only the starch fraction. The percentageof starch in the corn is 57.2%, so the net corn use is 2.67 ·0.572 = 1.572 kg corn (15% moisture)/kg Ingeo.10 The remain-ing part of the corn (the oil, the gluten, the fibers, etc.)—and thusthe land use associated with them—is allocated to the otherCWM products (such as corn oil, corn gluten feed, and corngluten meal). Using an average corn yield over the last 10 yearsfor Nebraska and Iowa of 163 bu/acre, the corn yield becomes:163 · 56 · 0.4536/4048 = 1.028 kg corn (15% moisture)/m2
(weight of 1 bu is 56 lbs; 1 lb is 0.4536 kg; 4,048 m2/acre). Fromthis it can be concluded that about 1.572/1,028 = 1.53 m2 land isneeded to produce 1 kg Ingeo. Running the Ingeo productionplant at full capacity (150,000 t) would mean a net land use of22,950 hectare. According to Carus and European Bioplastics(Berlin), the available global agricultural area is about 5 billionhectares.17,18 At full production, Ingeo would need 0.00046% of
this land. In 2008, much of this land was inuse as pasture ground (71%) or crop land toproduce food (5.2%), feed (20.6%), materi-als (2%), and bioenergy (1.1%). Accordingto Carus, 570 million hectares of free agri-cultural area were still available in 2006.17 Acorn-based Ingeo production chain of150,000 t would need only 0.004% of this freeagricultural area. However, the global addi-tional demand on land use by 2020 for food,residential area, and biofuels was estimatedat 210 million hectares, leaving 360 millionhectares free. A corn-based Ingeo produc-tion chain of 150,000 t would need only0.0064% of this land. Even if 10 such plantswere built, the impact on land use wouldremain relatively small.
An extreme case in which all plasticsannually produced on the globe were able tobe replaced with suitably performing bio-
based variants was also considered. Today the world producesabout 300 million t of plastics. Assuming that their replacementvia a biobased route were technologically possible, and thatthe replacement materials (to a first approximation) had the
0.62
0.25
-1.84
0.00
0.29
1.16
0.54
0.20
-2
-1.5
-1
-0.5
0
0.5
1
1.5
Net GWP Cornpropduction
Transport toCWM
Dextroseproduction
Lactic acidproduction
Lactideproduction
Polymerproduction
Global warming potentialCO2 eq./kg Ingeo
CO2 uptake
Fig. 8. Net GWP for the total Ingeo production system and the GWP per individualproduction step.
Table 1. Higher and Lower Heating Values of PrimaryEnergy Inputs
HHV [MJ/kgIngeo]
LHV [MJ/kgIngeo]
Crude oil 2.015 1.883
Oil sand (10% bitumen) 0.047 0.043
Oil sand (100% bitumen) 0.041 0.037
Hard coal 8.160 7.850
Lignite 0.646 0.571
Coalbed methane 1.644 1.483
Natural gas 10.435 9.410
Pit methane 0.078 0.071
Shale gas 7.133 6.432
Tight gas 6.334 5.711
Peat 0.000 0.000
Uranium 3.514 3.514
Total Nonrenewable 40.050 37.010
Geothermics 0.119 0.119
Hydro power 0.682 0.682
Solar energy 25.340 25.340
Wind power 0.472 0.472
Total renewable 26.610 26.610
INGEO POLYLACTIDE PRODUCTION
VOL. 11 NO. 3 � JUNE 2015 INDUSTRIAL BIOTECHNOLOGY 173
same land use/kg as PLA, then for these 300 million t only 0.9%of the 5 billion hectares of agricultural land available would berequired.
LAND USE CHANGELand use change or direct land use change is the intentional
transition from the original use of land (e.g., forest or grass) tothe cultivation of biomass. The land use change effects, fromgrass land to agricultural land, are not taken into account in theecoprofile calculations since the land in East Nebraska and WestIowa has been in use for more than 100 years.Modern or currentland use change effects, as a result of changes in tillage practicesand taking land out of production (e.g., along river sides), canalso have a positive effect on climate change by storing carbonin the soil and new vegetation.The positive effects of changingtillage practices were calculated to be a net GHG emissionsreduction of 0.1 kg CO2 eq/kg Ingeo.8 In order to keep a con-servative approach, however, it was decided to leave this cal-culation out of the ecoprofile because of its uncertainty andrelatively minor impact.
OTHER INDICATORSA wide range of methods are used for Life Cycle Impact
Assessments, with an even wider range of indicators. This studyimplemented commonly used CML 2001 life cycle impact as-sessment classification and characterization factors. CML2001factors were updated in April 2013 and are provided in GaBiversion 6.3. The results of the indicators used in the CML2001method are provided in Table 2.
WATER USEWater availability and usage is of increasing concern in
modern society, and therefore water use has become of interestto many stakeholders. In GaBi6.3, total fresh water consumption
is dominated by the inclusion of water usedby hydropower installations. This hinders aclear insight into the real water flows of theIngeo production system. Also, rain waterquantities, which are very small, are in-cluded in the overall GaBi6.3 balance. Toobtain a more accurate insight on waterflows, both hydropower installations andrainwater are excluded. The overall balanceis shown in Figure 10. The first columnprovides the irrigation water consumption(a total of 20.92 kg/kg Ingeo), of which 4%is taken from the river and 96% is ground-water. What flows back to the river and thegroundwater layers is unknown. Hardly anyirrigation is used in West Iowa, but someis used in East Nebraska. Irrigation willfluctuate over time, so the calculation is aweighted average representing the drawarea for the Blair facility. During cornproduction there is some river and ground-water use; both are related to upstream
processes. In fact, all processes show a minor amount ofgroundwater use, which is related to electricity, fuel, and ma-terial production. No groundwater is used at the Blair facility; allwater used comes from the nearby Missouri river. The totalintake of river water in the CWM is 12.59 kg/kg Ingeo. A bigpart flows back, after purification, into the same river; the dif-ference is evaporated or remains with the product in the fer-mentation facility. The same is true for the fermentation, lactide,and polymer plants. The light blue water is taken from the river,the dark blue water flows back into the river, and the differenceis evaporated or recycled internally with product. The totalnumbers are given at the bottom of the figure. The net water useis given at the far right of Figure 10: 13.22 kg river water (ofwhich 0.84 kg is used in irrigation) and 21.78 kg of groundwater(of which 20.08 kg is used in irrigation). The groundwaternot used for irrigation (21.78-20.08 = 1.7 kg/kg Ingeo) entersthe Ingeo production system with the electricity, fuels, and
40.0
2.50.1
5.3
19.4
9.5
3.3
37.0
2.30.1
4.9
18.0
8.7
3.1
0
10
20
30
40
50
Net PENRR
Primary energy of non renewable resources
MJ / kg Ingeo PENRR (HHV) PENRR (LHV)
Cornpropduction
Transport toCWM
Dextroseproduction
Lactic acidproduction
Lactideproduction
Polymerproduction
Fig. 9. Primary energy from nonrenewable resources for the total Ingeo productionsystem and per production step.
Table 2. Values for Life Cycle Impact Assessment Indicators
INDICATOR VALUECML 2001 (UPDATED
APRIL 2013) GABI VERSION 6.3[PER kgINGEO]
Global warming potential (GWP) 0.62 kg CO2 eq
Primary energy of nonrenewable resources
as HHV
40.05 MJ (HHV)
Primary energy of renewable resources 26.61 MJ
Acidification potential (AP) 7.26 g SO2 eq
Eutrophication potential (EP) 1.38 g PO4 eq
Photochemical ozone creation potential (POCP) 0.60 g ethene eq
Ozone depletion potential (ODP) 3.99E-10 g CFC-11 eq
VINK AND DAVIES
174 INDUSTRIAL BIOTECHNOLOGY JUNE 2015
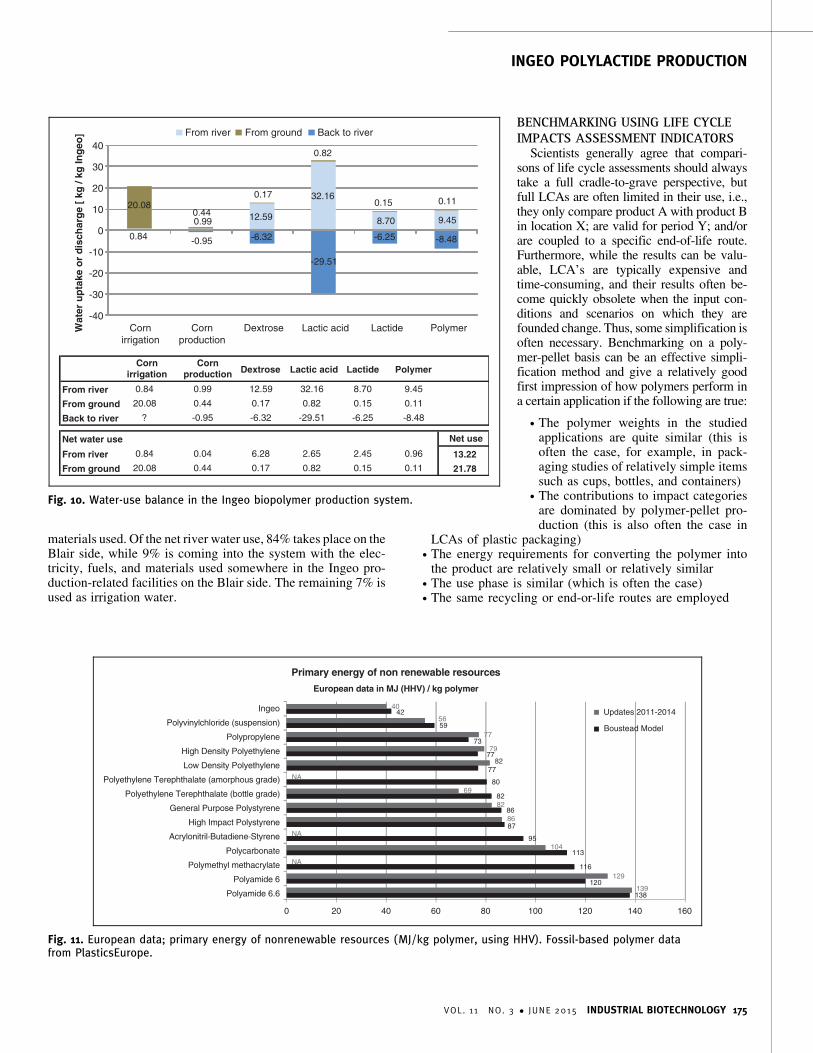
materials used. Of the net river water use, 84% takes place on theBlair side, while 9% is coming into the system with the elec-tricity, fuels, and materials used somewhere in the Ingeo pro-duction-related facilities on the Blair side. The remaining 7% isused as irrigation water.
BENCHMARKING USING LIFE CYCLEIMPACTS ASSESSMENT INDICATORS
Scientists generally agree that compari-sons of life cycle assessments should alwaystake a full cradle-to-grave perspective, butfull LCAs are often limited in their use, i.e.,they only compare product A with product Bin location X; are valid for period Y; and/orare coupled to a specific end-of-life route.Furthermore, while the results can be valu-able, LCA’s are typically expensive andtime-consuming, and their results often be-come quickly obsolete when the input con-ditions and scenarios on which they arefounded change. Thus, some simplification isoften necessary. Benchmarking on a poly-mer-pellet basis can be an effective simpli-fication method and give a relatively goodfirst impression of how polymers perform ina certain application if the following are true:
. The polymer weights in the studiedapplications are quite similar (this isoften the case, for example, in pack-aging studies of relatively simple itemssuch as cups, bottles, and containers)
. The contributions to impact categoriesare dominated by polymer-pellet pro-duction (this is also often the case in
LCAs of plastic packaging). The energy requirements for converting the polymer into
the product are relatively small or relatively similar. The use phase is similar (which is often the case). The same recycling or end-or-life routes are employed
Cornirrigation
Cornproduction Dextrose Lactic acid Lactide Polymer
From river 0.84 0.99 12.59 32.16 8.70 9.45
From ground 20.08 0.44 0.17 0.82 0.15 0.11
Back to river ? -0.95 -6.32 -29.51 -6.25 -8.48
Net water use Net use
From river 0.84 0.04 6.28 2.65 2.45 0.96 13.22
From ground 20.08 0.44 0.17 0.82 0.15 0.11 21.78
0.84
0.99 12.59
32.16
8.70 9.45
20.080.44
0.17
0.82
0.15 0.11
-0.95 -6.32
-29.51
-6.25 -8.48
-40
-30
-20
-10
0
10
20
30
40
Cornirrigation
Cornproduction
Dextrose Lactic acid Lactide PolymerWat
er u
pta
ke o
r d
isch
arg
e [
kg /
kg In
geo
] From river From ground Back to river
Fig. 10. Water-use balance in the Ingeo biopolymer production system.
Primary energy of non renewable resources
European data in MJ (HHV) / kg polymer
77
73
59
42
82
79
77
56
40Ingeo
138
120
116
113
95
87
86
82
80
77
139
129
NA
104
NA
86
82
69
NA
82
0 20 40 60 80 100 120 140 160
Updates 2011-2014
Boustead ModelPolyvinylchloride (suspension)
Polypropylene
High Density Polyethylene
Low Density Polyethylene
Polyethylene Terephthalate (amorphous grade)
Polyethylene Terephthalate (bottle grade)
General Purpose Polystyrene
High Impact Polystyrene
Acrylonitril‐Butadiene‐Styrene
Polycarbonate
Polymethyl methacrylate
Polyamide 6
Polyamide 6.6
Fig. 11. European data; primary energy of nonrenewable resources (MJ/kg polymer, using HHV). Fossil-based polymer datafrom PlasticsEurope.
INGEO POLYLACTIDE PRODUCTION
VOL. 11 NO. 3 � JUNE 2015 INDUSTRIAL BIOTECHNOLOGY 175
In the Life Cycle Assessment phase the inventory data areaggregated into a series of impact categories that provide ab-solute or potential contributions, such as global warming, non-renewable and renewable energy use, water use, photochemicaloxidant creation, acidification, eutrophication, human toxicity,and ecotoxicity. Preconditions for meaningful comparisons inLCA include the following:
. Use of the same level of detail in the life cycle inventorydata-collection process (especially toxicity-related indica-tors are very sensitive to this)
. Use of the same LCA methodology (e.g., allocation rules,cut-off rules, boundaries)
. Use of the same database for upstream inventory data (e.g.,for electricity production)
. Use of the same life cycle impact assessment methodology,indicators, and characterization factors (+version)
Broadly, environmental impact categories can be divided intothree groups:
Group 1: Indicators of global relevance, generally of high reli-
ability and accuracy. Primary energy from nonrenewable re-sources and global warming are two global indicators; theprimary energy is an absolute value and global warming is apotential. Both are of high importance and normally have thehighest reliability since the underlying data are usually reportedin a relatively accurate way.
Group 2: Indicators of local/regional relevance. Other indicatorssuch as photochemical ozone creation, eutrophication, wateruse, and acidification are more regional or local indicators;they are indicators of potential regional impact and should be
Global warming potentialEuropean data in CO2eq./kg polymer
1.9
1.9
1.9
1.3
1.8
1.6
1.9
0.6
7.9
9.1
7
7.6
3.8
3.4
3.4
3.4
3.2
2.1
.9
6.4
6.7
NA
4,1
NA
2.4
2.3
2,2
NA
1.9
Ingeo
Polyvinylchloride (suspension)
Polypropylene
High Density Polyethylene
Low Density Polyethylene
Polyethylene Terephthalate (amorphous grade)
Polyethylene Terephthalate (bottle grade)
General Purpose Polystyrene
High Impact Polystyrene
Acrylonitril‐Butadiene‐Styrene
Polycarbonate
Polymethyl methacrylate
Polyamide 6
Polyamide 6.6
0 2 4 6 8 103 5 7
Updates 2011-2014
Boustead Model
91
Fig. 12. European data; GWP (kg CO2 eq/kg polymer). Fossil-based polymer data from PlasticsEurope.
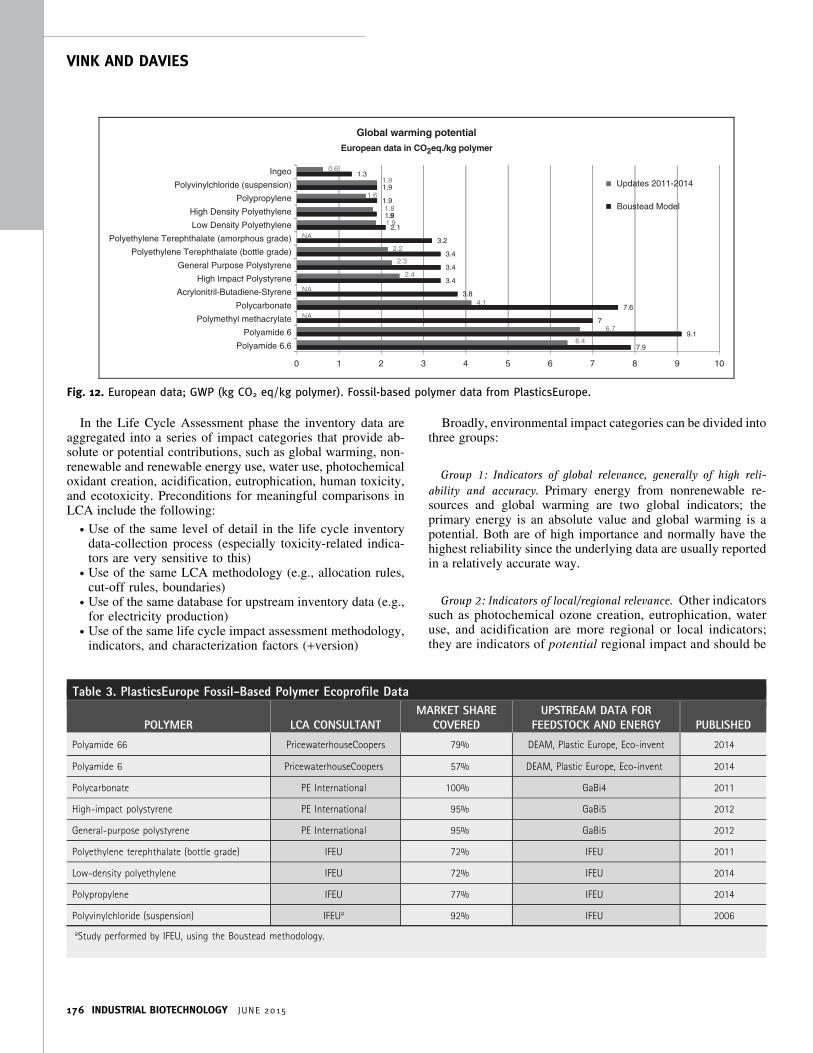
Table 3. PlasticsEurope Fossil-Based Polymer Ecoprofile Data
POLYMER LCA CONSULTANTMARKET SHARE
COVEREDUPSTREAM DATA FOR
FEEDSTOCK AND ENERGY PUBLISHED
Polyamide 66 PricewaterhouseCoopers 79% DEAM, Plastic Europe, Eco-invent 2014
Polyamide 6 PricewaterhouseCoopers 57% DEAM, Plastic Europe, Eco-invent 2014
Polycarbonate PE International 100% GaBi4 2011
High-impact polystyrene PE International 95% GaBi5 2012
General-purpose polystyrene PE International 95% GaBi5 2012
Polyethylene terephthalate (bottle grade) IFEU 72% IFEU 2011
Low-density polyethylene IFEU 72% IFEU 2014
Polypropylene IFEU 77% IFEU 2014
Polyvinylchloride (suspension) IFEUa 92% IFEU 2006
aStudy performed by IFEU, using the Boustead methodology.
VINK AND DAVIES
176 INDUSTRIAL BIOTECHNOLOGY JUNE 2015
interpreted accordingly. As an example, in terms of the localenvironmental impact of a process requiring water, there is abig difference depending on whether the process is located in ahigh drought area or in an area with a large surplus of water.Clearly, water is an example of a local indicator that must betaken in a local context. In current LCA methodology, the localcontext is often not taken into account, since the calculationmodels and the required databases are not available. Generally,these indicators are of medium accuracy compared to group 1indicators.
Group 3: Indicators of local/regional relevance with low accura-
cy. Indicators like eco- and human toxicity are local indicatorsshowing potential impacts, with medium to high importance, buttypically have low to very low accuracy. They are also highlydependent on the level of detail of the life cycle inventory datacollected. Often the completeness and reliability of the data areso low that the data are not used by LCA practitioners. One ofthe reasons that toxicity indicators are usually considered ofvery low accuracy is that the databases used seldom accountequally for all relevant inputs and outputs in the polymer pro-duction process. And, ironically, processes for the production ofnewer biobased materials are often more comprehensivelyquantified in this regard than are legacy systems for fossil-basedmaterials. Contributions not measured, quantified, or capturedin a database could include emissions related to accidents orproduction practices, such as Deepwater Horizon or the poor oilproduction practices in the Nigeria delta, respectively. Further,as ‘‘easy oil’’ has largely already been tapped, new oil and gasexploration comes with higher energy use and higher environ-mental risks (deep sea drilling, oil from tar sands, drilling in thearctic, and oil mining in Nigeria). For all these reasons, if de-cisions hinge critically on indicators such as these, a deeperanalysis–such as in a typical LCA—is recommended. One al-ternate, non-LCA methodology that might be considered is theuse of wholly third-party evaluations such as that conducted bythe Cradle-to-Cradle Product Innovation Institute (San Fran-cisco, CA), which includes an explicit evaluation of health andhuman safety.
EUROPEAN PLASTIC PRODUCTION DATAFigure 11 provides the primary energy of nonrenewable re-
sources in MJ (HHV)/kg polymer for a selection of polymersproduced in Europe and Ingeo produced in the US. Figure 12shows the GHG emissions expressed as the GWP in CO2 eq/kgpolymer. These are net GWP values from cradle-to-polymerfactory-to-exit gate. For Ingeo, the uptake of CO2 from the at-mosphere is included, since this takes place during corn pro-duction.19 Since the beginning of the 1990s, PlasticsEurope haspublished ecoprofile data for fossil-based plastics.19 These werealways calculated using the Boustead Model. The latest valuesare shown in Figures 11 and 12; the data for the various poly-mers are directly comparable since they were calculated usingthe same methodology, the same LCA tool, and the same data-base for upstream data (i.e., for feedstocks such as oil and gasproduction, and energy such as electricity generation). Since2011, PlasticsEurope has been updating these ecoprofiles usingdifferent LCA consultants, different LCA tools, and differentdatabases for upstream processes—and electricity is one of themost influential factors, as summarized in Table 3. The Plas-ticsEurope eco-profile program is coordinated by DEKRA In-dustrial (Stuttgart, Germany) and the methodology is described
105
96
95
70
84
78
76
59
40
0 20 40 60 80 100 120
High impact polystyrene
General purpose polystyrene
Polyethylene terephthalate
Low density polyethylene
High density polyethylene
Polypropylene
Polyvinylchloride
Ingeo
Primary energy of non renewable resources US data in MJ (HHV) / kg polymer
Acrylonitril-Butadiene-Styrene
Fig. 13. US data; primary energy of nonrenewable resources—Cradle-to-polymer factory-gate. Fossil-based polymer data fromFranklin Associates.
3.83.33.2
2.72.2
1.91.9
2.40.6
0 0.5 1 1.5 2 2.5 3 3.5 4
High impact polystyreneGeneral purpose polystyrene
Polyethylene terephthalateLow density polyethyleneHigh density polyethylene
PolypropylenePolyvinylchloride
Ingeo
Global warming potential
Acrylonitril-Butadiene-Styrene
US data in CO2eq./kg polymer
Fig. 14. US data; GWP—Cradle-to-polymer factory-gate.Fossil-based polymer data from Franklin Associates.
Table 4. US Fossil-Based Polymer Ecoprofile Data
MARKET SHARECOVERED IN US
AND CANADA (%) YEAR
Polyvinyl chloride 35 2003
Polypropylene 20 2003
High-density polyethylene 20 2003
Low-density polyethylene 30 2003
Polyethylene terephthalate 15 2003
General purpose polystyrene 20 2002
High-impact polystyrene 25 2002
Acrylonitrile butadiene styrene 50 2003
INGEO POLYLACTIDE PRODUCTION
VOL. 11 NO. 3 � JUNE 2015 INDUSTRIAL BIOTECHNOLOGY 177
in Eco-profiles and Environmental Declarations, Version 2.0.19
Figures 11 and 12 include the data points for the updated eco-profiles. New data are not available yet for some of the poly-mers, as indicated by NA (not available). In this situation, it isless clear how comparable the data sets for the different poly-mers are currently, since different datasets—Data for Environ-mental Analysis and Management (DEAM), PlasticsEurope,ecoinvent, GaBi4 and 5, and IFEU—were used for inputs such asfeedstock (oil and gas) and electricity production. PlasticsEu-rope is only publishing industry average data for its polymers. Inthe case of Ingeo (Table 3), with PE International as the con-sultant, the market share covered is 100%, GaBi6.3 data were
used for upstream data, and the data were published in 2014.However, only for Ingeo are the data company- and location-specific, providing implicitly the highest level of transparency.
UNITED STATES PLASTIC PRODUCTION DATAIn the US, ecoprofile data were published in 2011 by Franklin
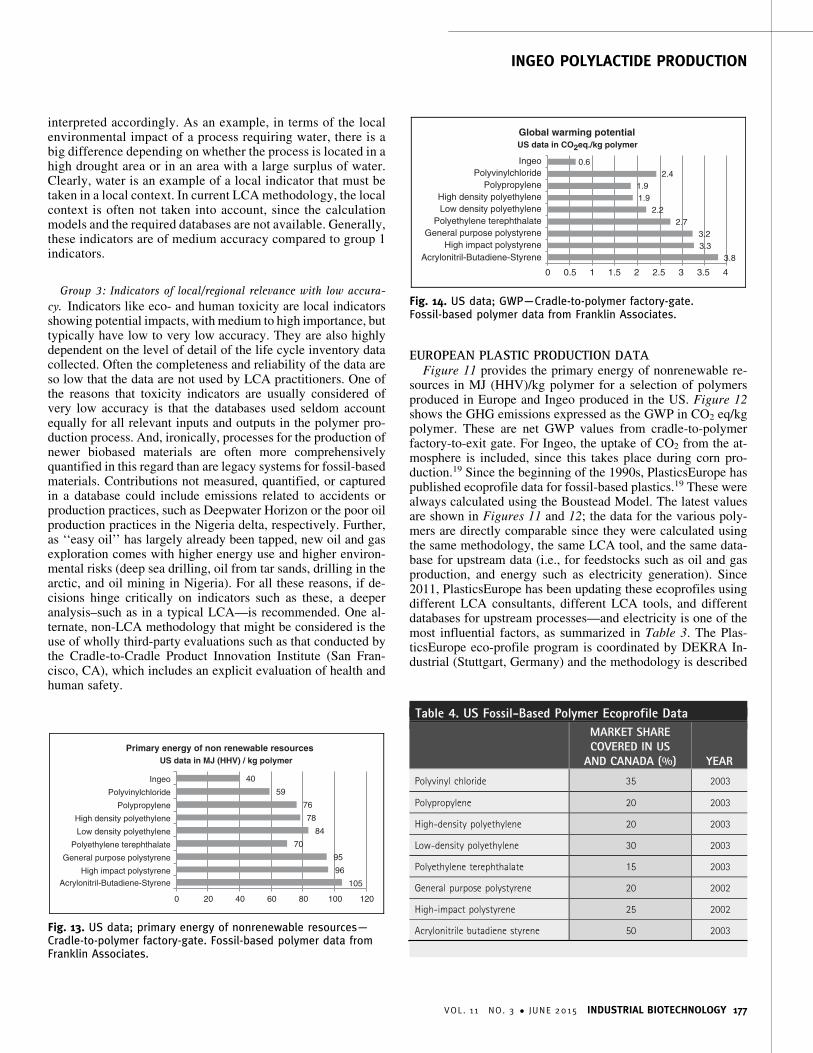
Associates (Prairie Village, KS) for the American PlasticsCouncil.20 Figure 13 gives the latest available data for the pri-mary energy of non-renewable resources in MJ (HHV) / kgpolymer for a selection of polymers produced in the US. Figure14 provides the global warming potential expressed as CO2 eq/ kg
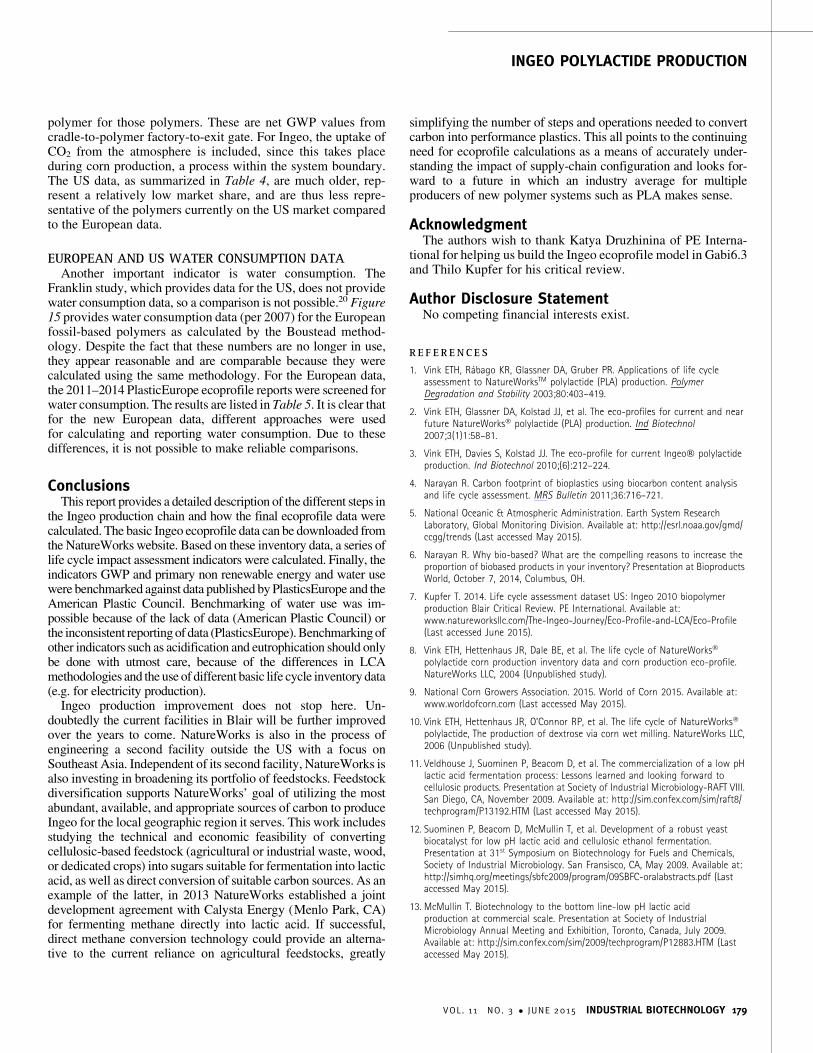
Table 5. PlasticsEurope Data on Water Consumption for Fossil-Based Polymers (Cradle-to-Polymer Factory-Gate,2011–2014) [kg/kg polymer]
POLYMER PROCESS COOLING TOTAL TURBINED WATER BOILER FEED PROVIDER
Polyamide 6.6 52 1116 1168 1555 - PricewaterhouseCoopers
Polyamide 6 10 1637 1647 1587 - PricewaterhouseCoopers
Polymethyl methacrylatea - - - - - -
Polycarbonate 13 9 22 - - PE International
Acrylonitrile butadiene styrenea - - - - - -
High-impact polystyrene - - 749b - - PE International
General purpose polystyrene - - 706b - - PE International
Polyethylene terephthalate (bottle) 7 53 60 - - IFEU
Polyethylene terephthalatea (amorphous) - - - - - -
Low-density polyethylene 1 41 42 - 0.4 IFEU
Polypropylene (only polymer production step) 0.4 19.3 19.7 - 0.2 IFEU
Polyvinyl chloride (suspension) 10 450 460 - - IFEUc
aData not available.bIncludes detailed overview of water sources and destinations.cStudy performed by IFEU, using the Boustead methodology.
0.00
Polyamide 6.6Polyamide 6
Polycarbonate
PolypropylenePolyvinylchloride (susp.)
Process water Cooling water Irrigation water
Polystyren HIPS/GPPS av.
Ingeo in 2009
Low density polyethylenePolyethylene terephtalate (bottle)Polyethylene terephtalate (bottle)
[kg water / kg polymer (cradle to polymer factory exit gate)]
100.00 200.00 300.00 400.00 500.00 600.00 700.00
Fig. 15. Water consumption data for fossil-based polymer (2007, according to Boustead methodology, data from PlasticsEurope).
VINK AND DAVIES
178 INDUSTRIAL BIOTECHNOLOGY JUNE 2015
polymer for those polymers. These are net GWP values fromcradle-to-polymer factory-to-exit gate. For Ingeo, the uptake ofCO2 from the atmosphere is included, since this takes placeduring corn production, a process within the system boundary.The US data, as summarized in Table 4, are much older, rep-resent a relatively low market share, and are thus less repre-sentative of the polymers currently on the US market comparedto the European data.
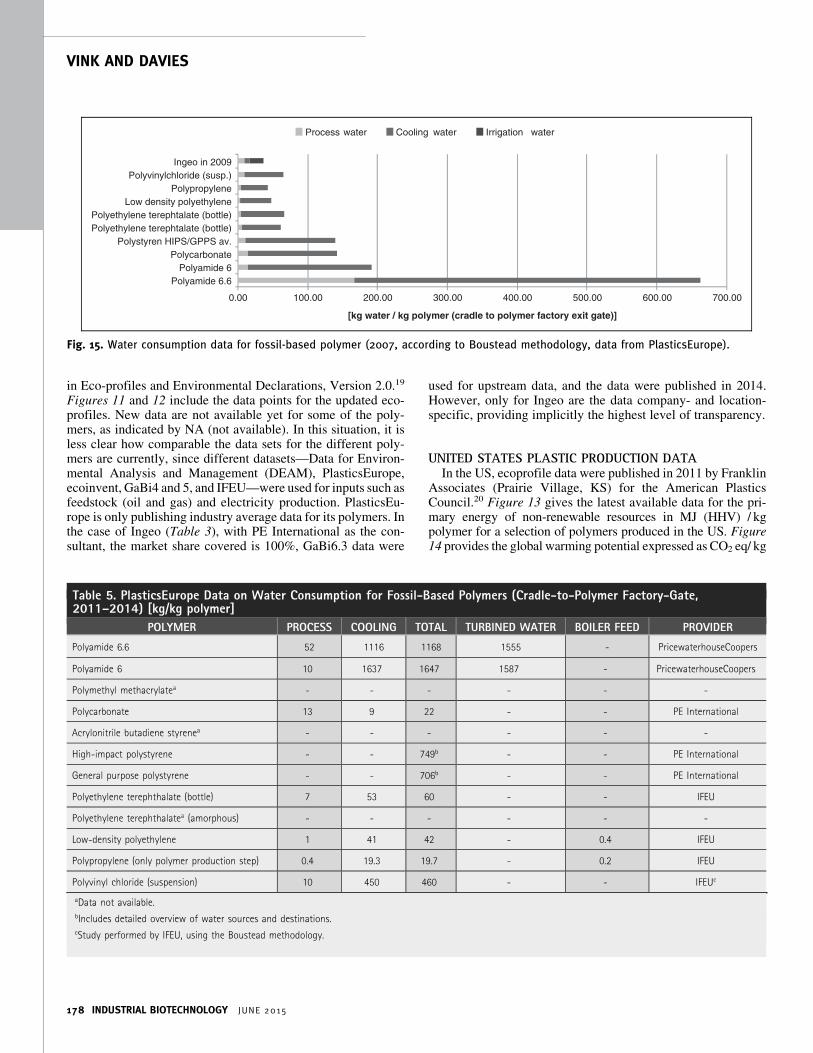
EUROPEAN AND US WATER CONSUMPTION DATAAnother important indicator is water consumption. The
Franklin study, which provides data for the US, does not providewater consumption data, so a comparison is not possible.20 Figure15 provides water consumption data (per 2007) for the Europeanfossil-based polymers as calculated by the Boustead method-ology. Despite the fact that these numbers are no longer in use,they appear reasonable and are comparable because they werecalculated using the same methodology. For the European data,the 2011–2014 PlasticEurope ecoprofile reports were screened forwater consumption. The results are listed in Table 5. It is clear thatfor the new European data, different approaches were usedfor calculating and reporting water consumption. Due to thesedifferences, it is not possible to make reliable comparisons.
ConclusionsThis report provides a detailed description of the different steps in
the Ingeo production chain and how the final ecoprofile data werecalculated. The basic Ingeo ecoprofile data can be downloaded fromthe NatureWorks website. Based on these inventory data, a series oflife cycle impact assessment indicators were calculated. Finally, theindicators GWP and primary non renewable energy and water usewere benchmarked against data published by PlasticsEurope and theAmerican Plastic Council. Benchmarking of water use was im-possible because of the lack of data (American Plastic Council) orthe inconsistent reporting of data (PlasticsEurope). Benchmarking ofother indicators such as acidification and eutrophication should onlybe done with utmost care, because of the differences in LCAmethodologies and the use of different basic life cycle inventory data(e.g. for electricity production).
Ingeo production improvement does not stop here. Un-doubtedly the current facilities in Blair will be further improvedover the years to come. NatureWorks is also in the process ofengineering a second facility outside the US with a focus onSoutheast Asia. Independent of its second facility, NatureWorks isalso investing in broadening its portfolio of feedstocks. Feedstockdiversification supports NatureWorks’ goal of utilizing the mostabundant, available, and appropriate sources of carbon to produceIngeo for the local geographic region it serves. This work includesstudying the technical and economic feasibility of convertingcellulosic-based feedstock (agricultural or industrial waste, wood,or dedicated crops) into sugars suitable for fermentation into lacticacid, as well as direct conversion of suitable carbon sources. As anexample of the latter, in 2013 NatureWorks established a jointdevelopment agreement with Calysta Energy (Menlo Park, CA)for fermenting methane directly into lactic acid. If successful,direct methane conversion technology could provide an alterna-tive to the current reliance on agricultural feedstocks, greatly
simplifying the number of steps and operations needed to convertcarbon into performance plastics. This all points to the continuingneed for ecoprofile calculations as a means of accurately under-standing the impact of supply-chain configuration and looks for-ward to a future in which an industry average for multipleproducers of new polymer systems such as PLA makes sense.
AcknowledgmentThe authors wish to thank Katya Druzhinina of PE Interna-
tional for helping us build the Ingeo ecoprofile model in Gabi6.3and Thilo Kupfer for his critical review.
Author Disclosure StatementNo competing financial interests exist.
R E F E R E N C E S
1. Vink ETH, Rabago KR, Glassner DA, Gruber PR. Applications of life cycleassessment to NatureWorksTM polylactide (PLA) production. PolymerDegradation and Stability 2003;80:403–419.
2. Vink ETH, Glassner DA, Kolstad JJ, et al. The eco-profiles for current and nearfuture NatureWorks� polylactide (PLA) production. Ind Biotechnol2007;3(1)1:58–81.
3. Vink ETH, Davies S, Kolstad JJ. The eco-profile for current Ingeo� polylactideproduction. Ind Biotechnol 2010;(6):212–224.
4. Narayan R. Carbon footprint of bioplastics using biocarbon content analysisand life cycle assessment. MRS Bulletin 2011;36:716–721.
5. National Oceanic & Atmospheric Administration. Earth System ResearchLaboratory, Global Monitoring Division. Available at: http://esrl.noaa.gov/gmd/ccgg/trends (Last accessed May 2015).
6. Narayan R. Why bio-based? What are the compelling reasons to increase theproportion of biobased products in your inventory? Presentation at BioproductsWorld, October 7, 2014, Columbus, OH.
7. Kupfer T. 2014. Life cycle assessment dataset US: Ingeo 2010 biopolymerproduction Blair Critical Review. PE International. Available at:www.natureworksllc.com/The-Ingeo-Journey/Eco-Profile-and-LCA/Eco-Profile(Last accessed June 2015).
8. Vink ETH, Hettenhaus JR, Dale BE, et al. The life cycle of NatureWorks�
polylactide corn production inventory data and corn production eco-profile.NatureWorks LLC, 2004 (Unpublished study).
9. National Corn Growers Association. 2015. World of Corn 2015. Available at:www.worldofcorn.com (Last accessed May 2015).
10. Vink ETH, Hettenhaus JR, O’Connor RP, et al. The life cycle of NatureWorks�
polylactide, The production of dextrose via corn wet milling. NatureWorks LLC,2006 (Unpublished study).
11. Veldhouse J, Suominen P, Beacom D, et al. The commercialization of a low pHlactic acid fermentation process: Lessons learned and looking forward tocellulosic products. Presentation at Society of Industrial Microbiology-RAFT VIII.San Diego, CA, November 2009. Available at: http://sim.confex.com/sim/raft8/techprogram/P13192.HTM (Last accessed May 2015).
12. Suominen P, Beacom D, McMullin T, et al. Development of a robust yeastbiocatalyst for low pH lactic acid and cellulosic ethanol fermentation.Presentation at 31st Symposium on Biotechnology for Fuels and Chemicals,Society of Industrial Microbiology. San Fransisco, CA, May 2009. Available at:http://simhq.org/meetings/sbfc2009/program/09SBFC-oralabstracts.pdf (Lastaccessed May 2015).
13. McMullin T. Biotechnology to the bottom line-low pH lactic acidproduction at commercial scale. Presentation at Society of IndustrialMicrobiology Annual Meeting and Exhibition, Toronto, Canada, July 2009.Available at: http://sim.confex.com/sim/2009/techprogram/P12883.HTM (Lastaccessed May 2015).
INGEO POLYLACTIDE PRODUCTION
VOL. 11 NO. 3 � JUNE 2015 INDUSTRIAL BIOTECHNOLOGY 179
14. Gruber P, O’Brien M. Polylactides NatureWorksTM PLA. In: Doi Y, Steinbuchel A,eds. Biopolymers in 10 Volumes, Volume 4, Polyesters III, Applications andCommercial Products. Weinheim: Wiley-VCH, 2002:235–249.
15. NatureWorks LLC. 2014. Making Ingeo: Eco-Profile & LCA. Available at: http://natureworksllc.com/The-Ingeo-Journey/Eco-Profile-and-LCA (Last accessedMay 2015).
16. Pawelzik P, Carus M, Hotchkiss J, et al. Critical aspects in the life cycleassessment (LCA) of bio-based materials—Reviewing methodologies andderiving recommendations. Resour Conserv Recycl 2013;73:211–228.
17. Carus M. Agricultural resources for bioplastics. Bioplastics Magazine 2011;6:44–46.
18. European Bioplastics. Bioplastics Facts and Figures. Available at: http://european-bioplastics.org (Last accessed May 2015).
19. PlasticsEurope. Eco-profiles. Available at: http://lca.plasticseurope.org (Lastaccessed May 2015).
20. Franklin Associates. 2011. Cradle-to-Gate life cycle inventory of nine plasticresins and four polyurethane precursors. Available at: http://plastics.americanchemistry.com/LifeCycle-Inventory-of-9-Plastics-Resins-and-4-Polyurethane-Precursors-Rpt-Only (Last accessed May 2015).
Address correspondence to:Erwin T.H. Vink
NatureWorks B.V.P.O. Box 5528
1410EA Naarden, The NetherlandsPhone: 31 1 1431 5944
E-mail: [email protected]
VINK AND DAVIES
180 INDUSTRIAL BIOTECHNOLOGY JUNE 2015