Embed Size (px)
Citation preview

energies
Article
Life Cycle Assessment and Techno-Economic Analysisof Pressure Sensitive Bio-Adhesive Production
Minliang Yang and Kurt A. Rosentrater *
Department of Agricultural and Biosystems Engineering, Iowa State University, Ames, IA 50011, USA;[email protected]* Correspondence: [email protected]
Received: 9 August 2019; Accepted: 19 November 2019; Published: 27 November 2019�����������������
Abstract: Bioproducts have attracted much attention in recent years due to the increasingenvironmental concerns about petroleum products. In this study, we aimed to explore potentialenvironmental impacts and economic feasibility of pressure sensitive bio-adhesive (PSA) producedfrom the reversible addition-fragmentation chain transfer polymerization process. A detail processmodel of pressure sensitive bio-adhesive was developed in order to thoroughly understand botheconomic and environmental impacts of this production process. Life cycle assessment resultsshowed that the overall environmental impacts of bio-adhesive was ~30% lower compared tothe petro-adhesive’s production process. The minimum selling price for this pressure sensitivebio-adhesive was calculated as $3.48/kg. Sensitivity analysis results indicated that raw materials costshad the most significant impact on pressure sensitive bio-adhesive’s selling price, followed bytotal capital investment. Electricity sources had larger environmental impacts to the overallbio-adhesive production process compared to transportation distance and product yield. These resultshighlight the environmental advantage and potential economic competency of this pressure sensitivebio-based adhesive.
Keywords: sustainability; environmental impacts; economics; bio-based adhesives
1. Introduction
Fossil fuel plays a key role in current chemical industry due to its capability to produce varietiesof raw materials for industrial manufacturing through petroleum refining process [1]. According to theU.S. Environmental Protection Agency (U.S. EPA), 65% of the global greenhouse gas (GHG) emissioncome from CO2; among which fossil fuel consumption is the primary source of CO2 [2]. Therefore,numerous efforts have been made to reduce the dependency on fossil fuel. Adhesives are one of thematerials that can be produced from chemicals derived from petroleum refineries [3]. As estimatedby Research and Markets, the worldwide adhesive market will reach U.S. $53.3 billion by 2022 [4].Environmental-friendly and sustainable bio-adhesives are needed to meet the demand of the growingglobal adhesive market.
A widely applied adhesive known as pressure sensitive adhesive (PSA) is able to bond materialson their surface by applying pressure [5]. PSA has been used in many areas, such as packaging tapes,automotive, electricity and medical industries [6]. The demand of PSA has increased rapidly over thelast decade. Based on the survey from Statistics Market Research Consulting (MRC), PSA market isestimated to reach U.S. $13.63 billion by 2023 [7].
The reversible addition-fragmentation chain transfer (RAFT) polymerization process was exploredin this study to produce polymers due to its convenience and flexibility [8]. Environmental-friendlysolvents such as water-based solvent and ionic liquids can be used to conduct the RAFT polymerizationprocess [9,10]. Additionally, renewable resources can also be polymerized through the RAFT
Energies 2019, 12, 4502; doi:10.3390/en12234502 www.mdpi.com/journal/energies

Energies 2019, 12, 4502 2 of 14
polymerization process to produce bio-polymers [11]. In 2013, Cochran et al. used plant oil and animaloil to produce thermoplastic homopolymers and block copolymers via the RAFT polymerizationprocess [12]. Gallagher et al. further developed the characteristics of PSA using acrylic triblockcopolymer (prepared from the RAFT polymerization process) and they reported higher peel force,tack force and no failure time up to 10,000 minutes [13]. Glycerol-based polymers produced through theRAFT polymerization process seem to offer better properties than petro-based polymers due to the highamount of hydroxyl groups, which can provide opportunities to meet various needs [14]. These productsare currently being deployed commercially, and there is still ongoing work focusing on optimization ofthe glycerol-based PSA production process so that it can be commercially successful. A key componentto successful commercialization is developing processes that have lower environmental and costimpacts compared to traditional manufacturing methods and substrates.
In this study, the environmental impact of this PSA production process was quantified by life cycleassessment (LCA) and economic feasibility of this process was evaluated by techno-economic analysis(TEA). LCA has been used to evaluate the environmental impacts associated with all the stages of aproduct’s life from cradle to grave since the 1960s [15]. Initial LCA results can provide decision makerskey information about potential environmental impacts from the process, and can aid in processdevelopment choices. Typically, there are four steps in an LCA study. The first step is to define goaland scope of the study, including determining system boundary and functional unit (FU). The next stepis to compile the input and output data within the system boundary, also known as inventory analysis.After that, impact assessment is conducted by choosing a proper impact assessment method to categorizeemissions for quantify environmental impacts’ calculation. Last but not least, an interpretation stepis needed to interpret the results from the previous steps [16]. Environmental impact assessmenthas been conducted in formaldehyde-based adhesive extensively, [17–19]; however, little has beendone regarding the PSA. A TEA study requires technical parameters to conduct mass and energybalance of the production process, and then economic factors need to be considered to assess theeconomic feasibility of the process [20]. TEA has been widely applied in the area of renewableenergy [21–24]. In the field of adhesives, Yang and Rosentrater compared the economic feasibility ofstructural bioadhesive relative to petro-based adhesive [25]; yet, little has been done for PSA.
The main objectives of this study were to evaluate environmental impacts and the economicfeasibility of PSA from the RAFT polymerization process, in order to help guide commercializationefforts. A detailed process model was developed (based on laboratory and pilot-scale data) to exploreboth environmental impacts and production costs associated with this process. Glycerol was the mostimportant raw material to produce monomers which can be further used in polymerization process;its sources are also compared in both LCA and TEA models. Sensitivity analyses were conductedto determine the most sensitive parameters in terms of the unit production price ($/kg), as well asGHG emissions.
2. Methods
2.1. Life Cycle Assessment
2.1.1. Goal and Scope Definition
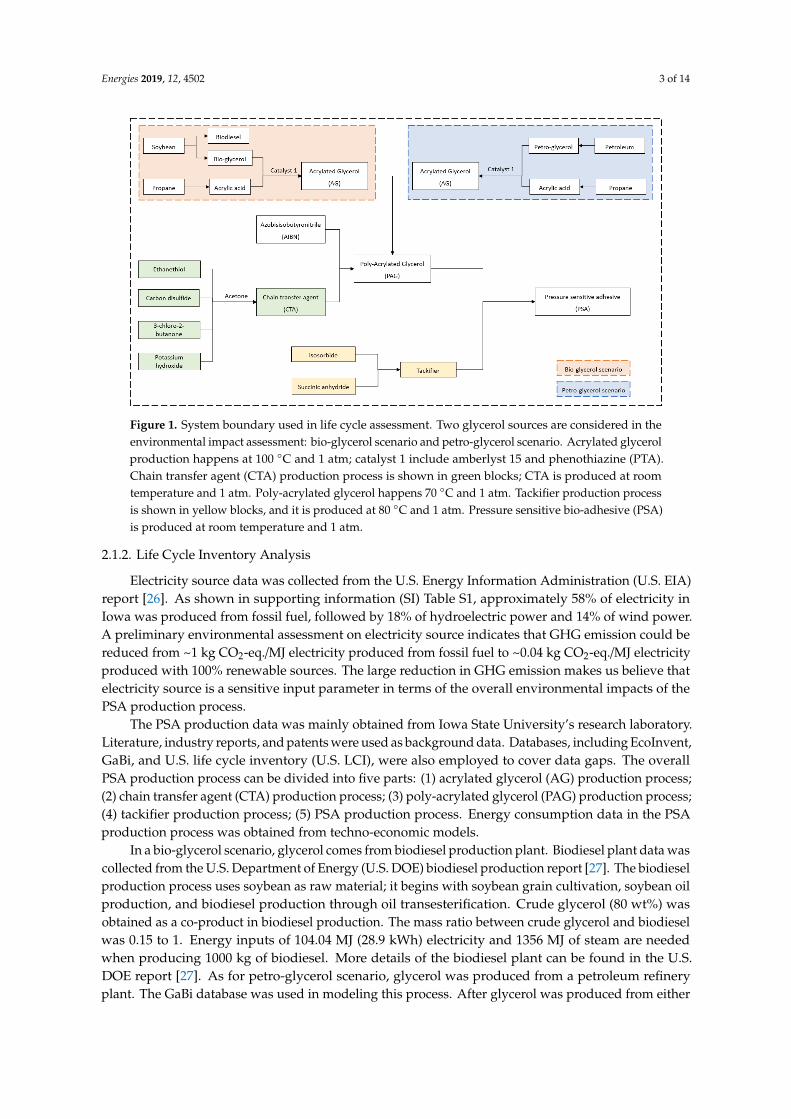
In this study, we conducted cradle to gate LCA with two glycerol sources as shown in Figure 1.Bio-glycerol scenario means that glycerol comes from the biodiesel plant, while the petro-glycerolscenario refers to the origin of glycerol was the petroleum refinery plant. The PSA production plantwas assumed to be located in central Iowa, U.S. A diesel-powered truck was used as the transportationvehicle and transportation distance of raw materials to the production plant was set to be 80.5 km(50 miles). The system boundary starts from raw material extraction, truck transportation to thePSA production plant, monomer production, polymer production, and PSA production in the plant.The functional unit (FU) used in this study was 1 kg of PSA produced.
Energies 2019, 12, 4502 3 of 14
Energies 2019, 10, x FOR PEER REVIEW 3 of 14
transportation to the PSA production plant, monomer production, polymer production, and PSA production in the plant. The functional unit (FU) used in this study was 1 kg of PSA produced.
Figure 1. System boundary used in life cycle assessment. Two glycerol sources are considered in the environmental impact assessment: bio-glycerol scenario and petro-glycerol scenario. Acrylated glycerol production happens at 100 °C and 1 atm; catalyst 1 include amberlyst 15 and phenothiazine (PTA). Chain transfer agent (CTA) production process is shown in green blocks; CTA is produced at room temperature and 1 atm. Poly-acrylated glycerol happens 70 °C and 1 atm. Tackifier production process is shown in yellow blocks, and it is produced at 80 °C and 1 atm. Pressure sensitive bio-adhesive (PSA) is produced at room temperature and 1 atm.
2.1.2. Life Cycle Inventory Analysis
Electricity source data was collected from the U.S. Energy Information Administration (U.S. EIA) report [26]. As shown in supporting information (SI) Table S1, approximately 58% of electricity in Iowa was produced from fossil fuel, followed by 18% of hydroelectric power and 14% of wind power. A preliminary environmental assessment on electricity source indicates that GHG emission could be reduced from ~1 kg CO2-eq./MJ electricity produced from fossil fuel to ~0.04 kg CO2-eq./MJ electricity produced with 100% renewable sources. The large reduction in GHG emission makes us believe that electricity source is a sensitive input parameter in terms of the overall environmental impacts of the PSA production process.
The PSA production data was mainly obtained from Iowa State University’s research laboratory. Literature, industry reports, and patents were used as background data. Databases, including EcoInvent, GaBi, and U.S. life cycle inventory (U.S. LCI), were also employed to cover data gaps. The overall PSA production process can be divided into five parts: (1) acrylated glycerol (AG) production process; (2) chain transfer agent (CTA) production process; (3) poly-acrylated glycerol (PAG) production process; (4) tackifier production process; (5) PSA production process. Energy consumption data in the PSA production process was obtained from techno-economic models.
In a bio-glycerol scenario, glycerol comes from biodiesel production plant. Biodiesel plant data was collected from the U.S. Department of Energy (U.S. DOE) biodiesel production report [27]. The biodiesel production process uses soybean as raw material; it begins with soybean grain cultivation, soybean oil production, and biodiesel production through oil transesterification. Crude glycerol (80 wt%) was obtained as a co-product in biodiesel production. The mass ratio between crude glycerol and biodiesel was 0.15 to 1. Energy inputs of 104.04 MJ (28.9 kWh) electricity and 1356 MJ of steam are needed when producing 1000 kg of biodiesel. More details of the biodiesel plant can be found in the U.S. DOE report [27]. As for petro-glycerol scenario, glycerol was produced from a petroleum refinery plant. The GaBi database was used in modeling this process. After glycerol was produced
Figure 1. System boundary used in life cycle assessment. Two glycerol sources are considered in theenvironmental impact assessment: bio-glycerol scenario and petro-glycerol scenario. Acrylated glycerolproduction happens at 100 ◦C and 1 atm; catalyst 1 include amberlyst 15 and phenothiazine (PTA).Chain transfer agent (CTA) production process is shown in green blocks; CTA is produced at roomtemperature and 1 atm. Poly-acrylated glycerol happens 70 ◦C and 1 atm. Tackifier production processis shown in yellow blocks, and it is produced at 80 ◦C and 1 atm. Pressure sensitive bio-adhesive (PSA)is produced at room temperature and 1 atm.
2.1.2. Life Cycle Inventory Analysis
Electricity source data was collected from the U.S. Energy Information Administration (U.S. EIA)report [26]. As shown in supporting information (SI) Table S1, approximately 58% of electricity inIowa was produced from fossil fuel, followed by 18% of hydroelectric power and 14% of wind power.A preliminary environmental assessment on electricity source indicates that GHG emission could bereduced from ~1 kg CO2-eq./MJ electricity produced from fossil fuel to ~0.04 kg CO2-eq./MJ electricityproduced with 100% renewable sources. The large reduction in GHG emission makes us believe thatelectricity source is a sensitive input parameter in terms of the overall environmental impacts of thePSA production process.
The PSA production data was mainly obtained from Iowa State University’s research laboratory.Literature, industry reports, and patents were used as background data. Databases, including EcoInvent,GaBi, and U.S. life cycle inventory (U.S. LCI), were also employed to cover data gaps. The overallPSA production process can be divided into five parts: (1) acrylated glycerol (AG) production process;(2) chain transfer agent (CTA) production process; (3) poly-acrylated glycerol (PAG) production process;(4) tackifier production process; (5) PSA production process. Energy consumption data in the PSAproduction process was obtained from techno-economic models.
In a bio-glycerol scenario, glycerol comes from biodiesel production plant. Biodiesel plant data wascollected from the U.S. Department of Energy (U.S. DOE) biodiesel production report [27]. The biodieselproduction process uses soybean as raw material; it begins with soybean grain cultivation, soybean oilproduction, and biodiesel production through oil transesterification. Crude glycerol (80 wt%) wasobtained as a co-product in biodiesel production. The mass ratio between crude glycerol and biodieselwas 0.15 to 1. Energy inputs of 104.04 MJ (28.9 kWh) electricity and 1356 MJ of steam are neededwhen producing 1000 kg of biodiesel. More details of the biodiesel plant can be found in the U.S.DOE report [27]. As for petro-glycerol scenario, glycerol was produced from a petroleum refineryplant. The GaBi database was used in modeling this process. After glycerol was produced from either

Energies 2019, 12, 4502 4 of 14
a biodiesel plant or a petroleum refinery plant, acrylic acid along with catalysts (amberlyst 15 andphenothiazine) were added to produce acrylated glycerol (AG) at 100 ◦C for 5 hours.
A chain transfer agent (CTA) or a RAFT agent was a key chemical in the RAFT polymerizationprocess. Ethanethiol was reacted with potassium hydroxide for 30 minutes; carbon disulfide wasfurther added to react with the neutralized solution for another 30 minutes; then, 3-chloro-2-butanonewas added to produce the CTA under room temperature. Buffer solutions, such as acetone, are neededduring CTA production processing; its recycle rate was set to be 97%, as suggested by otherresearchers (obviously higher is better, but 97% is a conservative estimate that can account forpotential leaks and losses). As soon as AG and CTA are obtained, they react at 70 ◦C for 4 hoursalong with azobisisobutyronitrile (AIBN) to produce poly-acrylated glycerol (PAG) with molar mass of10,000 g/mole. Afterwards, isosorbide and succinic anhydride with molar ratio of 1 to 2.2 are employedto produce tackifier at 80 ◦C for 2 hours. Once PAG and tackifier are ready, PSA was produced bymixing PAG and tackifier, with 4, 4′-azobis acting as an initiator. Main inventory data are summarizedin Table 1.
Table 1. Main inventory data of pressure sensitive bio-adhesive (PSA) production process.
Parameter Unit Data GHG Emission Factor
Input
Glycerol kg 0.63 1.28 kg CO2-eq/kg
Acrylic acid kg 0.49 1.37 kg CO2-eq/kg
Acetone kg 0.10 1.61 kg CO2-eq/kg
Ethanethiol kg 0.13 2.35 kg CO2-eq/kg
Carbon disulfide kg 0.31 1.47 kg CO2-eq/kg
3-Chloro-2-butanone kg 0.43 0.97 kg CO2-eq/kg
Potassium hydroxide kg 0.13 1.68 kg CO2-eq/kg
AIBN kg 2.46 × 10⁻⁵ 4.79 kg CO2-eq/kg
Succinic hydride kg 0.02 0.45 kg CO2-eq/kg
Isosorbide kg 0.01 3.01 kg CO2-eq/kg
Transportation distance km 80.5 3.20 × 10⁻⁵ kgCO2-eq/(kg × km)
Output
PSA kg 1
Potassium chloride kg 0.286
2.1.3. Life Cycle Impact Assessment
In the LCA study, we chose two different life cycle impact assessment methods: the U.S. EPA’sTool for the Reduction and Assessment of Chemicals and Other Environmental Impacts (TRACI)and EcoIndicator 99 (EI 99). TRACI is a mid-point impact assessment method, which considers thecause-effect chain of a particular impact category [28]. The impact categories in TRACI version 2.1include global warming potential (GWP) to calculate GHG relative to CO2, acidification potential (AP)to assess the increasing hydrogen ion (H+) concentration, eutrophication potential (EP) to measure theenrichment of an aquatic ecosystem with nutrients such as P and N, ozone depletion potential (ODP)to calculate the relative importance of substances that contribute to the breakdown of the ozone layer,human health cancer and noncancer, and photochemical smog formation [29]. EI 99 is an end-pointassessment method, which includes human health, resource, and ecosystem impacts, happens asa result of impact indicators usually addressed in a mid-point approach [28]. This could be more

Energies 2019, 12, 4502 5 of 14
understandable to decision makers, since it evaluates the environmental impacts at the end-point leveland it is usually expressed in one single score of the overall environmental impacts [30].
2.2. Techno-Economic Analysis
The PSA production plant was modeled in SuperPro Designer v9.5 software (Intelligen Inc.,Cambridge, Massachusetts, USA) at five various plant scales: 1 t/d, 2 t/d, 5 t/d, 10 t/d, and 40 t/d. In thisTEA study, we assume online time of the PSA production plant was 329 days per year (7896 hours peryear), thus, 40 t/d was selected as the upper bound of the plant size since a commercial resin plant hasa capacity of 10,000–15,000 tons per year [31]. Figure 2 exhibits the PSA production plant used in thetechno-economic analysis. Bio-glycerol scenario as defined in life cycle assessment was modeled in theTEA study as the base case scenario. PSA production process was the same as described in life cycleinventory analysis. Mass and energy balance are performed in SuperPro Designer.
Energies 2019, 10, x FOR PEER REVIEW 5 of 14
per year), thus, 40 t/d was selected as the upper bound of the plant size since a commercial resin plant has a capacity of 10,000–15,000 tons per year [31]. Figure 2 exhibits the PSA production plant used in the techno-economic analysis. Bio-glycerol scenario as defined in life cycle assessment was modeled in the TEA study as the base case scenario. PSA production process was the same as described in life cycle inventory analysis. Mass and energy balance are performed in SuperPro Designer.
Figure 2. Design block flow diagram of PSA production plant. Catalyst 1 included amberlyst 15 and phenothiazine (PTA). Acrylated glycerol (AG) production process is highlighted in blue block. Chain transfer agent (CTA) production process is highlighted in green block. The tackifier production process is highlighted in yellow block.
2.3. Total Capital Investment (CTCI) Analysis
Total capital investment (CTCI) was the sum of direct fixed capital cost (CDFC), working capital (CW), and start-up and validation cost (CS). In direct fixed capital category, equipment purchase cost, piping, instrumentation, insulation, electrical facilities, building, installation, yard improvement, land, engineering, construction, contingency, and contractor’s fee are considered. Equipment purchase cost was obtained directly from SuperPro Designer database. Others were calculated based on different factors of either purchase cost or direct cost [32]. Working capital, which refers to the money invested in making a plant into productive operation, was assumed to be 15% of direct fixed capital cost (CDFC) [33]. Start-up and validation cost was set to be 10% of direct fixed capital cost (CDFC) used to make the transition from construction to operation [34]. Detail assumptions of total capital cost (CTCI) are listed in SI Table S2.
2.4. Annual Operating Cost (CAOC) Analysis
Annual operating cost (CAOC) includes material cost (CM), utility cost (CU), labor cost (CL), and facilities cost (CF). Detail assumptions used in obtaining these costs are listed in SI Table S3. Material costs are mainly obtained from retailer websites, as listed in sources. We found that the price of glycerol from vegetable oil was $1.04/kg, but this can be dramatically reduced to $0.20/kg if obtained from crude oil [35]. Electricity price was $0.05/kWh as collected from the U.S. EIA electric power monthly report [36]. Steam, process water, and other utilities costs were gathered directly from SuperPro Designer database. Labor cost, excluding supervisory cost, was set at 20% of annual operating cost (CAOC). Straight-line depreciation method was used in this study; the recovery period was 9.5 years for the manufacture of chemicals and allied products as specified by the U.S. Internal Revenue Service (U.S. IRS) [37]. The salvage value of the equipment was assumed to be zero as often used in depreciation evaluation [38]. Waste treatment process and distribution and marketing costs
Figure 2. Design block flow diagram of PSA production plant. Catalyst 1 included amberlyst15 and phenothiazine (PTA). Acrylated glycerol (AG) production process is highlighted in blue block.Chain transfer agent (CTA) production process is highlighted in green block. The tackifier productionprocess is highlighted in yellow block.
2.3. Total Capital Investment (CTCI) Analysis
Total capital investment (CTCI) was the sum of direct fixed capital cost (CDFC), working capital(CW), and start-up and validation cost (CS). In direct fixed capital category, equipment purchase cost,piping, instrumentation, insulation, electrical facilities, building, installation, yard improvement, land,engineering, construction, contingency, and contractor’s fee are considered. Equipment purchase costwas obtained directly from SuperPro Designer database. Others were calculated based on differentfactors of either purchase cost or direct cost [32]. Working capital, which refers to the money invested inmaking a plant into productive operation, was assumed to be 15% of direct fixed capital cost (CDFC) [33].Start-up and validation cost was set to be 10% of direct fixed capital cost (CDFC) used to make thetransition from construction to operation [34]. Detail assumptions of total capital cost (CTCI) are listedin SI Table S2.
2.4. Annual Operating Cost (CAOC) Analysis
Annual operating cost (CAOC) includes material cost (CM), utility cost (CU), labor cost (CL),and facilities cost (CF). Detail assumptions used in obtaining these costs are listed in SI Table S3.Material costs are mainly obtained from retailer websites, as listed in sources. We found that the

Energies 2019, 12, 4502 6 of 14
price of glycerol from vegetable oil was $1.04/kg, but this can be dramatically reduced to $0.20/kg ifobtained from crude oil [35]. Electricity price was $0.05/kWh as collected from the U.S. EIA electricpower monthly report [36]. Steam, process water, and other utilities costs were gathered directlyfrom SuperPro Designer database. Labor cost, excluding supervisory cost, was set at 20% of annualoperating cost (CAOC). Straight-line depreciation method was used in this study; the recovery periodwas 9.5 years for the manufacture of chemicals and allied products as specified by the U.S. InternalRevenue Service (U.S. IRS) [37]. The salvage value of the equipment was assumed to be zero asoften used in depreciation evaluation [38]. Waste treatment process and distribution and marketingcosts were not considered due to insufficient data. Other assumptions, such as property insurance,local taxes, and plant overhead cost, were obtained from Peters et al. [32].
2.5. Profitability Analysis
Several economic parameters were used in the profitability analysis. Gross profit ($) measuresthe profit the PSA plant makes after deducting the costs required to make it (Equation (1)) [39]. It canhelp you decide whether you need to reduce operating cost or to increase PSA selling price. Net profit($) is the amount obtained after annual gross profit subtracting annual local taxes and adding annualdepreciation (Equation (2)) [32]. Depending on gross profit and net profit, we can evaluate the financialhealth of the PSA plant. Unit production cost ($/kg) is the total capital investment divided by referenceflow, such as the amount of PSA produced per year (Equation (3)). Payback period (in years) is thetime needed to recover total capital investment (Equation (4)) [38]. Net present value (NPV) is thedifference between cash inflows and cash outflows (Equation (5)) [40]:
Gross profit = Revenues−CAOC (1)
Net profit = Gross Profit− Taxes + Depreciation (2)
Unit production cos t =Total capial investment
Reference flow(3)
Payback period =Total capial investment
Net profit(4)
Net present value =t∑1
Ct(Net cash flow at year t)
(1 + discount rate)t −C0(net cash flow at year 0) (5)
2.6. Discounted Cash Flow Analysis
Discounted cash flow analysis was carried out by considering the time value of money to determinethe minimum bio-adhesive selling price (MSP). The MSP was the price that makes the net present valueequal zero when other factors are kept constant [41]. The discount rate was set as 10%, commonly-usedas reported in the literature [42,43]. The plant life was assumed to be 15 years and we assume this PSAplant was 100% equity financed. The construction time of the PSA plant was assumed to be 24 months,and the start-up time was assumed to be 6 months. The federal income tax rate was 40% [44]. All costswere reported in 2016 U.S. dollar in this study.
2.7. Sensitivity Analyses
One way to investigate uncertainty associated with the product value due to input variablevariation is by using a sensitivity analysis [45] In the environmental impact assessment, electricity source,transportation distance and product yield are chosen based on their potential impact on GHG emission,represented by GWP result. Electricity source in the base case scenario was ~60% of fossil fuel; due tothe large reduction in GHG emission by replacing electricity from renewables, sensitivity analysis onelectricity sources (fossil fuel or renewable fuel) were investigated. GHG emission was reported toincrease ~35% with a 50% increase in transportation distance for a centralized biorefinery plant [46];

Energies 2019, 12, 4502 7 of 14
thus, it has the potential to be a sensitive input as well. Product yield was selected due to the uncertaintyassociated with the production process itself. In the economic feasibility analysis, we explored thesensitivity of non-operating parameters on unit production cost. For instance, the impacts of rawmaterials costs and labor cost are explored within ±10%; the impact of working capital and projectcontingency reflected through total capital investment varies between −30% to 50% [47].
3. Results and Discussion
3.1. Life Cycle Assessment (LCA) Results
Life cycle assessment using TRACI impact assessment method results are shown in Table 2.TRACI assessment results imply that in general, bio-glycerol scenario has lower environmental impactsthan petro-glycerol scenario across all impact categories. Global warming potential (GWP) impact perkg PSA produced in bio-glycerol scenario was 3.8 kg CO2-eq., ~40% lower than petro-glycerol scenario.The largest contributor to GWP was from the RAFT polymerization process, which accounts for nearly50%. Even though lower GWP was obtained (1.6 kg CO2-eq. per kg melamine-urea-formaldehydeproduced) on other adhesive, the production process of formaldehyde-based adhesive is less complexthan the PSA investigated in this study [17]. Compared with other biopolymers, the product in ourstudy actually has lower GWP [48]. Acidification potential (AP) impact per kg PSA produced inboth scenarios are similar (1.26 kg H+ moles-eq. in bio-glycerol scenario and 1.34 kg H+ moles-eq.in petro-glycerol scenario), indicating the increasing H+ concentration in bio-glycerol scenario wasbasically the same as in petro-glycerol scenario. Eutrophication potential (EP) impact per kg PSAproduce in bio-glycerol scenario was higher than in petro-glycerol scenario, meaning more N and Pare produced in bio-glycerol scenario. As expected, the RAFT polymerization contributes the most tothe EP. Kim and Dale had similar findings, in that bio-based polymer offered better environmentalperformance than petro-based polymer, excluding eutrophication [49]. The largest difference betweenbio-glycerol scenario and petro-glycerol scenario comes from the ozone depletion potential (ODP)impact. Nearly three-fold more emission was observed in the petro-glycerol scenario than in thebio-glycerol scenario, which implies bio-glycerol pathway is more sustainable than petroleum refineryprocess. In terms of the impacts to human health, the results show that no difference was observed incancer air impact between the two scenarios, and a slightly higher smog air impact in the petro-glycerolscenario. These results indicate bio-glycerol based PSA is more beneficial to human beings thanpetro-glycerol based PSA.
Table 2. Life cycle assessment results of bio-glycerol scenario and petro-glycerol scenario.
Impact Category Bio-Glycerol Scenario Petro-Glycerol Scenario
TRACI global warming (kg CO2-eq./FUa) 3.8 6.1TRACI acidification (kg H+ moles-eq./FU) 1.3 1.3
TRACI eutrophication (kg N-eq./FU) 1.4 × 10⁻³ 1.1 × 10⁻³
TRACI ozone depletion (kg CFC 11-eq./FU) 2.0 × 10⁻¹¹ 8.9 × 10⁻¹¹
TRACI smog air (kg O3-eq./FU) 0.2 0.3TRACI human health particulate air (kg PM 2.5-eq./FU) 1.2 × 10⁻³ 1.4 × 10⁻³
TRACI human health, cancer air (CTUb/FU) 1.1 × 10⁻⁹ 1.1 × 10⁻⁹
FUa: functional unit (1 kg of PSA produced as defined in Materials). CTUb: comparative toxicity unit.
Figure 3 shows the overall environmental impacts of the bio-glycerol scenario and petro-glycerolscenario by EI 99 impact method. In accordance with TRACI results, the petro-glycerol scenario has ahigher environmental impact score (3.8 points per kg of PSA produced) than the bio-glycerol scenario(2.2 points per kg of PSA produced) for all three impact categories. Ecosystem quality impact of EI 99 inthe bio-glycerol scenario was 0.2 points per kg of PSA produced lower than the petro-glycerol scenario.Ecosystem quality impact include damages caused by acidification, eutrophication, land occupationand ecotoxicity [30]. As indicated by the TRACI results, most of these subcategories (AP and EP)

Energies 2019, 12, 4502 8 of 14
have lower score in the bio-glycerol scenario. Human health impact contains carcinogenic effects,respiratory effects, damage caused by climate change, and damage caused by ozone layer depletion [30].As with ecosystem quality impact, the direct impact from those subcategories (GWP, ODP, human health,and smog air) are lower in the bio-glycerol scenario, which explains why the human health impact ofEI 99 was 0.3 points per kg of PSA produced lower than the petro-glycerol scenario. Resources impactof EI 99 has the largest difference between the bio-glycerol scenario (0.9 points per kg of PSA produced)and the petro-glycerol scenario (2.0 points per kg of PSA produced). The resources impact is composedof damages caused by extraction of minerals and extraction of fossil fuels [30]. The petro-glycerolscenario requires more energy (116 MJ per kg of PSA produced) than the bio-glycerol scenario (85 MJper kg of PSA produced). In the bio-glycerol scenario, ~40% of the energy was needed in bio-glycerolproduction or biodiesel plant; in the petro-glycerol scenario, ~55% of the energy was required inglycerol production or petroleum refinery process. The higher consumption in petro-glycerol scenariolead to higher resources impact from the end-point impact assessment perspective. LCA results inour study are consistent with the previous study on environmental performance comparison betweenbio-based adhesive and petro-based adhesive. McDevitt and Grigsby reported that the throughout theentire life cycle, the overall environmental impact of the petro-based adhesive was ~22% higher thanthe bio-based adhesive [50].
Energies 2019, 10, x FOR PEER REVIEW 8 of 14
fuels [30]. The petro-glycerol scenario requires more energy (116 MJ per kg of PSA produced) than the bio-glycerol scenario (85 MJ per kg of PSA produced). In the bio-glycerol scenario, ~40% of the energy was needed in bio-glycerol production or biodiesel plant; in the petro-glycerol scenario, ~55% of the energy was required in glycerol production or petroleum refinery process. The higher consumption in petro-glycerol scenario lead to higher resources impact from the end-point impact assessment perspective. LCA results in our study are consistent with the previous study on environmental performance comparison between bio-based adhesive and petro-based adhesive. McDevitt and Grigsby reported that the throughout the entire life cycle, the overall environmental impact of the petro-based adhesive was ~22% higher than the bio-based adhesive [50].
Figure 3. Eco-Indicator 99 (EI 99) results of bio-glycerol scenario and petro-glycerol scenario. FU stands for functional unit. In this study, 1 kg of PSA produced was chosen as the FU.
Sensitivity analysis was conducted on electricity sources, production yield, and transportation distance to determine the most sensitive parameter in terms of global warming potential (GWP) impact of the bio-glycerol scenario throughout the PSA life cycle. As Figure 4 exhibits, electricity source has the largest influence on GWP per kg of PSA produced. In the bio-glycerol scenario, electricity was generated by 58% of fossil fuel, as shown in SI Table S1. By altering to electricity generated by total renewable source, GWP impact could be decreased to 2.1 kg CO2-eq. per kg of PSA produced. However, if electricity was generated by fossil fuel only, this number will jump to 5.3 kg CO2-eq. per kg of PSA produced. With the increasing adhesive market worldwide, total GWP impact will increase by orders of magnitude in this situation, which is obviously not a wise choice in pursuing sustainability. Product yield was also a sensitive parameter to GWP impact. Current bio-glycerol scenario assumes 100% conversion rate in polymerization process based on empirical results; it is possible that the product yield may decrease on a commercial scale. We found that when the product yield decreases to 90%, GWP impact may increase to 4.3 kg CO2-eq. per kg of PSA produced. This reduction was not as great as changing the electricity source, but it also highlights the necessity to maintain product yield. Surprisingly, changes in transportation distance results the least GWP impact differences. In the current bio-glycerol scenario, transportation distance was assumed to be 80.5 km (50 miles), which is basically within the state of Iowa. Increasing transportation distance to 805 km (500 miles) or 1609 km (1000 miles) only increased the GWP impact of 0.1 kg CO2-eq. per kg of PSA produced. Olukoya et al. proved that GHG emissions may have 0% increase when transportation distance increased by 50% from base case [46].
0.6 0.90.7
0.90.9
2.0
0.00.51.01.52.02.53.03.54.0
Bio-glycerin Petro-glycerin
EI 9
9 re
sults
(pt/
FU)
Human health Ecosystem quality Resources
Figure 3. Eco-Indicator 99 (EI 99) results of bio-glycerol scenario and petro-glycerol scenario. FU standsfor functional unit. In this study, 1 kg of PSA produced was chosen as the FU.
Sensitivity analysis was conducted on electricity sources, production yield, and transportationdistance to determine the most sensitive parameter in terms of global warming potential (GWP) impactof the bio-glycerol scenario throughout the PSA life cycle. As Figure 4 exhibits, electricity source hasthe largest influence on GWP per kg of PSA produced. In the bio-glycerol scenario, electricity wasgenerated by 58% of fossil fuel, as shown in SI Table S1. By altering to electricity generated bytotal renewable source, GWP impact could be decreased to 2.1 kg CO2-eq. per kg of PSA produced.However, if electricity was generated by fossil fuel only, this number will jump to 5.3 kg CO2-eq. perkg of PSA produced. With the increasing adhesive market worldwide, total GWP impact will increaseby orders of magnitude in this situation, which is obviously not a wise choice in pursuing sustainability.Product yield was also a sensitive parameter to GWP impact. Current bio-glycerol scenario assumes100% conversion rate in polymerization process based on empirical results; it is possible that theproduct yield may decrease on a commercial scale. We found that when the product yield decreasesto 90%, GWP impact may increase to 4.3 kg CO2-eq. per kg of PSA produced. This reduction wasnot as great as changing the electricity source, but it also highlights the necessity to maintain productyield. Surprisingly, changes in transportation distance results the least GWP impact differences. In thecurrent bio-glycerol scenario, transportation distance was assumed to be 80.5 km (50 miles), which isbasically within the state of Iowa. Increasing transportation distance to 805 km (500 miles) or 1609 km

Energies 2019, 12, 4502 9 of 14
(1000 miles) only increased the GWP impact of 0.1 kg CO2-eq. per kg of PSA produced. Olukoya et al.proved that GHG emissions may have 0% increase when transportation distance increased by 50%from base case [46].Energies 2019, 10, x FOR PEER REVIEW 9 of 14
Figure 4. Sensitivity analysis results on electricity source, product yield and transportation distance. GWP stands for global warming potential. FU stands for functional unit. In this study, 1 kg of PSA produced was used as the FU. Current refers to bio-glycerol scenario as defined in Materials.
3.2. Techno-Economic Analysis (TEA) Results
Figure 5 displays the breakdown of total capital investment and annual operating cost, along with unit production price obtained in five different bio-glycerol based PSA production plant scale. PSA plant with larger scale requires higher capital investment and higher operating cost as expected (SI Table S4). Total capital investment increases from $49 million of the 1 t/d PSA plant to $63 million of the 40 t/d PSA plant. Among the categories in total capital investment, direct cost was fundamental to other cost calculations. The smallest PSA plant requires ~$5 million in purchasing equipment, and the largest PSA plant needs ~$6 million in equipment. The difference in equipment purchase cost leads to the different total capital investment since other cost parameters are calculated based on factors of equipment purchase cost. Among all the equipment, we found that stirred reactors contributed the most to equipment purchase cost. This was largely because it was required in numerous steps, such as the neutralization process, purification process, polymer production process, and materials storage process. Annual operating cost increases dramatically from the smallest plant ($4 million) to the largest plant ($34 million). Materials cost contributes ~60% of the annual operating cost, which implies the PSA production plant was driven by materials more than any other category. Acrylated glycerol (AG) production process requires the highest materials cost since AG is the monomer in building PSA. Chain transfer agent (CTA) production process and tackifier production process requires less materials cost due to its small amount required in polymerization process. The RAFT polymerization process needs the least materials cost because most materials needed in this process were produced in the plant. Utility cost was quite small compared to materials cost mainly because this PSA production process does not require higher temperature as well as pressure, which are the main sources of utility consumption. Unit production cost ($/kg) of bio-glycerol based PSA plant is also shown in Figure 5. Increasing plant scales result in decreasing unit production price. Unit production cost decreases from $19.37/kg in the smallest plant to $2.76/kg in the 40 t/d PSA production plant. The trend line from the smallest plant to the largest one follows Equation (6) with R2 = 0.95:
Figure 4. Sensitivity analysis results on electricity source, product yield and transportation distance.GWP stands for global warming potential. FU stands for functional unit. In this study, 1 kg of PSAproduced was used as the FU. Current refers to bio-glycerol scenario as defined in Materials.
3.2. Techno-Economic Analysis (TEA) Results
Figure 5 displays the breakdown of total capital investment and annual operating cost, alongwith unit production price obtained in five different bio-glycerol based PSA production plant scale.PSA plant with larger scale requires higher capital investment and higher operating cost as expected(SI Table S4). Total capital investment increases from $49 million of the 1 t/d PSA plant to $63 million ofthe 40 t/d PSA plant. Among the categories in total capital investment, direct cost was fundamental toother cost calculations. The smallest PSA plant requires ~$5 million in purchasing equipment, and thelargest PSA plant needs ~$6 million in equipment. The difference in equipment purchase cost leads tothe different total capital investment since other cost parameters are calculated based on factors ofequipment purchase cost. Among all the equipment, we found that stirred reactors contributed themost to equipment purchase cost. This was largely because it was required in numerous steps, such asthe neutralization process, purification process, polymer production process, and materials storageprocess. Annual operating cost increases dramatically from the smallest plant ($4 million) to the largestplant ($34 million). Materials cost contributes ~60% of the annual operating cost, which implies thePSA production plant was driven by materials more than any other category. Acrylated glycerol (AG)production process requires the highest materials cost since AG is the monomer in building PSA.Chain transfer agent (CTA) production process and tackifier production process requires less materialscost due to its small amount required in polymerization process. The RAFT polymerization processneeds the least materials cost because most materials needed in this process were produced in theplant. Utility cost was quite small compared to materials cost mainly because this PSA productionprocess does not require higher temperature as well as pressure, which are the main sources of utility

Energies 2019, 12, 4502 10 of 14
consumption. Unit production cost ($/kg) of bio-glycerol based PSA plant is also shown in Figure 5.Increasing plant scales result in decreasing unit production price. Unit production cost decreases from$19.37/kg in the smallest plant to $2.76/kg in the 40 t/d PSA production plant. The trend line from thesmallest plant to the largest one follows Equation (6) with R2 = 0.95:
Unit production cos t = 16.62× Plant Scale−0.54 (6)
Energies 2019, 10, x FOR PEER REVIEW 10 of 14
Unit production cost = 16.62 Plant Scale . (6)
The lowest unit production cost obtained in this study was lower than that in the current marking price. This was because in this study, we only investigated gate-to-gate boundary in economic analysis; the whole TEA study stops when PSA is produced, hence, marketing, advertising and other miscellaneous are not considered. The unit production price calculated here was the merchant price.
Figure 5. Techno-economic analysis results of bio-glycerol based PSA plant with five different plant scales.
Cumulative discounted after-tax cash flow was conducted afterwards on the largest PSA production plant (40 t/d). In this study, the discount rate was set at 10% as the base case scenario. In this scenario, the minimum PSA selling price (MSP) was determined to be $3.48/kg, and the corresponding payback time was 9.2 years. Gross profit of this PSA production plant was ~$22 million per year, and net profit was ~$14 million per year. By decreasing discount rate to 5%, the MSP was $3.15/kg; the payback time reduces to ~4 years, and the NPV at the end of the plant was ~$40 million higher than the base case scenario. However, if discount rate increases to 15%, the payback time may be ~14 years, and the NPV decreases to less than $5 million. The MSP increases to $3.85/kg. Detail results are depicted in SI Figure S1.
Sensitivity analysis was further performed on the 40 t/d PSA production plant in terms of unit production price (Figure 6). Materials cost was the most sensitive factor to the unit production cost among all input variables. This corresponds to the previous discoveries in annual operating cost that materials cost was the driving force of the plant. By decomposing materials cost, we found that
Figure 5. Techno-economic analysis results of bio-glycerol based PSA plant with five differentplant scales.
The lowest unit production cost obtained in this study was lower than that in the current markingprice. This was because in this study, we only investigated gate-to-gate boundary in economicanalysis; the whole TEA study stops when PSA is produced, hence, marketing, advertising and othermiscellaneous are not considered. The unit production price calculated here was the merchant price.
Cumulative discounted after-tax cash flow was conducted afterwards on the largest PSAproduction plant (40 t/d). In this study, the discount rate was set at 10% as the base case scenario. In thisscenario, the minimum PSA selling price (MSP) was determined to be $3.48/kg, and the correspondingpayback time was 9.2 years. Gross profit of this PSA production plant was ~$22 million per year,and net profit was ~$14 million per year. By decreasing discount rate to 5%, the MSP was $3.15/kg;the payback time reduces to ~4 years, and the NPV at the end of the plant was ~$40 million higherthan the base case scenario. However, if discount rate increases to 15%, the payback time may be

Energies 2019, 12, 4502 11 of 14
~14 years, and the NPV decreases to less than $5 million. The MSP increases to $3.85/kg. Detail resultsare depicted in SI Figure S1.
Sensitivity analysis was further performed on the 40 t/d PSA production plant in terms of unitproduction price (Figure 6). Materials cost was the most sensitive factor to the unit production costamong all input variables. This corresponds to the previous discoveries in annual operating costthat materials cost was the driving force of the plant. By decomposing materials cost, we found thatglycerol price, acrylic acid price, 3-chloro-2-butanone price, and catalyst price were among the topmost sensitive factors. Glycerol price varied within ±10% in this sensitivity analysis in order to beconsistent with other raw materials; however, glycerol obtained in the petroleum refinery plant can beas low as $0.2/kg [35]; thus, the unit production price in this situation may be $2.11/kg. Even thoughobtaining glycerol from petroleum plant has more economic advantage, its associated environmentalimpact may increase ~35% compared to bio-glycerol source [27]. Total capital investment was thesecond parameter that had the largest influence on the unit production cost. Due to the contingencyof the TEA project, the unit production cost may vary between $2.64/kg to $2.97/kg. Labor cost wasanother sensitive factor in this study, which suggests that the unit production price may increase to$2.82/kg if we consider administrative cost, supervisory cost and other labor costs. However, all thesensitive parameters found in this study belongs to non-operating parameters. It is recommendedto include operating parameters in the future analysis to explore how operating condition changesmay impact the economics. In addition, since PSA can also be prepared from other polymerizationprocess such as photoiniferter polymerization, which has the ability to maintain the radical at a lowconcentration and ambient temperature [51], future TEA and LCA research could also focused onexploring the most sustainable polymerization process in PSA production.
Energies 2019, 10, x FOR PEER REVIEW 11 of 14
glycerol price, acrylic acid price, 3-chloro-2-butanone price, and catalyst price were among the top most sensitive factors. Glycerol price varied within ±10% in this sensitivity analysis in order to be consistent with other raw materials; however, glycerol obtained in the petroleum refinery plant can be as low as $0.2/kg [35]; thus, the unit production price in this situation may be $2.11/kg. Even though obtaining glycerol from petroleum plant has more economic advantage, its associated environmental impact may increase ~35% compared to bio-glycerol source [27]. Total capital investment was the second parameter that had the largest influence on the unit production cost. Due to the contingency of the TEA project, the unit production cost may vary between $2.64/kg to $2.97/kg. Labor cost was another sensitive factor in this study, which suggests that the unit production price may increase to $2.82/kg if we consider administrative cost, supervisory cost and other labor costs. However, all the sensitive parameters found in this study belongs to non-operating parameters. It is recommended to include operating parameters in the future analysis to explore how operating condition changes may impact the economics. In addition, since PSA can also be prepared from other polymerization process such as photoiniferter polymerization, which has the ability to maintain the radical at a low concentration and ambient temperature [51], future TEA and LCA research could also focused on exploring the most sustainable polymerization process in PSA production.
Figure 6. Sensitivity analysis of the 40 t/d PSA production plant.
4. Conclusions
In this study, the environmental impacts associated with pressure sensitive bio-adhesive (PSA) derived from the reversible addition-fragmentation chain transfer polymerization (RAFT) process was thoroughly investigated, as well as its economic feasibility with various PSA production plant scales. The results showed that by producing 1 kg of PSA, the global warming potential was estimated to be 3.84 kg CO2-eq. Compared with petro-glycerol, PSA produced from bio-glycerol has less environmental impact (40% lower). The lowest unit production price obtained in this study was $2.76/kg for a 40 t/d PSA production plant. Sensitivity analyses results suggested that electricity sources have large impacts on greenhouse gas emissions, while raw material cost was the most sensitive parameter with respect to product unit cost. In addition, based on cash flow analysis, it was found that this project should be pursued due to its positive internal rate of return. Given the uncertainty associated with the modeling parameters, however, we recommend that future analyses should be conducted to compare both environmental and economic performance of this PSA with that from other sources. This work has been conducted to help guide commercial deployment. Additional research into the RAFT process should be pursued, however, (i.e., beyond the scope of this study), including examination of potential byproducts, various methods for their reuse or repurposing, and then understanding how these additional processes might impact the LCA and TEA results from this study.
2.78
2.78
2.81
2.82
2.82
2.84
2.97
2.99
2.75
2.74
2.71
2.71
2.7
2.68
2.64
2.54
2.46 2.56 2.66 2.76 2.86 2.96 3.06
Working capital (-30%, 0, 50%)
Catalyst price (-10%, 0, 10%)
3-Chloro-2-butanone (-10%, 0, 10%)
Acrylic acid price (-10%, 0, 10%)
Labor cost (-10%, 0, 10%)
Glycerol price(-10%, 0, 10%)
Total capital investment (-30%, 0, 50%)
Materials cost(-10%, 0, 10%)
Unit production price ($/kg)
Figure 6. Sensitivity analysis of the 40 t/d PSA production plant.
4. Conclusions
In this study, the environmental impacts associated with pressure sensitive bio-adhesive (PSA)derived from the reversible addition-fragmentation chain transfer polymerization (RAFT) process wasthoroughly investigated, as well as its economic feasibility with various PSA production plant scales.The results showed that by producing 1 kg of PSA, the global warming potential was estimated to be3.84 kg CO2-eq. Compared with petro-glycerol, PSA produced from bio-glycerol has less environmentalimpact (40% lower). The lowest unit production price obtained in this study was $2.76/kg for a 40 t/dPSA production plant. Sensitivity analyses results suggested that electricity sources have large impactson greenhouse gas emissions, while raw material cost was the most sensitive parameter with respect toproduct unit cost. In addition, based on cash flow analysis, it was found that this project should bepursued due to its positive internal rate of return. Given the uncertainty associated with the modelingparameters, however, we recommend that future analyses should be conducted to compare both

Energies 2019, 12, 4502 12 of 14
environmental and economic performance of this PSA with that from other sources. This work hasbeen conducted to help guide commercial deployment. Additional research into the RAFT processshould be pursued, however, (i.e., beyond the scope of this study), including examination of potentialbyproducts, various methods for their reuse or repurposing, and then understanding how theseadditional processes might impact the LCA and TEA results from this study.
Supplementary Materials: The following are available online at http://www.mdpi.com/1996-1073/12/23/4502/s1.Table S1. Electricity sources in Iowa, 2016 (adapted from [26]). Table S2. Assumptions of total capital investment(CTCI) in the pressure sensitive bio-adhesive production plant. Table S3. Assumptions of annual operating cost(CAOC) in the pressure sensitive bio-adhesive production plant. Table S4. Techno-economic analysis results ofbio-glycerol based PSA plant with five different plant scales. Figure S1. Discounted cash flow results for the40 t/d PSA production plant at different discount rates. NPV: net present value. Moreover, the supplementarymaterials have used various references from the main paper, but references [52,53] were specifically cited in thesupplementary materials alone.
Author Contributions: M.Y. conducted the modeling and wrote the original manuscript. K.A.R. directed theresearch and edited the manuscript.
Funding: This study was funded by the National Institute of Food and Agriculture of the United States Departmentof Agricultural, under the project number 214-38202-22318.
Conflicts of Interest: The authors declare no conflict of interest.
References
1. Nitzsche, R.; Budzinski, M.; Gröngröft, A. Techno-Economic Assessment of a Wood-Based BiorefineryConcept for the Production of Polymer-Grade Ethylene, Organosolv Lignin and Fuel. Bioresour. Technol.2016, 200, 928–939. [CrossRef] [PubMed]
2. U.S. EPA. Global Greenhouse Gas Emissions Data | Greenhouse Gas (GHG) Emissions | US EPA.Available online: https://www.epa.gov/ghgemissions/global-greenhouse-gas-emissions-data (accessed on 19November 2019).
3. Matar, S.; Hatch, L.F. Chemistry of Petrochemical Processes, 2nd ed.; Gulf Professional Publishing: London,UK, 2001. [CrossRef]
4. Markets, R.; Global Adhesives Market. 2017–2022—$53.5 Billion Opportunity Analysis and IndustryForecasts. Available online: https://www.globenewswire.com/news-release/2017/10/17/1148538/0/en/Global-Adhesives-Market-2017-2022-53-5-Billion-Opportunity-Analysis-and-Industry-Forecasts.html (accessed on19 November 2019).
5. Doyle, J.S.; O’Quinn, R.C. Adhesives Types, Mechanics and Applications; Nova Science Publishers: New York,NY, USA, 2011.
6. Mohammed, I.K.; Charalambides, M.N.; Kinloch, A.J. Modelling the Interfacial Peeling of Pressure-SensitiveAdhesives. J. Nonnewton. Fluid Mech. 2015, 222, 141–150. [CrossRef]
7. Reuters. Pressure Sensitive Adhesives Market Size, Share, Report, Analysis, Trends. Available online:https://www.reuters.com/brandfeatures/venture-capital/article?id=13015 (accessed on 19 November 2019).
8. Moad, G.; Rizzardo, E.; Thang, S.H. Radical Addition-Fragmentation Chemistry in Polymer Synthesis.Polymer 2008, 49, 1079–1131. [CrossRef]
9. Lowe, A.B.; McCormick, C.L. Reversible Addition-Fragmentation Chain Transfer (RAFT) RadicalPolymerization and the Synthesis of Water-Soluble (Co) Polymers under Homogeneous Conditions inOrganic and Aqueous Media. Prog. Polym. Sci. 2007, 32, 283–351. [CrossRef]
10. Chakraborty, S.; Jähnichen, K.; Komber, H.; Basfar, A.A.; Voit, B. Synthesis of Magnetic PolystyreneNanoparticles Using Amphiphilic Ionic Liquid Stabilized RAFT Mediated Miniemulsion Polymerization.Macromolecules 2014, 47, 4186–4198. [CrossRef]
11. Boyer, C.; Bulmus, V.; Davis, T.P.; Ladmiral, V.; Liu, J.; Perrier, S. Bioapplications of RAFT Polymerization.Chem. Rev. 2009, 109, 5402–5436. [CrossRef]
12. Cochran, E.W.; Williams, R.C.; Hernandez, N.; Cascione, A. Thermoplastic Elastomers via Atom TransferRadical Polymerization of Plant Oil. US Patent US20180237571A1, 2013.
13. Gallagher, J.J.; Hillmyer, M.A.; Reineke, T.M. Acrylic Triblock Copolymers Incorporating Isosorbide forPressure Sensitive Adhesives. ACS Sustain. Chem. Eng. 2016, 4, 3379–3387. [CrossRef]

Energies 2019, 12, 4502 13 of 14
14. Forrester, M.J. Glycerol-Based Polymers and Their Pathway to Industrial Relevance. Ph.D. Dissertation,Iowa State University, Ames, IA, USA, 2018.
15. Guinée, J.B.; Heijungs, R.; Huppes, G.; Zamagni, A.; Masoni, P.; Buonamici, R.; Ekvall, T.; Rydberg, T. LifeCycle Assessment: Past, Present, and Future. Environ. Sci. Technol. 2011, 45, 90–96. [CrossRef]
16. Guinée, J.B.; Heijungs, R.; Huppes, G.; Kleijn, R.; de Koning, A.; van Oers, L.; Wegener Sleeswijk, A.; Suh, S.;Udo de Haes, H.A.; de Bruijn, H.; et al. Life Cycle Assessment: An Operational Guide to the ISO Standards, FinalReport; Leiden University: Leiden, The Netherlands, 2001. [CrossRef]
17. Silva, D.A.L.; Lahr, F.A.R.; Varanda, L.D.; Christoforo, A.L.; Ometto, A.R. Environmental PerformanceAssessment of the Melamine-Urea-Formaldehyde (MUF) Resin Manufacture: A Case Study in Brazil.J. Clean. Prod. 2015, 96, 299–307. [CrossRef]
18. Kim, S. Environment-Friendly Adhesives for Surface Bonding of Wood-Based Flooring Using Natural Tanninto Reduce Formaldehyde and TVOC Emission. Bioresour. Technol. 2009, 100, 744–748. [CrossRef]
19. Wilson, J.B. Life-Cycle Inventory of Particleboard in Terms of Resources, Emissions, Energy and Carbon.Wood Fiber Sci. 2010, 42, 90–106.
20. Chau, J.; Sowlati, T.; Sokhansanj, S.; Preto, F.; Melin, S.; Bi, X. Techno-Economic Analysis of Wood BiomassBoilers for the Greenhouse Industry. Appl. Energy 2009, 86, 364–371. [CrossRef]
21. Ou, L.; Li, B.; Dang, Q.; Jones, S.; Brown, R.; Wright, M.M. Understanding Uncertainties in the EconomicFeasibility of Transportation Fuel Production Using Biomass Gasification and Mixed Alcohol Synthesis.Energy Technol. 2016, 4, 441–448. [CrossRef]
22. Xu, F.; Sun, J.; Konda, N.V.S.N.M.; Shi, J.; Dutta, T.; Scown, C.D.; Simmons, B.A.; Singh, S. TransformingBiomass Conversion with Ionic Liquids: Process Intensification and the Development of a High-Gravity,One-Pot Process for the Production of Cellulosic Ethanol. Energy Environ. Sci. 2016, 9, 1042–1049. [CrossRef]
23. Shen, R.; Tao, L.; Yang, B. Techno-economic Analysis of Jet-fuel Production from Biorefinery Waste Lignin.Biofuels, Bioprod. Biorefining 2019, 13, 486–501. [CrossRef]
24. Yang, M.; Rosentrater, K.A. Techno-Economic Analysis (TEA) of Low-Moisture Anhydrous Ammonia(LMAA) Pretreatment Method for Corn Stover. Ind. Crops Prod. 2015, 76, 55–61. [CrossRef]
25. Yang, M.; Rosentrater, K.A. Techno-Economic Analysis of the Production Process of Structural Bio-AdhesiveDerived from Glycerol. J. Clean. Prod. 2019, 228, 388–398. [CrossRef]
26. U.S. Energy Information Administration. Electric Power Monthly with Data for June 2018; EIA: Washington,DC, USA, 2018.
27. Sheehan, J.; Camobreco, V.; Duffield, J.; Graboski, M.; Shapouri, H. Life Cycle Inventory of Biodiesel and PetroleumDiesel for Use in an Urban Bus; National Renewable Energy Lab.(NREL): Washington, DC, USA, 1998.
28. Bare, J.C.; Hofstetter, P.; Pennington, D.W.; de Haes, H.A.U. Midpoints versus Endpoints: The Sacrifices andBenefits. Int. J. Life Cycle Assess. 2000, 5, 319–326. [CrossRef]
29. Bare, J. Tool for the Reduction and Assessment of Chemical and O Ther Environmental Impacts (TRACI), TRACI Version2.1, User’s Guide; TRACI-EPA: Cincinnati, OH, USA, 2012.
30. Dreyer, L.C.; Niemann, A.L.; Hauschild, M.Z. Comparison of Three Different LCIA Methods: EDIP97,CML2001 and Eco-Indicator 99. Int. J. Life Cycle Assess. 2003, 8, 191–200. [CrossRef]
31. Phoenix Equipment Corporation. Formaldehyde Resins Plant—15,000 TPY. Available online: https://www.phxequip.com/plant.104/formaldehyde-resin-plant-15-000-tpy.aspx (accessed on 6 September 2018).
32. Peters, M.S.; Timmerhaus, K.D.; West, R.E. Plant Design and Economics for Chemical Engineers, 5th ed.;McGraw-Hill Education: New York, NY, USA, 2013.
33. Ulrich, G.D. A Guide to Chemical Engineering Process Design and Economics; John Wiley & Sons: New York, NY,USA, 1984.
34. Humphreys, K.K. Project and Cost Engineers’ Handbook, 4th ed.; Humphreys, K.K., Ed.; CRC Press: New York,NY, USA, 2004.
35. Landress, L. ICIS Pricing, Glycerine (US Gulf). Available online: https://www.icis.com/globalassets/global/icis/pdfs/sample-reports/chemicals-glycerine.pdf (accessed on 9 April 2019).
36. Ronald, H. Electric Power Monthly with Data for September 2017; US EIA: Washington, DC, USA, 2017.37. IRS. Publication 946: How to Depreciate Property. 2018. Available online: https://www.irs.gov/publications/
p946 (accessed on 19 November 2019).38. Turton, R.; Baille, R.C.; Whiting, W.B.; Shaeiwitz, J.A. Analysis, Synthesis, and Design of Chemical Processes,
3rd ed.; Prentice Hall: Upper Saddle River, NJ, USA, 2009.

Energies 2019, 12, 4502 14 of 14
39. Hayes, A. Gross Profit Definition. Available online: https://www.investopedia.com/terms/g/grossprofit.asp(accessed on 10 April 2019).
40. Kenton, W. Net Present Value (NPV). Available online: https://www.investopedia.com/terms/n/npv.asp(accessed on 10 April 2019).
41. Humbird, D.; Davis, R.; Tao, L.; Kinchin, C.; Hsu, D.; Aden, A. Process Design and Economics for BiochemicalConversion of Lignocellulosic Biomass to Ethanol; National Renewable Energy Laboratory: Golden, CO,USA, 2011.
42. Swanson, R.M.; Platon, A.; Satrio, J.A.; Brown, R.C. Techno-Economic Analysis of Biomass-to-LiquidsProduction Based on Gasification. Fuel 2010, 89 (Suppl. 1), S11–S19. [CrossRef]
43. Li, Q.; Zhang, Y.; Hu, G. Techno-Economic Analysis of Advanced Biofuel Production Based on Bio-OilGasification. Bioresour. Technol. 2015, 191, 88–96. [CrossRef] [PubMed]
44. SmartAsset. Free Income Tax Calculator. Available online: https://smartasset.com/taxes/income-taxes(accessed on 10 April 2019).
45. Saltelli, A.; Ratto, M.; Andres, T.; Campolongo, F.; Cariboni, J.; Gatelli, D.; Saisana, M.; Tarantola, S. GlobalSensitivity Analysis; John Wiley & Sons: Hoboken, NY, USA, 2008.
46. Olukoya, I.A.; Bellmer, D.; Whiteley, J.R.; Aichele, C.P. Evaluation of the Environmental Impacts of EthanolProduction from Sweet Sorghum. Energy Sustain. Dev. 2015, 24, 1–8. [CrossRef]
47. Dysert, L.R.; Christesen, P. AACE International Recommended Practice No. 18R-97, Cost Estimate ClassificationSystem—As Applied in Engineering, Procurement, and Construction for the Process Industries; Inc.: New York, NY,USA, 2016.
48. Wernet, G.; Conradt, S.; Isenring, H.P.; Jiménez-González, C.; Hungerbühler, K. Life Cycle Assessment ofFine Chemical Production: A Case Study of Pharmaceutical Synthesis. Int. J. Life Cycle Assess. 2010, 15,294–303. [CrossRef]
49. Kim, S.; Dale, B.E. Life Cycle Assessment Study of Biopolymers (Polyhydroxyalkanoates) Derived fromNo-Tilled Corn. Int. J. Life Cycle Assess. 2005, 10, 200–210. [CrossRef]
50. McDevitt, J.E.; Grigsby, W.J. Life Cycle Assessment of Bio- and Petro-Chemical Adhesives Used in FiberboardProduction. J. Polym. Environ. 2014, 22, 537–544. [CrossRef]
51. Arrington, K.J.; Radzinski, S.C.; Drummey, K.J.; Long, T.E.; Matson, J.B. Reversibly Cross-Linkable BottlebrushPolymers as Pressure-Sensitive Adhesives. ACS Appl. Mater. Interfaces 2018, 10, 26662–26668. [CrossRef][PubMed]
52. Heinzle, E.; Biwer, A.P.; Cooney, C.L. Development of Sustaiable Bioprocesses: Modelling and Assessment;John Wiley & Sons: Chichester, UK, 2006.
53. Molbase. Chemical B2B E-commerce Platform. Available online: http://www.molbase.com/ (accessed on 9April 2019).
© 2019 by the authors. Licensee MDPI, Basel, Switzerland. This article is an open accessarticle distributed under the terms and conditions of the Creative Commons Attribution(CC BY) license (http://creativecommons.org/licenses/by/4.0/).