Embed Size (px)
Citation preview
1
F R A U N H O F E R I N S T I T U T E F O R S O L A R E N E R G Y S Y S T E M S I S E
© Rainer Sturm 2010
LEVELIZED COST OF ELECTRICITY RENEWABLE ENERGY TECHNOLOGIES
MARCH 2018
2
LEVELIZED COST OF ELECTRICITY RENEWABLE ENERGY TECHNOLOGIES
March 2018
CHRISTOPH KOST
SHIVENES SHAMMUGAM
VERENA JÜLCH
HUYEN-TRAN NGUYEN
THOMAS SCHLEGL
FRAUNHOFER INSTITUTE FOR SOLAR ENERGY SYSTEMS ISE

1
Contact Person:
Dr. Christoph Kost
Heaf of Business Area
Energy Systems Analysis:
Dr. Thomas Schlegl
Fraunhofer Institute
for Solar Energy Systems ISE
Heidenhofstraße 2
79110 Freiburg
www.ise.fraunhofer.de
Directors of Institute:
Prof. Dr. Hans-Martin Henning
Dr. Andreas Bett
CONTENTS
Summary 2
1. Objective of this analysis 5
2. Historical development of renewable energy technologies 8
3. Input data for the calculation of LCOE 10
4. LCOE of energy technologies 14
5. LCOE for renewable energy technologies in regions with high solar irradiance 24
6. Outlook: LCOE and system integration of renewable energy technologies 29 7. Appendix 32
8. References 34
Acknowledgements
We thank Lisa Bongartz, Thomas Fluri, Charitha Buddhika Heendeniya, Klaus Kiefer, Björn Müller,
Franziska Riedel und Eberhard Rössler for their valuable contribution and great support in crea-
ting this study.

2
SUMMARY
The present study analyzes the levelized cost of electricity
(LCOE) of renewable energy technologies in the first quar-
ter of 2018 and predicts their future cost development until
2035 based on technology-specific learning rates (LR) and
market scenarios.
The main focus of the study is on the LCOE of photovoltaic
(PV), wind turbines and biogas plants in Germany. As a re-
ference, the development of the LCOE for newly constructed
conventional power plants (brown coal, hard coal, combined
cycle gas turbines (CCGT), gas turbines) is also analyzed.
Figure 1 shows the LCOE for both renewable and fossil power
plants built in 2018.
Depending on the type of systems and solar irradiance (950
to 1300 kWh/m²a of global horizontal irradiance (GHI) in
Germany), PV systems have a LCOE between 3.71 and
11.54 €Cents/kWh, excluding value-added tax (VAT). As of to-
day, the specific system costs lie within the range of 600 to
1400 EUR/kWp and are primarily dependent on the type of
plants. This study distinguishes between small PV rooftop
systems, large PV rooftop systems and PV ground-mounted
utility-scale systems. The LCOE for all types of PV systems con-
tinues to show a decreasing trend, thus increasing the margin
between them and the average end-customers electricity price
of 29.23€Cents/kWh, including VAT (BDEW 2017).
The LCOE of onshore wind turbines in 2018, with specific plant
costs of 1500 to 2000 EUR/kW, ranges between 3.99 and
8.23 €Cents/kWh. As a result, PV systems and onshore wind tur-
bines are, on average, the least expensive technologies in Ger-
many, both among renewable energy technologies as well as
fossil power plants. Onshore wind farms at very good locations
already produce electricity at lower costs than newly erected
coal or CCGT power plants. Despite higher average full load
hours of up to 4,500 hours per year, the LCOE of offshore wind
turbines from 7.49 to 13.79 €Cents/kWh is significantly higher
than onshore wind turbines. This is owed to higher investment
and installation costs as well as higher operating and finan-
cing costs for offshore installations (specific system costs of
3100 to 4700 EUR/kW).
The LCOE of biogas power plants (specific plant costs
between 2000 and 4000 EUR/kW) ranges between
10.14 €Cents/kWh (7000 full load hours) and 14.74 €Cents/kWh
(5000 full load hours). A heat utilization is not considered in
the calculations.
In terms of the conventional power plants, the LCOE of brown
coal lies between 4.59 and 7.98 €Cents/kWh, of hard coal 6.27
to 9.86 €Cents/kWh and of combined cycle power plants 7.78 to
9.96 €Cents/kWh, depending on the assumed full load hours and
CO2 certificate prices. The range of costs is mainly attributed to
the large variation in full load hours. Since the full load hours
result from the variable marginal costs of the individual power
plant, they are dependent on the forecast of fuel prices, CO2
certificate prices, development of renewable electricity feed-in
and composition of the power plant complex.
PV rooftopsmall
950-1300GHI in
PV rooftop
large950-1300
GHI in
PV utility-scale
950-1300GHI in
Wind Onshore
1800-3200FLHin h/a
Wind Offshore
3200-4500FLHin h/a
Biogas5000-7000
FLHin h/a
Brown coal6450-7450
FLHin h/a
Hard coal5350-6350
FLHin h/a
CCGT3000-4000
FLHin h/a
Gas500-2000
FLHin h/a
0
2
4
6
8
10
12
14
16
18
20
22
kWh/(m2a) kWh/(m2a)
Leve
lized
cos
t of e
lect
ricity
[€ce
nt20
18/k
Wh]
kWh/(m2a)
Version: March 2018
Figure 1: LCOE of renewable energy technologies and conventional power plants at locations in Germany in 2018. The value under the technology refers in the case of PV to the global horizontal irradiance (GHI) in kWh/(m²a), for the other technologies to the annual full load hours (FLH). Specific investments are taken into account with a minimum and maximum value for each technology.

3
The study also calculates the LCOE of PV home storage systems.
It lies between 16.34 and 47.34 €Cents/kWh in 2018. Both the
costs of electricity generation by PV systems and the storage
costs are taken into account in the calculation. The large va-
riation in the LCOE is a result of the wide range in the invest-
ment costs of PV battery storage as well as the consideration of
different storage sizes and their potential to increase the self-
consumption rate.
Prognosis of LCOE in Germany through 2035
Figure 2 shows the results for the future development of the
LCOEs in Germany until 2035. The illustrated range reflects the
possible cost variations in the input parameters (e.g. power plant
prices, irradiance, wind conditions, fuel costs, number of full load
hours, costs of CO2 emission certificates, etc.), which are listed in
Tables 1 to 6. This methodology is exemplarily explained for the
cost range of PV: The upper limit of the LCOE results from the
combination of a PV power plant with a high procurement price
at a location with low solar irradiance (e.g. northern Germany).
Conversely, the lower limit is defined by the most inexpensive
solar system at locations with high solar irradiance in southern
Germany. This same process is carried out for wind and biomass
power plants as well as conventional power plants. The usual
financing costs on the market and the surcharges for risks are
included in detail and are specific to each technology. This pro-
vides a realistic comparison of the power plant locations, tech-
nology risks and cost developments. The level of financing costs
has considerable influence on the LCOE and the competitiveness
of a technology. Furthermore, all of the costs and discount rates
in this study are calculated with real values (reference year 2018).
The specific investments in 2018 are calculated based on market
research and cost studies.
For PV systems, a LR of 15% is assumed. By 2030, the LCOE of
PV systems will sink below the value of 4.70 (rooftop systems)
and 2.41 €Cents/kWh (ground-mounted utility-scale power plant).
From 2025 onwards, even small PV rooftop systems in southern
Germany will generate electricity at a lower cost than newly in-
stalled hard coal or CCGT power plants in 2025. The specific PV
system costs in 2035 will be between 350 and 815 EUR/kWp.
By 2035, utility-scale PV power plants in southern Germany will
generate electricity at a considerably low cost, way below the
average LCOE for all fossil fuel power plants.
Figure 2 Learning-curve based predictions of the LCOE of renewable energy technologies and conventional power plants in Germany by 2035. Calculation parameters are listed in Tables 1 to 6. The LCOE value per reference year refers respectively to a new plant in that particular year.

4
The current LCOE of onshore wind power is already at the level
of brown coal power plants and in some cases below the LCOE
of hard coal and CCGT power plants. For the future trend, a LR
of 5% is anticipated. Improvements are mainly expected through
higher full load hours and also new installations with special low-
speed turbines. The expected increase in costs for fossil fuel pow-
er plants will nevertheless further improve the competitiveness of
onshore wind power plants, i.e. the cost of electricity generation at
high wind speed onshore locations in 2035 will be well below the
levels for all fossil power plants, at LCOEs between 3.49 to
7.09 €Cents/kWh. Offshore wind turbines still have a strong cost
reduction potential compared to onshore wind turbines. Depen-
ding on location and wind supply, electricity generation costs will
fall to between 5.67 and 10.07 €Cents/kWh by 2035. The increase
in LCOE of conventional power plants is owed to the expected
reduction of full load hours as well as the higher price of CO2
emission certificates in the future.
Since only slight decreases in cost are expected for biogas power
plants, no LRs for biogas are assumed. This leads to constant
electricity production costs until 2035 (10.14 to 14.74 €Cents/kWh
excluding heat generation).

5
1. OBJECTIVE OF THIS ANALYSIS
Decarbonisation and transformation of the energy system are
associated with both technical and economic efforts. The cost
of current and future power generation is heavily dependent on
the cost of expanding and operating power plants. The costs
of renewable energy technologies in particular have changed
dramatically in recent years. This development is driven by tech-
nological innovations such as the use of less-expensive and bet-
ter-performing materials, reduced material consumption, more-
efficient production processes, increasing efficiencies as well as
automated mass production of components. For these reasons,
the aim of this study is to analyze the current and future cost
situation as transparently as possible in the form of LCOE.
Central contents of this study
� Analysis of the current situation and the future market de-
velopment of photovoltaic (PV), wind turbines (WT) and
biogas plants in Germany
� Economic modeling of technology-specific LCOE (status 1.
quarter of 2018) for different types of installations and site
conditions (e.g. solar irradiance and wind conditions) on
the basis of common market financing costs
� Assessment of the different technology and financial pa-
rameters based on sensitivity analyzes of the individual
technologies
� Forecast the future LCOE of renewable energy technolo-
gies until 2035 using learning curve models and market
growth scenarios
� Analysis of the current situation and future market deve-
lopment of photovoltaic and solar thermal power plants
(CSP) for locations with favorable solar irradiance
� Analysis of electricity generation costs of PV storage sys-
tems
In order to be able to realistically model the variations in market
prices and fluctuations in full load hours (FLH) within respective
technologies, upper and lower price limits are indicated. These
limits are chosen based on a technology cost analysis of indivi-
dual components, market and literature research as well as la-
test reports from current power plants. It should be noted that
market prices are often based on applicable feed-in tariffs and
are therefore not always in free competition. Characteristics of
individual technologies that cannot be mapped into LCOE, such
as the advantages of easily integrable storage, the number of
FLH, decentralized power generation, capacity for follow-up
operation and time of day availability, have not been taken into
account. The technologies are evaluated and compared based
on standard market financing costs and historically proven lear-
ning curves. As a reference, the current and future LCOE of
new conventional power plants (brown coal, hard coal, com-
bined cycle power plants and gas turbines) are calculated.
The LCOE of renewable technologies depends largely on the
following parameters:
Specific investment cost
for the construction and installation of power plants with upper
and lower limits; determined based on current power plant and
market data
Local condition
with typical irradiance and wind conditions for different loca-
tions and full load hours (FLH) in the energy system
Operating cost
during the power plant’s operational life time
Lifetime of the plant
Financing condition
earnings calculated on the financial market and maturity peri-
ods based on technology-specific risk surcharges and country-
specific financing conditions taking into account the respective
shares of external and equity-based financing.

6
The following power generation technologies are studied and
assessed in various design sizes with respect to the current level
of LCOE at local conditions in Germany:
Photovoltaic power plants (PV)
Modules based on crystalline silicon solar cells
� Small rooftop systems (5 - 15 kWp) – »PV rooftop small«
� Large rooftop systems (100 - 1000 kWp) – »PV rooftop
large«
� Ground-mounted utility-scale power plants (larger than 2
MWp) – »PV utility scale«
For the PV power plants, locations in Germany with a GHI of
950 to 1300 kWh/(m²a) are studied. Standard modules with
multi-crystalline silicon solar cells are taken into consideration.
Wind energy power plants
� Onshore (2 - 4 MW)
� Offshore (3 - 6 MW)
The operation of onshore wind turbines in Germany is studied
at 1800 to 3200 FLH per year as well as offshore wind power at
3200 to 4500 FLH per year.
Biogas power plants
� Biogas power plants (> 500 kW) with substrate (silo mai-
ze, swine manure, etc.)
For the entire time period applied in the analysis, a constant
substrate price of 3.03 €Cents/kWh is assumed since no cost in-
creases are expected in the future (Scheftelowitz et al. 2016).
The possible operation of a biogas plant as an electricity-heat
cogeneration power plant with additional heat output and the
corresponding profits are not accounted for in this study.
Conventional power plants
� Brown coal power plants (1000 MW)
� Hard coal power plants (800 MW)
� Combined Cycle Gas Turbine power plants (CCGT power
plants, 500 MW)
� Gas turbine power plants (200 MW)
For comparison, the LCOE of new conventional power plants
with different development paths for FLH as well as for prices
of CO2 emission certificates and fuels (brown coal, hard coal or
natural gas) are analyzed.
Concentrated solar power plants (CSP)
� Parabolic trough power plants (100 MW) with thermal
storage - parabolic
For locations with high solar irradiance, not only photovol-
taic technology, but solar thermal power plants (concentrated
solar power) are also investigated. As CSP power plants can
only be used to generate electricity under high direct irradi-
ance, the analysis focuses on locations with direct normal ir-
radiance of 2000 kWh/(m²a) (e.g. in Spain) and locations with
2500 kWh/(m²a) (e.g. in the MENA countries).
Of solar thermal power plant technologies, only parabolic
trough technology is analyzed. Fresnel systems and tower po-
wer plants, which are currently being developed and built, are
not considered in this study.
»Levelized Cost of Electricity: Renewable Energy Techno-
logies« version March 2018 - Comparison to the previous
studies
This study is an update of the versions from November 2013
(Kost et al, 2013), May 2012 (Kost et al, 2012) and December
2010 (Kost and Schlegl, 2010). The methodology and content
have been improved and the current trends in cost develop-
ment in the last four years have been taken into account.
Besides that, the LCOE of PV systems were expanded to include
the combination of PV systems and batteries, which are ins-
talled by private persons and investors to profit from the self-
consumption of electricity from their PV modules. The sizes of
the PV systems are updated according to the current market si-
tuation (small rooftop PV between 5 and 15 kWp, large rooftop
PV on commercial buildings between 100 and 1000 kWp and
ground mounted utility scale PV plants from 2 MWp onwards).
In terms of wind energy, the low wind-speed turbines and
high wind-speed turbines are not distinguished. Increasing
FLHs are assumed for both onshore and offshore turbines,
which correlates with the current market trend of increasing
ratio between the rotor diameter and the nominal power of
the generator, as well as the increasing hub height. This trend
justifies the slight increase of the investment costs compared
to 2013. However, the costs are expected to decrease again
in the future.
Apart from that, both fixed and variable operational costs are
considered for wind turbines. The fixed operational costs con-

7
sist of the yield-independent repair and maintenance works,
management, lease and insurance costs. Even the conventio-
nal power plants are designated with fixed and variable ope-
rational costs, which contributes to a significant amount in the
LCOE as it consists of among others fuel and CO2-certificate
costs. Since there is a large uncertainty in the conventional
power plants, a wide range of input parameters for fuel and
CO2 price as well as FLH are chosen. This is especially true for
the CO2-certificate prices, where a considerably wider ran-
ge relative to the previous study is chosen here in order to
portray the uncertainty.
Furthermore, the financial conditions for the power plants are
more favorable in this study since the interest rate is currently
much lower than in 2013. The average interest rate for 20 years
in 2013 was around 2.6%. In contrast, the interest rate fell to
1.07% in 2017 (Status: November 2017). However, the possi-
bility of an increase in the interest rate in the future cannot be
neglected. Therefore, a smaller interest rate is used in this study
relative to that in the previous version, which implies that an
increase could be expected in the future.

8
Throughout the past 15 years, the global market for renewable
energies has experienced a strong growth (see Figure 3). In re-
cent years, the market for renewable energies has been pushed
forward by its growing competitiveness compared to conventi-
onal power plants. Furthermore, the commitment to long-term
energy targets has created an even more stable climate for in-
vestments in renewable energies. Positive response can be seen
from lawmakers in several countries towards the prospect of
the scarcity and price increase of fossil energy sources as well as
climate problems. At the same time, the emergence of more
technology applications further profits the renewable energy
technologies by making them more competitive even without
investment supports.
The strong market growth of renewable energies and the high
investments in new power plants were accompanied by inten-
sive research efforts, which led to improved system solutions
with higher degrees of efficiency, lower production costs and
lower operation costs. In combination with an increase in mass
production, the specific investment costs and thus the LCOE
of all technologies analyzed in this study, other than biogas
power plants, could be significantly lowered. A further decre-
ase of the LCOE will, in turn, lead to an increase of the market
potentials of the technologies within the next years and will
contribute to a continuing dynamic market development of
renewable energies (AEE 2015).
The extent of the global expansion of renewable energy po-
wer plant capacities including large-scale hydropower plants
increased significantly by the end of 2016 with a total installed
capacity of more than 2000 GW (REN21 2017). In comparison,
the current globally installed capacity of nuclear power plants
amounts to just about 400 GW (IAEA 2018). While the installed
capacity of nuclear power plants increased only by 9 GW bet-
ween 2000 and 2012, the increase amounted to 266 GW for
wind power and to about 100 GW for PV installations (Schnei-
der M. and Forggatt 2013).
Due to different cost and market structures as well as support
schemes, the markets for individual technologies have develo-
ped very differently. The market for wind power plants reached
competitive market prices at an early stage and has therefore
found markets in many countries even without incentive pro-
grams. The installed capacity of wind turbines currently sums
up to 539 GW, with new installations reaching about 52 GW
in 2017 (GWEC 2018). The installed capacity of PV adds up to
approximately 403 GW at the end of 2017 and is thus lower
than that of wind power. Nevertheless, with around 100 GW
in 2017, significantly more capacity was added to PV power
than to wind power (PV magazine 2018). In comparison, the
new installation of wind power in 2012 was still above of PV.
In Germany, the total installed wind power in 2017 amounts to
just under 56 GW and thus has exceeded the total capacity of
PV capacity of about 43 GW (Fraunhofer ISE 2017A).
The LCOE of wind power plants in locations with strong winds,
which is competitive compared to conventional power gene-
rating technologies, has enabled the establishment of wind
power plants in various markets, including in emerging and
developing countries. Despite good growth forecasts for off-
shore wind power, problems in the implementation phase of
new wind turbines have led to their current share of just over
2007 2008 2009 2010 2011 2012 2013 2014 2015 2016 20170
50
100
150
200
250
300
350
400
450
500
550
Version: March 2018
Cum
ulat
ivel
y in
stal
led
capa
city
[GW
]
Biogas Photovoltaic Wind
2. HISTORICAL DEVELOPMENT OF RENEWABLE ENERGY TECHNOLOGIES
Figure 3: Global cumulatively installed capacity 2007-2017 of wind power, PV, biogas and CSP according to GWEC 2018, REN21 2017, and IRENA 2018 respectively. Values of 2017 are stated under reserve due to lack of sources to cross-check the data.
9
3% of the total installed wind power capacity. A partially high
prioritization of offshore wind energy is contrasted by high ad-
ditional efforts for the technical implementation, which often
leads to delays in project realizations.
The photovoltaic market has also become an important seg-
ment within renewable energies through the expansion of pro-
duction capacity, particularly in Asia, where highly automated
production lines are used. Considerable production overcapaci-
ties have led to high competition within the PV industry since
2009. Since 2011, this has led to significant price declines and
sometimes unexpected market dynamics.
The market for biogas plants has grown the most in Germany
in the last 10 years, followed by Austria and England. A market
for biogas plants is increasingly developing in the USA as well
as in China. The reason lies above all in the remuneration regu-
lations of the respective countries.
In addition to the technologies described above, which are used
in Germany, solar thermal power plants can play an important
role for power generation in countries with higher irradiance.
CSP power plants have been gaining market shares in some
countries since 2007, following the first installations in the USA
in the 1980s. A capacity of 5100 MW has now been installed
(mainly in Spain and the USA) (data from our own market re-
search). Especially in the sunny MENA countries (Middle East and
North Africa), the concept of CSP plants is currently being pursu-
ed by political decision-makers due to the advantages of thermal
energy storage and the possibility of high added local value.
For the forecast of the LCOE until 2035, this study uses learning
curve models to estimate future developments. In particular,
high LRs of up to 20% have been observed for wind technology
and crystaline PV throughout the last 20 years (Fraunhofer ISE
2017B). The learning curve models are based on market scena-
rios for each technology with a forecast of the future market
developments, which are taken from reference scenarios of va-
rious studies (Table 11 in the appendix). The technology-specific
market scenarios give each technology a development horizon,
which is influenced by numerous technological, energy-political
and economic decision-making variables over the next twen-
ty years. For all technologies, there is considerable uncertainty
about the actual realizable market development until the year
2035, as this is very dependent on the amount of specific in-
vestments and usable full-load hours, the need to integrate
storage options, the regulatory environment of the different
markets and last but not least the price development of con-
ventional energy sources. However, the actual market develop-
ment of each technology is crucial for the temporal progress
of decreasing trends in costs. The presented developments in
LCOE are therefore potential development paths based on cur-
rent market developments from various reference scenarios and
technology specific assumptions such as LR and FLH.

10
Z U S A M M E N F A S S U N G
3. INPUT DATA FOR THE CALCULATION OF LEVELIZED COST OF ELECTRICITY
Technology and financing parameters
A detailed explanation of the methodology of LCOE is found in
the Appendix on page 37.
Upper and lower price limits that do not take outliers into
account is calculated for all technologies based on the data
research; the regular market costs for installation of power
plants varies between them. Uniform amounts of investments
are assumed for all locations. In practice, one must take into
account that the investments in power plants in markets that
have not yet been developed can in some cases be conside-
rably higher. Table 1 shows the investment costs in EUR/kW
(nominal capacity) for all technologies considered that were
determined based on market research on currently installed
power power plants in Germany as well as taking external
market studies into account. Within the technologies, the sys-
tem costs were distinguished based on power plant size and
power plant configuration.
For PV, the upper and lower limits for the installation cost are
differentiated according to the system sizes of small rooftop
systems up to 15 kWp, large rooftop systemy up to 1000 kWp
and ground-mounted PV systems. By using these costs, the
LCOE for each point of time for investment and construction
are calculated. The financial lifetime of PV is set to 25 years.
Longer lifetimes and operation of PV are also reported by the
plant monitoring of Fraunhofer ISE.
Data for offshore wind power plants is obtained by currently
constructed and commissioned projects in the German North
Sea and Baltic Sea. The input parameters for onshore power
plants are also taken from currently planned or commissioned
projects.
Electricity generation from biomass is solely calculated for pow-
er plants which burn biogas based on different substrates. The
substrates used are swine manure und silo corn (with a share of
40% of silo corn). Heat generation in CHP biogas power plants
is an important operational parameter and increases the econo-
mic value of the power plants. However due to the focus of this
study on electricity generation, it is not included in the calcula-
tion of the LCOE. At this time there are many bioenergy power
plants in operation. Power plant size is generally between 70
and 1000 kWel, whereby power is generated using solid, liquid
or gaseous bio-fuels. New power plants or expansions of power
plants are being advanced primarily in the biogas sector (DBFZ
2012). Additionally, flexible power plants will be needed in fu-
ture for the integration of fluctuating power generation from
wind power and photovoltaic power plants (VDE 2012). Flexib-
le operation of biogas power plants in load-following operati-
on mode is possible. In this study, only LCOE of biogas power
plants with a size of around 500 kWel are calculated because
power plants of this capacity currently hold the largest market
share (Stehnull et al, 2011).
The following parameters are used in the calculation of LCOE
for installation constructed at beginning of 2018 and in the fu-
ture (Table 2). The financing parameters have been continuous-
ly analysed since the first studies in 2010, 2012 and 2013.
The risk and investor structure of each type has been adapted.
Currently, the available financing conditions are very attractive.
Table 1: Specific CAPEX in EUR/kW of current power plant installations
CAPEX [EUR/kW]
PV rooftop small
(5-15 kWp)
PV rooftop large
(100-1000 kWp)
PV utility-scale (> 2 MWp)
Wind onshore
Wind offshore
Biogas Brown coal Hard coal CCGT GT
Investment 2018 low
1200 800 600 1500 3100 2000 1600 1300 800 400
Investment 2018 high
1400 1000 800 2000 4700 4000 2200 2000 1100 600

11
Therefore, capital costs are assumed to be lower than in the
study of 2013. It has to be noticed that the financing conditions
(in the form of interest rate for debt and equity) might increase
again, especially for future projects.
In many studies, the aspect of technology specific financing
conditions is not sufficiently analyzed. Often, similar discount
rates are assumed for all analyzed technologies and locations.
This can lead to divergent LCOE compared to real LCOE. In this
study, the discount rates are determined specifically for each
technology by applying the market capital cost (and the pa-
rameter weighted average costs of capital – WACC) for each
investment. The WACC consists of a share for the interest rate
on debt and the return on equity. Large power plants const-
ructed and operated by large investors and institutions have a
higher WACC due to the expected return of the investor com-
pared to small and medium size projects that are constructed by
private persons or business partnerships. The return on equity
expected by investors for technologies with lower maturity (e.g.
offshore wind) are additionally higher compared to established
technologies. It can be expected that the financial conditions
will be equalized after increase of installed capacity as the risk
premium for new technology sinks with increasing experience.
Since the WACC is derived from the usual interest rates and
expected returns on the market, which are given in nominal
values, the nominal value of the WACC is calculated first. This
nominal value is then converted into a real value by taking an
assumed 2% p.a. inflation rate into account.
The decisive factor for the calculation of the LCOE is that all
payment streams are assumed at either nominal or real levels.
A mixture of real and nominal values is incorrect and not per-
mitted. To carry out the analysis on nominal values, the annual
inflation rate has to be projected by 2035. Since the forecast
for the inflation rate over the long term is very imprecise and
difficult, cost predictions are generally completed using real va-
lues. All costs stated in this study therefore refer to real values
from 2018. The LCOE provided for future years in the figures
always refer to new installations in the respective years. The
LCOE of a single project remains constant over its operational
lifetime and is therefore identical to the value of the year of
installation.
A second factor influencing return on equity is the project-spe-
cific risk: The higher the risk of default, the higher the return on
equity required by the investor. In order to keep the capital costs
low, a high share of debt with low interest rate is desirable. It
is, however, also limited by the project-specific risk: The higher
the risk of default, the lower the amount of debt that banks
provide to the project. Since offshore wind parks continue to
evince a high project-specific risk, the average capital costs are
correspondingly higher than for comparable onshore projects.
If loans with low interest rates are available in sufficient amount,
for example from the KfW-Bankengruppe, interest rates on
debt of approximately 2 to 4% can be achieved depending on
the technology. This is currently the case for small PV power
plants, for which the effective interest rate of a KfW loan is cur-
rently only 2.63% for the highest rating class – with a 20-year
maturity and 20-year fixed interest (KfW 2018). Since there is
currently a very low rate of interest and this value is expected to
increase, the interest rate on debt is set slightly higher to 3.5%
for PV installations.
PV rooftop small
(5-15 kWp)
PV rooftop large
(100-1000 kWp)
PV utility-scale (> 2 MWp)
Wind onshore
Wind offshore
BiogasBrown
coalHard coal
CCGT GT
Lifetime [in years]
25 25 25 25 25 30 40 40 30 30
Share of debt 80% 80% 80% 80% 70% 80% 60% 60% 60% 60%
Share of equity 20% 20% 20% 20% 30% 20% 40% 40% 40% 40%
Interest rate on debt
3.5% 3.5% 3.5% 4.0% 5.5% 4.0% 5.5% 5.5% 5.5% 5.5%
Return on equity 5.0% 6.5% 6.5% 7.0% 10.0% 8.0% 11.0% 11.0% 10.0% 10.0%
WACC nominal
3.8% 4.1% 4.1% 4.6% 6.9% 4.8% 7.7% 7.7% 7.3% 7.3%
WACC real
1.8% 2.1% 2.1% 2.5% 4.8% 2.7% 5.6% 5.6% 5.2% 5.2%
OPEX fix [EUR/kW]
2.5% of CAPEX
2.5% of CAPEX
2.5% of CAPEX
30 1004.0% of
CAPEX36 32 22 20
OPEX var [EUR/kWh]
0 0 0 0.005 0.005 0 0.005 0.005 0.004 0.003
Degradation 0.0025 0.0025 0.0025 0 0 0 0 0 0 0
Table 2: Input parameter for LCOE calculation. The real WACC is calculated with an inflation rate of 2%.

12
In international comparisons of locations, one must keep in
mind that the financing conditions differ, similar to the en-
vironmental conditions such as solar irradiance and wind
conditions. Especially in the case of renewable energy pro-
jects, whose economic efficiency is significantly dependent
on feed-in compensation, the country-specific risk of default
of these payments, such as caused by national bankruptcy,
must be taken into account. Another factor is the availabi-
lity of subsidized loans at favorable interest rates. Germany
offers here very favorable framing conditions for investments
in renewable energy.
Local Conditions
Irradiance and Full Load Hours (FLH)
The amount of electricity yield at each power plant location is
an important parameter with a considerable influence on the
LCOE of renewable energy technologies. In the case of solar
technologies, the amount of diffuse or direct solar irradiance
(depending on the technology) plays an important role. The FLH
of a wind farm can be calculated from the wind conditions at
the power plant location as a function of the wind speed. In
the case of biogas, however, the number of FLH is not supply-
dependent but is determined by the demand, availability of
substrate and power plant design.
For that reason, exemplary locations with specific FLH for wind
farms should be studied as well as locations with specific ener-
gy sources from solar irradiance (see Table 3). At typical loca-
tions in Germany, there is a global horizontal irradiance (GHI
– consisting of diffuse and direct irradiance) in the range bet-
ween 950 and 1300 kWh per square meter and year onto the
horizontal surface (Figure 25). This corresponds to a solar irra-
diance between 1100 and 1510 kWh/(m²a) onto an optimally
oriented PV power plant. After subtracting losses of electricity
generation in the PV system, an average annual electricity yield
between 935 and 1280 kWh per installed kWp is obtained.
The wind conditions are also location-dependent. Onshore
wind turbines can reach FLH of only 1800 hours per year at
unfavourable locations. The level of FLH, however, can reach
values of up to 3200 hours at selected locations near the coast
in Germany.
The average FLH for onshore wind power plants constructed in
2016 is at 2721 hours per year (Fraunhofer IWES 2018). Much
higher FLH can be reached by offshore power plants with values
between 3200 hours at coastal areas and 4500 hours at loca-
tions with large distance to the coast (in the North Sea). Due
to the trend of increasing size and distance from the coast, off-
shore power plants are expected to reach 5500 FLH in the best
case (Reuter, Elsner 2016). This refers to an annual growth of
0.6%. Therefore, an annual growth of FLH for new installations
is assumed to be 0.5%.
Biogas power plants are operated in Germany with a utilization
rate of 80 – 90% (which refers to over 7000 FLH). Due to the
flexibility premium in the EEG law, the power plants are increa-
singly operated by a flexible operation mode. This leads, how-
ever, to decreasing FLH. The objective of the flexibility premium
is an increase of the flexibly electricity generation by biogas
power plants. By this change, the fluctuating feed-in of solar
and wind should be better balanced. Consequently, the range
of FLH of biogas plants is assumed between 5000 and 7000.
PV plant (location) Global horizontal irradiance [kWh/(m2a)]
Irradiance on PV modules with optimal angle of inclination
[kWh/(m2a)]
Electricity generation per 1 kWp with optimal angle of inclination
[kWh/a]
Northern Germany 950 1100 935
Central and Eastern Germany 1120 1300 1105
Southern Germany 1300 1510 1280
Wind power plant (2 - 5 MW) Wind speed at 120m hub height [m/s]
Wind full load hours [h] Electricity generation per 1 kW[kWh/a]
Onshore: Inland Germany 5.5 1800 1800
Onshore: Northern Germany 6.4 2500 2500
Onshore: Coastal area Germany 7.8 3200 3200
Offshore: Short distance from coast 7.8 3200 3200
Offshore: Middle distance from coast 8.7 3600 3600
Offshore: Very good locations 10.3 4500 4500
Table 3: Annual returns at typical locations of PV and wind power (Source: Fraunhofer ISE).

13
In comparison to most of the renewable energy technologies,
conventional power plants generate their electricity output
based on the hourly demand, cost of fossil fuels and the hourly
merit order in the energy system. The current FLH of brown coal
power plants is at 6950 hours on average. Coal-fired power
plants are at 5850 hours and CCGT plants at 3500 hours on
average in Germany (BMWI 2017a).
In the German energy transformation process, the increasing
electricity generation from renewables reduces the FLH of con-
ventional power plants. This study estimates continuously redu-
cing FLH for all new conventional power plants (brown coal and
coal -1% per year, CCGT -0.5%, gas turbines constant FLH).
The average value of FLH for brown coal reduces to 5350 hours
in 2035 and for CCGT to 3100 hours. Higher FLH can reduce
the LCOE of fossil power plants and vice versa, as the market
situation or demand development allows it.
Fuel Cost
Substrate costs vary considerably for biogas power plants.
The costs differ owing to the options for purchasing subst-
rates or using substrates generated by biogas operators in-
house. Additionally, the shares of the various substrates differ
between power plants. For example, in 2009, a biogas plant
in Baden-Württemberg, utilized an average substrate mix
which consisted of 30% liquefied manure, 5% solid manu-
re, 43% silo maize, 12% grass silage, 5% whole plant silage
(GPS) and 5% other substrate (Stehnull et al, 2011). In this ,
the methane yield for the individual substrates was between
106 Nm³/tFM (ton wet mass) for silo maize (Scholwin et al,
2011) and 12 Nm³/tFM for liquefied pig manure (Taumann
2012). Different costs accumulate for the substrates. Thus the
substrate costs for the purchase of maize silage are around
31 EUR/tFM (Scholwin et al, 2011) and for liquefied pig ma-
nure around 3 EUR/tFM (DBFZ 2010). Substrate costs for sub-
strate produced in-house can be assumed to be near zero.
Average substrate costs of 0.03 EUR/kWhth are assumed
by considering the conversion of the methane yield and the
methane energy production of 9.97 kWh/Nm³.
To compare the LCOE of renewable energy technologies and
conventional power plants, assumptions about the efficiencies
and CO2 emissions of these power plants are needed. The as-
sumptions for the typical power plant sizes are for brown coal
between 800 and 1000 MW, for hard coal between 600 and
800 MW, for CCGT power plants between 400 and 600 MW
and for gas turbines 200 MW. Through further technological
improvements, the efficiency of new power plants will increase
for brown coal from 45% to 48%, for hard coal from 46% to
51% and for CCGT from 60% to 62%. The price trends for
fuels are assumed with very moderate increases. Due to a pos-
sible shortage of CO2 allowances, a long-term increase of the
allowance price is assumed (see Tables 4-6).
CO2 certificate prices [EUR/t CO2]
2018 2020 2025 2030 ab 2035
Lower value 5.3 5.0 12.5 20.0 30.0
Upper value 5.3 15.0 32.5 50.0 70.0
Table 6: CO2 certificate price (own assumptions)
Table 5: Efficiency development in large power plants (Wietschel et al. 2010)
Efficiency con-ventional power plants [%]
2018 2020 2030
Brown Coal 45.0 46.5 48.5
Hard Coal 46.0 50.0 51.0
CCGT 60.0 61.0 62.0
Biomass 40.0 40.0 40.0
Table 4: Assumptions about fuel prices are based on values of (Prognos AG 2013; Hecking et al. 2017; Schlesinger et al. 2014; World Bank 2017; DLR Rheinland-Pfalz 2017; Scheftelowitz et al. 2016)
Fuel prices [EUR/MWh]
2018 2020 2025 2030 ab 2035
Brown Coal 1.8 1.8 1.8 1.8 1.8
Hard Coal 9.6 11.1 11.5 13.4 15.2
Natural Gas 21.0 25.1 27.1 32.2 33.8
Substrate Bio-mass
30.3 30.3 30.3 30.3 30.3

14
4. LEVELIZED COST OF ELECTRICITY OF ENERGY TECHNOLOGIES
In this chapter, the LCOEs of renewable energy technologies at
locations in Germany are determined for PV, biogas and wind
power based on market data on specific investments, opera-
ting costs and additional technical and financial parameters.
Reference calculations for conventional power plants (brown
coal, hard coal, CCGT and gas turbines) with different confi-
gurations, construction and operation strategies provide LCOE
values for comparison.
In southern Germany, the LCOE for small PV rooftop systems
at locations with GHI of 1300 kWh/(m²a) lies between 7.23
and 8.43 €Cents/kWh while LCOE values between 9.89 and
11.54 €Cents/kWh are reached at locations in northern Germa-
ny with an irradiance of 950 kWh/(m²a). The results depend
on the amount of the specific investments, which is assumed
to range from 1200 EUR/kWp to 1400 EUR/kWp. Rooftop
PV power plants up to 1000 kWp can produce electricity at
a LCOE between 4.95 and 6.18 €Cents/kWh in southern Ger-
many and between 6.77 and 8.46 €Cents/kWh in northern
Germany, each with specific investments between 800 and
1000 EUR/kWp. Ground-mounted PV power plants current-
ly reach LCOE values between 3.71 and 4.95 €Cents/kWh in
Figure 4: LCOE of renewable energy technologies and conventional power plants at different locations in Germany in 2018. The value under the technology refers in the case of PV to solar irradiance (GHI) in kWh/(m²a); in the case of other technologies it reflects the number of full load hours of the power plant per year. Specific investments are taken into account with a minimum and maximum value for each technology. Additional assumptions are presented in Table 4-Table 6.
PV rooftopsmall
950-1300GHI in
PV rooftop
large950-1300
GHI in
PV utility-scale
950-1300GHI in
Wind Onshore
1800-3200FLHin h/a
Wind Offshore
3200-4500FLHin h/a
Biogas5000-7000
FLHin h/a
Brown coal6450-7450
FLHin h/a
Hard coal5350-6350
FLHin h/a
CCGT3000-4000
FLHin h/a
Gas500-2000
FLHin h/a
0
2
4
6
8
10
12
14
16
18
20
22
kWh/(m2a) kWh/(m2a)
Leve
lized
cos
t of e
lect
ricity
[€ce
nt20
18/k
Wh]
kWh/(m2a)
Version: March 2018

15
southern Germany and between 5.08 and 6.77 €Cents/kWh
in northern Germany, with specific installation costs of
600 EUR/kW to 800 EUR/kW. Therewith, the LCOE of all kinds
of PV systems in Germany is significantly lower than the ave-
rage net electricity price for households of about 20 €Cents/kWh
excluding VAT (which corresponds to the net energy price of
average electricity price for private households at 29 €Cents/kWh
as published by BDEW 2017).
The LCOE of onshore wind power with an average instal-
lation cost of 1500 EUR/kW and a very high annual FLH of
3200 hours is 3.99 €Cents/kWh. However, such locations in
Germany are very limited. LCOEs in less suitable locations in
Germany range up to a value of 8.23 €Cents/kWh, depending
on the specific investment and the annual FLH (see Table 3).
In comparison, the cost of offshore wind turbines is signifi-
cantly higher, displaying values between 7.49 €Cents/kWh and
13.79 €Cents/kWh, despite higher FLH of 3200 to 4500 per year.
The considerably more complex grid connection of offshore si-
tes for the grid operator is not included in the electricity gene-
ration costs. The LCOE of biogas plants ranges between 10.14
and 14.74 €Cents/kWh for substrate prices of 3.03 €Cents/kWhth.
Based on the current conditions on the electricity market with
respect to FLH and fuel prices for each technology, the fol-
lowing LCOEs for conventional power plants are determined:
Brown coal power plants built today achieve an LCOE between
4.59 and 7.98 €Cents/kWh for the selected operation parameters
(e.g. a very low CO2 price today and a sharply rising CO2 price
in the future). The LCOE for hard coal shows slightly higher
values between 6.27 and 9.86 €Cents/kWh. CCGT power plants
achieve values between 7.78 and 9.96 €Cents/kWh, while the
LCOE of gas-fired turbines is considerably higher, ranging bet-
ween 11.03 and 21.94 €Cents/kWh.
One must keep in mind that the LCOE calculation does not
include the possible flexibility of a power generation technolo-
gy or the worth of the generated electricity. For example, the
specific seasonal and daily generation of each technology is dif-
ferent. Differences due to the flexible use of power plants or
the provision of ancillary services in relation to the market sales
price of electricity obtained are not reflected in the LCOE (see
also Chapter 7).
Photovoltaics
Market development and forecast
At the end of 2017, the global installed PV capacity excee-
ded 400 GWp and the global expansion in 2017 amounted
to around 100 GWp. This represents a market growth of over
30%, compared to the 76.6 GWp installed globally in 2016
(Hill 2017). Currently China dominates the global PV market in
both production and installation. At the same time, more coun-
tries are installing PV on a significant scale, as PV plants increa-
singly prevail in free competition and can thus be implemented
independent of subsidy programs. The PV market growth is
now driven by purely economic reasons.
This leads to the assumption that the global PV market will
continue to grow strongly. All three scenarios “High”, “Me-
dium” and “Low”, upon which the study is based, assume a
continuous reduction in annual market growth. The expected
market growth of 30%, 25% or 20% for the respective scena-
rios (“High”, “Medium” and “Low”) will decline to 10% (for
“High” and “Medium”) and 5% (for “Low”) respectively by
2035. For the year 2035, the three scenarios result in a total
capacity of 9000 GWp, 5200 GWp and 3000 GWp respectively.
The scenarios of the cumulatively installed power plant perfor-
mance are shown in Table 10.
Performance Ratio of PV systems
The Performance Ratio is used frequently to compare the
efficiency of grid-connected PV systems at different loca-
tions and with different module types. It describes the ratio
of the actual energy yield (final electrical energy) of a PV
system and its rated output. The nominal power of a PV
system is usually expressed in kilowatt peak (kWp) and is
based on the power of the PV modules in the PV system
measured under Standard Testing Conditions (STC). The
actual usable energy yield of the PV system is influenced
by the real operating conditions at the system location.
Deviations of the actual module yield in comparison with
STC conditions may arise for various reasons, such as dif-
ferent solar radiation values, shading and soiling of the PV
modules, reflection on the module surface at oblique inci-
dent angles, spectral deviation from STC conditions, and
increasing module temperature. Other losses in the PV sys-
tem are caused by electric mismatch of modules, resistive
losses in the AC and DC wiring, inverter losses and even-
tual losses in the transformer. New, optimally oriented PV
systems achieve performance ratios between 80 and 90%
in Germany (Reich et al., 2012).

16
Development of prices and costs
Since 2016, wholesale prices for crystalline modules in Germa-
ny have dropped significantly from an average of just under
540 EUR/kWp (pvXchange 2018) to 440 EUR/kWp (BSW 2018)
in 2018. The lowest net price for crystalline modules in the first
quarter of 2018 was 340 EUR/kWp (BSW 2018). An approxi-
mation towards the price level of China could be observed:
While the average wholesale price in 2016 still amounted to
just under 530 EUR/kWp, it fell to almost 400 EUR/kWp in 2018
(as of the first quarter of 2018). In 2013, the price difference
between the modules in Germany and China was significantly
larger: While prices in Germany were around 770 EUR/kWp, in
China they were significantly lower at 550 EUR/kWp.
The costs for inverters and balance of system (BOS) components
like mounting system and cables, as well as their installation
costs, dropped, though not as strongly as PV module prices.
While in 2005, solar modules constituted almost 75% of the
system costs, this share is around 50% today, even for rooftop
PV systems. Table 1 shows the price bands for PV systems of
different size classes. The costs for small PV systems (5 to 15
kWp) currently range from 1200 to 1400 EUR/kWp. For larger
PV systems up to 1000 kWp, the costs currently amount to 800
to 1000 EUR/kWp. Ground-mounted utility-scale power plants
with capacities above 2000 kWp show investment costs bet-
ween 600 and 800 EUR/kWp. These values include all compo-
nent and installation costs associated with the PV power plant.
In some cases, investments below the specified price ranges can
be realized under certain conditions of purchase.
The current LCOEs of PV systems are shown in Figure 6 for va-
rious power plant sizes and costs at different irradiance values
(according to Table 3). The number following power plant size
stands for the annual global horizontal irradiance at the power
plant location in kWh/(m²a). Power plants in northern Germany
produce approximately 935 kWh/(m²a), while power plants in
southern Germany yield up to 1280 kWh/(m²a).
The strong decline in investment prices for PV power plants has
led to significantly lower LCOEs compared to 2013. Ground-
mounted utility-scale power plants in northern Germany can
already achieve a LCOE below 5 €Cents/kWh and in the south
below 4 €Cents/kWh respectively. The LCOE of large PV rooftop
systems lies between 8.46 €Cents/kWh in northern Germany and
4.95 €Cents/kWh in southern Germany. Small PV rooftop systems
in Germany generate electricity at LCOE between 11.54 and
7.23 €Cents/kWh, and thus are well below the average electricity
costs for households. As all PV technologies still have a clear
potential for cost reduction, a continued decrease in the invest-
ment costs and consequently the LCOE in the medium to long
term is to be expected – apart from possible price fluctuations
due to special market events. Additionally, the lifetime of PV
systems is also expected to increase. Today, many module pro-
ducers already guarantee their module performance for over
25 years. In case of an increase of the lifespan of power plants
from 25 to 30 years, the LCOE will sink by another 8.5%.
A sensitivity analysis performed for a small PV plant in Germany
demonstrates the LCOE’s strong dependency on the solar irradi-
ance and specific investments (see Figure 7). The sharp decline
in the LCOE in the last years can be explained by the lower
module prices. The influence of the capital costs for investment
(WACC) on the LCOE is not to be underestimated, since the
differences here can be relatively large and slightly outside of
the parameter variance of 80 to 120% shown here. Operating
costs change more slightly and have a smaller influence on the
LCOE of PV plants, since they only constitute a minor share of
the total costs. The system lifespan has a strong effect on the
costs. With longer lifespans, plants that have already amortized
continue to produce electricity at very low operating costs.
2018 2020 2022 2024 2026 2028 2030 2032 20340
2000
4000
6000
8000
10000Version: March 2018
Cum
ulat
ivel
y in
stal
led
capa
city
[GW
p]
Low Medium High
Figure 5: Market development scenarios of cumulatively installed power plant capacity [GW] for PV 2018-2035, own scenarios.
PVrooftopsmall 950
PV rooftoplarge950
PV utility-scale950
PV rooftopsmall1120
PV rooftop large 1120
PV utility-scale1120
PV rooftopsmall 1300
PVrooftoplarge 1300
PVutility-scale1300
0
2
4
6
8
10
12
Version: March 2018
GHI inkWh/(m2a)
GHI inkWh/(m2a)
GHI inkWh/(m2a)
GHI inkWh/(m2a)
GHI inkWh/(m2a)
GHI inkWh/(m2a)
GHI inkWh/(m2a)
GHI inkWh/(m2a)
Leve
lized
cos
t of e
lect
ricity
[€ce
nt20
18/k
Wh
GHI inkWh/(m2a)
Figure 6: LCOE of PV plants in Germany based on system type and solar irradiance (GHI in kWh/(m²a)) in 2018.

17
Wind power plants
Of all renewable energy technologies, wind power currently
has the strongest market penetration due to its competitiveness
compared to conventional power generation. Initially strongest
in the markets of Denmark and Germany, the world market
in recent years has changed showing the strongest growth in
China, India and the USA (GWEC 2013).
By the end of 2017, the total capacity of installed wind power
has increased to over 500 GW. The market has shown conti-
nuous growth in the past. The total capacity of onshore wind
is expected to reach more than 1100 GW in 2025 and about
1500 GW in 2030 (GWEC 2017a; GWEC 2017b). For offshore
wind energy, a global total capacity of 65 GW in 2025 and of
126 GW in 2030 is expected (DW 2017, IRENA 2016).
The share of wind power in total electricity generation in Ger-
many amounted to 17.6% in 2017, of which 14.5% came
from onshore wind energy (Burger 2017). Wind energy conti-
nues to account for 46.6% of renewable electricity generation
in 2017 (Burger 2017).
The LCOE of wind power is highly dependent on local condi-
tions with respect to both onshore and offshore power plants,
as well as on the achievable FLH. In general, locations with fa-
vorable conditions are distinguished from those with unfavo-
rable wind conditions. Favorable locations have average wind
speeds of more than 7.8 m/s. Locations with unfavorable loca-
tions are often located inland; the average annual wind speed
is lower and the ground is rougher because of agriculture and
forest cover.
A current trend indicates that manufacturers are striving to con-
struct higher towers and increase the rotor area in proportion
to the generator capacity. This corresponds with an effort to
increase yields, enabling profitable operation also at locations
with less favorable wind conditions. Higher towers and longer
rotor blades, however, lead to greater material and installation
costs that can only be justified by a significant increase in FLH.
Thanks to ongoing technical refinement, an increase in FLH can
be expected for future power plants and thus an annual incre-
ase in the FLH which would lead to improvements in the LCOE
for wind power.
The electricity generation costs of onshore wind turbines are
calculated for sites with an average annual wind speed of
5.5 m/s and 6.4 m/s, respectively. 1800 (at the first location)
and 2500 FLH per year (at the second location) are achieved.
Very good wind locations on the coasts are represented by a
location with 7.8 m/s and 3200 FLH.
As shown in Figure 9, the LCOE of onshore wind turbines at
coastal locations with favorable wind conditions with 3200
FLH ranges between 3.99 and 4.85 €Cents/kWh. Locations with
less-favorable wind conditions achieve LCOE values from 6.72
to 8.23 €Cents/kWh, depending on the specific investments. If it
is possible to achieve 2500 FLH at the respective location, the
LCOE reaches values between 4.97 and 6.07 €Cents/kWh, which
is lower than the LCOE of new hard coal power plants.
In contrast, the analysis of current offshore wind power (in-
cluding locations with higher FLH up to 4500) shows higher
LCOE than onshore wind power. This is due to the necessary
use of more resistant and expensive materials, the elaborate
anchoring in the seabed, cost-intensive installation and logistics
of the plant components and higher maintenance expenditure.
However, a decrease in system costs and lower maintenance
costs can be expected due to more reliable systems in the fu-
ture. Currently, the LCOE of offshore wind turbines at very good
locations ranges from 7.79 to 9.95 €Cents/kWh. However, these
locations are often distant from the coast and are disadvan-
taged by a complex and expensive network connection, as
2018 2020 2022 2024 2026 2028 2030 2032 20340
400
800
1200
1600
2000
2400
2800
3200
Version: March 2018
Cum
ulat
ivel
y in
stal
led
capa
city
[GW
]
Wind Offshore Medium Wind Offshore High Wind Onshore (GWEC 2013, 450S) Wind Onshore (GEWC 2013, NewPol) Wind Onshore (GWEC 2013, Adv)
Figure 8: Market forecasts of cumulative wind power according to (GWEC 2013).
80 90 100 110 12080
90
100
110
120
130
Version: March 2018
Var
iatio
n fro
m re
fere
nce
[%]
Parameter variance [%]
Investment WACC O&M Lifetime Irradiance
Figure 7: Sensitivity analysis of a small PV system with a GHI of 1120 kWh/(m²a) and investment of 1300 EUR/kW

18
well as the need to bridge the greater depth of the sea. Loca-
tions with less FLH (3200 h) show a LCOE between 10.33 and
13.79 €Cents/kWh. This puts offshore wind turbines above the
cost of electricity for onshore wind turbines under almost all
conditions (and locations). The advantage of offshore installa-
tions is the higher number of FLH, as well as lower noise pol-
lution and increased public acceptance, if minimum levels for
the distance to the coast and environmental protection requi-
rements are met. However, network connectivity problems still
delay current offshore projects. These technology-specific risks
lead to higher capital costs as well as well as demand for finan-
cial security from creditors, which results in higher WACC for
offshore projects compared to onshore wind parks.
The margin for cost reductions in offshore wind power is limi-
ted by the large expenditures for installation and maintenance.
Therefore, achieving parity with onshore wind power seems
quite difficult at the moment. However, the past years have
shown that project costs tend to decrease faster than expected
with the realization of numerous projects. The sensitivity analy-
sis for onshore wind power identifies savings in power plant in-
vestments as the primary goal for realizing future cost reduction
potential. Similar to PV, the sensitivity analysis reacts strongest
to this parameter. Furthermore, reducing maintenance costs can
also make an important contribution.
Biogas power plants
The market for biogas power plants is characterized by nu-
merous ups and downs. While around 600 MW were added an-
nually from 2009 to 2011, the annual additional capacity was
only about 240 MW in the following two years. In 2016, the
total installed capacity of biogas power plants in Germany was
more than 4200 MW (Fachverband Biogas 2017). Despite the
expansion of biogas plants in Germany, observations show no
reduction in specific investment costs in recent years. Indeed,
the specific investment costs of installations even increased bet-
ween 2005 and 2009 (Stenull et al., 2011). Therefore, no LR for
biogas plants is assumed. In this study, heat offtake is not taken
into account, in order to preserve the basis for comparison with
the LCOE of other technologies. A heat credit is therefore not
taken into account in the LCOE.
Figure 11 shows the LCOE of large biogas power plants
(>500 kWel) for different FLH. Furthermore, the specific in-
vestments between 2000 and 4000 EUR/kW are included in
the calculations. Biogas power plants with high FLH and lo-
wer specific investment costs evidence a LCOE of at least
10.14 €Cents/kWh. The LCOE of biogas plants with low FLH
and high specific investments will be significantly higher
and can reach up to 14.74 €Cents/kWh. The largest determi-
nant of the electricity production costs of biogas plants are
the substrate costs, but FLH also have a major impact on the
LCOE. The LCOE will drop by more than 0.75 €Cents/kWh, if
FLH are increased by 20%. In comparison, the LCOE drops by
Figure 10: Sensitivity analysis of onshore wind power 2500 FLH, specific investment of 1800 EUR/kW.
80 90 100 110 12080
90
100
110
120
130
Version: March 2018
Var
iatio
n fro
m re
fere
nce
[%]
Parameter variance [%] Investment WACC O&M Lifetime Full load hours
Biogas - 5000FLH in h/a
Biogas - 6000FLH in h/a
Biogas - 7000FLH in h/a
8
9
10
11
12
13
14
15
16
Version: March 2018
Leve
lized
cos
t of e
lect
ricity
[€ce
nt20
18/k
Wh]
Figure 11: LCOE of biogas power plants at different FLH in 2018.
Wind Onshore 1800 FLH
in h/a
Wind Onshore 2500 FLH
in h/a
Wind Onshore3200 FLH
in h/a
Wind Offshore 3200 FLH
in h/a
Wind Offshore 3850 FLH
in h/a
Wind Offshore 4500 FLH
in h/a
0
2
4
6
8
10
12
14
Version: March 2018
Leve
lized
cos
t of e
lect
ricity
[€ce
nt20
18/k
Wh]
Figure 9: LCOE of wind power by location and full load hours in 2018.

19
1.5 €Cents/kWh if substrate costs are reduced by 20%. A change
in the lifespan and the O&M costs has a smaller impact on
the LCOE. If the lifespan were to be increased by 20%, the
LCOE would merely decrease by 0.25 €Cents/kWh; and if O&M
costs were to be reduced by 20%, the LCOE would drop by
0.4 €Cents/kWh. Of the observed parameters, a change in WACC
has the least impact on the cost of electricity.
Conventional power plants
Market development and forecast
Coal-fired power plants
Worldwide, the installed capacity of coal-fired power plants is
about 2000 GW, or 32% of the total global installed power
plant capacity. In fact, the largest share of electricity worldwide
is produced by coal-fired power plants (40%), followed by gas-
fired power plants with 22% (IEA, 2017). China produces the
largest amount of coal-generated electricity. At the same time,
China is the largest consumer of coal worldwide with a share
of 50%. The OECD countries of the Americas constitute the
second largest market, followed by the Asian-Oceanic OECD
countries. The fourth largest market is Eastern Europe and Eu-
rasia, where the OECD countries of Europe currently have the
lowest coal-fired electricity production. India, the Association
of Southeast Asian Nations and South Africa are all future mar-
kets.
While net electricity generation from brown coal in Germa-
ny amounted to 30% and hard coal to 22% in 2012 (BNet-
zA 2018, Kost et al., 2013), the share of brown coal in net
electricity production in 2017 was only 24% and that of hard
coal about 15% (Fraunhofer ISE 2018). The installed capacity
of brown coal and hard coal power plants has been virtually
constant at 20.9 GW and 28.32 GW since 2002 (Fraunhofer ISE
2017). In the long term, brown coal capacities are expected to
decline to 11.8 GW (50Hertz Transmission GmbH et al., 2013),
and hard coal capacities to 20.2 GW by 2033.
Gas power plants
In 2017, a total gas power plant capacity of around 1700 GW
was installed worldwide with an electricity production of
4299 TWh (EIA 2017), making natural gas the second largest
source in electricity production worldwide. Over half of all gas-
fired power plants are installed in OECD countries. The OECD
countries in the Americas account for 27% of the worldwide
installed capacity, followed by European OECD countries (15%)
and Asian OECD countries (9%). In the non-OECD countries,
Russia has the largest installed capacity of gas-fired power
plants with 7%, due to its large gas reserves. The Middle East
as a whole has a share of 14%. In China, 4% and in India 2%
of the global capacity is installed respectively. The markets in
Africa, Central and South America are currently very small. Big
growth markets are Brazil - with a growth rate of 6% between
2008 and 2035 - and India. Furthermore, the markets in Africa,
Mexico and Chile will grow strongly until 2035. Capacities are
also slightly in decline in Russia and Japan (EIA 2017).
In 2017, gas-fired power stations accounted for around 8%
of net electricity generation in Germany (Fraunhofer ISE 2018).
Since 2002, the installed capacity of gas-fired power plants in
Germany has increased from 20.3 GW to 29.9 GW. According
to the grid development plan, an increase of the installed gas
capacity to 30.5 GW – 37.8 GW in 2030 is assumed (50Hertz
Transmission GmbH et al., 2017).
Price and cost development
The LCOE of gas and coal power plants is heavily dependent
on the achievable FLH. In Germany, brown coal power plants
currently reach FLH between 5000 and 7600, hard-coal power
plants achieve FLH between 3500 and 6500 and CCGT achieve
FLH between 2000 and 5000. The FLH, which can be achieved
by a power plant, depend on the variable marginal costs of
the individual power plant, since the usage of power plants on
the market is determined by the merit order. As a result, the
development of FLH is essentially dependent on a forecast of
prices for fuel and CO2 certificates, the development of feed-in
of renewable electricity and the composition of the power plant
park. Because these variables are dependent on developments
80 90 100 110 12080
90
100
110
120
130
Version: March 2018
Var
iatio
n fro
m re
fere
nce
[%]
Parameter variance [%] Investment WACC O&M Lifetime Full load hours Substrate Costs
Figure 12: Sensitivity analysis for biomass power plants with specific investment of 3000 EUR/kW and 6000 FLH.

20
on national and international markets, they are subject to con-
siderable uncertainty. Therefore, a large range of values for FLH
has been specified for these technologies.
Figure 13 shows the LCOE of conventional power plants using
brown coal, hard coal, combined cycle gas turbines (CCGTs) and
gas turbines for 2018, for a range of FLH, the CO2 allowance
price from Table 6, the fuel prices from Table 4 and for the mini-
mum and maximum specific investments from Table 1.
Brown coal currently has the lowest LCOE, ranging from 4.59
to 7.98 €Cents/kWh. As a classic base load power plant, how-
ever, brown coal-fired plants have a very low generation fle-
xibility and are therefore only of limited use for flanking fluc-
tuating renewable energy technologies. The LCOE of hard
coal-fired power plants, despite their lower specific investment
compared to brown coal, is significantly higher at 6.27 to
9.86 €Cents/kWh. The LCOE of combined cycle power plants ran-
ges between 7.78 and 9.96 €Cents/kWh and are therefore slightly
more expensive than coal-fired power plants. Advantages of
the combined cycle power plants are their higher flexibility and
lower specific CO2 emissions compared to coal-fired power
plants. Highly flexible gas turbines have even higher electrici-
ty generation costs at 11.03 and 21.94 €Cents/kWh. They are,
however, highly flexible and with fewer than 1000 FLH per
year, are less expensive than other technologies due to their
low acquisition costs.
To compare: PV ground-mounted systems at locations with
global irradiance of 1300 kWh/(m2a) achieve a LCOE of
3.71 €Cents/kWh, while onshore wind energy plants at locations
with 3200 FLH have an LCOE of 3.99 €Cents/kWh. As a result, the
LCOE of ground-mounted PV systems and onshore wind turbi-
nes are well below the LCOEs of all conventional power plants.
Figure 13 emphasizes the heavy dependence of the LCOE of
conventional power plants on the achievable FLH. For CCGT
plants, the variation in FLH of +/- 20% results in a LCOE diffe-
rence of approximately +/- 0.4 €Cents/kWh. The specific invest-
ments also have a significant impact on the LCOE, which in
CCGT leads to a difference of 0.7 €Cents/kWh at low FLH.
In the future, the FLH of conventional power plants will decline,
with an increasing share of renewable electricity. Contrary to
the trend in renewable technologies, the costs of conventional
power plants will increase in the future. On the one hand, this
trend results from rising prices for fossil fuel and CO2 certifica-
tes, and on the other hand from the significantly lower amount
of FLH expected for conventional power plants in the future. It
can be assumed that it will not necessarily be the least expensi-
ve of the conventional power plants that remains successful on
the market, but rather those power plants that show the high-
est flexibility for ramping up and down will prevail, i.e. natural
gas power plants.
Photovoltaics with storage
Privately used PV systems are increasingly being installed in
combination with battery storage systems. This chapter exami-
nes the the costs of electricity generation and storage for PV
rooftop systems combined with battery storage. Battery sto-
rage helps increase the self-consumption, enabling the plant
owner to increase savings especially during times of rising elec-
tricity prices and falling technology costs. Figure 14 schema-
tically shows the energy flows of the electricity from the PV
storage system. The electricity from the PV system is consumed
directly in the household, when possible. At times of low con-
sumption and high PV production, the battery storage can be
charged. Furthermore, surpluses can be delivered to the power
grid. For the calculation of the LCOE of PV battery storage, only
the amount of energy, which is provided by the energy storage
within the household, is considered (self-consumption through
battery). Here, the costs for the stored PV electricity are inclu-
ded in the costs. The remaining electricity (direct consumption
and feed-in to electricity grid) is represented with the LCOE cal-
culated in the previous chapters.
Table 7 gives the input data used in calculating the LCOE for
PV battery systems, which are to be installed in 2018 or 2030.
The CAPEX of the battery storage are defined here as the net
prices per useful capacity. The price data for lithium-ion batte-
ries from the first half of 2017 together with an estimated price
reduction for the beginning of 2018 are used. Since the battery
Brown Coal6450-7450
FLHin h/a
Hard Coal5350-6350
FLHin h/a
CCGT2400-4000
FLHin h/a
Gas500-2000
FLHin h/a
0
5
10
15
20
25
Version: March 2018
Leve
lized
cos
t of e
lect
ricity
[€ce
nt20
18/k
Wh]
Figure 13: LCOE of conventional power plants in 2018 with varying CO2 certificate and fuel prices as well as specific investments.

21
storage is usually installed simultaneously with a PV system, no
additional installation costs are taken into account. The ratio of
battery capacity to PV power determines the increase in self-
consumption, which is to be achieved. This factor is used to
adjust the battery costs to correspond to a PV power of 1 kWp.
The analysis period is 25 years, concurring with the calculati-
on of the LCOE of small PV systems. Within this period, one
replacement of the battery, which is estimated at 60% of the
original price, is assumed. The annual expenditures take into
account the costs for the battery replacement and the costs for
electricity from the PV system. The electricity production costs
of small PV systems serve as the purchasing costs for the elec-
tricity consumed. The losses associated to charging and dischar-
ging as well as the self-discharge is taken into account when
purchasing electricity. Since consumer prices for battery storage
have dropped significantly over the past years and a further
strong reduction is expected for the future, reduced costs for
the year 2030 are assumed.
Figure 15 shows the LCOE for electricity from PV batte-
ry storage compared to electricity from small PV systems.
The LCOE for PV battery storage currently ranges from
16.34 to 47.34 €Cents/kWh. With battery prices from 200 to
650 EUR/kWh and reduced costs of PV, the LCOE falls to values
between 8.05 and 26.35 €Cents/kWh in 2030.
The fact that PV battery storage systems serve a different
market than the other power generation technologies has
to be taken into account: by increasing the self-consumpti-
on quota and exempting this electricity from taxes and le-
vies (at a PV system capacity of less than 10 kWp), the elec-
tricity generated from the PV battery system can compete
with the costs for electricity from the grid, which amount to
around 20 €Cents/kWh excluding VAT (which corresponds to
the net energy price of average electricity price for private
households at 29 €Cents/kWh as published by BDEW 2017). Ad-
ditionally, the fact that investors will always consider a mixed
Figure 14: Schematic diagram of the energy flows of electricity from private PV rooftop systems
Figure 15: LCOE of PV battery storage in comparison to LCOE of PV rooftop systems
PV rooftop(2018)
950-1300
PV rooftopBattery(2018)
950-1300
PV rooftop(2030)
950-1300
PV rooftopBattery(2030)
950-1300
0.4
0.3
0.2
0.1
Version: March 2018
GHI inkWh/(m2a)
GHI inkWh/(m2a)GHI in
kWh/(m2a)
GHI inkWh/(m2a)
Leve
lized
cos
t of e
lect
ricity
[EU
R20
18/k
Wh]
0.5
Year of installation 2018 2030Unit Low High Low High Sources 2018
CAPEX Battery (net, per usable capacity )
EUR/kWh 560 1220 200 650
(Figgener et al. 2017, S.47) (as-sumed by using further annual price reduction, similar to the years 2013 to 2016)
Ratio of battery capacity to PV capacity
kWh/kWp 0.5 1 0.5 1 Own assumptions
Replacement cost of battery % of CAPEX 60 60 60 60Average purchase price (Lorenz, Schröder 2014)
WACC real % 1.765 1.765 1.765 1.765 Own assumptions
Lifetime of first battery year 10 10 15 15 Own assumptions
Efficiency of battery (roundtrip) % 95 90 95 95 Own assumptions
Self discharge rate %/month 1 1 1 1 Own assumptions
LCOE PV €cent /kWh 7.23 11.54 4.70 7.50 See section 4
Increase of self-consumption rate through battery
% 20 30 20 30As result of the ratio PV to battery (Weniger et al. 2015, S.29)
Financial lifetime year 25 25 25 25 Own assumptionsElectricity generation of PV system
kWh/kWp 1280 935 1280 935 Own assumptions
Table 7: Input parameters for the calculation of LCOE from PV battery storage systems

22
calculation should be noted. When installing a PV storage
system, a household can directly use part of the electricity at the
favorable LCOE of the PV system. Another part of the electricity
is temporarily stored and consumed via the battery. In additi-
on, revenues are generated through the sale of PV electricity.
Therefore, PV storage system can be an economical investment
even at comparatively high electricity generation costs.
Prognosis for the LCOE up to 2035 in Germany
Cost forecasts can be generated for renewable energy tech-
nologies by using historically observed learning curves, whose
progress over time builds on the different market forecasts for
the timespan up to 2035. For PV and wind turbines, an average
LR, or Progress Ratio (PR = 1 - LR), could be determined for
the past 20 years: In the past, the investments per Watt of PV
modules sank following a LR of 25% (Fraunhofer ISE 2017B).
A LR of 15% is applied, as suggested by Bhandari and Stadler
(2009) and Wirth (2017), for the LCOE of PV systems in the fu-
ture. By comparison, a LR of 5% (moderate scenario, see Table
11) is used for onshore and offshore wind turbines (however,
an increase in the FLH over time is assumed for wind energy).
The modeling of the LCOE shows differing development dyna-
mics for the individual technologies, depending on the afore-
mentioned parameters, financing conditions (WACC), market
maturity and development of the technologies, current specific
investments (EUR/kW) and site conditions (Figure 16). Today,
almost all newly installed PV systems in Germany can generate
electricity for less than 14 €Cents/kWh. With a global horizon-
tal irradiance (GHI) of 950 kWh/(m2a), even the costs for small
rooftop plants will drop below 10 €Cents/kWh in 2022. Larger
ground-mounted plants already produce electricity for less than
4 €Cents/kWh with an annual irradiance of 1300 kWh/(m2a). In
2035, the LCOE will range from 4.20 and 6.71 €Cents/kWh for
small PV roof systems and between 2.16 and 3.94 €Cents/kWh
for ground-mounted installations. Large rooftop PV systems
in Germany will be able generate electricity at LCOE between
2.88 and 4.92 €Cents/kWh in 2035. Beyond 2025, even small
rooftop PV systems in Southern Germany will generate electrici-
ty at a lower cost than newly installed hard coal or CCGT power
plants, which will then generate electricity at a cost of 7.05 to
11.40 €Cents/kWh. Plant prices for PV will decrease to less than
400 EUR/kW for ground-mounted systems up to 2035 and to
700 to 815 EUR/kW for small systems.
Figure 16: Forecast for the development of LCOE of renewable energy technologies as well as conventional power plants in Germany by 2035.

23
Depending on the location, onshore wind turbines can achie-
ve comparable LCOE with PV power plants in good locations.
From current LCOE between 3.99 and 8.23 €Cents/kWh, the costs
decrease in the long term to 3.49 and 7.09 €Cents/kWh. Onshore
wind turbines are already comparable to brown coal-fired pow-
er plants regarding their LCOE. Rising CO2 certificate prices and
decreasing FLH are the reasons for increasing LCOE for brown
coal-fired power plants to between 5.35 and 9.62 €Cents/kWh by
2035. In offshore wind turbines a slightly greater cost reduction
potential would be available due to a stronger market growth.
This can noticeably reduce the LCOE from the much higher le-
vels until 2035. The LCOE is expected to decrease from 7.49 and
13.79 €Cents/kWh to a range of 5.67 to 10.07 €Cents/kWh in 2035.
The system prices of offshore turbines lie between 2610 and
3950 EUR/kW. For biogas power plants, the LCOE is expected to
range from 10.14 to 14.74 €Cents/kWh. The availability and the
fuel costs of the substrate are particularly crucial for the future
LCOE development.
In the long term, both PV systems in regions with high solar
irradiance and wind turbines located inland with profitable
wind conditions have the lowest LCOE. Both technologies can
significantly underprice the LCOE of fossil fuel plants by 2035.
The developments in technology and costs in recent years have
significantly improved the competitiveness of wind power and
PV. Particularly in the case of PV, strong cost reductions could
be implemented, so that PV and onshore wind power are the
cheapest technologies for power generation (in terms of new
power plants) in Germany. For wind turbines, the increase in
FLH due to larger plant dimensions and the reduction in plant
costs, significantly contribute to the low LCOE. The analysis of
the LCOE in this study shows that forecasts for PV presented
in the previous versions of this study (2010, 2012, 2013) are
even undercut due to strong market growth and significant pri-
ce reductions for PV systems. Another reason for this is that
both technology and financing costs have become significantly
cheaper.
Sensitivity analyses of the used learning curves for PV
and wind
In a sensitivity analysis, the specific investment costs, lifespan,
weighted average cost of capital (WACC), FLH and operating
costs are examined regarding their impact on the LCOE.
Figure 17 and Figure 18 show the range of LCOE for small PV
installations and onshore wind power in Germany with respect
to different combinations of LRs and market scenarios (see Ta-
ble 10: Overview of LR and market scenarios for PV, CSP and
wind power and Table 11: Overview of Scenarios and Deve-
lopment Targets for PV, CSP and wind power). Based on the
assumed low costs, the LCOE values show variations of up to
15% depending on the parameters used. This demonstrates
the uncertainty of the learning curve model when varying input
parameters are used, yet at the same time, it reflects a potential
range for the cost development of each technology.
For small photovoltaic systems at locations with a GHI of
950 kWh/(m2a), a LCOE between 4.70 and 6.96 €Cents/kWh
can be identified in 2035 depending on the scenario as-
sumptions. For onshore wind energy, only minor future
cost reductions are expected due to the currently low LCOE
(between 3.38 and 3.57 €Cents/kWh).
2020 2025 2030 20354
5
6
7
8
9
10
Version: March 2018
Leve
lized
Cos
t of E
lect
ricity
[€ce
nt20
18/k
Wh] Low, LR 10 %
Medium, LR 15 % High, LR 20 %
Figure 17: Sensitivity analysis for the LCOE forecast of small PV plants, investment costs in 2018 = 1200 EUR/kW, GHI=950 kWh/(m2a).
2020 2025 2030 20353,3
3,4
3,5
3,6
3,7
3,8
3,9
4,0
Version: March 2018
Leve
lized
Cos
t of E
lect
ricity
[€ce
nt20
18/k
Wh] GWEC 4505, LR 3 %
GWEC NewPolicies, LR 5 % GWEC Advanced, LR 8%
Figure 18: Sensitivity analysis for the LCOE forecast of Onshore-wind power, investment costs in 2018 = 1500 EUR/kWh, FLH are increasing from 3200 h/a in 2018 to 3500 h/a in the year 2035.

24
5. LCOE FOR RENEWABLE ENERGY TECHNOLOGIES IN REGIONS WITH HIGH SOLAR IRRADIANCE
This chapter analyzes photovoltaic (PV) and Concentrated Solar
Power (CSP) plants for regions with very high solar irradiance
and calculates the respective LCOE. Since CSP power plants can
only be used to generate electricity under high direct irradiance,
the analysis of CSP focuses on locations with a Direct Normal
Irradiance (DNI) of 2000 kWh/(m²a) (for example in Spain) and
locations with 2500 kWh/(m²a) (for example in the MENA coun-
tries). By integrating thermal salt storage, the generated thermal
energy can be stored, which enables the plant to feed electricity
into the grid independent from the current weather conditions
or the time of day. This integrated storage option differentiates
CSP from wind power and PV systems. Particularly the countries
with a very strong direct normal radiation (DNI) have developed
extensive expansion plans for CSP power plant projects, often in
sunny desert areas (New Energy Update 2017).
As of the beginning of 2018, 4.5 GW of CSP power plants are
installed globally. Further plants with a total capacity of 5 GW
are currently either under construction or in the planning and
development phase. Particularly, the Chinese market has been
targeting new CSP power plants in recent years.
The analysis of LCOE for CSP power plants is based in particular
on the data of realized power plant projects of parabolic trough
and tower technology in Spain, the USA and the Middle East.
The installation costs of CSP systems with integrated storage
for 8 hours was between 3600 and 4000 EUR/kW at the be-
ginning of 2018.
Among solar thermal power plant technologies, only those,
which are currently being developed and constructed (parabo-
lic trough and tower plants), will be examined. To simplify, they
are represented as one technology called “CSP”. The study ex-
amines 100-200 MW parabolic trough power plants, which are
equipped with thermal storage (8 hours). Information from the
reference power plants, site-specific irradiation, proportion of
natural gas used for hybrid operation (<5% of total electricity
production) and plant-specific output serve as a basis for calcu-
lating the LCOE of solar thermal power plants.
Solar thermal power plants only concentrate DNI into a focal
point where it is converted into electricity or heat. Therefore,
for both technologies, only locations with an annual DNI of
2000 and 2500 kWh/(m²a) are considered, as described e.g.
in southern Spain and in the MENA countries. On the other
hand, three different sites are assumed to calculate the LCOE
of PV. The first location with the lowest global radiation of
1450 kWh/(m²a) is only studied for a PV system, as the DNI
at this location is too low for CSP. PV systems is also exami-
ned at respective locations with a global irradiance (GHI) of
1800 kWh/(m²a) and 2000 kWh / (m²a).
In comparing the LCOE of PV systems and CSP power plants
at locations with high irradiance (DNI of 2000 kWh/(m²a)) for
2018, the PV plants show lower LCOEs compared to CSP. The
LCOE of CSP power plants with integrated heat storage (FLH up
to 3600 h) is currently below 10.12 €Cents/kWh, while ground-
mounted PV systems with the same amount of irradiance
reach a LCOE below 3.1 €Cents/kWh. To compare, the LCOE of
onshore wind turbines at a site with 2500 FLH ranges between
5.34 and 6.55 €Cents/kWh.
2016 2018 2020 2022 2024 2026 2028 2030 2032 20340
50
100
150
200
250
300
350
Version: March 2018
Cum
ulat
ivel
y in
stal
led
capa
city
[GW
]
Current Policy, SolarPACES 2016 Moderate, SolarPACES 2016 Sarasin 2011 Trieb 2009 Greenpeace 2009
Figure 19: Market forecast for cumulative power plant capacity for CSP from 2016-2035, (Sarasin Bank 2011), (Trieb et al. 2009), (Green-peace 2009), (Greenpeace International et al. 2016).The values of the Sarasin and Greenpeace scenarios beyond 2030 have been extrapolated in order to calculate the system price until 2035 using the learning curve model (see chapter 7)
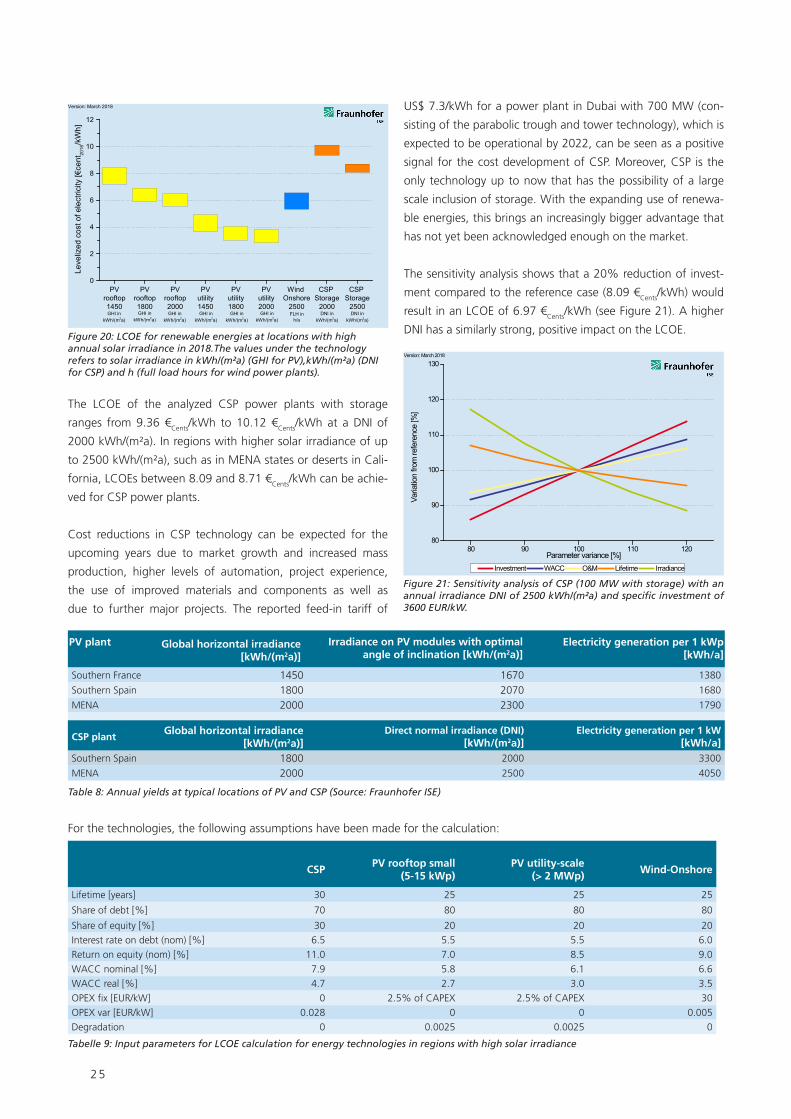
25
The LCOE of the analyzed CSP power plants with storage
ranges from 9.36 €Cents/kWh to 10.12 €Cents/kWh at a DNI of
2000 kWh/(m²a). In regions with higher solar irradiance of up
to 2500 kWh/(m²a), such as in MENA states or deserts in Cali-
fornia, LCOEs between 8.09 and 8.71 €Cents/kWh can be achie-
ved for CSP power plants.
Cost reductions in CSP technology can be expected for the
upcoming years due to market growth and increased mass
production, higher levels of automation, project experience,
the use of improved materials and components as well as
due to further major projects. The reported feed-in tariff of
US$ 7.3/kWh for a power plant in Dubai with 700 MW (con-
sisting of the parabolic trough and tower technology), which is
expected to be operational by 2022, can be seen as a positive
signal for the cost development of CSP. Moreover, CSP is the
only technology up to now that has the possibility of a large
scale inclusion of storage. With the expanding use of renewa-
ble energies, this brings an increasingly bigger advantage that
has not yet been acknowledged enough on the market.
The sensitivity analysis shows that a 20% reduction of invest-
ment compared to the reference case (8.09 €Cents/kWh) would
result in an LCOE of 6.97 €Cents/kWh (see Figure 21). A higher
DNI has a similarly strong, positive impact on the LCOE.
PVrooftop1450
PVrooftop1800
PVrooftop2000
PVutility1450
PVutility1800
PVutility2000
Wind Onshore
2500
CSP Storage
2000
CSP Storage
2500
0
2
4
6
8
10
12
Version: March 2018
FLH inh/a
DNI inkWh/(m2a)
DNI inkWh/(m2a)
GHI inkWh/(m2a)
GHI inkWh/(m2a)
GHI inkWh/(m2a)
GHI inkWh/(m2a)
GHI inkWh/(m2a)
Lev
eliz
ed c
ost o
f ele
ctric
ity [€
cent
2018
/kW
h]
GHI inkWh/(m2a)
Figure 20: LCOE for renewable energies at locations with high annual solar irradiance in 2018.The values under the technology refers to solar irradiance in kWh/(m²a) (GHI for PV),kWh/(m²a) (DNI for CSP) and h (full load hours for wind power plants).
PV plant Global horizontal irradiance [kWh/(m2a)]
Irradiance on PV modules with optimal angle of inclination [kWh/(m2a)]
Electricity generation per 1 kWp [kWh/a]
Southern France 1450 1670 1380
Southern Spain 1800 2070 1680
MENA 2000 2300 1790
CSP plantGlobal horizontal irradiance
[kWh/(m2a)]Direct normal irradiance (DNI)
[kWh/(m2a)]Electricity generation per 1 kW
[kWh/a]Southern Spain 1800 2000 3300
MENA 2000 2500 4050
CSPPV rooftop small
(5-15 kWp)PV utility-scale
(> 2 MWp) Wind-Onshore
Lifetime [years] 30 25 25 25
Share of debt [%] 70 80 80 80
Share of equity [%] 30 20 20 20
Interest rate on debt (nom) [%] 6.5 5.5 5.5 6.0
Return on equity (nom) [%] 11.0 7.0 8.5 9.0
WACC nominal [%] 7.9 5.8 6.1 6.6
WACC real [%] 4.7 2.7 3.0 3.5
OPEX fix [EUR/kW] 0 2.5% of CAPEX 2.5% of CAPEX 30
OPEX var [EUR/kW] 0.028 0 0 0.005
Degradation 0 0.0025 0.0025 0
Table 8: Annual yields at typical locations of PV and CSP (Source: Fraunhofer ISE)
Tabelle 9: Input parameters for LCOE calculation for energy technologies in regions with high solar irradiance
For the technologies, the following assumptions have been made for the calculation:
80 90 100 110 12080
90
100
110
120
130Version: March 2018
Parameter variance [%]
Varia
tion
from
refe
renc
e [%
]
Investment WACC O&M Lifetime Irradiance
Figure 21: Sensitivity analysis of CSP (100 MW with storage) with an annual irradiance DNI of 2500 kWh/(m²a) and specific investment of 3600 EUR/kW.

26
Forecast of LCOE until 2035 for solar technologies with
high solar irradiance
The forecast of electricity generation costs up to the year 2035
is also carried out for PV and CSP at locations with high solar
irradiance. Investigations by the German Aerospace Center DLR
provide different LRs for the individual components (solar field,
thermal storage, power block) with values ranging between
2% and 12% for CSP power plants (Viebahn et al., 2008, Trieb
et al. at. 2009). From this, an average LR of 7.5% can be cal-
culated, which refers to the total power plant. Other studies
assume LR with values of 10% (Greenpeace 2009) or 4% - 8%
(Sarasin Bank 2011).
By 2035, the LCOE for CSP can be reduced to values between
5.75 and 6.93 €Cents/kWh, as shown in Fig. 22. The extent, to
which the installation of CSP will be driven in markets with high
irradiance in the next years, will be crucial for CSP.
Figure 22: Development of LCOE for PV and CSP at locations with high solar irradiance kWh/(m²a).
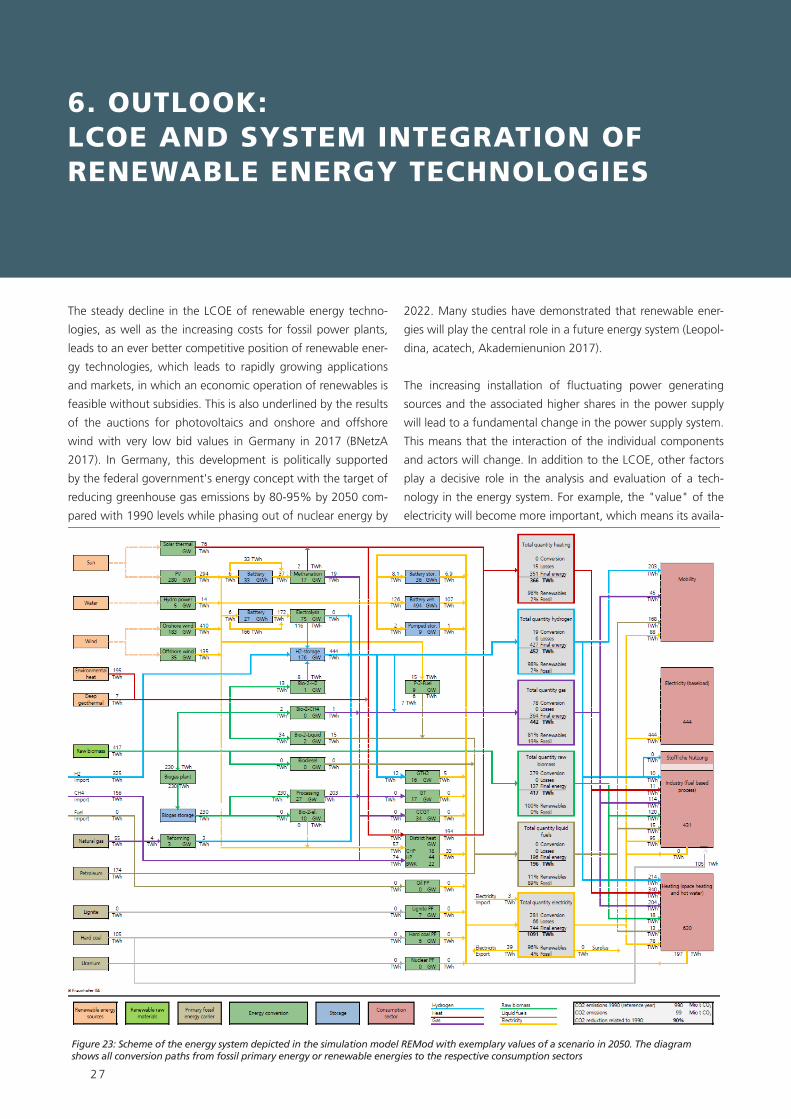
27
6. OUTLOOK: LCOE AND SYSTEM INTEGRATION OF RENEWABLE ENERGY TECHNOLOGIES
The steady decline in the LCOE of renewable energy techno-
logies, as well as the increasing costs for fossil power plants,
leads to an ever better competitive position of renewable ener-
gy technologies, which leads to rapidly growing applications
and markets, in which an economic operation of renewables is
feasible without subsidies. This is also underlined by the results
of the auctions for photovoltaics and onshore and offshore
wind with very low bid values in Germany in 2017 (BNetzA
2017). In Germany, this development is politically supported
by the federal government's energy concept with the target of
reducing greenhouse gas emissions by 80-95% by 2050 com-
pared with 1990 levels while phasing out of nuclear energy by
2022. Many studies have demonstrated that renewable ener-
gies will play the central role in a future energy system (Leopol-
dina, acatech, Akademienunion 2017).
The increasing installation of fluctuating power generating
sources and the associated higher shares in the power supply
will lead to a fundamental change in the power supply system.
This means that the interaction of the individual components
and actors will change. In addition to the LCOE, other factors
play a decisive role in the analysis and evaluation of a tech-
nology in the energy system. For example, the "value" of the
electricity will become more important, which means its availa-
Figure 23: Scheme of the energy system depicted in the simulation model REMod with exemplary values of a scenario in 2050. The diagram shows all conversion paths from fossil primary energy or renewable energies to the respective consumption sectors

28
bility in times of high demand, the controllability of plants and
the ability to take over system services such as the provision of
reactive power or the stabilization of frequency and voltage.
There are various possible combinations of how such an energy
system can be designed at the national, regional and local level.
Given the assumption that demand can be met at all times, ener-
gy system models can either provide a cross-sectoral energy sys-
tem for a set goal, such as CO2 reduction (see results of the RE-
Mod model (Henning and Palzer 2015, described in Henning and
Palzer (2013)), or for the electricity sector with a high share of re-
newable energy technologies (e.g. ENTIGRIS (www.entigris.org)).
The energy system model REMod, which has been developed at
Fraunhofer ISE, looks at the entire energy system, considering
the many different interfaces and points of contact between
the different sectors (electricity, heat, transport, industry etc.)
(see Figure 23). The basic functionality of the model REMod is
based on the cost-based structural optimization of an energy
supply system whose energy-related CO2 emissions do not ex-
ceed a given target value or target path. REMod calculates an
optimized transformation path, so that all relevant generators,
converters and consumers are dimensioned to minimum costs
and that the energy balance of the entire system is met at eve-
ry hour. Thus, a techno-economic evaluation of transformation
paths of the German energy system from today until the year
2050 can be carried out and the role of individual technologies
can be analyzed.
For an appropriate mapping of the development of renewa-
ble energy technologies, the spatial distribution of resources
should always be considered as an important factor, since dif-
ferent possibilities for investment in technologies arise for each
location. The energy system model ENTIGRIS is an optimization
model for the expansion of German and European electricity
sector, which can be used to analyze optimal distribution of
renewable and conventional power plants as well as grid ex-
pansion in high regional resolution (see figure 24).
To answer the question of how such a target system can be
achieved, it is important to identify the transformation pathway
of the energy system in achiving the target system. Various fac-
tors are important for the transformation: politically driven in-
centives, framework conditions or technical restrictions as well
as the economic viability of technologies. It is therefore impor-
tant to analyze the conditions which are favorable for an inves-
tor to invest in the different components of the energy system.
The LCOE and its development into the future can facilitate this
analysis and the investment decision making.
Figure 24: Development of installed capacity in Germany until 2050 as example results from the model ENTIGRIS (Heendeniya, C.B., 2017)

29
Calculation of LCOE
The method of Levelized Cost of Electricity (LCOE) allows a
comparison of power plants with different generating and cost
structures. The LCOE results from the comparison of all costs,
which arise throughout the lifetime of the power plant for the
construction and operating of the plant, with the sum of the
generated amount of energy throughout the life cycle. The cal-
culation can be conducted either on the basis of the net present
value method (NPV) or the so-called annuity method. When
applying the net present value method, the expenses for the in-
vestment, as well as the payment flows of revenues and expen-
ditures during the plant’s lifetime, are calculated by discounting
related to a shared reference date. For this purpose, the present
values of all expenses are divided by the present value of elec-
tricity generation. A discounting of power generation initially
seems incomprehensible from a physical point of view, but is
a consequence of financial mathematical transformations. The
underlying idea is that the generated electricity implicitly corre-
sponds to the revenue from the sale of this energy. Thus, the
further this income is in the future, the lower the associated
present value. The total annual expenditure throughout the
entire operating period consists of the investment expenditure
and the operating costs, which arise during the lifetime. For
the calculation of LCOE for new plants, the following applies
(Konstantin 2013):
LCOE Levelized Cost of Electricity in EUR/kWh
I0 Investment expenditure in EUR
At Annual total cost in EUR per year t
Mt, el Produced amount of electricity in kWh per year
i Real interest rate in %
n Economic lifetime in years
t Year of lifetime (1, 2, ... n)
The total annual costs are composed of fixed and variable costs
for the operation of the plant, maintenance, servicing, repairs
and insurance payments. The share of debt and equity can be
explicitly included in the analysis by the weighted average cost
of capital (WACC) over the discount factor (interest rate). The
discount factor depends on the amount of the equity, the re-
turn on equity over the lifetime, the borrowing costs and the
share of the contributed debt.
Furthermore, the following applies for the formula of the total
annual costs in the calculation of the LCOE:
Total Annual Costs At =
Fixed operating costs
+ Variable operating costs
(+ residual value/disposal of the plant)
Through discounting all expenditures and the quantity of elec-
tricity generated over the lifetime to the same reference date,
the comparability of the LCOE is assured.
The LCOE represents a comparative calculation on a cost ba-
sis and not a calculation of feed-in tariffs. These can only be
calculated by adding further influencing parameters. Self-con-
sumption regulations, tax legislation and realized revenues of
the operators complicate the calculation of a feed-in tariff from
the results of the LCOE. A further restriction arises from the fact
that a calculation of LCOE does not take into account the value
of the electricity produced within an energy system in a given
hour of the year. At this point, it is to be emphasized that this
method is an abstraction of reality aiming at making different
power plants comparable. The method is not suitable for deter-
mining the profitability of a specific plant. For this purpose, a
financial calculations, which takes into account all income and
expenditure with a cash flow model must be carried out.
The calculation of the LCOE using the annuity method can be
understood as a simplification of the NPV method and exists
in two different versions. On the one hand, the LCOE can be
7. APPENDIX

30
defined as the quotient of the annualized investment and ope-
rating costs and the average electricity yield. The calculation is
based on the following formula (Allan et al 2011, Gross et al
2007, Lai and McCulloch 2016):
The annuity factor (ANF) is calculated as follows:
In an even simpler version, the LCOE is calculated with the as-
sumption that the amount of electricity produced annually and
the annual operating costs are constant over the entire period
of observation (Brown et al 2015, Tegen et al., 2012):
Although the calculation of the LCOE based on the annuity
methods offers the advantage of a lower calculation effort,
depending on the selected input parameters, significant devi-
ations from the calculation using the NPV can occur. Since the
application of the NPV method for the calculation of the LCOE
best represents the reality, the LCOE in the present study are
calculated on the basis of the NPV method.
Learning curve models
In addition to the analysis of the LCOE for 2018, it is possible to
calculate the future development of plant prices and the corres-
ponding LCOE with the help of learning curves generated using
the market projections through 2020 and 2035. The learning
curve concept represents a relationship between the cumulative
produced quantity (market size) and the decreasing unit costs
(production costs) of a good. If the number of units doubles
and the costs decrease by 20%, this is called a Learning Rate
(LR) of 20% (Progress Ratio PR = 1 - learning rate). The relati-
onship between the quantity xt produced at the time t, the cost
C(xt) compared to the output quantity at the reference point x0
and the corresponding cost C (x0) and the learning parameter
b is as follows for the learning rate:
see Ferioli et al. (2009), Wright (1936).
By forecasting the system prices C(xt) for the considered period
using the learning curve models (assuming literature values for
LR or PR), the LCOE can thus be calculated by the year 2035. In
conjunction with market scenarios for the future years, respec-
tive annual figures can be assigned to the cumulated market
sizes, so that the development of LCOE can be predicted tem-
porally independent.
Evaluation of the methodology and use of LCOE
The LCOE has become a very practical and valuable comparati-
ve method to analyze different energy technologies in terms of
cost. The LCOE calculation method is internationally recognized
as a benchmark for assessing the economic viability of different
generation technologies as well as of individual projects and
enables the comparison of different energy technologies with
respect to their cost (Allan et al., 2011, p.23, Joskow 2011, p.
Lai and McCulloch 2016, p.2, Liu et al 2015, p.1531, Orioli and
Di Gangi 2015, p.1992). The high level of transparency and
clarity is one of the reasons why the cost metric has prevailed.
At the same time the method is able to reflect the key factors
of the production cost throughout the lifetime of the power
plant in just one number (Allan et al 2011, p 24; Díaz et al.,
2015, p 721; Tidball et al., 2010, p 59). From an economic
point of view, the LCOE contains the most important factors
contributing to the economic evaluation of a project (Myhr et
al., 2014, p. 715).
As LCOE is just one number, it causes a great reduction in com-
plexity and allows a quick and easy comparison of different
alternatives. In addition, the approach has a broad range for
its application (Branker et al., 2011, p. 4471, Ouyang and Lin
2014, p. 65). However, there are limits for this approach by
representing the project cost in a single number. For examp-
le, an analysis with the only focus on LCOE increases the risk
of a misinterpretation and a resulting wrong decision due to
the narrow viewpoint. The LCOE is also a method associated
with uncertainties. These can be explained primarily by the fact
that the calculation requires all values relating to the entire life-

31
time of the power plant, some of which must be predicted.
(Branker et al. 2011, p. 471) point out a further weak spot
that the calculation often focuses too strongly on the static
value of the electricity production costs, while the calculation
basis is not transparent. For this reason, it is important that the
assumptions for each calculation are sufficiently substantiated
and comprehensible. It has to be clear which cost drivers are
included. (Joskow 2011, p. 1) emphasizes that electricity is a
temporally heterogeneous good, which means that the value
of the electricity depends on the time at which it is generated.
The value of the electricity depends not only on the technolo-
gy used, but is also influenced by the interaction between the
power plants in a considered system. However, it is reasonable
to assume that the value which is calculated by using data of
the energy-only market today will be different in a system with
even higher shares of renewables. The value of CO2-free power
generation will increase significantly.
The LCOE can be used to support decision-making. However,
conclusive statements about the economic viability of a tech-
nology cannot be made on the basis of a single analysis with
the LCOE method. Still, it should be noted that the LCOE is a
cost-based figure and does not include revenues.

32
Data Appendix
Low Medium High2016 306 306 306
2017 410 410 410
2018 492 512 533
2019 585 630 682
2020 690 762 859
2021 808 915 1065
2022 937 1089 1311
2023 1078 1285 1599
2024 1229 1503 1935
2025 1389 1744 2322
2026 1555 2006 2763
2027 1726 2286 3261
2028 1899 2584 3815
2029 2070 2894 4426
2030 2236 3212 5090
2031 2403 3533 5802
2032 2572 3887 6557
2033 2739 4276 7344
2034 2903 4703 8151
2035 3048 5174 8967
Technology Learning rate (LR) Market scenario Variation of the LRs Variation of scenarios
PV rooftop small 15 % Medium scenario 20%, 10% ISE low, ISE high
PV rooftop big 15 % Medium scenario 20%, 10% ISE low, ISE high
PV Utility scale 15 % Medium scenario 20%, 10% ISE low, ISE high
Wind Onshore 5 % Onshore Wind moderate 8%, 3% GWEC 450S, GWEC Advanced
Wind Offshore 5 % Offshore Wind - -
CSP 7.5 % Average scenario 10%, 4% Sarasin 2010, Greenpeace 2009
Biogas - - - -
Brown coal - - - -
Hard coal - - - -
GuD - - - -
Gas turbines - - - -
Technology Scenario Source 20202035 (if not stated otherwise) [GW]
Applied in the calculations
Wind offshore Offshore Wind ISE, EWEAwind power 54 339 (2030) X
Wind onshore Onshore Wind moderatGWEC 2013, moderate
(adjusted by ISE)658 2196 X
Wind onshore Onshore Wind advancedGWEC 2013, advanced
(adjusted by ISE)879 2959
PV IEA Roadmap Vision IEA, 2010 390 1446
PV Medium-Scenario ISE 763 5174 X
PV EPIA Policy Driven EPIA, 2013 759 2695 (2030)
PV EPIA Business as Usual EPIA, 2013 464 1591 (2030)
PV Sarasin extrapolated Sarasin Bank, 2011 710 1853 (2030)
CSP Sarasin 2011 Sarasin Bank, 2011 32 91 (2030)
CSP Greenpeace 2009 Greenpeace 2009 69 231 (2030)
CSP Trieb 2009 Trieb et. al., 2009 16 150 (2030) X
CSP Current Policy SolarPACES, 2016 11 27 (2030)
CSP Moderate Policy SolarPACES, 2016 22 131 (2030)
Table 10: Development of the global cumulative installed capacity of PV [GW]
Table 11: Overview of the LR and the market scenarios of analyzed technologies
Table 12: Overview of the scenarios and expansion goals for PV, CSP and wind energy
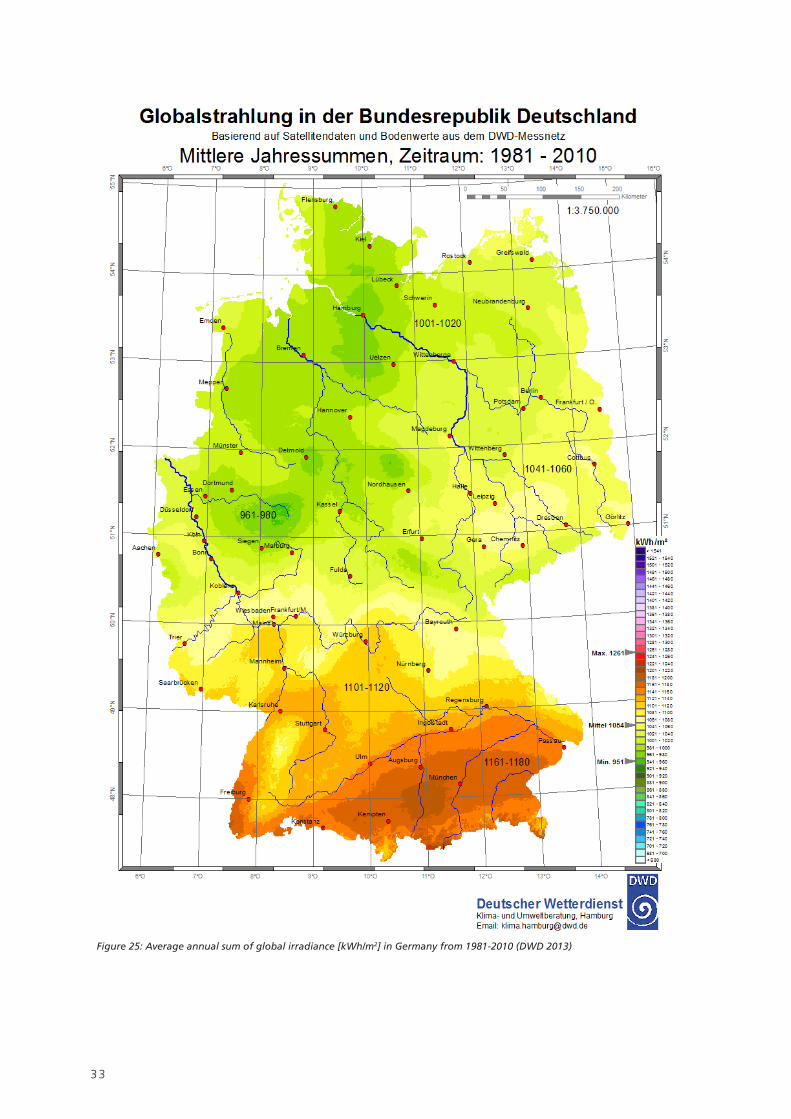
33
Figure 25: Average annual sum of global irradiance [kWh/m2] in Germany from 1981-2010 (DWD 2013)

34
8. REFERENCES
50Hertz Transmission GmbH; Amprion GmbH; TenneT TSO GmbH; TransnetBW GmbH (2013): Netzentwicklungsplan Strom 2013. Zweiter Ent-
wurf der Übertragungsnetzbetreiber.
50Hertz Transmission GmbH; Amprion GmbH; TenneT TSO GmbH; TransnetBW GmbH (2017): Netzentwicklungsplan Strom 2030, Version 2017.
Erster Entwurf der Übertragungsnetzbetreiber. Accessible Online at https://www.netzentwicklungsplan.de/sites/default/files/paragraphs-files/
NEP_2030_1_Entwurf_Teil1_0.pdf, checked last on 26.09.2017.
AEE (2015): Entwicklung der Preise für fossile Brennstoffe. Accessible Online at http://www.forschungsradar.de/fileadmin/content/bilder/Ver-
gleichsgrafiken/meta_brennstoffpreise_2015/AEE_Metaanalyse_Brennstoffpreise_okt15_fixed.pdf, checked last on 21.09.2017.
Allan, G.; Gilmartin, M.; McGregor, P.; Swales, K. (2011): Levelised costs of Wave and Tidal energy in the UK. Cost competitiveness and the im-
portance of “banded” Renewables Obligation Certificates. In: Energy Policy 39 (1), S. 23–39. DOI: 10.1016/j.enpol.2010.08.029.
BDEW (2017): BDEW-Strompreisanalyse Mai 2017. Haushalte und Industrie. Ed. v. BDEW. Accessible Online at https://www.bdew.de/media/do-
cuments/20170531_BDEW_Strompreisanalyse_Mai2017.pdf.
BMWI (2017a): Energiedaten: Gesamtausgabe. Accessible Online at https://www.bmwi.de/Redaktion/DE/Downloads/Energiedaten/energieda-
ten-gesamt-pdf-grafiken.pdf?__blob=publicationFile&v=28, checked last on 17.01.2018.
BMWI (2017b): Erneuerbare Energien in Zahlen 2017. Nationale und internationale Entwicklung im Jahr 2016. Accessible Online at https://www.bmwi.
de/Redaktion/DE/Publikationen/Energie/erneuerbare-energien-in-zahlen-2016.pdf?__blob=publicationFile&v=8, checked last on 18.01.2018.
BNetzA (2017): EEG-Umlage. Was ist die EEG-Umlage und wie funktioniert sie? Bundesnetzagentur. Accessible Online at https://www.bundes-
netzagentur.de/SharedDocs/FAQs/DE/Sachgebiete/Energie/Verbraucher/Energielexikon/EEGUmlage.html, checked last on Oktober 2017, checked
last on 31.10.2017.
BNetzA (2018): Kraftwersliste der Bundesnetzagentur. Accessible Online at http://www.bundesnetzagentur.de/DE/Sachgebiete/Elektrizitaetund-
Gas/Unternehmen_Institutionen/Versorgungssicherheit/Erzeugungskapazitaeten/Kraftwerksliste/kraftwerksliste-node.html, checked last on
17.01.2018.
Branker, K.; Pathak, M. J. M.; Pearce, J. M. (2011): A review of solar photovoltaic levelized cost of electricity. In: Renewable and Sustainable
Energy Reviews 15 (9), S. 4470–4482. DOI: 10.1016/j.rser.2011.07.104.
Brown, C.; Poudineh, R.; Foley, B. (2015): Achieving a cost-competitive offshore wind power industry. What is the most effective policy frame-
work? Oxford: The Oxford Institute for Energy Studies.
BSW (2018): Photovoltaik-Preismonitor Deutschland: Ergebnisse 1.Quartal; Bundesverband Solarwirtschaft e.V.
Burger, B. (2017): Stromerzeugung in Deutschland im ersten Halbjahr 2017. Fraunhofer-Institut für Solare Energiesysteme. Accessible Online
at https://www.ise.fraunhofer.de/content/dam/ise/de/documents/publications/studies/daten-zu-erneuerbaren-energien/Stromerzeugung_2017_
Halbjahr_1.pdf, checked last on 10.10.2017.

35
DFBZ (2010): Bioenergie heute und morgen - 11 Bereitstellungskonzepte. Sonderheft zum DBFZ Report. Unter Mitarbeit von Daniela Thrän, Kat-
ja Bunzel, Cornelia Viehmann, Daniel Büchner, Erik Fischer, Arne Gröngröft et al. Ed. v. Deutsches BiomasseForschungsZentrum. DFBZ.
DFBZ (2012): Monitoring zur Wirkung des Erneuerbare-Energien-Gesetz(EEG) auf die Entwicklung der Stromerzeugung aus Biomasse. Endbericht
zur EEG-Periode 2009 bis 2011. Unter Mitarbeit von Nadja Rensberg, Christiane Hennig, Karin Naumann, Eric Billig, Philipp Sauter, Jaqueline
Daniel-Gromke et al. Ed. v. Deutsches BiomasseForschungsZentrum und Thüringer Landesanstalt für Landwirtschaft. Accessible Online at https://
www.dbfz.de/fileadmin/eeg_monitoring/berichte/06_Monitoring_EB_Maerz_2012.pdf, checked last on 18.01.2018.
Díaz, G.; Gómez-Aleixandre, J.; Coto, J. (2015): Dynamic evaluation of the levelized cost of wind power generation. In: Energy Conversion and
Management 101, S. 721–729. DOI: 10.1016/j.enconman.2015.06.023.
DLR Rheinland-Pfalz (2017): Kalkulationsmuster Nachwachsende Rohstoffe für Biogasproduktion (Fiktive Bei-spiele). Accessible Online at http://
www.dlr.rlp.de/Internet/global/themen.nsf/0/eec1b5aef8ec06cdc125770a00275ee5/$FILE/Kalkulationsbeispiele_Kulturen_Juni_2017.pdf, che-
cked last on Juni 2017, checked last on 11.10.2017.
DW (2017): World Offshore Wind Market Forecast 2017-2026. Douglas Westwood. Accessible Online at http://www.douglas-westwood.com/
report/renewables/world-offshore-wind-market-forecast-2017-2026/, checked last on 14.10.2017.
DWD (2013), Strahlungskarte des Deutschen Wetterdienst: Globalstrahlung in der Bundesrepublik Deutschland, Mittlere Jahressummen, Zeit-
raum: 1981 – 2010, DWD, Abt. Klima- und Umweltberatung, Pf 30 11 90, 20304 Hamburg.
EIA (2017): Levelized Cost and Levelized Avoided Cost of New Generation Resources in the Annual Energy Outlook 2017. U.S. Energy Informati-
on Administration. Accessible Online at https://www.eia.gov/outlooks/aeo/pdf/electricity_generation.pdf, checked last on 30.10.2017.
Fachverband Biogas (2017): Biogas market data in Germany 2016/2017. Ed. v. Fachverband Biogas e.V. Accessible Online at https://www.biogas.org/
edcom/webfvb.nsf/id/DE_Branchenzahlen/$file/17-10-13_Biogasindustryfigures-2016-2017.pdf, checked last on 10.2017, checked last on 18.01.2018.
Ferioli, F.; Schoots, K.; van der Zwaan, B.C.C. (2009): Use and limitations of learning curves for energy technology policy. A component-learning
hypothesis. In: Energy Policy 37 (7), S. 2525–2535. DOI: 10.1016/j.enpol.2008.10.043.
Fraunhofer ISE (2017A): Energy Charts: Installierte Netto-Leistung zur Stromerzeugung in Deutschland. Fraunhofer-Institut für Solare Energiesysteme.
Accessible Online at https://www.energy-charts.de/power_inst_de.htm?year=2017&period=annual&type=power_inst, checked last on 03.05.2018.
Fraunhofer ISE (2018): Energy Charts: Jährliche Stromerzeugung in Deutschland in 2018. Fraunhofer Institut für Solare Energiesystem. Accessible
Online at https://www.energy-charts.de/energy_de.htm?source=all-sources&period=annual&year=2018, checked last on 17.01.2018.
Fraunhofer IWES (2018): Wind Monitor. Accessible Online at http://windmonitor.iwes.fraunhofer.de/windmonitor_de/3_Onshore/5_betriebser-
gebnisse/1_volllaststunden/, checked last on 17.01.2018.
Fraunhofer ISE (2017B): Photovoltaics Report. Freiburg. Accessible Online at https://www.ise.fraunhofer.de/content/dam/ise/de/documents/publi-
cations/studies/Photovoltaics-Report.pdf, checked last on 18.01.2018.
Greenpeace e. V. (2009): Concentrating Solar Power Global Outlook 09. Why Renewable Energy is Hot. Greenpeace e. V.
Greenpeace International; ESTELA; SolarPACES (2016): Solar Thermal Electricity. Global Outlook 2016. Unter Mitarbeit von Sven Teske, Janis
Leung, Luis Crespo, Marcel Bial, Elena Dufour und Christoph Richter. Ed. v. Greenpeace International, ESTELA und SolarPACES, checked last on
22.01.2018.
Gross, R.; Heptonstall, P.; Blyth, W. (2007): Investment in electricity generation: the role of costs, incentives and risks. A report produced by Im-
perial College Centre for Energy Policy and Technology (ICEPT) for the Technology and Policy Assessment Function of the UK Energy Research
Centre. Accessible Online at http://www.ukerc.ac.uk/publications/investment-in-electricity-generation-the-role-of-costs-incentives-and-risks.html,
checked last on 04.10.2017.
36
GWEC (2013): Global Wind Statistics 2012. Global Wind Energy Council. Accessible Online at https://www.gwec.net/wp-content/up-
loads/2013/02/GWEC-PRstats-2012_english.pdf, checked last on 18.01.2018.
GWEC (2017a): Cumulative market forecast by region 2017-2021. Global Wind Energy Council. Accessible Online at http://www.gwec.net/wp-con-
tent/uploads/2017/04/2_Cumulative-Market-Forecast-by-Region-2017-2021.jpg, checked last on April 2017, checked last on 22.10.2017.
GWEC (2017b): Global Wind Statistics 2016. Global Wind Energy Council. Accessible Online at http://www.gwec.net/wp-content/uploads/vip/
GWEC_PRstats2016_EN_WEB.pdf, checked last on 10.02.2017, checked last on 22.10.2017.
GWEC (2018): Global Statistics. Global Wind Energy Council. Accessible Online at http://gwec.net/global-figures/graphs/#, checked last on
03.05.2018.
Hecking, H.; Kruse, J.; Obermüller, F. (2017): Analyse eines EU-weiten Mindestpreises für CO2. Auswirkungen auf Emissionen, Kosten und Ren-
ten. ewi Energy Research & Scenarios gGmbH. Accessible Online at http://www.ewi.research-scenarios.de/cms/wp-content/uploads/2017/01/
Analyse-eines-EUweiten-Mindestpreises-f%C3%BCr-CO2.pdf, checked last on 05.10.2017.
Heendeniya, C.B. (2017): Modelling and evaluation of autonomous scenarios using cost minimized system optimization with a focus on electrici-
ty network. Masterthesis completed in Fraunhofer - Institut für Solare Energiesysteme ISE
Henning, Hans-Martin; Palzer, Andreas (2013): Studie: Energiesystem Deutschland 2050. Sektor- und Energieträgerübergreifende, modellbasierte
ganzheitliche Untersuchung zur langfristigen Reduktion energiebedingter CO2-Emissionen durch Energieeffizienz und den Einsatz Erneuerbarer
Energien. Fraunhofer-Institut für Solare Energiesysteme (ISE). Freiburg.
Henning, Hans-Martin; Palzer, Andreas (2015): Was kostet die Energiewende? – Wege zur Transformation des deutschen Energiesystems bis
2050. Fraunhofer-Institut für Solare Energiesysteme (ISE). Freiburg.
Hill, Joshua S. (2017): Global Solar Market Demand Expected To Reach 100 Gigawatts In 2017. Ed. v. Clean Technica. Accessible Online at htt-
ps://cleantechnica.com/2017/10/27/global-solar-market-demand-expected-reach-100-gw-2017-solarpower-europe/.
IEA (2017): World Energy Outlook-2017.
IAEA (2018): The Power Reactor Information System (PRIS). Accessible Online at https://www.iaea.org/pris/, checked last on 17.01.2018.
IRENA (2016): Innovation Outlook: Offshore Wind. International Renewable Energy Agency. Abu Dhabi. Accessible Online at http://www.irena.
org/DocumentDownloads/Publications/IRENA_Innovation_Outlook_Offshore_Wind_2016.pdf, checked last on 01.10.2017.
IRENA (2018): Renewable Energy Capacity Statistics 2018. Abu Dhabi. Accessible Online at http://www.irena.org/-/media/Files/IRENA/Agency/
Publication/2018/Mar/IRENA_RE_Capacity_Statistics_2018.pdf, checked last on 03.05.2018.
Joskow, P. L. (2011): Comparing the costs of intermittent and dispatchable electricity generating technologies. In: EUI Working Paper RSCAS 45.
Konstantin, P. (2013): Praxisbuch Energiewirtschaft. Energieumwandlung, -transport und -beschaffung im liberalisierten Markt. 3rd ed.
Dordrecht: Springer (VDI-Buch).
Kost, C.; Mayer, J. N.; Thomsen, J.; Hartmann, N.; Senkpiel, C.; Philipps, S.; Nold, S.; Lude, S.; Schlegl, T. (2013): Stromgestehungskosten Erneu-
erbare Energien. Studie - November 2013. Fraunhofer-Institut für Solare Energiesysteme ISE. Accessible Online at https://www.ise.fraunhofer.de/
de/veroeffentlichungen/studien/studie-stromgestehungskosten-erneuerbare-energien.html
Kost, C.; Schlegl, T. (2010): Stromgestehungskosten Erneuerbare Energien. Studie - Dezember 2010. Fraunhofer-Institut für Solare Energiesyste-
me ISE. Accessible Online at https://www.ise.fraunhofer.de/content/dam/ise/de/documents/publications/studies/DE2010_ISE_110706_Stromge-
stehungskosten_mit%20DB_CKost.pdf.
37
Kost, C.; Schlegl, T.; Thomsen, J.; Nold, S.; Mayer, J. (2012): Stromgestehungskosten Erneuerbare Energien. Studie - Mai 2012. Fraunhofer-
Institut für Solare Energiesysteme ISE. Accessible Online at https://www.fraunhofer.de/content/dam/zv/de/forschungsthemen/energie/studie-
stromgestehungskosten-erneuerbare-energien.pdf.
Lai, C. S.; McCulloch, M. D. (2016): Levelized Cost of Energy for PV and Grid Scale Energy Storage Systems. In: Computing Research Repository.
Accessible Online at http://arxiv.org/abs/1609.06000.
Leopoldina, acatech, Akademienunion (Ed.) (2017): Sektorkopplung – Optionen für die nächste Phase der Energiewende, ISBN: 978-3-8047-3672-6
Liu, Z.; Zhang, W.; Zhao, C.; Yuan, J. (2015): The Economics of Wind Power in China and Policy Implications. In: Energies 8 (2), S. 1529–1546.
DOI: 10.3390/en8021529.
Myhr, A.; Bjerkseter, C.; Ågotnes, A.; Nygaard, T. A. (2014): Levelised cost of energy for offshore floating wind turbines in a life cycle perspective.
In: Renewable Energy 66, S. 714–728. DOI: 10.1016/j.renene.2014.01.017.
Orioli, A.; Di Gangi, A. (2015): The recent change in the Italian policies for photovoltaics. Effects on the pay-back period and levelized cost of
electricity of grid-connected photovoltaic systems installed in urban contexts. In: Energy 93, S. 1989–2005. DOI: 10.1016/j.energy.2015.10.089.
Ouyang, X.; Lin, B. (2014): Levelized cost of electricity (LCOE) of renewable energies and required subsidies in China. In: Energy Policy 70, S.
64–73. DOI: 10.1016/j.enpol.2014.03.030.
Prognos AG (2013): Entwicklung von Stromproduktionskosten. Die Rolle von Freiflächen-Solarkraftwerken in der Energiewende. Prognos AG im
Auftrag der BELECTRIC Solarkraftwerke GmbH. Accessible Online at https://www.prognos.com/uploads/tx_atwpubdb/131010_Prognos_Belec-
tric_Studie_Freiflaechen_Solarkraftwerke_02.pdf, checked last on 21.10.2017.
PV magazine (2018): India second largest solar market on back of 113 GW global installations. Accessible Online at https://www.pv-magazine.
com/2018/04/05/2018-india-second-largest-solar-market-on-back-of-113-gw-global-installations/, checked last on 09.05.2018
pvXchange (2018): www.pvxchange.com
Reich, Nils H.; Mueller, Bjoern; Armbruster, Alfons; van Sark, Wilfried G. J. H. M.; Kiefer, Klaus; Reise, Christian (2012): Performance ratio revisi-
ted. Is PR > 90% realistic? In: Prog. Photovolt: Res. Appl. 20 (6), S. 717–726. DOI: 10.1002/pip.1219.
REN21 (2017): Renewables 2017 Global Status Report. Paris: REN21 Secretariat. Accessible Online at http://www.ren21.net/wp-content/up-
loads/2017/06/17-8399_GSR_2017_Full_Report_0621_Opt.pdf, checked last on 18.01.2018.
Reuter, A.; Elsner, P. (2016): Windkraftanlagen. Technologiesteckbrief zur Analyse „Flexibilitätskonzepte für die Stromversorgung 2050“. acatech
– Deutsche Akademie der Technikwissenschaften e. V. (Federführung); Deutsche Akademie der Naturforscher Leopoldina e. V.; Union der deut-
schen Akademien der Wissenschaften e. V. (Energiesysteme der Zukunft). Accessible Online at http://www.acatech.de/fileadmin/user_upload/
Baumstruktur_nach_Website/Acatech/root/de/Publikationen/Materialien/ESYS_Technologiesteckbrief_Windkraftanlagen.pdf, checked last on
11.10.2017.
Sarasin Bank (2011): Solarwirtschaft: Hartes Marktumfeld – Kampf um die Spitzenplätze. Studie der Sarasin Bank.
Scheftelowitz, M.; Lauer, M.; Trommler, M.; Barchmann, T.; Thrän, D. (2016): Entwicklung eines Ausschrei-bungsdesigns für Biomasse im Rah-
men des EEG 2017. Deutsches Biomasseforschungszentrum im Auftrag vom Bundesministerium für Ernährung und Landwirtschaft. Accessible
Online at https://www.dbfz.de/fileadmin/user_upload/Referenzen/Studien/Ausschreibungsdesign_Biomasse_EEG_2016_Endbericht.pdf, checked
last on 08.10.2017.
Schlesinger, M.; Lindenberger, D.; Lutz, C. (2014): Entwicklung der Energiemärkte – Energiereferenzprognose. Studie im Auftrag des Bundes-
ministeriums für Wirtschaft und Technologie. Accessible Online at https://www.bmwi.de/Redaktion/DE/Publikationen/Studien/entwicklung-der-
energiemaerkte-energiereferenzprognose-endbericht.pdf?__blob=publicationFile&v=7, checked last on 21.09.2017.
38
Schneider M.; Forggatt, A. (2013): The World Nuclear Industry Status Report 2013. Unter Mitarbeit von K. Hosokawa, S. Thomas, Y. Yamaguchi
und J. Hazemann. Paris,London. Accessible Online at https://www.worldnuclearreport.org/IMG/pdf/20130716msc-worldnuclearreport2013-lr-
v4.pdf, checked last on 18.01.2018.
Scholwin, F.; Trommler, M.; Rensberg, N.; Krautz, A.; Henning, C.; Zimmer, Y. et al. (2011): Nachhaltige Bio-gaserzeugung in Deutschland –
Bewertung der Wirkungen des EEG. Endbericht, im Auftrag des BMELV (Bun-desministerium für Ernährung, Landwirtschaft und Verbraucher-
schutz). Deutsches BiomasseForschungsZent-rum; Leipzig, Johann Heinrich von Thünen Institut; Braunschweig, Thüringer Landesanstalt für
Landwirtschaft (TLL), Jena, Kuratorium für Technik, Bauwesen und Landwirtschaft. Darmstadt.
Stenull, M.; Härdtlein, M.; Eltrop, L.; Dederer, M.; Messner. J. (2011): Mobilisierung von Effizienzreserven aus Biogasanlagen in Baden-Württem-
berg. Ergebnisse aus einer Umfrage für das Betriebsjahr 2009. Ed. v. Universität Stuttgart und Institut für Energiewirtschaft und Rationelle Ener-
gieanwendung.
Taumann, M. (2012): Modellierung des Zubaus erneuerbarer Stromerzeugungstechnologien in Deutschland. Masterthesis. angefertigt am Fraun-
hofer-Institut für Solare Energiesysteme ISE.
Tegen, S.; Hand, M.; Maples, B.; Lantz, E.; Schwabe P.; Smith, A. (2012): 2010 Cost of Wind Energy Review. National Renewable Energy Labora-
tory. Accessible Online at https://www.nrel.gov/docs/fy12osti/52920.pdf, checked last on 27.09.2017.
Tidball, R.; Bluestein, J.; Rodriguez, N.; Knoke, S. (2010): Cost and Performance Assumptions for Modeling Electricity Generation Technologies.
National Renewable Energy Laboratory. Accessible Online at https://www.nrel.gov/docs/fy11osti/48595.pdf, checked last on 26.09.2017.
Trieb, Franz; O'Sullivan, Marlene; Pregger, Thomas; Schillings, Christoph; Krewitt, Wolfram (2009): Characterisation of Solar Electricity Import
Corridors from MENA to Europe. Potential, Infrastructure and Cost. DLR.
Trieb, Franz; O'Sullivan, Marlene; Pregger, Thomas; Schillings, Christoph; Krewitt, Wolfram (2009): Characterisation of Solar Electricity Import
Corridors from MENA to Europe. Potential, Infrastructure and Cost. DLR.
Viebahn, Peter; Kronshage, Stefan; Trieb, Franz; Lechon, Yolanda (2008): Final report concentrating solar thermal power plants. Deliverable n°
12.2 - RS la. DLR; CIEMAT.
Wiesenfarth, M.; Philipps, Simon P.; Bett, Andreas W.; Horowitz, Kelsey; Kurtz, Sarah (2017): Current Status of Concentrator Photovoltaic (CPV)
Technology. Version 1.3. Fraunhofer-Institut für Solare Energiesysteme; National Renewable Energy Laboratory. Accessible Online at https://
www.ise.fraunhofer.de/content/dam/ise/de/documents/publications/studies/cpv-report-ise-nrel.pdf, checked last on 18.01.2018.
Wietschel, Martin; Arens, Marlene; Dötsch, Christian; Herkel, Sebastian (2010): Energietechnologien 2050 - Schwerpunkte für Forschung und
Entwicklung. Technologienbericht. Stuttgart: Fraunhofer Verlag (ISI-Schriftenreihe Innovationspotenziale, 0).
Wirth, H. (2017): Aktuelle Fakten zur Photovoltaik in Deutschland. Fraunhofer-Institut für Solare Energiesysteme. Accessible Online at https://
www.ise.fraunhofer.de/content/dam/ise/de/documents/publications/studies/aktuelle-fakten-zur-photovoltaik-in-deutschland.pdf, checked last on
25.10.2017.
World Bank (2017): World Bank Commodities Price Forecast. Accessible Online at http://pubdocs.worldbank.org/en/926111485188873241/
CMO-January-2017-Forecasts.pdf, checked last on 03.08.2017.
World Energy Council (2016): World Energy Resources. Wind | 2016. Accessible Online at https://www.worldenergy.org/wp-content/up-
loads/2017/03/WEResources_Wind_2016.pdf, checked last on 30.10.2017.
Wright, T. P. (1936): Factors Affecting the Cost of Airplanes. In: Journal of the Aeronautical Sciences 3 (4), S. 122–128. DOI: 10.2514/8.155.

39
ENERGY SYSTEM ANALYSIS AT THE FRAUNHOFER ISE
In recent years, renewable energy technologies have undergo-
ne a vertiginous development: The prices have dropped signi-
ficantly, while at the same time the installed capacity of rene-
wable energy technologies has increased strongly. Worldwide,
renewable energy technologies, especially photovoltaics and
wind power have not merely become an important sector of
the energy industry but are, through their growth, contributing
to major changes in the energy system.
New, interesting questions arise from this change, questions
primarily focused on the integration and the interaction of the
renewable energy technologies in the system: How can the
cost-effective use of renewable energy technologies be achie-
ved in various regions? How can different technologies be com-
bined in order to optimally cover the need for energy? How will
the energy system as a whole develop? At what points must
this development be supported by the state?
Fraunhofer ISE addresses these questions with a variety of
answers in the following focus areas of the division:
� Techno-Economic Assessment of Energy Technologies
� Market Analysis and Business Models
� Planning and Operating Strategies of Power Plants
� National and Regional Energy Supply Concepts
� Modeling of Energy Supply Scenarios
At Fraunhofer ISE, various energy technologies are analyzed
from technical and economic viewpoints, for example on the
basis of the LCOE. Furthermore, it is possible to optimally de-
sign the use of renewable energy technologies for a power
plant park, a state or a region by studying the interaction of the
components with respect to specific target criteria.
The business area Energy System Analysis studies the transfor-
mation of the energy system by very different methodological
approaches: On the one hand, a multi-sector target system for
a specific CO2 reduction goal can be identified according to
minimum costs to the national economy. On the other hand,
investment decision models can be used to show how the sys-
tem will develop under certain framing conditions and how the
interaction of the components in the energy system works. This
way, our models can offer a solid foundation for decisions con-
cerning the framing conditions of any future energy supply.
An additional pillar of the business field of Energy System Ana-
lysis is the development of business models under consideration
of altered framing conditions in different markets. We develop
options for a more frequent usage of renewable energy techno-
logies in the future, even in countries where they have not been
widely disseminated to date. This way, Fraunhofer ISE offers a
comprehensive method of analysis as well as research and stu-
dies on technological and economic issues in order to master
the challenges presented by a changing energy system.
Further information and persons of contact are available:
www.ise.fraunhofer.de/en/business-areas/energy-system-analysis

40
F R A U N H O F E R I N S T I T U T E F O R S O L A R E N E R G Y S Y S T E M
Contact person:
Dr. Christoph Kost
Head of Business Area Energy System Analysis:
Dr. Thomas Schlegl
Fraunhofer Institute for Solar Energy System
Heidenhofstraße 2
79110 Freiburg
www.ise.fraunhofer.de
Directors of Institute:
Prof. Dr. Hans-Martin Henning
Dr. Andreas Bett