Embed Size (px)
Citation preview

Published as: K. Branker, M. J.M. Pathak, J. M. Pearce, “A Review of Solar Photovoltaic Levelized Cost of Electricity”, Renewable & Sustainable Energy Reviews 15, pp.4470-4482 (2011). http://dx.doi.org/10.1016/j.rser.2011.07.104
A Review of Solar Photovoltaic Levelized Cost of Electricity
K. Branker, M. J. M. Pathak, J. M. Pearce
Abstract
As the solar photovoltaic (PV) matures, the economic feasibility of PV projects are increasingly being evaluated using the levelized cost of electricity (LCOE) generation in order to be compared to other electricity generation technologies. Unfortunately, there is lack of clarity of reporting assumptions, justifications and degree of completeness in LCOE calculations, which produces widely varying and contradictory results. This paper reviews the methodology of properly calculating the LCOE for solar PV, correcting the misconceptions made in the assumptions found throughout the literature. Then a template is provided for better reporting of LCOE results for PV needed to influence policy mandates or make invest decisions. A numerical example is provided with variable ranges to test sensitivity, allowing for conclusions to be drawn on the most important variables. Grid parity is considered when the LCOE of solar PV is comparable with grid electrical prices of conventional technologies and is the industry target for cost-effectiveness. Given the state of the art in the technology and favorable financing terms it is clear that PV has already obtained grid parity in specific locations and as installed costs continue to decline, grid electricity prices continue to escalate, and industry experience increases, PV will become an increasingly economically advantageous source of electricity over expanding geographical regions.
Keywords photovoltaic; levelized cost; LCOE; grid parity; solar economics
1. Introduction
It is technically feasible for renewable energy technologies (RETs) to replace the present fossil fuel electricity infrastructure [1, 2], however, economic barriers remain the primary impediment to a renewable-powered society. Solar photovoltaic (PV) technology, which converts sunlight directly into electricity, is one of the fastest growing RETs in the world [3,4]. PV is considered a clean, sustainable, renewable energy conversion technology that can help meet the energy demands of the world’s growing population, whilst reducing the adverse anthropogenic impacts of fossil fuel use [5-7]. From 2000 to 2010, global solar PV deployment has increased from 0.26 GW to 16.1 GW1 [8] with an annual growth rate of more than 40% [3, 9-11], due to both technological innovations that have reduced manufacturing costs by 100 times and various government incentives for consumers and producers [3, 4, 11-15].
Despite increased incentives and the demand for more sustainable forms of energy, PV has still not become a major energy supply contributor [3, 16]. The tipping point for solar PV adoption is
1
Published as: K. Branker, M. J.M. Pathak, J. M. Pearce, “A Review of Solar Photovoltaic Levelized Cost of Electricity”, Renewable & Sustainable Energy Reviews 15, pp.4470-4482 (2011). http://dx.doi.org/10.1016/j.rser.2011.07.104
considered to be when the technology achieves grid parity [17-21] given that conventional-powered electricity prices are rising whilst PV installed prices are falling. 'Grid parity' refers to the lifetime generation cost of the electricity from PV being comparable with the electricity prices for conventional sources on the grid [13,15, 17-20, 22-24] often graphically given as the industry average for solar PV electricity generation against the average electricity price for a given country. Whilst this is a useful benchmark, its validity depends on the completeness and accuracy of the method used to calculate the lifetime generation cost of solar PV electricity. In addition, claims of grid parity at manufacturing cost instead of retail price have contributed to confusion [15]. The economic feasibility of an energy generation project can be evaluated using various metrics [15, 25-28], but the levelized cost of electricity (LCOE) generation is most often used when comparing electricity generation technologies or considering grid parity for emerging technologies such as PV [9, 11, 13, 15, 17, 19, 22, 24, 28-32]. Unfortunately, the LCOE method is deceptively straightforward and there is lack of clarity of reporting assumptions, justifications showing understanding of the assumptions and degree of completeness, which produces widely varying results [3, 10, 15, 25, 30, 32-38]. The concept of grid parity for solar PV represents a complex relationship between local prices of electricity, solar PV system price which depends on size and supplier, and geographical attributes [11, 13, 17, 19, 21]. Different levels of cost inclusion and sweeping assumptions across different technologies result in different costs estimated for even the same location. In addition, the trend of eliminating avoidable costs for consumers and folding them into customer charges can mask real costs of conventional technologies [39]. Reporting the wrong LCOE values for technologies can result in not only sub-optimal decisions for a specific project, but can also misguide policy initiatives at the local and global scale. In the solar case for example, it is still a common misconception that solar PV technology has a short life and is therefore extremely expensive in the long term [20, 21, 40, 41]. Yet, depending on the location, the cost of solar PV has already dropped below that of conventional sources achieving grid parity [3, 18, 20 - 22, 42, 43]. Since varying estimates exist for LCOE, this paper reviews the methodology of calculating the LCOE for solar PV, correcting the misconceptions made in the assumptions and provides a template for better reporting needed to influence the correct policy mandates. A simple numerical example is provided with variable ranges to test sensitivity, allowing for conclusions to be drawn on the most important variables.
2. Review of the Cost of Electricity and LCOE
A clear understanding of the relative cost-effectiveness and feasibility of different energy technologies is paramount in determining energy management policies for any nation. The actual electricity prices depend on the marginal cost of electricity generated by the given power plant and market-based or regulatory measures [26, 44, 45]. Various power plants can compete to supply electricity at different bids, such that the electricity price from suppliers varies depending on the accepted bid and technology [26, 46]. To reduce this volatility, calculations are used by retailers to assume a fixed or tiered system that is predictable for consumers and that accounts for any volatility in the supplied electricity price, upgrades to the grid system and other administrative duties [26, 39, 44]. Thus the final electricity price paid by consumers will be different from the cost of generation [19, 47].
2

Published as: K. Branker, M. J.M. Pathak, J. M. Pearce, “A Review of Solar Photovoltaic Levelized Cost of Electricity”, Renewable & Sustainable Energy Reviews 15, pp.4470-4482 (2011). http://dx.doi.org/10.1016/j.rser.2011.07.104
The LCOE methodology is an abstraction from reality and is used as a benchmarking or ranking tool to assess the cost-effectiveness of different energy generation technologies [19, 27,32]. The abstraction is made to remove biases between the technologies. The method considers the lifetime generated energy and costs to estimate a price per unit energy generated. The method usually does not include risks and different actual financing methods available for the different technologies [26, 32, 48]. For example, a feed in tariff (FIT) takes away the price risk for RETs by guaranteeing the price to be paid for energy generated by the source, but does not necessarily take away the financing risk for the technology, which is still a hurdle. Rather all technologies should be given the same economic analysis, with the only difference being the actual costs, energy produced and lifetime [27]. Conceptual parallels with reality can be drawn if the scenarios closest to reality are chosen.
Recognizing that LCOE is a benchmarking tool, there is high sensitivity to the assumptions made, especially when extrapolated several years into the future [27, 30, 32, 41, 49, 50]. Thus, if used to consider policy initiatives, assumptions should be made as accurately as possible, with respective sensitivity analysis (e.g. Monte Carlo) and justifications [30]. Ordinarily, LCOE is a static measure that looks at a snapshot in deriving the price per generated energy, whilst true markets prices are dynamic. The SolarBuzz solar price index (electricity, system and module prices) attempts to report a monthly dynamic LCOE, although the assumptions should be understood and it represents an average for specific circumstances [31]. It should be stressed that the type of financing is usually kept the same for all technologies, even though real markets would finance them differently. In addition, economic and financial systems have a large impact on the price of electricity, although the quality of electricity rarely changes, which is often not reflected by the LCOE. Finally, the technological assumptions often used are generalized for the given equipment set up. Costs and electricity generated can vary based on location, capacity for generation, complexity, efficiency, operation, plant lifetime and other factors [18, 19, 51]. The efficiencies and lifetime are taken as given, but do not necessarily reflect the actual specifications and performance in the field. The usual criticisms of the misuse of the LCOE is that agents use outdated data, do not consider the real plant utilization of the technology, do not capture the correct lifetime of the plant and do not account for the full costs of the plant, such as de-commissioning, carbon and other environmental costs, insurance subsidies (nuclear) and fuel subsidies (fossil) [32, 52, 53].
Improvements to the LCOE for solar PV can be made once realistic assumptions and justifications are given, real financing variability is considered, and consideration is made for technological and geographical variability. Understanding the true costs, energy production and system specifications would improve the capabilities of LCOE software like the Solar Advisor Model (SAM).
2.1 Estimates for Solar PV LCOE
In general, estimates for LCOE for solar PV tend to be fairly high compared to alternatives based on common assumptions [3, 4, 10, 11, 14, 15, 18,19, 25, 32 - 34, 36, 37, 41, 49, 54 - 62]. Note that these studies are all highly time dependent as the cost of PV has dropped dramatically in the last several years [9, 11, 18, 19, 49]. One of the most clear recent LCOE reports was completed
3

Published as: K. Branker, M. J.M. Pathak, J. M. Pearce, “A Review of Solar Photovoltaic Levelized Cost of Electricity”, Renewable & Sustainable Energy Reviews 15, pp.4470-4482 (2011). http://dx.doi.org/10.1016/j.rser.2011.07.104
by the California Energy Commission in 2010 [14]. Although the report lumps solar PV technologies with a life of only 20 years, its merits include a range of cost estimates, projections for variables allowing forward looking values, a range of project types (Merchant, IOU: investor-owned utilities, POU: publicly owned utilities) and a consistent set of assumptions with detailed justifications and limitations. It should be noted that this report has already demonstrated that solar PV can be less expensive than traditional energy sources in California when considering peak power natural gas plants. Another recent reliable report is Lazard’s LCOE consulting report, which lists all the key assumptions made in the analysis of all technologies (PV is split into the two dominant technologies, thin-film and crystalline silicon), considering price ranges, effect of incentives and effect of carbon emission costs [58].
The Ontario Power Authority (OPA) in Canada considered LCOE (through a method called levelized unit electricity cost or LUEC) as the price (escalating with inflation) that would be paid to a generator that equals the present value direct costs (construction, operation and decommissioning) for the energy generated over the plant’s lifetime and included connection and transmission costs [63]. Apart from having no estimates made for solar PV, a report by Gibson et al. [53] outlined several deficiencies in the LUEC method including not fully capturing current and future costs so that the method cannot be considered an ‘all-inclusive’ cost analysis. It should also be pointed out that the OPA LUEC analysis as part of the Integrated Power system plan like many other LCOEs ignores biophysical, social and economic externalities associated with different supply mix options [53].
Table 1 summarizes several solar PV LCOE results in North America since 2004 for variables including technology, year, plant specifications, lifetime, loan and incentives, and location roughly ordered from best to worst in terms of reporting and methodology, showing that solar PV gets a 20 to 25 year lifespan in most studies with 30 years considered for projections. As can be seen in Table 1, the LCOE results vary by more than a factor of four and many do not fully cover assumptions. From the survey, it is clear that better reporting of LCOE assumptions and justification is required even for the relatively few variables chosen. Some studies quote a value from elsewhere without restating the major assumptions or case being represented [3, 4, 33, 36, 37]. This paper attempts to improve the assumptions used and the clarity of the LCOE methodology.
Table 1: Summary of LCOE estimated from various sources in North America
3. LCOE Methodology
In this paper, the LCOE of solar PV will be reviewed and clarified and a correct methodology will be demonstrated for a case study in Canada, where few LCOE calculations have been done for solar PV when considering energy management strategies [37, 63]. Calculating the LCOE requires considering the cost of the energy generating system and the energy generated over its lifetime to provide a cost in $/kWh (or $/MWh or cents/kWh) [27, 30, 32, 34, 49]. Many have
4
Published as: K. Branker, M. J.M. Pathak, J. M. Pearce, “A Review of Solar Photovoltaic Levelized Cost of Electricity”, Renewable & Sustainable Energy Reviews 15, pp.4470-4482 (2011). http://dx.doi.org/10.1016/j.rser.2011.07.104
noted that LCOE methodology is very sensitive to the input assumptions, such that it is customary to perform a sensitivity analysis [30, 32, 65] to account for any uncertainty. The general calculation method for LCOE is expressed by equations 1-3 [18, 27, 30, 32, 34, 35, 49, 66] whilst more complicated expressions can be pursued in Darling et al., [30] and Short [27]. Table 2 summarizes the nomenclature.
Table 2: LCOE Calculation Nomenclature
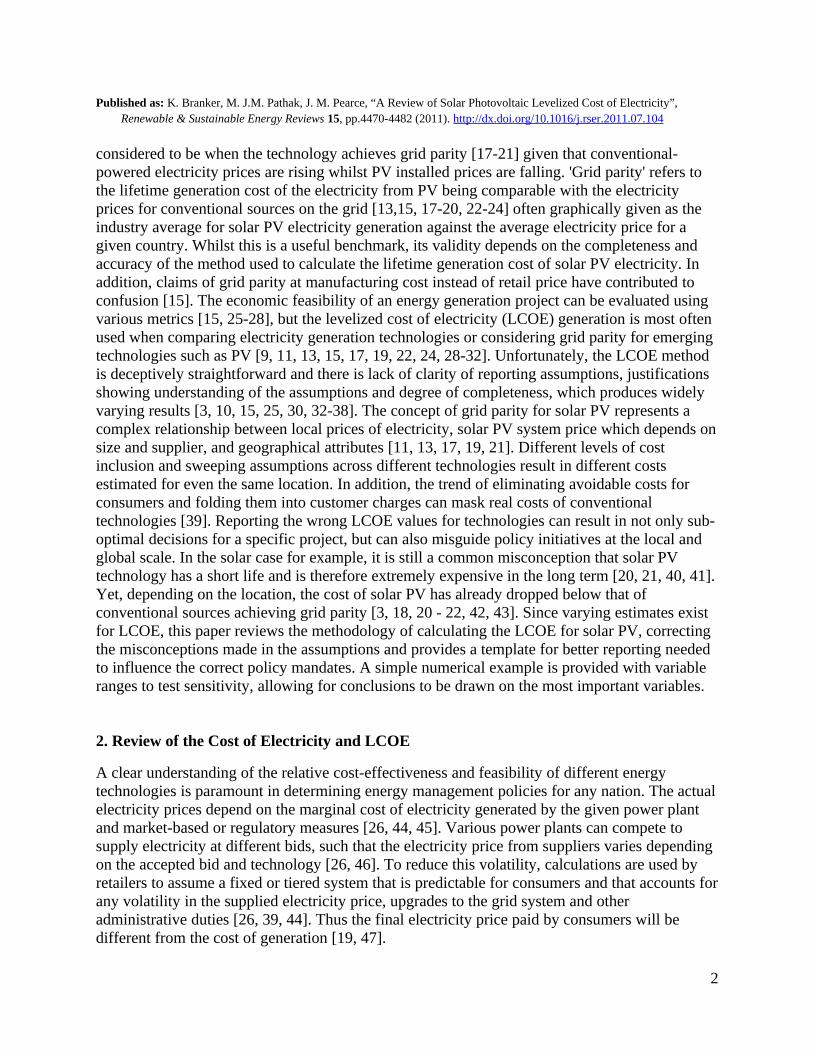
The sum of the present value LCOE multiplied by the energy generated should be equal to the present valued net costs [adapted from 27, 32,49] in Eq. 1. It should be noted that the summation calculation starts from t=0 to include the project cost at the beginning of the first year that is not discounted and there is no system energy output to be degraded. Other methods can include the initial cost or down payment outside the summation, with t starting from 1.
(1)
Rearranging, the LCOE can be found explicitly assuming a constant value per year in Eq. 2.
(2)
Finally, the net costs will include cash outflows like the initial investment (via equity or debt financing), interest payments if debt financed, operation and maintenance costs (note: there are no fuel costs for solar PV) and cash inflow such as government incentives as shown in Eq. 3. As such, the net cost term can be modified for financing, taxation and incentives as an extension of the initial definition [30, 65]. If LCOE is to be used to compare to grid prices, it must include all costs required (including transmission and connection fees if applicable) and must be dynamic with future projects acknowledged in the sensitivity analysis. In this paper, no incentives will be considered.
(3)
5
Published as: K. Branker, M. J.M. Pathak, J. M. Pearce, “A Review of Solar Photovoltaic Levelized Cost of Electricity”, Renewable & Sustainable Energy Reviews 15, pp.4470-4482 (2011). http://dx.doi.org/10.1016/j.rser.2011.07.104
Note that whilst it appears as if the energy is being discounted, it is just an arithmetic result of rearranging Eq. 1. The energy generated in a given year (Et) is the rated energy output per year (St) multiplied by the degradation factor (1- d) which decreases the energy with time. The rated energy output per year can be determined by multiplying the system size/capacity in kW by the local solar insolation that takes capacity factor into account in the units: kWh/kW/yr1. Traditionally, this value is determined by multiplying the number of days in the year by average number of hours per year the solar PV system operates by system size to get the final units of kWh/yr.
The major generation cost for solar PV is the upfront cost and the cost of financing the initial investment, which means the LCOE is very dependent on the financing methods available and manufacturing cost reductions. Thus it has been argued that policy and initiatives must focus on this hurdle to make distributed residential solar PV affordable [8, 9, 15, 19, 28, 49, 55, 56]. When surveying the estimates as seen in Table 1, residential PV systems tend to have the more expensive LCOE due to lacking economies of scale [11, 38, 67], despite amortization facilities and lack of interconnection cost compared to utility scale PV [19]. The majority of this paper will consider costs in the context of residential systems whilst other papers like [30] cover utility scale.
3. Addressing Major Misconceptions and Assumptions in LCOE for Solar PV
The main assumptions made in the LCOE calculation is the choice of discount rate, average system price, financing method, average system lifetime and degradation of energy generation over the lifetime.
3.1 Discount Rate
Firstly, the choice of discount rate comes with ample uncertainty and this is dealt with using sensitivity analysis. The concept of discount rate puts a value on time preference on money, which varies by circumstance, location, and the time period considered. Furthermore, some investors vary their discount rate between technologies to reflect their perception of its financial risks [OECD/IEA, 2005]. The choice of discount rate can largely effect which energy technologies are relatively more competitive [49]. The private sector favours higher discount rates to maximize short term profit, but these may be too high to capture the benefits of long term social endeavours undertaken in the public sector, such as infrastructure and energy projects [49]. Governments often estimate a social discount rate for rating public projects that have long-term social benefit. For example, in Ontario, Canada, the real social discount rate (SDR) range used is 2% to 8%, with an individual’s SDR being 3.5% to 4.5% [63]. Finally, there is a distinction between real and nominal discount rate where inflation is included in the nominal rate [30].
3.2 System Costs, Financing and Incentives
6

Published as: K. Branker, M. J.M. Pathak, J. M. Pearce, “A Review of Solar Photovoltaic Levelized Cost of Electricity”, Renewable & Sustainable Energy Reviews 15, pp.4470-4482 (2011). http://dx.doi.org/10.1016/j.rser.2011.07.104
In general, for the solar PV system costs, there are the ‘project’ costs associated with actual system, its design and installation; ‘administrative’ costs such as insurance and interconnection; ‘financing’ costs associated with the financing method and ‘public’ costs associated with taxes. However, what is not often considered in all power generation technologies are the economic, environmental and health cost of negative externalities2. The system price, apart from capacity and manufacturing variability, is highly dependent on the type of solar PV system and location and type of the dwelling. For example, in general, a thin-film system is less costly per unit power than a crystalline silicon system [68]. Inverters have variable prices, types and lives and the type of racking and installation needed depends on the house. None-the-less, most LCOE studies report an average for solar PV, not distinguishing between different technology types and balance of system (BOS) costs. If averaging needs to be made for simplification, then the assumptions made and how common they are should be reported [such as in 67]. In general, the BOS and labour costs represents 50% of the system cost [67], but strategies are being developed to halve these compared to best practice [69]. Solar manufacturing prices have been rapidly declining with economies of scale through turn-key manufacturing facilities and industrial symbiosis [68, 70, 71]. Inverter life and warranties are being extended to 10 years [11, 72] and micro-inverters may provide an economical choice for residential systems, which may suffer from partial shading challenges [73, 74]. Finally, installation costs will decrease with technological experience, although not as drastically [15]. Recent estimated installed system costs are summarized in Table 3. It should be noted that average installed costs for residential systems are lower in Germany and Japan than in the United States [67].
Table 3: Summary of recent Solar PV installed system costs
Depending on an individual’s credit history and the country’s taxation system, different financing methods can be used. Financing can come in the form of loans, a second mortgage, government incentives, third party financing and equity financing. Debt financing (loans or mortgages) is usually preferable since interest payments are non-taxable in some systems and it allows spreading the cost of the system over a longer period. Furthermore, if the solar PV system is recognized by a feed-in-tariff program, the income can be recognized as business activities for which the system can be used against taxes via the capital cost allowance in asset depreciation [67]. Finally, although many are adverse to a second mortgage, amortization allows for a longer loan term than usual loans (up to 40 years). This is important given the long working life of a solar PV system (greater than 20 years). As a proven technology, solar PV should be able to obtain similar financing methods as other energy technologies, although this is not necessarily the case in all circumstances as was recently shown in the difficulties for some developers to find financing for projects under the Ontario FIT.
The loan method effect on LCOE was recently considered by Singh and Singh [28]. They indicated that the LCOE value is static, whilst the actual cost of electricity increases, which result in the wrong conclusions for grid parity. Further, the loan period is for the guarantee
7
Published as: K. Branker, M. J.M. Pathak, J. M. Pearce, “A Review of Solar Photovoltaic Levelized Cost of Electricity”, Renewable & Sustainable Energy Reviews 15, pp.4470-4482 (2011). http://dx.doi.org/10.1016/j.rser.2011.07.104
period and not the working life of the PV system. A graduated payment instead of an equated payment loan was suggested to allow the LCOE of the solar PV to escalate like grid electricity. Thus, the present day LCOE would be lower than with the traditional loan method, increasing as the standard of living of the individual increased. The new loan method was suggested since simply extending the loan term did not reduce the LCOE significantly [28]. Whilst the analysis was not done for a specific system, the new loan method was done for different terms, interest rates and escalation rates, illustrating that grid parity could occur today under certain financial circumstances with the new method. Finally, it should be noted that what is mathematically feasible in not necessarily what is socially feasible based on the current economic constructs of society and such an approach would require a policy mandate.
3.3 System Life for Solar PV
The finance-able life for a solar PV system is usually considered to be the manufacturer’s guarantee period which is often 20 to 25 years [75, 76]. However, research has shown that the life of solar PV panels is well beyond 25 years; even for the older technologies, and current ones are likely to improve lifetime further [77- 81]. A 30 year lifetime or more is becoming expected [82]. Singh and Singh [28] explicitly called for scientists to give an authentic figure on the working life of solar PV systems to improve confidence for the loan guarantee period [28]. An important consideration is that even if the loan term was shorter, the energy output from the PV panels would still continue at a negligible cost. If the LCOE for each year were plotted over time, with different equations before and after the loan term, adjusting for the annualized loan cost, the yearly LCOE would be substantially less after the loan term than currently considered [49]. In general, the working life of an asset is the life for which it continues to perform its tasks effectively. It is often true that the operation and maintenance (O&M) costs rise with the age of the asset. Since annual capital costs tend to decline and annual O&M costs rise, there is a minimum average cost per year at which point it is considered the economic life of the asset [83, 84]. At the economic life, the asset is then replaced or refurbished, since it becomes more expensive to run the asset thereafter. For solar PV, the O&M costs are due to replacing inverters (usually every 10 years), occasional cleaning and electrical system repairs [49, 85], which are relative costs that will decrease with time. It should also be noted that the life of many conventional power plants is much longer than rated since they tend to be refurbished or re-commissioned indefinitely – the same could be true of solar PV plants [49]. Thus, what is considered the economic life of the system depends on the acceptable energy output, which depends on the degradation rate (rate at which there is a reduction in output). Table 4 illustrates the effect of degradation rate and acceptable performance on the lifetime of the system in terms of a percentage of maximum power output (Pmax).
Table 4: Effect of degradation rate and performance requirement on system life
Finally, the lifetime and reliability of solar PV can be considered for different solar PV technologies. Crystalline silicon wafer based (c-Si) PV modules offer the best in-field data being the technology established on the market for the longest time. Skoczek et al. [77] provided the
8
Published as: K. Branker, M. J.M. Pathak, J. M. Pearce, “A Review of Solar Photovoltaic Levelized Cost of Electricity”, Renewable & Sustainable Energy Reviews 15, pp.4470-4482 (2011). http://dx.doi.org/10.1016/j.rser.2011.07.104
results for c-Si PV modules in the field for more than 20 years originally characterized between 1982 and1986 (relatively immature technologies). In their findings, more than 65.7% of panels are below the 1% per year degradation rate (mean power loss was 17.3% for 21 years average). For PV technology, it is difficult to define the lifetime since ordinarily there is no single catastrophic event, but more gradual aging and degradation. The end of life of the system has not been reached once the power output still satisfies the user. Gradual degradation occurs due to chemical and material processes associated with weathering, oxidation, corrosion, and thermal stresses [78; 77]. Current research would improve lifetimes through greater quality in production processes as knowledge is gained about failure mechanisms [78, 86].
3.4 Degradation Rate and Energy Output
Determining the energy output of solar PV over its lifetime depends on assumed degradation rate of the panels. Module encapsulation protects against weather factors, moisture and oxidation and can withstand mechanical loads (e.g. wind and hail). PV systems are often financed based on an assumed 0.5 to 1.0% per year degradation rate [65] although 1% per year is used based on warranties [49]. This rate is faster than some historical data given for silicon PV [77, 78, 86]. In a study on c-Si modules, it was found that faster degradation occurs earlier and then it stabilizes indefinitely [77]. In the study, more than 70% of 19-23 year old c-Si modules had an annual degradation rate of 0.75% , still less than the 1% year assumed [77]. The failure sources are summarized in Table 5.
Table 5: Summary of Power loss results for 204 modules installed in 1982-1986 with 19-23 years [77]
In another study, c-Si PVs installed in 1982 (much older technology) and tested in 2003 had an annual power degradation rate of 0.2%, although this rate was faster in the latter 4 years [78]. Thus, the earlier degradation must have been slower than 0.2% per year. Furthermore, accelerated aging tests indicated that the panels had at least 15 years more of acceptable performance beyond the 21 years [78]. Finally, another study indicated that the degradation of actual in-field c-Si cells is 0.2 -0.5 % per year [86]. It can thus be concluded that in general, a degradation rate of 0.2%-0.5% per year is considered reasonable given technological advances.
It should be noted here that there is a special case for amorphous silicon (a-Si:H) PV, which suffers from light-induced degradation [87]. In a-Si PV cells, performance degrades rapidly in the first 100 hours of exposure to 1 sun illumination until a degraded steady state is reached [88-90]. The effect has of yet not been eliminated, but a-Si:H PV are sold with warranties valued at the degraded steady state value, ignoring the above specified initial performance. To further compound the appropriate calculations of such thin film technologies, the output of a-Si based solar cells is generally under-predicted by conventional techniques developed on c-Si-based PV technology, because of the superior a-Si:H temperature coefficients and performance in diffuse light conditions [91-93]. In addition, it has been shown that the use of integrating photometers such as pyranometers can directly introduce errors in the prediction of a-Si PV system output, and over the course of a year, the output from an a-Si:H PV device can vary by 10% to 20% due
9

Published as: K. Branker, M. J.M. Pathak, J. M. Pearce, “A Review of Solar Photovoltaic Levelized Cost of Electricity”, Renewable & Sustainable Energy Reviews 15, pp.4470-4482 (2011). http://dx.doi.org/10.1016/j.rser.2011.07.104
to this spectral effect, depending on seasonal and locational effects [94 - 102]. Because a-Si:H only covers a small fraction of this range, differences in the spectrum will have an amplified effect on the performance of an a-Si:H PV when compared to a c-Si PV devices, which covers a much wider spectral range because of its smaller bandgap. These effects have been widely documented [94, 95, 97- 103] and is the final reason generally attributed to the well-documented claims that a-Si:H PV modules will produce more energy per rated power than c-Si PV modules [95].
3.5 Grid Parity
As mentioned before, grid parity is considered a tipping point for the cost effectiveness of solar PV, and entails reducing the cost of solar PV electricity to be competitive with conventional grid-supplied electricity. For parity, the total cost to consumers of PV electricity is compared to retail grid electricity prices. Although the LCOE is not the same as retail electrical prices, it is used as a proxy for the total price to be paid by consumers, adding in as many of the realistic costs as possible. The LCOE methodology is then used to back calculate what the required system and finance costs need to be to attain grid parity.
Yang [15] determined that a realistic examination of grid parity would suggest that solar PV is much further away from becoming cost-effective in distributed (residential) systems than is normally claimed. The main problem Yang identified was 1) many analysts were not amortizing all of the cost to the end consumers and 2) wrongfully considering $1/Wp manufactured cost instead of retail installed cost when calculating grid parity [15]. However, applying Camstar’s Advanced Product Quality model suggests that the cost per kWh of the solar industry can be shifted down by 13-17% when applied to the manufacturing supply chain from design to system recycling at end of life [23].
4. Numerical Example in Ontario, Canada
In Canada, electricity prices range from $0.06/kWh -$0.17/kWh in major cities [51] so that as a proxy for grid parity, the LCOE for residential solar would need to be in this range. Using the simplified method outlined in Section 3 and improved assumptions, the LCOE was calculated for Ontario, Canada using ranges of variables to test sensitivity as an example. As shown in Table 5, a realistic starting fully installed system price is $5/ Wp1 as prices are declining and thin-film PV would show better performance in the relatively cloudy region of Ontario [96-98]. Other assumptions for the base example case include: a degradation rate of 0.5%/year [11, 78, 86], using 100% debt financing, an operating (insurance) cost of 1.5 % of the total system cost (average quotes from 3 insurance companies) and a maintenance (inverter replacement) cost of 9% of the total installed system cost (ranged from 6 to 9% in U.S. for 2009) [4, 11, 67, 72]. The inverter life is considered to be 10 years [11, 72], although longer warranties can be purchased [e.g. 104, 105]. To represent Kingston, Ontario a solar insolation accounting for capacity factor of 1270 kWh/kW/yr will be used, noting that there is a viable range of 800 to 1500 kWh/kW/yr in Canada and nearby states in the US [106].
10

Published as: K. Branker, M. J.M. Pathak, J. M. Pearce, “A Review of Solar Photovoltaic Levelized Cost of Electricity”, Renewable & Sustainable Energy Reviews 15, pp.4470-4482 (2011). http://dx.doi.org/10.1016/j.rser.2011.07.104
Figure 1 A-C shows how the LCOE (value represented on contours) varies with financing terms and discount rate, assuming the energy output is 1270 kWh/kW/yr and system cost is $5/ Wp. Interest rates were varied from 0-10%, discount rates are shown for 0%, 4.5% and 10%, and loan terms vary from 0-40 years. It is clear that the LCOE decreases with decreasing interest rates, increasing loan term and increasing discount rate. Since a zero interest rate loan is most favourable (for A, at a 10 year loan term and 0% interest, the LCOE is less than $0.60/kWh, whereas at 6% interest, the LCOE is $0.70/kWh), it will be considered for the remaining calculations. Note than loan terms need to be at least greater than 10 years to have a reasonable effect on LCOE (as shown by curvature of contours).
Figure 1
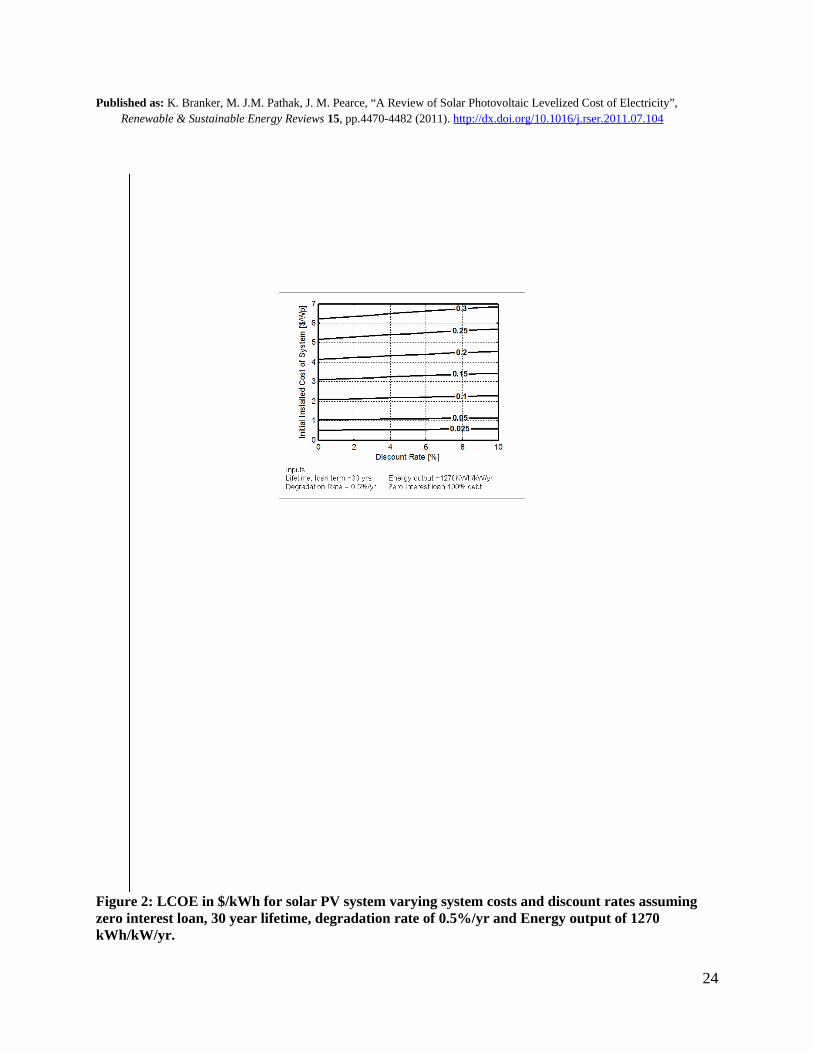
Figure 2, which plots LCOE contours in $/kWh for solar PV systems with varying system costs and discount rates, confirms that the discount rate has a small effect on the LCOE. Note that the discount rate would have a different effect if equity versus debt financing is compared [49]. A 30 year term is used for the following analyses because it is likely to become the new industry standard for solar PV warranties [82].
Figure 2
Figure 3 shows how the LCOE varies as the initial cost of the system varies from 0 to 7 $/Wp and the system lifetime varies from 20 to 50 years, assuming a zero interest loan, 4.5% real discount rate, 0.5% degradation rate and energy output is 1270 kWh/kW/yr. As expected, as price decreases and system life increases, the LCOE decreases. A 30 year system at an installed cost of $2.25/Wp to $3.25/Wp with a zero interest loan at the other assumptions has an LCOE of $0.10/kWh to $0.15/kWh is able to compete with grid prices at $0.080/kWh - $0.11/kWh. Regardless of lifetime, Figure 3 indicates that installed PV system prices still need to decrease by a factor of two to be economically competitive in the current economic system in Ontario.
Figure 3
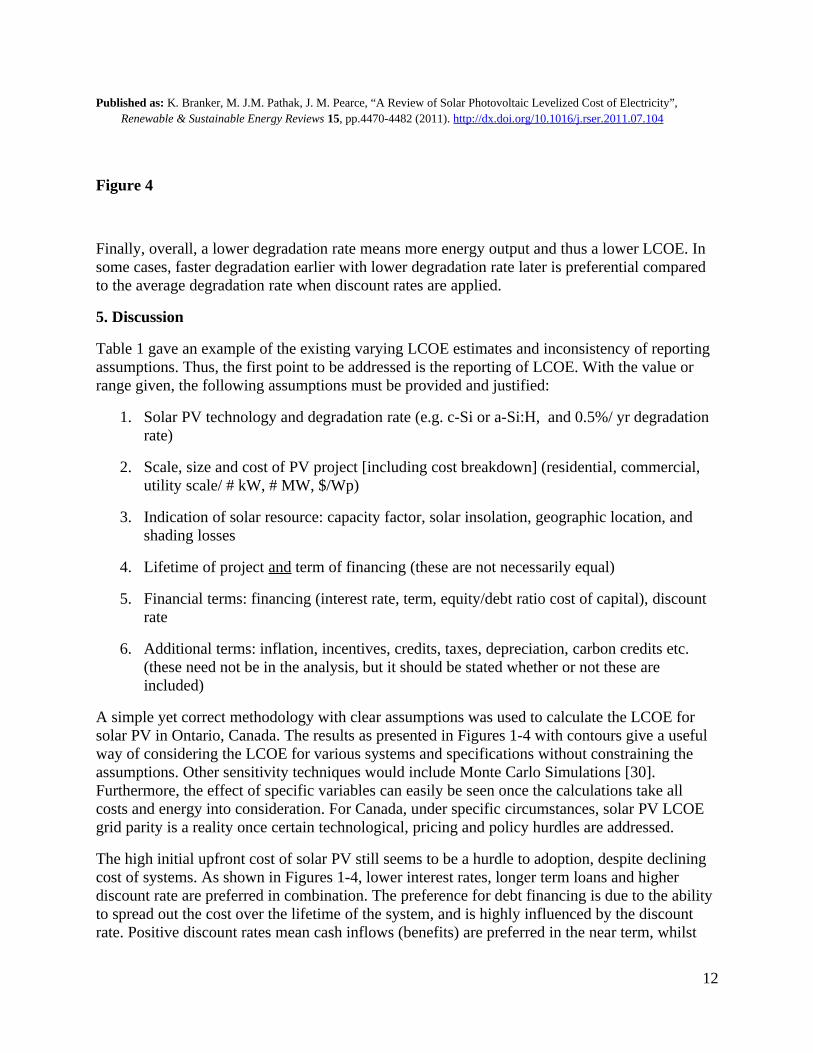
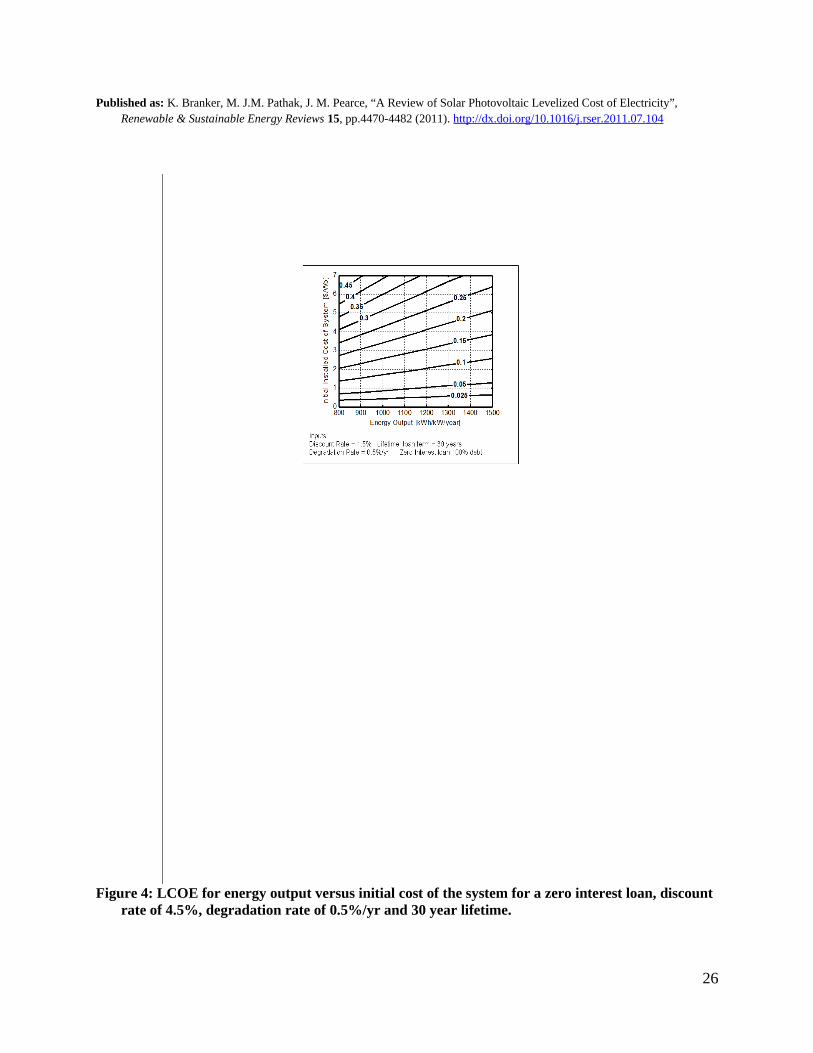
Figure 4 illustrates the effect of initial installed cost and energy output on the LCOE. Again, decreased cost and increased energy output are preferable and intuitive. The energy output enables Figure 4 to determine LCOE over a wide geographic region for any given installed systems cost. For Kingston, Ontario, for a 1 kW system and 1270 kWh/kW/yr with a zero interest loan, an initial installed cost of <$2.25/Wp is needed to be grid comparable with $0.10/kWh. Prices are currently not this low so that efforts need to be continued to reduce installed costs to challenge grid parity as well as consider the LCOE beyond payment for the system [49].
11
Published as: K. Branker, M. J.M. Pathak, J. M. Pearce, “A Review of Solar Photovoltaic Levelized Cost of Electricity”, Renewable & Sustainable Energy Reviews 15, pp.4470-4482 (2011). http://dx.doi.org/10.1016/j.rser.2011.07.104
Figure 4
Finally, overall, a lower degradation rate means more energy output and thus a lower LCOE. In some cases, faster degradation earlier with lower degradation rate later is preferential compared to the average degradation rate when discount rates are applied.
5. Discussion
Table 1 gave an example of the existing varying LCOE estimates and inconsistency of reporting assumptions. Thus, the first point to be addressed is the reporting of LCOE. With the value or range given, the following assumptions must be provided and justified:
1. Solar PV technology and degradation rate (e.g. c-Si or a-Si:H, and 0.5%/ yr degradation rate)
2. Scale, size and cost of PV project [including cost breakdown] (residential, commercial, utility scale/ # kW, # MW, $/Wp)
3. Indication of solar resource: capacity factor, solar insolation, geographic location, and shading losses
4. Lifetime of project and term of financing (these are not necessarily equal)
5. Financial terms: financing (interest rate, term, equity/debt ratio cost of capital), discount rate
6. Additional terms: inflation, incentives, credits, taxes, depreciation, carbon credits etc. (these need not be in the analysis, but it should be stated whether or not these are included)
A simple yet correct methodology with clear assumptions was used to calculate the LCOE for solar PV in Ontario, Canada. The results as presented in Figures 1-4 with contours give a useful way of considering the LCOE for various systems and specifications without constraining the assumptions. Other sensitivity techniques would include Monte Carlo Simulations [30]. Furthermore, the effect of specific variables can easily be seen once the calculations take all costs and energy into consideration. For Canada, under specific circumstances, solar PV LCOE grid parity is a reality once certain technological, pricing and policy hurdles are addressed.
The high initial upfront cost of solar PV still seems to be a hurdle to adoption, despite declining cost of systems. As shown in Figures 1-4, lower interest rates, longer term loans and higher discount rate are preferred in combination. The preference for debt financing is due to the ability to spread out the cost over the lifetime of the system, and is highly influenced by the discount rate. Positive discount rates mean cash inflows (benefits) are preferred in the near term, whilst
12

Published as: K. Branker, M. J.M. Pathak, J. M. Pearce, “A Review of Solar Photovoltaic Levelized Cost of Electricity”, Renewable & Sustainable Energy Reviews 15, pp.4470-4482 (2011). http://dx.doi.org/10.1016/j.rser.2011.07.104
cash outflows (costs) are preferred in the far term. If comparing a consumptive technology like nuclear or coal-fired plants to a capital intensive technology like solar PV, which have no fuel cost that is susceptible to price fluctuation risk, a positive discount rate biases towards consumptive technologies. Consumptive technologies involve long installation times and high fuel costs that would seem preferred over a capital intensive plant that require high upfront costs in a short installation time, but negligible costs thereafter. In terms of sustainable energy management, capital intensive technologies should be preferable, but this concept is lost in the current economic system.
Figure 3 demonstrated that a zero interest loan over a long period could result in the lowest LCOE values. Financing still is an issue for residential systems and incentives should be considered that either provide zero interest loans or offset interest costs so that it was as if there was no interest. A zero interest loan from the government would work for distributed PV community programs, allowing governments to meet their renewable energy targets on a greater scale. The Ontario FIT program is the opposite incentive meant to reduce the effect of long term costs (interest and maintenance), whilst providing some economic return. Again, although FIT contracts guarantee a price for the energy, as seen in Ontario, financial institutions still consider loans in terms of individual’s credit histories and not the value of the contract.
The misconception about system lifetime and degradation were discussed here. Solar PV lifetimes will often be greater than guaranteed and new industry norms will at least be 30 years. If financing facilities do not acknowledge this extended time, the LCOE should still consider the working life for the operation and maintenance costs and energy production [49]. In the case of degradation rate, step functions may be needed in the LCOE calculation to recognize that for some systems, more energy is produced in earlier years and would have a higher weighting with a positive discount rate. As failure modes and degradation mechanisms are better understood, the rates used in LCOE can be systematically improved.
Finally, although Yang [15] stated that some system costs would not be feasible for grid parity, the fact is that it is under certain circumstances grid parity has already been reached in places like Hawaii and California [107] and much can still be done to improve the supply chain to reduce costs [23, 67, 70]. Solar module prices, inverter prices, system and component lives and BOS costs continue to improve as research and development evolves, putting some solar manufacturer’s at grid parity today [23]. In addition, it should be mentioned that cost effectiveness (or in this case obtaining grid parity) is not necessarily a sufficient driver for people to invest in any new technology including residential PV systems [15, 108-114]. An example is the adoption of energy efficient compact florescent light bulbs (CFLs) that are more economic in the long run, but have a higher upfront cost giving them the perception of being expensive [110]. In Canada, CFLs are being adopted more as older technology (incandescent) is being banned. The LCOE of PV, even at grid parity may be of little consequence to an individual if they cannot reap near term profits (savings) or the required energy needs as the next best alternative. Concerning grid parity, it is a difficult endeavour considering, fossil fuels and nuclear power still continue to receive larger indirect and direct subsidies than renewable energy technologies [115-119].
13

Published as: K. Branker, M. J.M. Pathak, J. M. Pearce, “A Review of Solar Photovoltaic Levelized Cost of Electricity”, Renewable & Sustainable Energy Reviews 15, pp.4470-4482 (2011). http://dx.doi.org/10.1016/j.rser.2011.07.104
Greater adoption of solar PV will be driven by government incentives and policies and solar PV supply chain innovation [23, 111]. Consumers would prefer innovative products, greater customer care, increased reliability and quality of panels and supporting BOS, greater standardization in installation quality and reduced administrative time for government incentives such as FITs. Governments can monitor and create the policy for standardization to improve quality and provide training and interface management education [111]. Government policies need to have long-term objectives and certainty so that incentives are sustainable. For example, encouraging third party sale of solar PV electricity to the grid beyond the FIT at a retail price would increase the profitability of the system. Furthermore, if public policies surrounding retail, insurance and financing are aligned, then solar PV should be recognized for its added value, like a swimming pool would, for a residential dwelling except that PV would produce revenue. Finally, tax breaks (sale or income) can be considered for cleaner and renewable technologies over fossil fuel based technologies to encourage their adoption. One study indicated that an income tax benefit for purchase of the technology could have greater incentive than low interest loan [120]. To ensure sustainability of solar PV adoption through incentives, governments should assess the impact of incentives on adoption for different income classes and determine which will be best to meet their energy targets. Finally, in the same way that governments have supported and invested in conventional power generation projects, they could do the same for PV manufacturing to be able to reap cost reductions with economies of scale and other social benefits like job creation [121].
6. Conclusions
As the solar photovoltaic (PV) matures, the economic feasibility of PV projects are increasingly being evaluated using the levelized cost of electricity (LCOE) generation in order to be compared to other electricity generation technologies. A review of methodology and key assumptions of LCOE for solar PV was performed. The LCOE calculations and assumptions were clarified and a correct methodology and reporting was demonstrated for a case study in Canada. It was found that lack of clarity in assumptions and justifications in some LCOE estimates could lead to the wrong outcomes and policy initiatives. Since the inputs for LCOE are highly variable, there is need for using sensitivity analysis to represent actual variable distributions so that there is no unreasonable confidence in a single set of assumptions. This paper illustrated that the most important assumptions were system costs, financing, lifetime and loan term. A higher inclusivity of costs and reporting assumptions and justifications is recommended, even if merely using the work of another source. Given the state of the art in the technology and favourable financing terms it is clear that PV has already obtained grid parity in specific locations and as installed costs continue to decline, grid electricity prices continue to escalate, and industry experience increases, PV will become an increasingly economically advantageous source of electricity over expanding geographical regions.
7. Acknowledgement
14

Published as: K. Branker, M. J.M. Pathak, J. M. Pearce, “A Review of Solar Photovoltaic Levelized Cost of Electricity”, Renewable & Sustainable Energy Reviews 15, pp.4470-4482 (2011). http://dx.doi.org/10.1016/j.rser.2011.07.104
The authors would like to acknowledge support from the Natural Sciences and Engineering Research Council of Canada and helpful discussions with B. Purchase and R. Andrews.
8. References
[1] V. Fthenakis, J. E. Mason, K. Zweibel, The technical, geographical, and economic feasib-ility for solar energy to supply the energy needs of the US, Energy Policy 37 (2009) 387-399.[2] B. K. Sovacool, C. Watts, Going Completely Renewable: Is It Possible (Let Alone Desir-able?), The Electricity Journal 22 (2009) 95 -111.[3] Renewable Energy Policy Network for the 21st century (REN21), Renewables 2010 Glob-al Status Report, Paris, 2010, pp. 1-80.[4] J. F. Kirkegaard, T. Hanemann, L. Weischer, M. Miller, Toward a Sunny Future? Global Integration in the Solar PV Industry, World Resources Institute (WRI) Working Paper Series, May 2010, pp. 1- 66.[5] J. M. Pearce, Photovoltaics - a path to sustainable futures, Futures 34 (2002) 63–674.[6] R.E.H. Sims, H. Rogner, K. Gregory, Carbon emission and mitigation cost comparisons between fossil fuel, nuclear and renewable energy resources for electricity generation, Energy Policy 31 (2003) 1315–1326.[7] International Energy Agency (IEA), Energy Technology Perspectives 2008: Scenarios and Strategies to 2050, International Energy Agency, IEA/OECD, Paris, France, 2008, pp. 1-650.[8] P. Mints, The 12-step solar program: Towards an incentive-less future, Navigant Consult-ing, January 19, 2011, on ElectoIQ, http://www.electroiq.com[9] International Energy Agency (IEA), Technology Roadmap – Solar Photovoltaic Energy, October, 2010, pp.1-48.[10] G. N. Doty, D. L. McCree, J. M. Doty, F. D. Doty, Deployment Prospects for Proposed Sustainable Energy Alternatives in 2020, ASME Conf. Proc. 2010, 171 (2010), 171-182.[11] S. Price, R. Margolis, 2008 Solar technologies market report, Energy Efficiency & Re-newable Energy, US Department of Energy, January 2010, pp. 1-131.[12] Renewable Energy Policy Network for the 21st Century (REN21), Renewables Global Status Report 2009 Update, Paris, 2009, pp. 1-32.[13] N. R. Jogleka, E. S. Graber-Lopez, A Countdown towards Solar Power at Grid Parity: Policy Analysis Based on the Evolution of Price-Performance, Proc. 2008 ISDSI International Conf., 2008, pp. 1-18.[14] J. Klein, Comparative Costs of California Central Station Electricity Generation: Final Staff Report, Sacramento, CA: California Energy Commission, 2010, pp. 1-186.[15] C. Yang, Reconsidering solar grid parity, Energy Policy 38 (2010) 3270-3273.[16] Energy Information Administration (EIA), International Energy Outlook 2010, U.S. De-partment of Energy, USA, 2010, pp. 1-338.[17] P. Denholm, R. M. Margolis, S. Ong, B. Roberts, Break-Even Cost for Residential Photo-voltaics in the United States: Key Drivers and Sensitivities, National Renewable Energy Laborat-ory (NREL) Technical Report, 2009, pp. 1- 33.[18] C. Breyer, A. Gerlach, J. Müller, H. Behacker, A. Milner, Grid-Parity Analysis for EU and US Regions and Market Segments - Dynamics of Grid-Parity and Dependence on Solar Irra-
15
Published as: K. Branker, M. J.M. Pathak, J. M. Pearce, “A Review of Solar Photovoltaic Levelized Cost of Electricity”, Renewable & Sustainable Energy Reviews 15, pp.4470-4482 (2011). http://dx.doi.org/10.1016/j.rser.2011.07.104
diance, Local Electricity Prices and PV Progress Ratio, Proc. 24th European Photovoltaic Solar Energy Conf., 2009, pp. 4492 – 4500.[19] S. Hegedus, A. Luque, Achievements and Challenges of Solar Electricity from Photovol-taics, in A. Luque and S. Hegedus (Eds.), Handbook of Photovoltaic Science and Engineering, second ed., John Wiley and Sons Ltd., 2011, pp. 1-38.[20] R. Pernick, C. Wilder, Utility Solar Assessment (USA) Study Reaching Ten Percent Sol-ar by 2025, Clean Edge, Inc. and Co-op America Foundation, June 2008, pp 1-76.[21] J. Song, R. Boas, C. Bolman, M. Farber, H. Flynn, M. Meyers, M. Rogol, True Cost of Solar Power: Race to $1/W, Photon Consulting LLC., Boston, MA, 2009.[22] M. Brown, Going for grid parity, BP Global - Reports and publications, 12 (2005) pp. 6-10, http://www.bp.com/genericarticle.do?categoryId=9013609&contentId=7005395[23] Camstar Systems Inc., Chapter 3-Winning Profits in the Age of Continuous Innovation – Taking the Solar Industry Beyond Grid Parity, in Camstar e-Book, 2010, pp. 1-34.[24] Pike Research, Global Solar Energy Outlook - Solar Demand Dynamics, Cost Structures, Policy Factors, and Competitive Differentiators for Suppliers: Market Analysis and Forecasts, pp. 1-67.[25] Black and Veatch Corporation, Renewable Energy Transmission Initiative Phase 2B: Draft Report. Sacramento, CA: RETI Stakeholder Steering Committee, 2010, pp 1-109.[26] Organisation for Economic Co-operation and Development (OECD), Nuclear Energy Agency/ International Energy Agency (OECD/IEA), Projected costs of generating electricity: 2005 update, OECD Publishing, Paris, France, 2005, pp.1-230.[27] W. Short, D. Packey, T. Holt, A Manual for economic evaluation of Energy Efficiency and Renewable Energy Technologies, National Renewable Energy Laboratory, March 1995, pp. 1-120.[28] P. P. Singh, S. Singh, Realistic generation cost of solar photovoltaic electricity, Renew-able Energy 35 (2010) 563-569.[29] T. Cheyney, Chipping away at levelized costs: SunPods, Sunsonix seek lower solar LCOE in field and fabs, PV-tech.org, 1 July 2010, http://international.pv-tech.org/chip_shots_blog/chipping_away_at_levelized_costs_sunpods_sunsonix_seek_lower_solar_lcoe175[30] S. B. Darling, F. You, T. Veselka, A. Velosa, Assumptions and the levelized cost of en-ergy for photovoltaics, Energy Environ. Sci. (2011) 7 pages (Advance Article)[31] SolarBuzz.com, Solar Electricity Global Benchmark Price Indices, December 2010 Sur-vey Results, 2010, http://www.solarbuzz.com/SolarIndices.htm[32] A. Velosa III, What is Inside your LCOE assumptions? SEMI PV Group – The Grid, April 2010, http://www.pvgroup.org/NewsArchive/ctr_036226[33] Renewable Energy Policy network for the 21st century (REN21), Renewables 2007 Glob-al Status Report, Paris, 2008, pp. 1-54[34] P. Bandyopadhyay, A. Groo, M. Hartley, J. LeBrun, A. Moazed, Renewable Energy for BHP Billiton, University of Michigan, Master's Thesis (2008).[35] P. Grana, Demystifying LCOE, RenewableEnergyWorld.com, August 18, 2010, http://www.renewableenergyworld.com/rea/blog/post/2010/08/demystifying-lcoe[36] National Energy Board (NEB), Emerging Technologies in Electricity Generation, A Mar-ket Assessment Report, March 2006, pp.1-113.
16
Published as: K. Branker, M. J.M. Pathak, J. M. Pearce, “A Review of Solar Photovoltaic Levelized Cost of Electricity”, Renewable & Sustainable Energy Reviews 15, pp.4470-4482 (2011). http://dx.doi.org/10.1016/j.rser.2011.07.104
[37] T. Walden, Relative Costs of Electricity Generation Technologies, Canadian Energy Re-search Institute, for Canadian Nuclear Association, September 2006, pp. 1-8.[38] R.Wiser R, G. Barbose, C. Peterman, N. Darghouth, Tracking the Sun – II: Installed costs of PV in the US from 1998–2008, US Department of Energy, Lawrence Livermore Berkley Laboratory, 2009, pp.1-50.[39] J. M. Pearce, P. J. Harris, Reducing greenhouse gas emissions by inducing energy conser-vation and distributed generation from elimination of electric utility customer charges, Energy Policy 35 (2007) 6514-6525.[40] T. Hunt, True cost of solar energy and other renewables: California case study, December 13, 2010, ElectoIQ/Renewable Energy Word. [41] J. Hutchinson, S. Inwood, R. James, G. Ramachandran, J. Hamel, C. Libby, Program on Technology Innovation: Integrated Generation Technology Options (1019539), Palo Alto, CA: Electric Power Research Institute, 2009, pp. 1-112.[42] B. Buller, D. Eaglesham, Thin Film PV: The Pathway to Grid Parity, Optics and Photon-ics for Advanced Energy Technology, Optical Society of America (2009), paper ThD1.[43] R. M. Swanson, 2009. Photovoltaics Power Up. Science 324 (2009) 891-892.[44] National Energy Board (NEB), Canadian Energy Overview 2009 – An Energy Market Assessment, June 2010, pp 1-52.[45] M. Munasinghe, J.J. Warford, Electricity Pricing: theory and case studies, Technical Re-port, International Bank for Reconstruction and Development, Washington DC, 1982, pp. 1-395.[46] Natural Resource Canada (NRCan), Energy Sector - About Electricity, 2009, http://www.nrcan-rncan.gc.ca/eneene/sources/eleele/abofai-eng.php#generation[47] National Energy Board (NEB), Energy Pricing Information for Canadian Consumers, How Canadian Markets work, 2010, http://www.neb.gc.ca/clf-nsi/rnrgynfmtn/prcng/lctrct/cndn-mrkt-eng.html[48] B. Purchase. Personal Communication on Energy Policy, September 2, 2010.[49] K. Zweibel, E. M. James, F. Vasilis, A solar grand plan, Scientific American 298 (2008) 64-73.[50] S. H. Sevilgen, H. H. Erdem, B. Cetin, A.V. Akkaya, A. Da daş, Effect of economicǧ parameters on power generation expansion planning, Energy Conversion and Management 46 (2005) 1780-1789.[51] Hydro-Québec, 2010 Comparison of Electricity Prices in Major North American Cities, October 2010, pp. 1-79.[52] R. Leavitt, What the Heck is a LUEC?, Positive Energy Blog, August, 2004, http://posit-iveenergy.blogspot.com/2004/08/what-heck-is-luec.html[53] R. B. Gibson, M. Winfield, T. Markvart, K. Gaudreau, J. Taylor, An Analysis of the On-tario Power Authority’s Consideration of Environmental Sustainability in Electricity System Planning, Studies in Ontario Electricity Policy Series Paper No. 2, University of Waterloo and York University, 2008, pp 1-173.[54] Electric Power Research Institute (EPRI), the Power to Reduce CO2 Emissions – The Full Portfolio, Palo Alto, CA, 2007, pp. 1-45.[55] The U.S. Department of Energy (DOE), Solar Energy Technologies Program: Multi- Year Program Plan 2007–2011, Washington, DC, 2006, pp. 1–66.
17

Published as: K. Branker, M. J.M. Pathak, J. M. Pearce, “A Review of Solar Photovoltaic Levelized Cost of Electricity”, Renewable & Sustainable Energy Reviews 15, pp.4470-4482 (2011). http://dx.doi.org/10.1016/j.rser.2011.07.104
[56] U.S. Department of Energy (DOE), Solar Energy Technologies Program- Multi Year Pro-gram Plan 2008-2012, Washington, DC, 2008, pp. 1-125.[57] S. Kaplan, Power Plants: Characteristics and Costs, CRS Report for Congress, Washing-ton, DC: Congressional Research Service, 2008, pp 1- 108.[58] Lazard Ltd., Levelised Cost of Energy Analysis - Version 3.0, New York, NY: Lazard Ltd., June 2009, pp.1 -16.[59] L. M. Moore, H. N. Post, Five Years of Operating Experience at a Large, Utility-scale Photovoltaic Generating Plant, Prog. Photovolt: Res. Appl. 16 (2008) 249-259.[60] Oregon Government, Renewable Energy - Estimating the Cost of Generating Electricity, 2007, http://www.oregon.gov/ENERGY/RENEW/costs.shtml[61] G. Simons, Developing Cost- Effective Solar Resources with Electricity System Benefits, California Energy Commission, Staff Paper, 2005, pp. 1-33.[62] G. Tolley, D. W. Jones, The Economic Future of Nuclear Power, Study by University of Chicago for DOE Nuclear Program, August 2004, pp. 1-38.[63] Ontario Power Authority (OPA), Facilitating the Development and Use of Renewable Energy and Enabling 2010 and 2025 Renewable Targets, in Exhibit D & E, 2008.[64] SolarBuzz, Solar Photovoltaic Electricity Price Index, 2011, h ttp://register.solarbuzz. - com/Solarindices.htm[65] SunPower Corporation, Levelized Cost of Electricity - The Drivers of The Levelized Cost of electricity for Utility-Scale Photovoltaics, August, 2008, pp. 1-27.[66] M. T. Ocampo, How to Calculate the Levelized Cost of Energy – a simplified approach, April 28, 2009 , Energy Technology Expert, http://energytechnologyexpert.com/cost-of-power-generation/how-to-calculate-the-levelized-cost-of-power-or-energy/[67] G. Barbose, N. Darghouth, R. Wiser, Tracking the Sun III, The installed Cost of Photo-voltaics in the U.S. from 1998 – 2009, US Department of Energy, Lawrence Berkley National Laboratory, 2010, pp.1-54.[68] Mercom Capital Group, Solar Market Intelligence Report, October 4, 2010, pp. 1-9.[69] L. Bony, S. Doig, C. Hart, E. Maurer, S. Newman, Achieving Low-Cost Solar PV: In-dustry Workshop Recommendations for Near-Term Balance of System Cost Reductions, Rocky Mountain Institute (RMI), 2010, pp. 1-24.[70] J. M. Pearce, Industrial symbiosis for very large scale photovoltaic manufacturing, Re-newable Energy 33 (2008) 1101–1108.[71] VLSI Research Inc., Photovoltaic cell manufacturing equipment: Top-10 supplier rank-ing. 20 February, 2009. Available at https://www. vlsiresearch.com/cms_pdf_upload/pdf_file_1233694471.pdfS.[72] E. Heacox, Inverter Cost Analysis, Solar Industry, July 2010, pp. 28–31.[73] C. Deline, B. Marion, J. Granata, S. Gonzalez, A Performance Analysis of Distributed Power Electronics in Photovoltaic Systems, National Renewable Energy Laboratory, Technical Report, 2011, pp 1-20.[74] Sparq Systems Inc., SPARQ’s Innovative Microinverter technology, 2011, http://www.s-parqsys.com/SPARQ_Technology.php[75] D. Brearley, c-Si Photovoltaic Trends: Design, Purchasing and 2009 Specs, Solar Pro Magazine, June/July 2009, pp. 49-74.
18
Published as: K. Branker, M. J.M. Pathak, J. M. Pearce, “A Review of Solar Photovoltaic Levelized Cost of Electricity”, Renewable & Sustainable Energy Reviews 15, pp.4470-4482 (2011). http://dx.doi.org/10.1016/j.rser.2011.07.104
[76] J. H. Wohlgemuth, Long Term Photovoltaic Module Reliability, NCPV and Solar Pro-gram Review Meeting 2003, National Research Energy Laboratory, 2003, pp. 179-183.[77] A. Skoczek, T. Sample, E. D. Dunlop, The Results of Performance Measurements of Field-aged Crystalline Silicon Photovoltaic Modules, Prog. in Photovoltaics: Res. and Applica-tions, 17 (2009) 227 – 240.[78] A. Realini, MTBF - PVm, Mean Time Before Failure of Photovoltaic modules, Final re-port, June 2003, pp. 1-58.[79] M. Holladay, Testing a Thirty-Year-Old Photovoltaic Module-It’s time to hook up my oldest solar panel to a multimeter, May, 21, 2010, Green Building Advisor.com, http://www.-greenbuildingadvisor.com/blogs/dept/musings/testing-thirty-year-old-photovoltaic-module[80] E. Dunlop, D. Halton, H. Ossenbrink, 20 years of life and more: Where is the end of life of a PV module? Proc. IEEE Photovoltaic Specialists Conf., 2005, pp. 1593 – 1596.[81] A.W. Czanderna, G.J. Jorgensen, Accelerated Life Testing and Service Lifetime Predic-tion for PV Technologies in the Twenty-First Century, National Renewable Energy Laboratory (NREL), Golden, CO., 1999, pp. 1-13.[82] R. Harrabin, Solar panel costs 'set to fall', BBC News, November 30, 2009, http://news.b-bc.co.uk/2/hi/science/nature/8386460.stm[83] S. Leblanc, P. Roman, C.Selkirk, Project Management – An engineering economics per-spective, second custom ed. for Queen’s University, Pearson Custom Publishing, 2007.[84] N.M. Fraser, E.M. Jewkes, I. Bernhardt, M. Tajima, Engineering Economics in Canada, third ed., Pearson Hall, Toronto, Ontario, 2006.[85] Navigant Consulting, A Review of PV Inverter Technology Cost and Performance Pro-jections, National Renewable Energy Laboratory, Golden, CO., 2006.[86] D. Chianese, A. Realini, N. Cereghetti, S. Rezzonico, E. Bura, G. Friesen, Analysis of Weather c-Si PV Modules, Proc. 3rd World Conference on Photovoltaic Solar Energy Conver-sion, 2003, 5 pages.[87] D.L. Staebler, C.R. Wronski, Reversible conductivity changes in discharge-produced amorphous Si, Appl. Phys. Lett. 31 (1977), p. 292.[88] C. R. Wronski, J. M. Pearce, J. Deng, V. Vlahos, R. W. Collins, Intrinsic and Light In-duced Gap States in a-Si:H Materials and Solar Cells - Effects of Microstructure, Thin Solid Films 451-452 (2004) 470-475.[89] J. M. Pearce, J. Deng, R. W. Collins, C. R. Wronski, Light Induced Defect States in Hy-drogenated Amorphous Silicon Centered Around 1.05 and 1.2eV from the Conduction Band Edge, Appl. Phys. Letters, 83 (2003) 3725-3727.[90] R. Rüther, J. del Cueto, G. Tamizh-Mani, A.A. Montenegro, S. Rummel, A. Anderberg, B. von Roedern, Performance test of amorphous silicon modules in different climates – year four: progress in understanding exposure history stabilization effects, Proc. 33rd IEEE Photovol-taic Specialists Conf., 2008, pp. 1-5.[91] C. Jardine, K. Lane, PV-COMPARE: Relative Performance of Photovoltaic Technologies in Northern and Southern Europe, Proc. PV in Europe Conf., 2002, pp. 1057-1060.[92] K.W. Jansen, S.B. Kadam, J.F. Groelinger, The Advantages of Amorphous Silicon Photovoltaic Modules in Grid-Tied Systems, Proc. 4th World Conf. on Photovoltaic Energy Conversion, 2006, pp. 2363-2366.
19

Published as: K. Branker, M. J.M. Pathak, J. M. Pearce, “A Review of Solar Photovoltaic Levelized Cost of Electricity”, Renewable & Sustainable Energy Reviews 15, pp.4470-4482 (2011). http://dx.doi.org/10.1016/j.rser.2011.07.104
[93] K.W. Jansen, S.B. Kadam, J.F. Groelinger, The High Energy Yield of Amorphous Silic-on Modules in a Hot Coastal Climate, Proc. 21st European Photovoltaic Solar Energy Conf., 2006, pp. 2535-2538.[94] R. Rüther, J. Livingstone, Seasonal variations in amorphous silicon solar module outputs and thin film characteristics, Solar Energy Materials and Solar Cells 36 (1995) 29-43.[95] Y. Hirata, T. Tani, Output variation of photovoltaic modules with environmental factors I - The effect of spectral solar radiation on photovoltaic module output, Solar Energy 55 (1995) 463-468.[96] R. Gottschalg, D.G. Infield, M.J. Kearney, Experimental study of variations of the solar spectrum of relevance to thin film solar cells, Solar Energy Materials and Solar Cells 79 (2003) 527-537.[97] R. Gottschalg, T.R. Betts, S.R. Williams, D. Sauter, D.G. Infield, M.J. Kearney, A critic-al appraisal of the factors affecting energy production from amorphous silicon photovoltaic ar-rays in a maritime climate, Solar Energy 77 (2004) 909–916.[98] R. Gottschalg, T.R. Betts, D.G. Infield, M.J. Kearney, On the importance of considering the incident spectrum when measuring the outdoor performance of amorphous silicon photovol-taic devices, Meas. Sci. Technol. 15 (2004) 460-466.[99] R. Rüther, G. Kleiss, K. Reiche, Spectral effects on amorphous silicon solar module fill factors, Solar Energy Materials and Solar Cells 71 (2002)375-385.[100] C.N. Jardine, T.R. Betts, R. Gottschalg, D.G. Infield, K. Lane, Influence Of Spectral Ef-fects On The Performance Of Multijunction Amorphous Silicon Cells, Proc. Photovoltaic in Europe Conference, 2002, 4 pages.[101] M. Chegaar, P. Mialhe L.O., Effect of atmospheric parameters on the silicon solar cells performance, J. of Electron Devices 6 (2008) 173-176.[102] J. Merten, J. Andreu, Clear separation of seasonal effects on the performance of amorph-ous silicon solar modules by outdoor I/V-measurements, Solar Energy Materials and Solar Cells 52 (1998) 11-25.[103] R. Andrews, J. M. Pearce, The effect of spectral albedo on amorphous silicon and crystal-line silicon photovoltaic performance, (to be published- 2011).[104] Fronius Solar Electronics, Extended warranties for Fronius PV inverters, 2010, http://www.fronius.com/cps/rde/xbcr/SID-4BC61BC3-06170520/fronius_international/Produkt-info_Garantieverlaengerung_EN_126951_snapshot.pdf[105] Home Energy Solutions (HESPV), Power-One Grid-Tie Inverters, 2011, http://www.heshomeenergy.com/poweroneinverters.html[106] S. Pelland, D.W. McKenney,Y. Poissant, R. Morris, K.M. Lawrence, K.L. Campbell, P. Papadopol, The development of photovoltaic resource maps for Canada, in Annual Conf. of the Solar Energy Society of Canada, 2006.[107] M. Brown, Gaining on the grid, BP Global - Reports and publications, 19 (2007) 14-18, http://www.bp.com/sectiongenericarticle.do?categoryId=9019305&contentId=7035199[108] J. M. Pearce, D. Denkenberger, H. Zielonka, Accelerating Applied Sustainability by Util-izing Return on Investment for Energy Conservation Measures, International J. of Energy, En-viron. and Economics 17 (2009) 61-80.[109] A.V. Banerjee, E. Duflo, The Economic Lives of the Poor, Bureau of Research and Eco-nomic Analysis (USA), Working Paper No. 135 (2006) 1-43.
20

Published as: K. Branker, M. J.M. Pathak, J. M. Pearce, “A Review of Solar Photovoltaic Levelized Cost of Electricity”, Renewable & Sustainable Energy Reviews 15, pp.4470-4482 (2011). http://dx.doi.org/10.1016/j.rser.2011.07.104
[110] C. Di Maria, S. Ferriera, E. Lazarova, Shedding Light on the Light Bulb Puzzle: The Role of Attitudes and Perceptions in the Adoption of Energy Efficient Light Bulbs, Scottish J. of Political Economy 57 (2010) 48-67.[111] M. Taylor, Beyond technology-push and demand-pull: Lessons from California's solar policy, Energy Economics 30 (2008) 2829–2854.[112] T. Beck, A. Demirguc-Kunt, P. M. S. Martinez, Reaching out: access to and use of bank-ing services across countries, World Bank, Washington, 2005.[113] P.S.C. Rao, J.B. Miller, Y.D. Wang, J.B. Byrne, Energy-microfinance intervention for below poverty line households in India. Energy Policy 37 (2009)1694-1712.[114] M. Robinson, The Microfinance Revolution: Sustainable Finance for the Poor, World Bank, Washington, 2001, pp. 199-215.[115] S. Lacey, Investors: Renewables Growth is Slower but Steady, RenewableEnergyWorld.-com, July 5, 2010, http://www.renewableenergyworld.com/rea/news/podcast/2010/07/investor-s-renewables-growth-is-slow-but-steady[116] M. Goldberg, Federal energy subsidies: not all technologies are created equal, Research Report No. 11, Renewable Energy Policy Project, Washington, DC, 2000, pp. 1-20.[117] M. Slavin, The Federal Energy Subsidy Scorecard: How Renewables Stack Up, Renew-able Energy World. Com, November 3, 2009. http://www.renewableenergyworld.com/rea/news/article/2009/11/the-federal-energy-subsidy-s-corecard-how-renewables-stack-up[118] J.M. Pearce, Increasing PV Velocity by Reinvesting the Nuclear Energy Insurance Sub-sidy into Large Scale Solar Photovoltaic Production , 34th Proc. of IEEE Photovoltaic Specialists Conf., 2009, pp.1338-1343.[119] I. Zelenika-Zovko, J. M. Pearce, Diverting Indirect Subsidies from the Nuclear Industry to the Photovoltaic Industry: Energy and Economic Returns, Energy Policy (2011) (in press). http://dx.doi.org/10.1016/j.enpol.2011.02.031[120] B. Chandrasekar, T. C. Kandpal, Effect of financial and fiscal incentives on the effective capital cost of solar energy technologies to the user, Solar Energy 78 (2005) 147-156.[121] K. Branker, J. M. Pearce, Financial Return for Government Support of Large-Scale Thin-Film Solar Photovoltaic Manufacturing in Canada, Energy Policy 38 (2010) 4291–4303.[122] D. R. Boyd, S. J. Genuis, The environmental burden of disease in Canada: respiratory disease, cardiovascular disease, cancer, and congenital affliction, Environmental Research 106 (2008) 240–249.[123] Canadian Medical Association (CMA), No breathing room—national illness costs of air pollution, August 2008, pp. 1–45.[124] N. Stern, The Economics of Climate Change: the Stern Review, Cambridge University Press, Cambridge, UK, 2007.
21

Published as: K. Branker, M. J.M. Pathak, J. M. Pearce, “A Review of Solar Photovoltaic Levelized Cost of Electricity”, Renewable & Sustainable Energy Reviews 15, pp.4470-4482 (2011). http://dx.doi.org/10.1016/j.rser.2011.07.104
Endnotes
1. Units used in solar PV industry:
W= Watt (measure of power), 1 kW = 1000W, 1 MW = 1000 kW, 1 GW = 1000 MW, used in capacity rating of energy technologies
Wp = Watts peak (measure of nominal or rated power of solar PV system as per the manufacturer)
kWh =kilowatt-hour (measure of electrical energy)
kWh/kW/yr = kilowatt-hours per kilowatt per year (annual energy produced per rated power of the system). A solar insolation value with these units accounts for capacity factor. The capacity factor (CF) is the ratio of actual power output to nameplate capacity over a period of time since power systems do not generate at maximum efficiency, 100% of the time.
2. Negative externalities for conventional electrical generation technologies include carbon dioxide emissions, thermal and air pollution and habitat disruption. For example, there are costs due to health problems associated with the air pollutants from coal-fired generation [122, 123] and for global climate destabilization [124].
22

Published as: K. Branker, M. J.M. Pathak, J. M. Pearce, “A Review of Solar Photovoltaic Levelized Cost of Electricity”, Renewable & Sustainable Energy Reviews 15, pp.4470-4482 (2011). http://dx.doi.org/10.1016/j.rser.2011.07.104
All Tables in Separate file.
Figure 1: LCOE in $/kWh for solar PV system varying interest rates, loan terms and discount rates (A: 0%, B: 4.5%, C: 10%) assuming initial installed system cost of $5/Wp, degradation rate of 0.5%/yr and energy output of 1270 kWh/kW/yr.
23
Published as: K. Branker, M. J.M. Pathak, J. M. Pearce, “A Review of Solar Photovoltaic Levelized Cost of Electricity”, Renewable & Sustainable Energy Reviews 15, pp.4470-4482 (2011). http://dx.doi.org/10.1016/j.rser.2011.07.104
Figure 2: LCOE in $/kWh for solar PV system varying system costs and discount rates assuming zero interest loan, 30 year lifetime, degradation rate of 0.5%/yr and Energy output of 1270 kWh/kW/yr.
24

Published as: K. Branker, M. J.M. Pathak, J. M. Pearce, “A Review of Solar Photovoltaic Levelized Cost of Electricity”, Renewable & Sustainable Energy Reviews 15, pp.4470-4482 (2011). http://dx.doi.org/10.1016/j.rser.2011.07.104
Figure 3: LCOE for lifetime of solar PV system versus initial cost of the system for a zero interest loan, discount rate of 4.5%, degradation rate of 0.5%/yr and energy output of 1270 kWh/kW.
25
Published as: K. Branker, M. J.M. Pathak, J. M. Pearce, “A Review of Solar Photovoltaic Levelized Cost of Electricity”, Renewable & Sustainable Energy Reviews 15, pp.4470-4482 (2011). http://dx.doi.org/10.1016/j.rser.2011.07.104
Figure 4: LCOE for energy output versus initial cost of the system for a zero interest loan, discount rate of 4.5%, degradation rate of 0.5%/yr and 30 year lifetime.
26