Embed Size (px)
Citation preview

ECA Concept Note
March 2017
Leveling the Playing Field
Rethinking the Social Contract in Europe and
Central Asia (ECA)


iii iii
Contents
Introduction .................................................................................................... 1
Part I: Distributional tensions in ECA ................................................................ 3
I.1 Trends of Inequality and Perceptions .............................................................................. 5
I.2 Labor market polarization ............................................................................................. 10
I.3 Horizontal inequality—growing disparities between groups: the generational divide and spatial inequality ............................................................................................................... 12
I.4 Inequality of opportunity .............................................................................................. 18
Part II. When distributional tensions persist: Implications for the sustainability of the social contract ..................................................................................... 23
II.1 The social contract in ECA: Its history, promise, and new challenges ................................. 24
II.2 The future world of work and consequences for the social contract ................................. 28
II.3 Reforming transfer systems to enhance welfare .......................................................... 29
II.4 Reforming education systems to reduce inequality of opportunity ................................... 32
Notes ................................................................................................................................. 34
References .................................................................................................... 35
Team and Peer Reviewers .............................................................................. 42
Timeline ........................................................................................................ 42
Annexes ........................................................................................................ 43
Annex 1: Driver of distributional tensions: A review of the literature ................................ 43
Annex 2: Estimating the distributional impact of the changing occupational structure ...... 46
Annex 3: Methodology and data sources for the analysis of birth cohorts inequality ........ 50
Annex 4: Data sources on perceptions ............................................................................... 54
Annex 5: data and methods for analysis on spatial inequalities ......................................... 59
Annex 6: Inequality of opportunity measurement methodology and data sources ............ 60
Annex Notes ...................................................................................................................... 66

iv ● Leveling the Playing Field: Rethinking the Social Contract in ECA
Box
Box 1: Typology of social protection systems ................................................................................. 24
Figures
Figure 1: Fairness, economic security and the social contract, a preliminary conceptual framework ................................................................................................................................ 5
Figure 2: The share of the ECA population that is poor or vulnerable has fallen, 2000–2015 .......................................................................................................................................... 6
Figure 3: Per capita incomes of the bottom 40 percent have grown more rapidly than the average in many ECA countries, PPP 2005 USD ................................................................. 6
Figure 4: Inequality declined in many ECA countries, particularly in the east, 2000-03 to 2012–14 .................................................................................................................................... 7
Figure 5: Perceptions of upward mobility have fallen in many ECA sub-regions.............................. 8 Figure 6: Job stability is important to whether one feels poor ......................................................... 9 Figure 7: The importance of temporary and part-time employment is rising in ECA ..................... 10 Figure 8: Labor market polarization in ECA ..................................................................................... 11 Figure 9: The elderly are less poor than the young in most countries in ECA (ca. 2010) ................ 13 Figure 10: Age and cohort effects for family consumption inequality in Poland ............................ 14 Figure 11: Inequality in income/consumption within countries ..................................................... 15 Figure 12: Coefficient of variation of regional disposable income, 1995 and 2014 ........................ 17 Figure 13: Perception of unfairness in getting ahead: the importance of “having
connections” ........................................................................................................................... 19 Figure 14: Changes in levels of inequality of opportunity for tertiary education ........................... 20 Figure 15: The promise of the social contract ................................................................................. 26 Figure 16: Composition of household disposable income: total population (2016) ....................... 30
Tables
Table A3.1: Data sources and main variables ................................................................................. 53 Table A4.1: LiTS country coverage .................................................................................................. 56 Table A4.2: ISSP Social Inequality country coverage ....................................................................... 57 Table A4.3: WVS country coverage ................................................................................................. 58 Table A6.1: Distribution of outcomes according to circumstances and effort ............................... 61

1 1
Introduction
This report will analyze new distributional tensions that have emerged in Europe and Central Asia (ECA). Globalization, technological change, and aging have affected groups unevenly, and perceptions of reduced social mobility and equality of opportunity are spreading. There is a growing sense that the existing social contracts that regulate markets, define responsibilities and benefits, and redistribute incomes, are no longer working well for everybody. Increasingly large groups in societies – younger cohorts, those working in disappearing occupations or in geographic locations with stagnating industries, those without the right connections, and others – have not experienced upward mobility and feel that they are in an inequality trap. In other words, cracks in the existing social contract are becoming visible. The report will explore policy options to rethink the social contract for the next generation in order to address the growing inequality of opportunity. The challenge to agree on an inclusive social contract is an urgent one, as polarization in recent voting behavior could be interpreted as a sign of a growing divide between those who benefit from new economic realities and those who have limited opportunities. This report has two broad goals: a) provide a systematic analysis of distributional tensions in ECA, and b) inform the debate over policies that would support a sustainable and inclusive social contract in the region.
Describing the cross-regional evidence on the cracks of the social contracts in ECA is the goal of Part I of the report. Compared to the Arab Springs in the Middle East and North Africa region, ECA has not experienced social unrest and revolts of that scale. Perhaps, lower support for centrist parties and political tensions in the East part of the region are the most overt, and easily measurable, symptoms of an erosion of the social contract. In addition, and this is a key value added of the

2 ● Leveling the Playing Field: Rethinking the Social Contract in ECA
report, a series of distributional tensions are identified as signs of the wearing down of social cohesion. Three distributional tensions are the focus of attention in the report: a) polarization in the labor market; b) growing divide between groups; c) rising inequality of opportunity. If they are not well understood and dealt with properly, these distributional tensions could cause a breaking down of the social contract in the future. A fairness/unfairness and security/insecurity conceptual framework is the thread that links together these distributional tensions. There is a rising awareness that the allocation of income and wealth is greatly dependent on the circumstances of one’s birth, such as family connections, location, age, gender or ethnicity. At the same time, rapid economic change and the decline of permanent employment have increased the potential for either being out of work for an extended period or having to accept a lower-paying, and lower-status, job. In either case, economic rewards and prospects appear to be driven by forces beyond the control of the individual. As a result, large groups have experienced significant reductions in income or—despite efforts to reform pensions, social protection and other redistributions systems—remain exposed to uninsured risks.
Part II outlines a structure to “rethink” the social contract in ECA. The report will explore the potential for moving to a fairer system including policy options that provide greater access to essential income-generating assets, no matter the circumstance at birth. It will also examine tax and transfer systems and their ability to insure and protect given the rapidly changing structure of the labor market. Do insurance systems tied to employment make sense in a world where employment tenures get shorter and shorter? Are more universal approaches to protection such as the Universal Basic Income more appropriate given the greater probability of being out of work for extended periods of time? What are the costs and benefits of such universal approaches, how can they be financed, and are they sustainable? While they might provide income support, can they even begin to compensate an individual for the personal cost of involuntary job loss? Improvements in non-economic factors such as autonomy and status may also be important in restoring workers’ sense of well-being. The report will examine how labor market policies and institutions may need to reform and whether they can help improve both economic (increasing incomes) and non-economic (autonomy and status) rewards to effort, and facilitate job matching.

3 3
Part I: Distributional tensions in ECA
Inequality does not seem to be a serious problem for countries in the ECA region; in fact, in terms of both levels and trends, other regions in the world are more negatively affected by it. It is indeed the case that in ECA inequality as measured by aggregate indexes, such as the Gini, is not very high and has been, mostly, stable in the recent decade. So why focus an entire report on distributional tensions? For, at least, three important reasons.
First, vertical inequality—i.e. inequality across the whole population—may not be changing, but other features of distribution are. For example, the ‘disappearing middle class’ and the polarization of labor markers may not be registered by the Gini but could still generate rifts. It is possible that incomes are clustering at the extremes of the distribution and while (vertical) inequality may go down, polarization may go up (Zhang & Kanbur, 2001). Similarly, inequality between groups (sometimes called ‘horizontal’ inequality) may be increasing. This means that disparities between rural and urban communities, age groups, or people with different occupations, or education backgrounds may be rising. Social cohesion can be under pressure when superior economic positions and better opportunities are available to some groups but not others. Assessing these tensions requires looking beyond the usual aggregate measures of inequality.
Second, when asked, in opinion surveys, people express concerns about inequality. Across all countries in the region, a large majority believes that inequality is worsening. And this does not seem a short term reaction to the recent economic crisis. Compared to the beginning of the 90s, more people, especially in Western and Southern Europe, think that they live in a highly unequal society. Recent low growth, since the 2008 global financial crisis, may have exacerbated this view. Rather than dismissing these perceptions as misperceptions, it is important, once again, to investigate which are the potential causes of the anxieties of large majorities of ECA populations (see Davalos et al 2016).

4 ● Leveling the Playing Field: Rethinking the Social Contract in ECA
It is likely that individuals are distressed about unfairness rather than inequality.1 In more technical terms, inequality is often measured on outcomes, such as consumption levels, incomes, or wealth, while fairness refers to the quality of the process generating those outcomes. Even with a stable inequality levels, inequality of opportunity—or the proportion of the overall inequality due to circumstances beyond the control of individuals—may be rising. A recent study (Davalos et al 2016) shows that getting a ‘good’ job—a crucial step in accessing stable middle-class living standards—is becoming increasingly difficult and more due to ‘having connections’ rather than skills and effort. Assessing changes in fairness, or equality of opportunity, has not been done before2 and may be crucial to understand the links between distributional tensions and fissures in the social contract. This is the third reason for a report focused on distributional change.
The analysis of inequality of opportunity can also have an instrumental value. Inequality of opportunity, rather than income inequality, can be related to aggregate economic growth. It has been suggested (Bourguignon et al. 2007 and World Bank, 2006) that the existence of strong and persistent inequalities in the initial opportunities open to individuals can generate true inequality traps that represent severe constraints to future growth of an economy, by preventing entire groups from participation into economic and social life.3
Given these motivations, Part I of the report will focus on three major areas of distributional tensions:
a) Polarization of the labor markets and related pressure on the middle class; b) Disparities between groups (horizontal inequality): age and location are
initially identified as relevant criteria forming the groups; as shown below, in the region, there are signs of increasing gaps between generations and geographic areas;
c) Inequality of opportunity and inter-generational mobility.
In addition to these distributional tensions social preferences for redistribution will also be studied closely. A welfare regime can be stable and successful only if it achieves an equilibrium between the distribution generated by market forces and social preferences for equality and fairness. Normally, a certain level of public redistribution and social protection are used to reach such and equilibrium. However, if distributions generated by the markets are shifting and/or societies perceive these changes as unfair, welfare regimes may need to adapt to guarantee the stability of the social contract.
The link between these distributional tensions (and their perception) and the stability of the social contract is provided by the fairness/unfairness and (economic) security/insecurity conceptual framework, which is illustrated by Figure 1. When the process generating economic outcomes is fair (or at least perceived as fair), and individuals have a certain degree of security then the social contract is stable. The other quadrants in the figure shows different cases where the social contract is not under threat.

Part I: Distributional tensions in ECA ● 5
Figure 1: Fairness, economic security and the social contract, a preliminary conceptual framework
Source: World Bank.
Finally, a special effort of the report will be to identify and measure long term
trends. Rather than attempting to explain differences across countries at a specific time, the attention and value added of the report is to evaluate changes across time. These are more likely to be linked to the long term structural forces—such as globalization, technological change and demographic aging (see Annex 1 for more details)—and likely to continue in the future.
A preview of the data and analyses of the distributional tensions proposed in this report is presented in the next sections, followed by a description of the policy analysis proposed for Part II of the report.
I.1 Trends of Inequality and Perceptions
Countries in Europe and Central Asia (ECA) have made progress in recent years in reducing poverty and increasing social mobility. Aggregate indicators show that, over the last 15 years, the share of households considered ‘middle class’4 has more than doubled, while that of the poor has declined sharply (Figure 2). Overall, economic growth appears to have followed an inclusive pattern in ECA. The income/consumption growth of the bottom 40 percent of the population has exceeded that of the population as a whole in several countries (Figure 3). While inequality remains higher than at the end of the 1980s (before the economic transition), over the last decade inequality has either remained stable or fallen in the majority of countries (see Figure 4).
Fairness
Unstable Broad, Stable
support support
(Economic) (Economic)
Insecurity Security
Forced
Revolt Stability
Unfairness

6 ● Leveling the Playing Field: Rethinking the Social Contract in ECA
Figure 2: The share of the ECA population that is poor or vulnerable has fallen, 2000–2015
Source: Davalos et al. (2016).
Figure 3: Per capita incomes of the bottom 40 percent have grown more rapidly than the average in many ECA countries, PPP 2005 USD
Source: Davalos et al. (2016).
In 2014, 32.05% of households are estimated to live between US$ 5.00 and US$10
0%
20%
40%
60%
80%
100%
2000 2001 2002 2003 2004 2005 2006 2007 2008 2009 2010 2011 2012 2013 2014 2015
Extreme Poor (Living below $US 2.50) Moderate Poor (Living between US$2.50 -5.00)
Vulnerable (Living between $US 5.00- 10.00) Middle Class (Living above US$10)
-8%
-6%
-4%
-2%
0%
2%
4%
6%
8%
10%
Cro
atia
(2
00
9-2
01
2)
Latv
ia (
20
07
-20
12
)
Mo
nte
neg
ro (
20
09
-20
14
)
Esto
nia
(2
00
7-2
01
2)
Hu
nga
ry (
20
07
-20
12
)
Lith
uan
ia (
20
07
-20
12
)
Serb
ia (
20
08
-20
13
)
Alb
ania
(2
00
8-2
01
2)
Slo
ven
ia (
20
07
-20
12
)
Bo
snia
&H
erze
govi
na
(20
07
-…
Cze
ch R
epu
blic
(2
00
7-2
01
2)
Kyr
gyz
Rep
ub
lic (
20
09
-20
14
)
Arm
enia
(2
00
9-2
01
4)
Bu
lgar
ia (
20
07
-20
12
)
Po
lan
d (
20
07
-20
12
)
Ro
man
ia (
20
0.7
-20
12
)
Turk
ey
(20
08
-20
13
)
Tajik
ista
n (
20
12
-20
14
)
Ukr
ain
e (2
00
9-2
01
4)
Ge
org
ia (
20
09
-20
14
)
Mo
ldo
va (
20
09
-20
14
)
Mac
edo
nia
, FYR
(2
00
9-2
01
3)
Slo
vak
Rep
ub
lic (
20
07
-20
12
)
Ru
ssia
n F
eder
atio
n (
20
07
-…
Bel
aru
s (2
00
9-2
01
4)
Kaz
akh
stan
(2
00
9-2
01
3)
Inco
me/
con
sum
pti
on
gro
wth
, % Bottom 40% Total Population

Part I: Distributional tensions in ECA ● 7
Figure 4: Inequality declined in many ECA countries, particularly in the east, 2000-03 to 2012–14
Source: World Bank (2016a).
Despite these improvements, many individuals in ECA perceive that inequality
is growing and mobility is becoming more limited. In more than half of ECA countries, the majority of individuals surveyed in 2015-16 believe that inequality rose over the previous four years, while most countries actually experienced a decline in inequality over this period (EBRD 2016). And the share of the population in some ECA sub-regions who felt that their economic circumstances had improved (compared to their parents’ generation), and who expected their children’s economic circumstances to improve (compared to their own) declined from 2010 to 2015 (figure 5), although average views of past and future mobility differed greatly across the sub-regions. Nearly half of the region’s households believed they were worse off in the 2000s than in 1989, before the economic transition Cancho et al. (2015).
The gap between objective and subjective indicators may be quickly dismissed by assuming that people misperceive actual distributional changes. While this is a possibility, the gap may also indicate that some indicators, such as the Gini index or the economic growth of the bottom 40, are not measuring the form of inequality that is important for many people A major focus of the report is determining the source of unfairness that is driving discontent—or in other words, what is the type of inequality that we should care about? Do we need to consider, in addition to standard summary statistics, other indicators of distributional change? The failure of perceived life satisfaction to increase with gains in economic terms may reflect the importance of non-economic factors such as people’s status, their relative position, or whether the system is perceived as fair.

8 ● Leveling the Playing Field: Rethinking the Social Contract in ECA
Figure 5: Perceptions of upward mobility have fallen in many ECA sub-regions
a. Share of individuals believing that their income is higher than
their parents’ income
b. Share of individuals believing that their children’s income will be
greater than their own income
Source: World Bank (2016a). Note: The higher the answer, the better the expectations of mobility. The survey answers are from 1 to 5. Here they are rescaled from -2 to 2, with 0 the middle answer (previously 3).
This failure may also reflect biases in perception. Analysis of LITS III survey
data shows that an individual’s actual level of consumption compared to others is a poor predictor of his or her perceived level of consumption compared to others.5 Fifty-nine percent of individuals viewed themselves as in the middle of the consumption distribution (4th, 5th or 6th decile), compared to 30 percent as the data are constructed. While individuals may not have full information about relative consumption (or income) levels, this result is more likely a reflection of other factors important to subjective economic standing. For example, individuals may perceive their position not with respect to the national group but to a different reference group6, or to their own position earlier in time, or to their expectations of future opportunities. If so, the fact that responses are concentrated in the middle of the distribution would mean that most people feel they are in a similar economic standing as in the past.
Perceptions of one’s position vis-à-vis others may also depend on job circumstances. For example, a more detailed analysis uses data from the survey LITSIII to regress individual responses of subjective economic standing
(𝑃𝑜𝑠𝑖𝑡𝑖𝑜𝑛𝑗,𝑐) on the consumption level (𝑑𝑒𝑐𝑖𝑙𝑒𝑗,𝑐), job stability (𝑤𝑜𝑟𝑘𝑗), and
several control variables (level of education, gender, marital status, the size and gender composition of household, an urban/rural dummy, religion, risk aversion and the opinion towards the market economy), according to the following logit specification:

Part I: Distributional tensions in ECA ● 9
𝑃𝑜𝑠𝑖𝑡𝑖𝑜𝑛𝑗,𝑐 = 𝜙(𝛼 + 𝛽𝑑𝑒𝑐 𝑑𝑒𝑐𝑖𝑙𝑒𝑗,𝑐 + 𝛽𝑗𝑜𝑏𝑤𝑜𝑟𝑘𝑗 + 𝛾𝑋𝑗 + 𝛿Ι𝑐 + 𝑢𝑗)
The results indicate that whether one has a stable job (defined as at least 8 months’ continuous employment in the previous year) is an important predictor of the probability of perceiving oneself as poor. For example, the difference between having a stable job or not for a person in the second decile of consumption has the same effect on the probability of feeling poor as moving up three deciles (figure 6). Thus, having a stable job can be as important as consumption (within some range) in determining perceptions of economic standing.
Figure 6: Job stability is important to whether one feels poor
Source: Authors’ elaborations on LiTS III data. Note: This figure shows the probability of feeling poor, defined as believing one is in the bottom 30 percent of the consumption distribution, depending on each decile of consumption expenditures.
To summarize, distributional tensions (or perceptions of these) are rising in
ECA despite declines in inequality and poverty. In part this is because many people do not believe that inequality has fallen, or that their own circumstances have improved or are likely to do so. In part, this reflects the fact that other circumstances, for example changes in job status, are also important to satisfaction with the existing order. The report will analyze trends in different indicators of inequality, the forces driving these changes (including tax and transfer systems) and the extent of differences between perceptions and data on inequality.

10 ● Leveling the Playing Field: Rethinking the Social Contract in ECA
I.2 Labor market polarization
Labor markets in ECA countries have undergone important structural changes over the past decade or so. Two are highlighted here and will be the focus of detailed analysis in the report: a) changes in traditional full time permanent job arrangements and b) the polarization of occupations.
The share of workers employed part time has risen (Figure 7). This is true for both male and female workers, indicating that the rise in part-time work is not mainly driven by changes in the gender composition of the labor force, or by increasing demand for flexible work arrangements among females and older individuals. Temporary employment also has risen.
Figure 7: The importance of temporary and part-time employment is rising in ECA
Source: Own estimates based on EU-SILC and HICES.
And the share of middle-skilled, routine jobs has dropped sharply, while the
employment shares of low- and high-skilled, non-routine activities have increased (Figure 8). This also is reflected in declines in earnings by workers performing routine tasks compared to those performing non-routine, cognitive tasks.7 All of
0
.05
.1.1
5.2
.25
2003 2013
Northern Europe
0
.05
.1.1
5.2
.25
2003 2013
Western Europe
0
.05
.1.1
5.2
.25
2003 2013
Southern Europe
0
.05
.1.1
5.2
.25
2007 2013
Central Europe
0
.05
.1.1
5.2
.25
2003 2013
Turkey
% o
f w
ork
ing a
ge p
op
Temporary work Part time work

Part I: Distributional tensions in ECA ● 11
these changes could have increased uncertainty about job stability and the prospects for reaching a middle-class standard of living. Qualitative research from nine ECA countries suggests that concerns about jobs and the potential for a shrinking middle class are a source of discontent, notwithstanding the region’s comparatively rapid economic growth (Davalos et al. 2016).
Figure 8: Labor market polarization in ECA
Source: WDR 2016, based on ILO Laborsta (various years); I2D2 (World Bank, various years).
Recent anecdotal data suggests that the fall in more traditional forms of
employment (including those related to routine tasks) has contributed to the rise of political polarization. In Poland, for example, where recent elections led to the rise of a populist government, the increase in temporary and part-time work was greater than in most other countries. On the other hand, the scant empirical research available does not provide evidence of a relation between a rise in temporary work and extremist political views. Individuals on temporary contracts in OECD countries are more likely to vote for new leftist parties, and support the expansion of the welfare state (Negri, 2015). Further research is necessary to improve our understanding on this issue.
A further challenge in developed economies is that younger (millennial) workers want more customization of the employment relationship, to be on equal terms with employers (eschewing the traditional command and control relationship) and demand greater fulfilment through work. Such expectations may not necessarily be met in a job market where workers are facing high levels of stress and overwork, while others are bored with their jobs. Azkenazy (2016) finds that demands on members involved in several occupations increased, but autonomy declined, between 1995 and 2010. The result is an increase in the level of job strain that many workers, even those in full-time work, are experiencing.
-1.5
-1
-0.5
0
0.5
1
Russia Ukraine CentralEurope
NorthernEurope
SouthernEurope
WesternEurope
Turkey WesternBalkans
An
nu
al p
erce
nta
ge c
han
ge b
etw
een
1
99
5 a
nd
20
12
in s
har
e o
f m
idd
le-
skill
ed e
mp
loym
ent
High-skilled occupations (intensive in non-routine cognitive and interpersonal skills)
Middle-skilled occupations (intensive in routine cognitive and manual skills)
Low-skilled occupations (intensive in non-routine manual skills)

12 ● Leveling the Playing Field: Rethinking the Social Contract in ECA
Time permitting, the report could investigate why autonomy has decreased and whether there are policy measures that can promote increased autonomy.
A main question that the report will address is how job polarization and associated changes in the occupational structure affect income distribution in ECA countries. In particular, the report will document whether middle deciles of the distribution are affected by these changes and understand the mechanisms. An inequality decomposition analysis based on Bourguignon and Ferreira (2005) and Inchauste et al. (2014) will be carried out for a set of selected countries (see Annex 2 for a methodological explanation). This decomposition technique will enable identification of the specific distributional effect of job polarization on wages and, ultimately, on total income. An important objective is to assess how much the hollowing out of the middle class is linked to labor market transformations.
The report will also consider how labor market policies interact with polarization, and the relationship with political tensions. Some initial stylized facts on the type of contract (permanent or temporary, formal or informal) and the interaction with some core labor market policies such as the minimum wage, in-work benefits, and so on, can be presented. The list of countries, variables that will be analyzed and the main sources to be used are presented in Annex 4.
I.3 Horizontal inequality—growing disparities between groups: the generational divide and spatial inequality
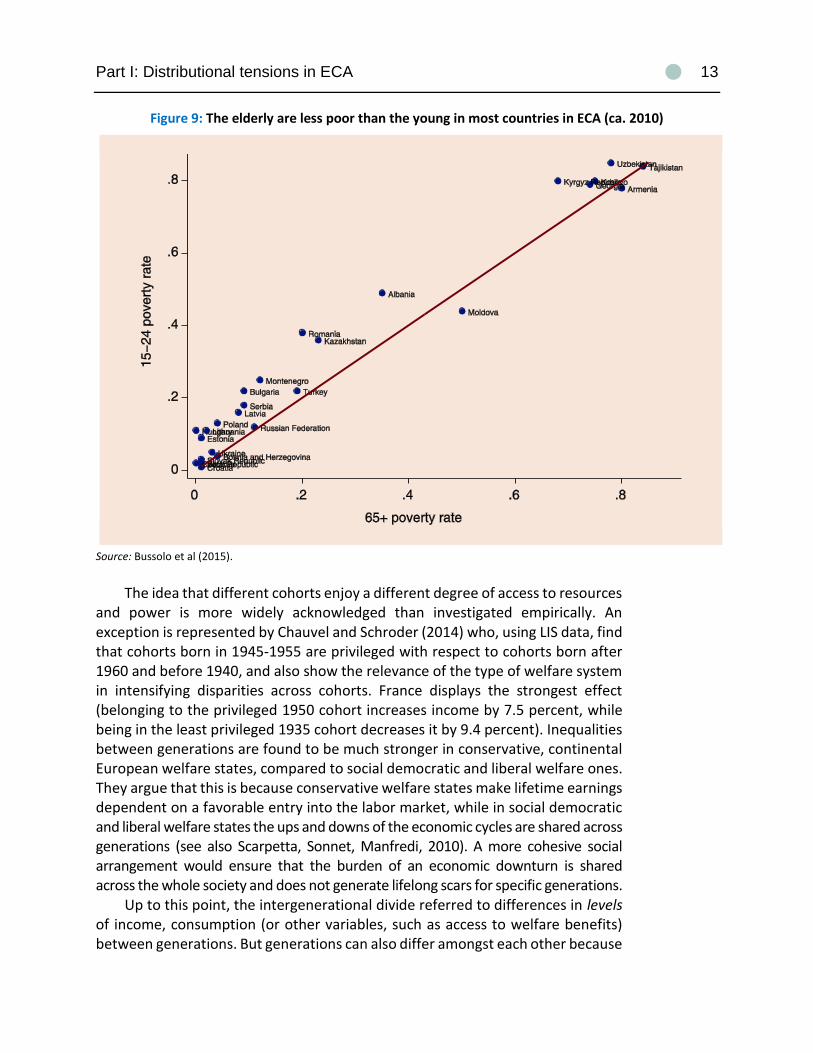
Inequality between generations is prevalent in the ECA region. For example, vulnerability, poverty and unemployment tend to be higher for young individuals, while poverty among pensioners is lower (see Figure 9). Transfers may contribute to intergenerational inequality. In Turkey, for example, per capita transfers to the population above the age of 44 are two and a half times greater than to children, largely because of high pension expenditures (Hentschel et al 2010).
The intergenerational divide seems to have become significant in the recent years, as shown by the high levels of unemployment amongst the young in many countries of the region. Typically this divide grows during and after periods of recession. The larger resources available to older generations in part reflects the greater economic opportunities, in terms of employment, lifetime earnings, career patterns, standard of living and insurance against risks, open to cohorts who started their working lives during an economic boom. However, the welfare system can exacerbate the disadvantage of cohorts (such as the current young ones in Europe) that start their working life during a recession, especially if the accumulation of benefits depend on traditional forms of (full-time, permanent) employment.
Part I: Distributional tensions in ECA ● 13
Figure 9: The elderly are less poor than the young in most countries in ECA (ca. 2010)
Source: Bussolo et al (2015).
The idea that different cohorts enjoy a different degree of access to resources
and power is more widely acknowledged than investigated empirically. An exception is represented by Chauvel and Schroder (2014) who, using LIS data, find that cohorts born in 1945-1955 are privileged with respect to cohorts born after 1960 and before 1940, and also show the relevance of the type of welfare system in intensifying disparities across cohorts. France displays the strongest effect (belonging to the privileged 1950 cohort increases income by 7.5 percent, while being in the least privileged 1935 cohort decreases it by 9.4 percent). Inequalities between generations are found to be much stronger in conservative, continental European welfare states, compared to social democratic and liberal welfare ones. They argue that this is because conservative welfare states make lifetime earnings dependent on a favorable entry into the labor market, while in social democratic and liberal welfare states the ups and downs of the economic cycles are shared across generations (see also Scarpetta, Sonnet, Manfredi, 2010). A more cohesive social arrangement would ensure that the burden of an economic downturn is shared across the whole society and does not generate lifelong scars for specific generations.
Up to this point, the intergenerational divide referred to differences in levels of income, consumption (or other variables, such as access to welfare benefits) between generations. But generations can also differ amongst each other because

14 ● Leveling the Playing Field: Rethinking the Social Contract in ECA
of disparities in the dispersion of these same variables. Recent empirical evidence shows that inequality in the distribution of resources (consumption, income and wealth) is higher for the younger cohorts than for older ones controlling, and this is crucial, for the age effect. Deaton and Paxson (1994) and others show that the relationship between age and inequality almost represents an inverted U. Similar evidence for the ECA region is presented in Bussolo, Koettl-Brodmann and Sinnott (2015). However, these studies do not discuss in detail the cohort effect, i.e. whether within group inequality is higher—no matter at which age—for younger generations (see annex 3). A forthcoming study of the OECD discusses whether future societies may become more unequal because both effects—age and cohort—will push up inequality
Some preliminary analysis for the region shows that there is an increasing cohort effect. Younger cohorts start their life cycle with a higher level of inequality than older cohorts. Or, in other words, compared at a fixed age, inequality for a cohort born more recently is higher than that for a cohort born further in the past. Figure 10 shows an example of this preliminary evidence for Poland.
Figure 10: Age and cohort effects for family consumption inequality in Poland
Source: Authors’ calculations on household surveys for Poland.
The report will analyze whether this is a common trend across countries in
the region and what may be the factors determining this cohort effect. One hypothesis is that, especially for the former communist countries, inequality of opportunity may be rising. Inherited better positions give some people in the younger cohorts advantages over others, and this increases initial inequality within these younger cohorts. But this mechanism may be at work also for other countries.
More generally, the report will analyze the implications of inequality across generations in ECA for the social contract, explore the impact of the tax and transfer systems, and discuss alternative arrangements by which the broader

Part I: Distributional tensions in ECA ● 15
system (changes in tax and transfers, investments in quality education and health systems) could improve intergenerational equity.
Another relevant type of horizontal inequality is that between regions. Location continues to play an influential role in determining individuals’ opportunities and present wellbeing in Europe and Central Asia. Differences in access to basic services (such as education and health) and to economic opportunities persist across regions, and between urban and rural areas. This results in large disparities in living standards within countries across ECA (Figure 11). From a small country like Moldova to a large one like Russia, for instance, sub-national poverty rates vary by a factor of five.8
Figure 11: Inequality in income/consumption within countries
a. Ranges of per capita income in the Europe and Central Asia region (bottom to top decile)
(Continued next page)

16 ● Leveling the Playing Field: Rethinking the Social Contract in ECA
Figure 11 (continued)
b. Albania: Consumption Per Capita (2011 Population Census and 2012 LSMS)
Sources: EBRD (2016) and Davalos and Thomo (2016).
Importantly, place of birth can also limit the opportunities for individuals
throughout their life. Whether a person is born in an urban or a rural area in the ECA region explains close to 20 percent of the inequality in opportunities to access tertiary education, jobs and in income (EBRD, 2016).
Despite improvements in wellbeing at the national level, some lagging regions within countries are not catching up. For example, regional poverty rates in Turkey failed to converge from 2006 to 2013, due to insufficient progress in the Eastern mountainous areas, which rely mostly on agriculture and have large ethnic minorities (Azevedo et al 2016). Poverty reduction in poorer regions was

Part I: Distributional tensions in ECA ● 17
particularly limited after the global financial crisis. Similarly, while poverty has fallen across regions in Georgia since 2010, a clear regional divide in living standards between East and West is emerging. And the share of people below 60 percent of median income (at-risk-of-poverty) increased in Bulgaria from 2008 to 2013, but the rise was much greater in the South Central and North Eastern regions due to higher unemployment rates among low-skilled workers (World Bank, 2015a). More broadly, inequality between regions rose from 1995 to 2014 in several, but not all, European OECD countries (Figure 12); regional inequality in the euro zone countries has increased particularly since the financial crisis (The Economist, October 2016). Evidence for OECD countries points to disparities not only in income, but in other areas such as air pollution and safety. However, between-region gaps in education and access to services have narrowed.
Figure 12: Coefficient of variation of regional disposable income, 1995 and 2014
Source: OECD (2016).
0 0.05 0.1 0.15 0.2 0.25 0.3 0.35 0.4 0.45
DNK
AUT
NOR
SVN
FRA
BEL
NLD
SWE
IRL
DEU
FIN
POL
HUN
PRT
CZE
GBR
ESP
GRC
ITA
EST
SVK
Coefficient of variation (regional disparities)
2014 1995

18 ● Leveling the Playing Field: Rethinking the Social Contract in ECA
Spatial disparities in income and production are part of the development process (World Bank 2009). Geographic concentration brings economic efficiency through agglomeration, migration and specialization and, to the extent that economic gains are translated into spatial convergence in living standards, they can lead to equal opportunities (equity) for individuals regardless of where they live. Nevertheless, these disparities can contribute to distributional tensions, and to varying perceptions of prosperity and fairness depending on where individuals live. Forty percent of the variation in self-reported life satisfaction in OECD countries can be attributed to regional characteristics (OECD, 2016). In Europe and Central Asia, living in a rural area in 2006—a pre-crisis period with overall rapid growth in the region- was associated with a more negative perception of economic mobility (Cancho et al.2015).
The report will explore the extent and evolution of territorial inequalities for countries in the region and their underlying factors, to discuss their potential contribution to distributional tensions. The analysis will focus on the equity aspects of territorial inequalities, while acknowledging the affect they may have on efficiency as well. Annex 5 provides details on methodology and data.
I.4 Inequality of opportunity
Inequality of opportunity, that is, unequal distribution of income, education or employment due to the circumstances of one’s birth, has recently gained a center stage in discussions about inequality, fairness and social welfare (see Roemer and Trannoy 2016 and Ferreira and Peragine 2016). Proponents of this approach argue that the degree of equal opportunity is crucial in determining the acceptability of inequality in a given society. Surveys show that most people judge income inequalities arising from different levels of effort as less objectionable than those due to exogenous circumstances such as gender, race, family origin, etc. There is a widespread view in ECA that the system is not “fair”—connections matter disproportionately in accessing jobs and improving wellbeing (Davalos et al. 2016) (Figure 13).
Moreover, high or rising inequality of opportunity can impair incentives for work. If people feel that their success is largely dependent on their own efforts, they are more likely to pursue education, participate in the workforce and invest or engage in activities that lead to economic growth and prosperity. If people do not believe they will be rewarded for hard work and ability, there may be little incentive for them to build their skills or invest in a business. High inequality of opportunity also may increase preferences for redistribution (Alesina and La Ferrara, 2005; Eisenkopf et al., 2013), while being able to benefit from one’s own hard work can reduce support for redistribution (Balafoutas et al., 2013).

Part I: Distributional tensions in ECA ● 19
Figure 13: Perception of unfairness in getting ahead: the importance of “having connections”
Source: Davalos et al (2016).
Even if inequality of outcomes does not change much over time (as in many
ECA countries over the past decade—see above), the share of that inequality that is due to circumstances beyond the control of the individual may rise. This increase in the inequality of opportunity may generate a crucial distributional tension that may have far reaching consequences for the social contract.
Measures of inequality of opportunity differ significantly from overall measures of inequality. Rankings of countries according to total inequality in 25 European countries, where Nordic countries are lowest and Mediterranean and Anglo-Saxons are highest, differ somewhat from country rankings by the level of inequality of opportunity (Checchi et al. 2016). Trends in inequality of opportunity differed from trends in total inequality in some Central and Eastern European countries from 2004 to 2010 (Brzeziński and Magda 2016).9
Measures of inequality of opportunity exhibit less cyclical fluctuations than measures of total inequality, suggesting that inequality of opportunity captures underlying mechanisms of income generation, which are deeply rooted in the country social systems. In the Checchi et al (2016) study, inequality of opportunity in a few countries (Czech Republic, Poland and Hungary, and Finland and Slovenia to a lesser extent) remained almost stable from 2004 to 2010.
Inequality of opportunity in the 32 countries in the transition region may be higher than in Western Europe, but lower than in Brazil, India and the United States (Brock et al., 2016).10 Across the region, parental background is the most important determinant of inequality of opportunity, followed by gender.
0%
10%
20%
30%
40%
50%
60%
Ne
w/b
ette
r jo
b
Ne
w/g
row
ing
bu
sin
ess
Go
od
co
nn
ecti
on
s
Mig
rati
on
Edu
cati
on
/tra
inin
g
Att
itu
de/
har
d w
ork
Fam
ily s
up
po
rt
Bu
dge
tin
g/sa
vin
g
Incr
eas
ed c
rop
pro
du
ctio
n/l
ive
sto
ck
Loan
/cre
ditSh
are
of
resp
on
den
ts o
f ea
ch s
ex
Men (755 respondents) Women (771 respondents)

20 ● Leveling the Playing Field: Rethinking the Social Contract in ECA
Access to education is also significantly dependent on parental background in many ECA countries.11 Analysis of PISA 2015 scores from a subset of ECA countries reveals that students from better households learn, on average, the equivalent of three additional years of schooling in mathematics when compared to peers from poorer households. Moreover, students from urban areas perform, on average, the equivalent of having one more year of schooling compared to those from rural areas.12
While the share of the population gaining tertiary degrees has increased, inequality of opportunity with respect to education has increased for the younger cohorts who began school after the fall of the Berlin Wall (Figure 14). In part, this reflects the transition from universal, free provision of tertiary education to the imposition of (often non-trivial) fees, and the phasing out of scholarships to cover the cost of living for students. The highest portion of inequality of opportunity in education is attributable to parental background, while being born in a rural area accounts for nearly 20 per cent of the estimated inequality of opportunity.13 In contrast, the importance of parents’ communist party membership has halved. Lastly, note that the importance of father’s education for educational attainment did not increase for the younger cohorts in Italy, Turkey and Greece, which did not undergo the same transformation.
Figure 14: Changes in levels of inequality of opportunity for tertiary education
Source: EBRD (2016). Note: The charts show a Dissimilarity index inequality of opportunity, based on a probit regression of the variable indicating the completion of some form of tertiary education on individual characteristics (birthplace, parental education, ethnicity, parental membership to the communist party). The younger cohort consists of those whose education began after 1989 (Fall of Berlin wall), while the older cohorts of those whose education began before 1989.
0
0.1
0.2
0.3
0.4
0.5
Bu
lgar
ia
Geo
rgia
Lith
uan
ia
Mo
ldo
va
Kaz
akh
stan
Gre
ece
Cyp
rus
Mo
ngo
lia
FYR
Mac
edo
nia
Ro
man
ia
Alb
ania
Bel
aru
s
Ukr
ain
e
Aze
rbai
jan
Arm
enia
Kyr
gyz
Rep
.
Hu
nga
ry
Turk
ey
Tajik
ista
n
Bo
snia
& H
erz.
Esto
nia
Ko
sovo
Mo
nte
neg
ro
Uzb
ekis
tan
Cze
ch R
ep.
Serb
ia
Slo
vak
Rep
.
Ru
ssia
Latv
ia
Cro
atia
Ital
y
Ger
man
y
Po
lan
d
Slo
ven
ia
Ine
qu
alit
y o
f o
pp
ort
un
ity
for
ed
uca
tio
n (
D-i
nd
ex)
Parental background (older cohort) Birthplace & ethnicity (older cohort)
Inequality of opportunity, younger cohort

Part I: Distributional tensions in ECA ● 21
Levels of wealth in the ECA region are also highly dependent on family circumstances. While the availability of data has limited research on the intragenerational transmission of wealth, a recent study based on newly-constructed European datasets finds that households who inherit money have considerably more wealth than non-inheriting households in all European countries (Korom, 2016). Comparing biological and adoptive parents, Black et al. (2015) find that differences in levels of wealth are not explained by "genes" or transmitted talent. Most of wealth inequality at age 18 is due to intergenerational transfers in Denmark (Boserup et al. 2016) and Norway (Fagereng et al. 2015). Moser et al. (2016) find that inherited wealth is more important than labor income in explaining the intergenerational correlation of wealth. With slowing growth, transmitted wealth is becoming more important and contributing to higher wealth inequality (see Piketty, 2011 for France and Ohlsson et al., 2014 for Sweden). Wealth inequality and education inequality among parents are correlated, which implies that the two kinds of inequalities of opportunity cumulate in the next generation. This leads to high levels of inequality of opportunity in income at adulthood.
Different channels may explain the levels and the trends of inequality of opportunity in the ECA region. Regulatory and economic benefits in many ECA countries tend to accrue to politically connected or influential “insider” investors at the expense of “outsiders.” The legacy of a large state role, the history of insider privatizations in the 1990s, and the persistent effects of communism on social capital and corruption, along with the importance of natural resource rents in Central Asia, all increase the potential for connected firms to shape both the formulation and the implementation of regulations and tax policies, capture a disproportionate share of public procurement contracts, or access a disproportionate volume of bank credit, either through state-led directed lending or due to perceptions that these firms are safer credit risks. Capture of benefits by insiders can misallocate resources, particularly capital, across firms. Small, entrepreneurial investors without political connections are unable to compete fairly and access capital to grow their operations. More broadly, the competitive pressures that lead to efficient factor allocation across sectors and firms are constrained.
Considerable analysis already has been devoted to identifying these problems of capture, non-competitive business environments and poor work incentives in ECA. But there is increasing evidence that problems of misallocation are worsening throughout the ECA region, particularly after the global financial crisis, particularly affecting access to education and holdings of wealth.
The report will contribute to the debate on inequality of opportunity through the generation of data and policy analysis. Estimates of inequality of opportunity will be provided for the non-EU countries in the ECA region, which have been neglected by the existing literature. The long-term evolution of inequality of opportunity will be explored for the limited number of ECA countries where

22 ● Leveling the Playing Field: Rethinking the Social Contract in ECA
adequate data are available. Policy issues are discussed below. The report also will address the problems of political capture and factor misallocation in ECA, relying on existing literature as well as new research in a subset of countries based on new data matching firms and politically exposed individuals. The objective is to identify potential channels to overcome these challenges and level the playing field for investors.

23 23
Part II. When distributional tensions persist: Implications for the sustainability of the social contract
The increasing distributional tensions described in Part I threaten to undermine the social contract in ECA. Policy changes, perhaps radical, may be necessary in many countries to: (i) reduce tensions in labor markets arising from rapid technological change and globalization ; (ii) support the sustainability of transfer systems and maintain their contribution to poverty reduction and consumption smoothing, while expanding their ability to address the increasing risks to the middle class (iii) transform educational systems to support lifelong learning more effectively and reduce inequality of opportunity. This part discusses the nature of the social contract in the region and starts a crucial debate on how to rethink policies to address the identified challenges.
Underlying all stable societies is some form of social contract—the set of institutional arrangements, the rules of exercising and sharing power, control over resources and their sharing that ties citizens to the state and enables individuals to anticipate the behavior of others (World Bank 2017). According to Rodrik (1999), well-functioning social contracts allow countries to manage shocks well and adapt to new efficient equilibria. Countries that have unresolved distributional conflicts may experience inefficient outcomes, as losers do not trust the system, opt out, and resist the adjustments needed.

24 ● Leveling the Playing Field: Rethinking the Social Contract in ECA
II.1 The social contract in ECA: Its history, promise, and new challenges
The formation of the social contract in ECA countries has a long history, beginning with the Elizabethan “Poor Relief Act” in 1601 that created a poor law system in England and Wales. The major foundations for social contracts that prevail in most ECA countries developed after WWII. Countries behind the iron curtain had a system based on collective ownership of many of the means of production where enterprises were the main suppliers of welfare services. Western European economies supported economic and social interventions to provide social justice within the framework of a capitalist economy and representative democracy. At the same time, capitalist democracies varied in terms of the emphasis they placed on welfare and how it was provided.
The social contracts in ECA have confronted serious challenges over the past decades. In Western Europe, the end of full employment in the 1970s led to changes and some retrenchment in the welfare state. The fall of the Berlin wall, and the varying speed of transition experienced by the former communist and Soviet Bloc countries also drove a transformation of welfare systems. More recently globalization, population aging, and rapid technological change have challenged the sustainability and effectiveness of social protection systems. A simple typology indicates how transition economies have increasingly started to diverge in terms of reforms of the welfare state in recent years (see Box 1, which provides a preliminary typology of social welfare systems in European Union countries. This typology is based on two simple characteristics (in 2012)—the total expenditure on state transfers through the social protection system and the coverage of the poorest quintile.)
Box 1: Typology of social protection systems
Large balanced welfare states are characterized by high social protection spending that goes hand in hand with high social assistance coverage of the poorest quintile and includes most Western European countries—Austria, Belgium, Cyprus, Denmark, France, Finland, Hungary, Ireland, Luxembourg, the Netherlands, Slovenia, Sweden, and the United Kingdom. Averaging 21 percent of GDP in 2012, their social protection spending is relatively high. They have a relatively more balanced breakdown between social assistance and social insurance spending, enabling them to offer protection and income replacement (upon retirement) to formal sector workers while also providing safety nets for the poor and vulnerable. These countries are able to cover a significant portion of the bottom quintile (around 80 percent on average) through their social assistance programs. The social protection system includes a balanced mix of programs with basic elements that buffer against different risks (e.g., risk of unemployment, of disability, of poverty). It also includes instruments to connect people to opportunities, such as providing job search assistance, counselling, and social services.
(Continued next page)

Part II: Implications for the sustainability of the social contract ● 25
Box 1 (continued)
As large balanced welfare states are expensive, fiscal sustainability of the system provides the key risk in terms of whether such countries can continue to provide protection during future crisis episodes. A fall in GDP could necessitate cuts in expenditure, and the quality of fiscal consolidation will determine if these states are able to become leaner, but still maintain protection of the vulnerable.
Truncated welfare states are characterized by low coverage of the poorest quintile by social assistance despite high levels of social spending. The Southern European countries, Greece, Portugal, Spain, and Italy, fall in this group. Their overall social protection spending of around 21 percent of GDP is similar to that of large balanced welfare states. Yet, a relatively large share of their spending is dedicated to social insurance. This system thus
focuses on covering formal sector workers and managing the lifecycle risk of old age poverty. Overall social assistance programs, or indeed coverage, of the non-formal sector, is not well-developed. The system is therefore not well designed to protect vulnerable groups, such as the young and the poor, against risks.
Small balanced welfare states are characterized by low social protection spending, but high social assistance coverage of the bottom quintile. The Eastern European countries of Latvia, Lithuania, Romania, Slovak Republic, and the island of Malta fall under this group. Most have reformed (and continue to reform) their social protection systems since the 1990s transition and have steered them to a relatively more balanced approach which offers a mix of programs that cover various risks and covers a large share of the poorest population, mostly through categorical/universal programs but still at relatively low costs. The main shortcoming of these states is the low adequacy of transfers.
Limited welfare states are characterized by low social protection spending and low coverage of the poorest quintile by social assistance. The Eastern European countries of Bulgaria, Croatia, Czech Republic, Poland, and Estonia fall in this group. Similar to the small balanced welfare states, these countries started to reform the social protection systems they had inherited from socialist times. Yet, they chose a different direction by limiting the protection offered by the public sector, resulting in minimal protection of the poor against various shocks.
Source: World Bank (2015b).

26 ● Leveling the Playing Field: Rethinking the Social Contract in ECA
The promise of the social contract in ECA
The basis of a welfare state is a commitment to social citizenship with goals of achieving equality, justice, freedom and solidarity for citizens. A broad definition focuses on how the overall economy is organized, and includes issues of employment, wages, and other labor market institutions, that influence the distribution of income. For a large majority of people, labor income is the largest component of overall income. As such, labor market functioning and resulting labor outcomes have a large impact on welfare. A good quality job also confers status and often a certain degree of autonomy and sense of control that is important for well-being. For this reason, the report places labor market functioning at the center of the promise of the social contract (see Figure 15). Various elements of the welfare state interact with labor markets to generate labor outcomes. Education systems prepare youth for labor markets; health systems insure citizens from adverse health episodes; labor market institutions and tax and transfer systems can affect the returns from work; and labor market policies can help individuals transition between jobs.
Figure 15: The promise of the social contract
Labor market functioning
and outcomes
Labor market institutions
Tax and transfer systems
Educational Opportunities
Health systems and
coverage
Labor market policies

Part II: Implications for the sustainability of the social contract ● 27
The new challenges to social contracts in ECA
Considering the importance of a stable income in people’s perceptions of well-being, decreasing job stability (with the rise in part time and temporary jobs), and changing content of jobs (due to polarization of occupations) pose a major challenge to the prevailing social contract. These phenomena affect generations differently thereby accentuating the inequality between the younger and the older generations. These tensions are further exacerbated due to increasing difficulties in financing generous pension benefits for the current elderly. Increasing geographical inequality also seems to present challenges for the prevailing political order.
Unequal access to opportunities for good quality education, stable employment etc., contributes to the perceptions that societies are growing more unfair. Inequality of opportunity explains a non-negligible portion of overall inequality. It tends to reinforce disadvantages related to family background and gender. As outlined in part I, in several EU countries, social class origin has a strong influence on the access to quality education, likelihood of unemployment, illness, living in a jobless household, single parenthood, temporary employment and low-paid employment (Pintelon et al. 2013).1 Similarly, Scervini et al. (2016) show that initial conditions such as parental background, gender and the region of origin are strongly related to the probability of employment and the type of job contract. Different risks at different moments in life are connected and can cumulate over time, underlining the need for interventions early in life and support to achieve smooth transitions following shocks.
Another challenge to the social contract is that some segments of the electorate increasingly perceive government as a biased party that is compromised by close ties with big business and financial institutions. As such, any fundamental reform of the welfare state will require government efforts to build greater trust between the state and citizen.
It is proposed that the report study the following:
Labor Markets:
Changes to labor market institutions to extend protection to those on alternative work arrangements and new types of contracts
Reforms to labor market policies and lifelong learning opportunities that effectively help workers transition between jobs
Policies (potentially beyond the labor market) that compensate losers for adjustment costs
Pension and social assistance systems:
Examine if and how pension systems can continue to cover the future elderly whose work careers may not have been stable

28 ● Leveling the Playing Field: Rethinking the Social Contract in ECA
Examine the move to social pensions, financed from general tax revenues, as an alternative to unsustainable promises of public pensions financed through ear-marked labor income taxes
Examine the feasibility, fiscal and social, of Universal Basic Income schemes that are universal payments to all adults, and not just the elderly
Education:
Examine the feasibility and effectiveness of expanding quality early childhood education
Examine whether basic education curricula need fundamental reforms given the changes in skill demands in labor markets
Taxes
Time permitting, the report will examine diversification of sources of revenue to finance the future social contract.
II.2 The future world of work and consequences for the social contract
The nature of employment is changing, which makes it difficult to continue to protect individuals through the employer based contract. Many millennials are engaged in portfolio work, i.e. those who hold several jobs at the same time. For instance, Katz and Krueger find that all of the net employment growth in the US economy from 2005 to 2015 appears to have occurred in alternative work arrangements, i.e. among temporary help agency workers, on-call workers, contract workers, and freelancers2. As mentioned in part I, the share of workers employed part-time, or on temporary contracts, is also rising in ECA countries. The old social contract, which has largely relied on a traditional relationship between the employee and employer to collect contributions and deliver benefits, is becoming both less effective and less efficient.
As wage work stagnates and alternate forms of contracts multiply, it is important that labor market institutions keep pace and continue to extend protection to individuals who work. To maintain a level playing field, appropriate regulations should apply to new modes of service delivery (e.g. Uber) as well as on-line platforms for talent exchange. Can workers who rely on a single employer be given the status of “dependent contractor” with consequently decreased protections? How should existing labor market institutions change to respond to changes in work arrangements? What is the role of statutory working hours in the case of people working multiple portfolios? How does unemployment insurance, parental leave, or other options apply? Some countries have experimented with innovative schemes such as the individual savings accounts and the report will examine such experiences.
The report will also study whether and how labor market policies facilitate workers given that the task content of jobs is changing. There’s a shift towards

Part II: Implications for the sustainability of the social contract ● 29
non-routine cognitive jobs, while manual jobs are declining almost everywhere in developed countries with some evidence of labor market polarization in developing countries (Acemoglu & Autor 2011, Hardy et al. 2016, WDR 2016b). Similarly, part I illustrates the labor market polarization in ECA (Fig 9). The change in task content of jobs, regardless of the underlying drivers, will create winners and losers, and affects may vary across generations
The report will study the differentiated support that may be required to address the needs of various generations and specific groups to alleviate between group inequality. For instance, older workers who lose manual jobs may find that their skills are no longer in demand. Upskilling opportunities for older workers may be expensive, and it may be more effective for social protection systems to protect such workers. On the other hand, for younger workers, upskilling and providing other types of employment support may be more effective and appropriate. For the future generations, the oldest of which are still in school, ensuring that relevant skills (such as the ability to communicate, commitment to continued training and learning, innovative thinking, ability to negotiate), are taught starting from early childhood through basic schooling would be important.
Increased mobility between jobs, and between dependent work and self-employment, can be better supported through providing individuals with access to appropriate lifelong learning opportunities. Improving access to and content of entrepreneurship education can promote successful self-employment. Allowing the self-employed to deduct appropriate education or training expenses can be an alternate way to promote needed skill acquisition. The self-employed also sometimes lack seed money in order to finance hard capital. Several experiments are currently being conducted on whether cash transfers given as a lump-sum (instead of a monthly amount) can help ease credit constraints for entrepreneurs and the self-employed. Looking beyond who is eligible for cash transfers (targeted vs universal), it is also important to look at the structure of the transfer and whether this helps support alternative forms of work and risk-taking.
Lastly, it is important to address adjustment costs and uncertainty due to increased job transitions. Workers who switch between sectors or occupations often face large costs in terms of training, lengthy unemployment, or cuts in wages. Given that these shifts are often driven by forces (lower barriers to trade, investment in technology, greater market flexibility) that benefit society as a whole, society should bear some of the costs of adjustment. However, there are few institutional arrangements to distribute these costs fairly, and some of the older institutions (e.g. unions) have weakened.
II.3 Reforming transfer systems to enhance welfare
Publicly provided and adequate pensions have been a fundamental part of the social contract in Europe. However given the changing world of work, and rapid

30 ● Leveling the Playing Field: Rethinking the Social Contract in ECA
population aging, they have become unsustainable and they serve to accentuate intergenerational inequality. With the traditional employer-employee relationship in decline, a more comprehensive approach may be to move towards provision of a social pension, on a universal or means-tested basis, financed from general tax revenues. The report will compare how social pensions perform against schemes such as Universal Basic Income, which are universal payments to all adults, and not just the elderly.
The behavioral perception of a pure transfer can be quite different from a pension transfer even when they are heavily subsidized. For instance, farmers’ pension schemes in several European countries are largely financed out of the budget rather than contributions; only 10 percent of payments is financed through contributions in the farmers’ pension schemes in both Greece and Poland. Such systems, which are explicitly subsidized by the government but where there is sufficient co-ownership by the recipient to alleviate stigma, may be one option to maintain pension coverage among the elderly. The size of the explicit subsidy should be made transparent and the design of any such scheme should ensure fairness within and across cohorts.
Even if governments choose to reform pension systems, such a transition would not be politically easy. Both the share of pension incomes, and the incidence of income taxes and social insurance contributions, in disposable income is fairly high for most households in several European countries (see Figure 16). Thus, even small changes in pension arrangements or their financing are likely to be politically very sensitive.
Figure 16: Composition of household disposable income: total population (2016)
Sources: World Bank staff calculations using EUROMOD G4.0+ on 2016 tax/benefits systems and policies and 2012 EU-SILC data. OECD modified equivalence scale used to calculate equivalised household disposable income.
-60
-40
-20
0
20
40
60
80
100
120
140
160
Latv
ia
Hu
nga
ry
Po
lan
d
Slo
ven
ia
Slo
vaki
a
Gre
ece
Bu
lgar
ia
Lith
uan
ia
Ro
man
ia
Cze
ch R
ep
Esto
nia
Cro
atia
Cyp
rus
SICs Income taxes Original Income Public pensions Non-means-tested benefits Means-tested benefits

Part II: Implications for the sustainability of the social contract ● 31
Social assistance programs can help level the playing field either through providing means-tested support to the poor or through universal benefits for vulnerable groups. Social assistance systems in the region are typically made up of a variety of programs with different objectives and financed through general tax revenue. For instance, minimum income programs help alleviate chronic poverty and potentially activate those who are able to work, child benefits protect and invest in families with children, and disability benefits support the disabled who may be excluded from the labor market, as well as can help connect others back to jobs. Social assistance expenditure constitutes a small fraction of overall social protection spending, ranging from a low of about 9 percent of overall social protection expenditures in Poland and Portugal, to a high of 33 percent in Denmark and 35 percent in Sweden. Given the changing circumstances in labor markets, as well as aging populations and unsustainable pension systems, social assistance programs could play a significantly more important role in social protection systems in the future.
The report will examine the evolution of the anti-poverty and redistributive performance of welfare systems over time. Have changes in social welfare systems contributed to ameliorating distributional tensions? Or has the increasing use of conditionality marginalized these systems and exacerbated the stigma associated with receiving benefits? Targeted interventions can provide reasonably generous transfers to segments of the population that are needy. However, targeting itself poses several challenges. Complex eligibility rules can lead to exclusion errors or non-take-up, and may result in many vulnerable groups being excluded by design. In addition, even those eligible for benefits may not receive them due to informational asymmetries, stigma effects, the administrative costs of applying, and poor administration capacity that place burdens on beneficiaries.
Universal transfers (for instance, Universal Basic Income) to all citizens as a replacement for the entire system of social transfers can overcome many of these challenges and can also administratively simplify social assistance systems. They may further serve to reduce distortions, as benefits are not withdrawn when a person enters employment. Because these transfers can be depended upon, they may provide the basic capital and insurance required to encourage risk taking and entrepreneurship. However, even modest universal transfers could come at a high fiscal cost. The report will consider the advantages, disadvantages, sustainability and feasibility within the ECA region of reforming existing social assistance transfers versus a basic income benefit.
Lastly, the report will examine the implications for overall tax policy and the size of government. If a large part of future transfers are to be financed from general revenues, the sources of revenue need to be diversified more than they have been in the past. The aging of the labor force as well as declining share of labor income make financing mainly through taxes on labor less sustainable. Looking at other sources of financing becomes important. The report will, time permitting, examine alternate sources of taxation to finance the welfare state.

32 ● Leveling the Playing Field: Rethinking the Social Contract in ECA
Such taxes could include taxation on pollution, real estate taxation, taxation of risky financial activities, taxation of market concentration and high market shares (to name a few).
II.4 Reforming education systems to reduce inequality of opportunity
Education systems can play a very important role in leveling the playing field thereby addressing concerns over the rise in inequality of opportunity described in Part I. The Bank has long argued for greater investment in education, and tremendous progress has been made in increasing the share of populations in developing countries that have completed primary and secondary school. However, an important element of growing inequality of opportunity concerns unequal access to high-quality education, as more disadvantaged groups go to schools with less-qualified teachers, poorer facilities and more limited access to modern technology.
Non-EU countries in the ECA region also face the issue of “Education Poverty,” as an important percentage of students participating in PISA can be classified as functionally illiterate or innumerate. In order to overcome these inequalities of opportunity and to tackle “education poverty” the report will look closely to countries which have succeeded in PISA over time such as Poland, Finland, Estonia and Russia and some of the Asian tigers (Vietnam, China, Singapore). The successful reforms that these countries have implemented include (i) attracting good teachers, (ii) putting an emphasis on assessment of students and schools; (iii) introducing accountability of the systems; (iv) providing autonomy to providers; and (iv) paying attention to Early Childhood Education.
Students who attend preschools perform better on PISA tests compared to those who do not attend preschool. While preschool access has substantially increased over the last several years in ECA countries, enrollment rates remain below OECD and EU averages. Increasing the availability of quality child care, which varies considerably across ECA (Eurostat), can improve opportunities for poorer children to build their human capital. It is also true that the effect of preschool is only positive if children attend high quality programs.
The report will also investigate whether the curriculum in ECA countries are preparing youth with skills demanded in today’s labor markets. Comparison of scores in PISA (which assesses the extent to which students can apply knowledge to real world situations) vs TIMMS (which uses the curriculum, broadly defined, as the major organizing concept in its testing) can provide insights into whether the curriculum is preparing students for the labor market. Having several years of education increases expectations of getting a good quality job on graduation. The failure of schools to prepare youths for the labor market of today could lead to disappointed expectations, and further enhance perceptions of a poorly functioning social contract.

Part II: Implications for the sustainability of the social contract ● 33
The report will investigate the existence and quality of life-long learning opportunities, and whether their design supports optimal learning by older workers. With the hollowing out of routine jobs, there is a growing demand for a variety of skills. Soft skills, such as the ability to communicate, commitment to continued training and learning, innovative thinking, ability to negotiate, and so on, are gaining increasing importance. Ensuring that such skills are taught during basic schooling and in life-long learning courses is important. As the number of career transitions each worker experiences is expected to grow, having effective and well-designed systems that support career transitions, including free or subsidized access to well-tested and effective upskilling opportunities, are important in managing the adjustment costs that workers will experience. Allowing the self-employed to deduct appropriate education or training expenses also can promote needed skill acquisition. Recognition of Prior Learning (RPL) is a process that identifies a person’s knowledge and skills acquired both in a formal as well as informal setting. Such systems, and potentially universally-recognized certification based on them, can facilitate job mobility based on competencies. Dual learning and apprenticeship programs, while expensive, can be highly effective in helping workers transition to new careers.
The report will look at how life-long learning opportunities integrate with active labor market programs, as these two initiatives, spearheaded by two different ministries (the Ministry of Education and the Ministry of Labor) often are not well-coordinated. If time permits, the report could investigate what cognitive and non-cognitive skills best support success in the labor market, and how education systems can build the needed set of competencies. The recent skills surveys conducted in several ECA countries measuring cognitive and non-cognitive skills would serve as a basis for this investigation.
34 ● Leveling the Playing Field: Rethinking the Social Contract in ECA
Notes
1 As recently reported in an article of Nature, “when fairness and equality clash, people prefer fair inequality over unfair equality” (Starmans, Sheskin, Bloom, Christakis, & Brown, 2017). 2 At least not done for the countries in the ECA region. There are some recent studies for the US, see Chetty et al. (2016), who show that intergenerational mobility, a ‘special’ case of equality of opportunity, has dramatically fallen in the last few decades. 3 For an empirical analysis of the relationship between inequality of opportunity and growth in a sample of US states see Marrero and Rodríguez (2013); they decompose total inequality into inequality of opportunity and inequality of effort, showing that GDP per capita growth rate is negatively correlated with the former and positively with the latter. A similar line of research has been followed by Ferreira et al. (2014), with a cross-country analysis involving a sample of 84 countries. 4 Following Lopez-Calva and Ortiz-Juarez (2014), and Ferreira et al. (2013), the middle class is defined as the population with a consumption per capita higher than US$10 per day in PPP 2005 (which distinguishes this group from the vulnerable, i.e. those with a consumption per capita between $5 and $10 per day). Other thresholds will be considered. 5 Authors’ calculations. 6 A large literature documents the importance of the reference group. For a recent survey consider Clark and D’Ambrosio (2015). 7 Authors’ calculations based on EU-SILC. 8 World Bank calculations based on Moldova Household Budget Survey and Russia Rosstat data. 9 Checchi et al. (2016) and Brzeziński and Magda (2016) are based on a harmonised data set, the EU-SILC surveys conducted in 2005 and 2011, which reported income in the previous year. 10 Brock et al (2016) is based on the Life in Transition Survey (LiTS) 2015. 11 Inequality of opportunity for education is high in many countries across the globe (see Ferreira and Peragine 2014, Schütz et al. 2005, Causa and Chapuis 2009). 12 ECA Education team briefing based on OECD, 2016: PISA 2015 [Volume 1]: Excellence and Equity in Education. Paris: OECD 13 The increased dependence on parental education reflects gains from the transition by parents with tertiary education, as before transition manufacturing jobs not requiring a university degree had a relatively high status. See Munich, Svejnar and Terrell (2005), Brunello, Crivellaro and Rocco (2010) and Chase (1998) for more detailed description of the impact of transition on the returns to education. 1 The analysis is based on EU-SILC 2005 data for Ireland, United Kingdom, Denmark, Finland, Norway, Austria, Belgium, France, Germany and the Netherlands 2 Katz and Kreuger (2016). The Rise and Nature of Alternative Work Arrangements in the United States, 1995-2015

35 35
References
Acemoglu, D. (2003). Technology and inequality. NBER Reporter: Winter 2003. Acemoglu, D., Aghion, P., & Violante, G. L. (2001). Deunionzation, technical change
and inequality. Carnegie-Rochester conference series on public policy, 55(1), 229-264. North-Holland.
Alesina, A., & La Ferrara, E. (2005). Preferences for redistribution in the land of opportunities. Journal of Public Economics, 89(5), 897-931.
Amiti, M., & Davis, D. R. (2012). Trade, firms, and wages: Theory and evidence. The Review of economic studies, 79(1), 1-36.
Autor, D. H., Dorn, D., & Hanson, G. H. (2013). The China syndrome: Local labor market effects of import competition in the United States. The American Economic Review, 103(6), 2121-2168.
Autor, D. H., Dorn, D., & Hanson, G. H. (2016). The China Shock: Learning from Labor-Market Adjustment to Large Changes in Trade. Annual Review of Economics, 8, 205-240.
Autor, D.H. (2014). Skills, education, and the rise of earnings inequality among the "other 99 percent". Science, 344(6186), 843–851.
Autor, D.H., Katz L.F. & Krueger A.B. (1998). Computing inequality: have computers changed the labor market? Quarterly Journal of Economics 113, 1169-1213.
Autor, D.H., Katz, L. F., & Kearney, M. S. (2008). Trends in US wage inequality: Revising the revisionists. The Review of economics and statistics, 90(2), 300-323.
Autor, D.H., Levy, F., & Murnane, R. J. (2002). Upstairs, downstairs: Computers and skills on two floors of a large bank. ILR Review, 55(3), 432-447.

36 ● Leveling the Playing Field: Rethinking the Social Contract in ECA
Azevedo, J. P., Yang, J. S., Inan, O. K., Nguyen, M. C., & Montes, J. (2016). When and where do we see regional poverty reduction and convergence? Lessons from the roof of Turkey. World Bank Policy Research Working Paper 7540.
Balafoutas, L., Kocher, M. G., Putterman, L., & Sutter, M. (2013). Equality, equity and incentives: An experiment. European Economic Review, 60, 32-51.
Berman, E., Bound J. & Machin S. (1998). Implications of skill-biased technological change: International evidence. Quarterly Journal of Economics 113, 1245-1279.
Berman, E., Bound, J. & Griliches, Z. (1994). Changes in the demand for skilled labor within U.S. manufacturing: Evidence from the Annual Survey of Manufactures. Quarterly Journal of Economics, 109(2), 367–397.
Bertrand, M. (1999). From the invisible handshake to the invisible hand: how product market competition changes the employment relationship. NBER working paper, 6900.
Beyer, H., Rojas, P. & Vergara, R. (1999). Trade liberalization and wage inequality. Journal of Development Economics 59(1), 103–123.
Binmore, K. G. (1998). Game theory and the social contract II: Just playing. MIT press. Cambridge, Massachusetts.
Black, S. E., Devereux, P. J., Lundborg, P., & Majlesi, K. (2015). Poor little rich kids? The determinants of the intergenerational transmission of wealth. NBER Working Paper 21409.
Bonoli, G (2006). New Social Risks and the Politics of Postindustrial Social Policies. In: Armingeon, K. & Bonoli, G. (eds.). The politics of post-industrial welfare states: Adapting post-war social policies to new social risks. London: Routledge.
Bonoli, G. (2005). The politics of the new social policies: providing coverage against new social risks in mature welfare states. Policy & politics, 33(3), 431-449.
Boone, J. & J. C. van Ours, J.C. (2004). Effective Active Labor Market Policies. CEPR Discussion Paper 4707.
Borjas, G.J. & Ramey, V.A. (1995). Foreign competition, market power and wage inequality. Quarterly Journal of Economics 110, 1075-1110.
Borjas, G.J., Freeman R.B. and Katz L.F. (1997). How much do immigration and trade affect labor market outcomes?. Brookings Papers on Economic Activity 1, 1-90.
Boserup, S. H., Kopczuk, W., & Kreiner, C. T. (2016). Born with a silver spoon? Danish evidence on wealth inequality in childhood. NBER Working Paper 22549.
Bound, J. and Johnson, G. (1991). Wages in the United States during the 1980s and beyond. In: Kosters, M. (ed.). Workers and their wages. American Enterprise Institute, Washington, DC.
Brock et. Al. 2016 [CN reference needed]

References ● 37
Brunello, G., Crivellaro, E., & Rocco, L. (2010). Lost in transition? The returns to education acquired under communism 15 years after the fall of the Berlin wall. IZA Discussion Paper 5409.
Bussolo, M., Koettl-Brodmann, J. & Sinnott, E. (2015). Golden Aging: Prospects for Healthy, Active, and Prosperous Aging in Europe and Central Asia. Europe and Central Asia Studies. World Bank Group, Washington, D.C.
Card, D., & DiNardo, J. E. (2002). Skill-biased technological change and rising wage inequality: some problems and puzzles. Journal of Labor Economics, 20(4), 733-783.
Card, D., Kluve, J., & Weber, A. (2015). What works? A meta analysis of recent active labor market program evaluations. NBER Working Paper 21431.
César Cancho; María E. Dávalos; Carolina Sánchez-Páramo (2015). Why So Gloomy? Perceptions of Economic Mobility in Europe and Central Asia. Policy Research Working Paper 7519, World Bank.
Chase, R. S. (1998). Markets for communist human capital: returns to education and experience in the Czech Republic and Slovak Republic. ILR Review, 51(3), 401-423.
Chauvel, L. (2006). Are Social Classes Really Dead? A French Paradox in Class Dynamics. InL Therborn, G. (ed.) Inequalities of the world. Verso, London and New York.
Chauvel, L., & Schroeder, M. (2014). Generational inequalities and welfare regimes. Social Forces, 92(4), 1259-1283.
Checchi, D., Peragine, V., & Serlenga, L. (2016). Inequality of Opportunity in Europe: Is There a Role for Institutions?. In: Cappellari, L., Polachek, S.W. , Tatsiramos, K. (eds.). Inequality: Causes and Consequences. Emerald Group Publishing Limited.
Chetty, R., Grusky, D., Hell, M., Hendren, N., Manduca, R., & Narang, J. (2016). The Fading American Dream: Trends in Absolute Income Mobility Since 1940, (December).
Dávalos, M. E., Demarchi, G., Santos, I., Kits, B., & Oral, I. (2016). Voices of Europe and Central Asia: New Insights on Shared Prosperity and Jobs. World Bank Group, Washington, D.C. .
Davalos, M.E. & Thomo, L. (2016). Portraits of poverty and inequality in Albania. World Bank Group, Washington, D.C.
Deaton, A.S., & Paxson C.H. (2001). Mortality, education, income, and inequality among American cohorts. In: Wise, D.A. Themes in the Economics of Aging. University of Chicago Press.
Deaton, A.S., & Paxson, C.H. (1994). Intertemporal choice and inequality. Journal of political economy, 102(3), 437-467.
Deaton, A.S., & Paxson, C.H. (1995). Saving, inequality and aging: an east Asian perspective. Age, 1(45), 55.
Deaton, A.S., & Paxson, C.H. (1997). The effects of economic and population growth on national saving and inequality. Demography, 34(1), 97-114.

38 ● Leveling the Playing Field: Rethinking the Social Contract in ECA
Deaton, A.S., & Paxson, C.H. (1998). Aging and inequality in income and health. The American Economic Review, 88(2), 248-253.
Dinardo, B. Y. J., Fortin, N. M., & Lemieux, T. (1996). Labor Market Institutions and the Distribution of Wages, 1973-1992: A Semiparametric Approach. Econometrica, 64(5), 1001–1044.
EBRD (2016). Transition for all: Equal opportunities in an unequal world. Transition Report 2016-17.
Eichhorst, W., Marx, P., & Wehner, C. (2016). Labor Market Reforms in Europe: Towards More Flexicure Labor Markets?. IZA Discussion Paper 9863.
Eichhorst, W., Wozny, F., & Mähönen, E. (2015). What Is a Good Job?.IZA Discussion Paper 9461.
Eisenkopf, G., Fischbacher, U., & Föllmi-Heusi, F. (2013). Unequal opportunities and distributive justice. Journal of Economic Behavior & Organization, 93, 51-61.
Esping-Andersen, G. (1990). Three Worlds of Welfare Capitalism. Princeton University Press, Princeton, New Jersey.
Fagereng, A., Mogstad, M., & Rønning, M. (2015). Why do wealthy parents have wealthy children?. Statistics Norway, Discussion Papers 813.
Feenstra R.C. & Hanson, G.H. (1999). The impact of outsourcing and high-technology capital on wages: estimates for the U.S., 1979–1990. Quarterly Journal of Economics 114(3), 907–40.
Feenstra, R.C. & Hanson, G.H. (1996). Globalization, outsourcing and wage inequality. American Economic Review 86, 240 245.
Ferreira, F. H., Messina, J., Rigolini, J., López-Calva, L. F., Lugo, M. A., & Vakis, R. (2013). Economic Mobility and the Rise of the Latin American Middle Class. Washington, DC: World Bank.
Frazer, H. and Marlier, E. (2009), Minimum Income Schemes Across EU Member States October 2009. Synthesis Report, EU Network of National Independent Experts on Social Inclusion.
Freeman, R.B. (1996). Labor market institutions and earnings inequality, New England Economic Review, Special Issue (May/June), 157-168.
Galiani, S, & Sanguinetti, P. (2003). The impact of trade liberalization on wage inequality: Evidence from Argentina. Journal of Development Economics 72(2), 497–513.
Gindling, T.H. & Robbins, D. (2001). Patterns and sources of changing wage inequality in Chile and Costa Rica during structural adjustment. World Development 29(4), 725–745.
Goldberg, P.K. & Pavcnik, N. (2005). The Effects of the Colombian Trade Liberalization on Urban Poverty. NBER Working Paper 11081.
Goldberg, P.K. & Pavcnik, N. (2007). Distributional effects of globalization in developing countries. Journal of economic Literature, 45(1), 39-82.
Goos, M. & Manning, A. (2007). Lousy and lovely jobs: The rising polarization of work in Britain. The review of economics and statistics, 89(1), 118-133.

References ● 39
Green, F., Dickerson, A., & Arbache, J.S. (2001). A picture of wage inequality and the allocation of labor through a period of trade liberalization: The case of Brazil. World Development 29(11), 1923–1939.
Hällsten, M. (2014). Inequality across three and four generations in egalitarian Sweden: 1st and 2nd cousin correlations in socio-economic outcomes. Research in Social Stratification and Mobility, 35, 19-33.
Hanson, G.H. & Harrison, A. (1999). Trade liberalization and wage inequality in Mexico. Industrial and Labor Relations Review 52(2): 271–288.
Hentschel, J., Aran, M., Can, R., Ferreira F.H., Gignoux, J., & Uraz, A. (2010). Life Chances in Turkey: Expanding Opportunities for the Next Generation. The World Bank, Washington, D.C.
Humer, S., Moser, M., & Schnetzer, M. (2016) Bequests and the Accumulation of Wealth in the Eurozone. INEQ Working Paper Series 1.
Kanbur, R. & Zhang, X. (2005). Fifty years of regional inequality in China: a journey through central planning, reform, and openness. Review of development Economics, 9(1), 87-106.
Katz, L. F. & Murphy K.M. (1992). Changes in relative wages, 1963-87: supply and demand factors. Quarterly Journal of Economics 107, 35-78.
Katz, L. F. and Kreuger, A.B. (2016). The Rise and Nature of Alternative Work Arrangements in the United States, 1995-2015
Krusell, P., Ohanian, L.E., Rios-Rull, J.-V. & Violante, G.L. (2000). Capital-skill complementarity and inequality: A macroeconomic analysis. Econometrica 68(5), 1029–1053.
Lam, D. (1984). The Variance of Population Characteristics in Stable Populations, with Applications to the Distribution of Income. Population Studies, 38, 117-127.
Lam, D. (1997). Demographic variables and income inequality. Handbook of population and family economics, 1, 1015-1059.
Lange, S., & von Werder, M. (2014). The effects of delayed tracking: Evidence from German states (No. 163). Courant Research Centre: Poverty, Equity and Growth-Discussion Papers.
Lee, D. S. (1999). Wage inequality in the United States during the 1980s: Rising dispersion or falling minimum wage? The Quarterly Journal of Economics, 114(3), 977-1023.
Luis López-Calva & Eduardo Ortiz-Juarez, 2014. "A vulnerability approach to the definition of the middle class," The Journal of Economic Inequality, Springer;Society for the Study of Economic Inequality, vol. 12(1), pages 23-47, March.
Magda, I., & Brzeziñski, M. (2016). Inequality of opportunity in Central and Eastern Europe: accounting for changes over time. IBS Working Paper 5/2016.
Martin, J. P. (2015). Activation and active labour market policies in OECD countries: stylised facts and evidence on their effectiveness. IZA Journal of Labor Policy, 4(1), 4.

40 ● Leveling the Playing Field: Rethinking the Social Contract in ECA
Martin, J. P., & Grubb, D. (2001). What Works and for Whom: A Review of OECD Countries' experiences with active labour market policies. Swedish Economic Policy Review, 8(2), 9-56.
Milanovic, B. (2011). Worlds apart: Measuring international and global inequality. Princeton University Press.
Mincer, J. (1991). Human capital, technology and the wage structure: what do time series show? NBER Working Paper 3581.
Münich, D., Svejnar, J., & Terrell, K. (2005). Returns to human capital under the communist wage grid and during the transition to a market economy. Review of Economics and Statistics, 87(1), 100-123.
Murphy, K.M. and Welch F. (1992). The structure of wages, Quarterly Journal of Economics 107, 285-326.
Myles, J. (2002). A new social contract for the elderly. In: Esping-Anderson, G. (ed.). Why we need a new welfare state. Oxford University Press, Oxford.
Negri 2015 [CN reference needed] Nikolai, R. (2012). Towards social investment? Patterns of public policy in the
OECD world. In: Morel, N., Palier, B., & Palme, J. Towards a social investment welfare state: Ideas, policies and channels. The Policy Press, Chicago.
OECD (2016). Regions at a Glance 2016. OECD Publishing, Paris. Ohlsson, H., Roine, J., & Waldenström, D. (2014). Inherited wealth over the path
of development: Sweden, 1810–2010. Center for Fiscal Studies Working Paper, Uppsala.
P. Korom. Inherited advantage: The importance of inheritance for private wealth accumulation in Europe. MPIfG Discussion Paper 16/11.
Peragine, V., & Ferreira, F. (2015). Equality of Opportunity: Theory and Evidence. World Bank Policy Research Paper 7217.
Pierson, C. (2011). The modern state. Routledge, London and New York. Piketty, T. (2011). On the Long-Run Evolution of Inheritance: France 1820–2050.
The Quarterly Journal of Economics, 126(3),1071–1131. Pintelon, O., Cantillon, B., Van den Bosch, K., & Whelan, C. T. (2013). The social
stratification of social risks: The relevance of class for social investment strategies. Journal of European Social Policy, 23(1).
Robbins, D.J. (1996) Trade, trade liberalization and inequality in Latin America and East Asia: Synthesis of seven country studies. Working Paper, Harvard Institute for International Development.
Rodriguez-Pose, A. (2012). Trade and regional inequality. Economic Geography, 88(2), 109-136.
Rodriguez-Pose, A. and Sanchez-Reaza, J. (2005). Economic Polarization through Trade: Trade Liberalization and Regional Growth in Mexico. In: Kanbur, R. and Venables, A.J. (eds.) Spatial Inequality and Development, Oxford University Press, Oxford.
Rodrik, D. (1997). Has globalization gone too far? California Management Review, 39(3), 29-53.

References ● 41
Rodrik, Dani (1999) [CN reference needed] Roemer, J. E., & Trannoy, A. (2016). Equality of opportunity: Theory and
measurement. Journal of Economic Literature, 54(4), 1288-1332. Scarpetta, S., Sonnet, A., & Manfredi, T. (2010). Rising youth unemployment
during the crisis: How to prevent negative long-term consequences on a generation?. OECD Social, Employment and Migration Working Papers 106, OECD Publishing, Paris.
Scervini, F., Peruzzi, A., & Chiappero, E. (2016). Equality of opportunities for young Italian workers. Società Italiana di Economia Pubblica Working Paper 704.
Starmans, C., Sheskin, M., Bloom, P., Christakis, N. A., & Brown, G. D. (2017). Why people prefer unequal societies. Nature Human Behaviour, 1(4), 82.
Taylor-Gooby, P. (2004). New social risks and welfare states: New paradigm and new politics? In: Taylor-Gooby, P. New risks, new welfare: The transformation of the European welfare state. Oxford University Press, Oxford.
The Economist (2016). The Gap between Poor and Rich Regions in Europe is Widening. Print Edition | Europe, October 2016.
Woessmann, L. (2009). International Evidence on School Tracking: A Review. CESifo DICE Report, 1/2009.
Wood, A. (1994). North-south trade, employment and inequality. Clarendon Press, Oxford.
World Bank (2009). World Development Report 2009: Reshaping Economic Geography. World Bank Group, Washington, D.C.
World Bank (2015). Bulgaria’s Potential for Sustainable Growth and Shared Prosperity. Systematic Country Diagnostic. World Bank Group, Washington, D.C.
World Bank (2016a). Polarization and Populism. World Bank ECA Economic Update November 2016. World Bank Group, Washington, D.C.
World Bank (2016b). World Development Report 2016: Digital Dividends. World Bank Group, Washington, D.C.
World Bank (2017). World Development Report 2017: Governance and the Law. World Bank Group, Washington, D.C.
Zhang, X., & Kanbur, R. (2001). What Difference Do Polarisation Measures Make? An Application to China. Journal of Development Studies, 37(3), 85–98.

42 ● Leveling the Playing Field: Rethinking the Social Contract in ECA
Team and Peer Reviewers
Task Team Leaders: Maurizio Bussolo, ECACE Luis-Felipe Lopez-Calva, GPV03 Ramya Sundaram, GSP03
Team members: Lidia Ceriani, DECWD Daniele Checchi, ECACE Alexandru Cojocaru, GPV03 Ernest Dautovic, ECACE Maria Davalos, GPV03 Ada Ferrer-i-Carbonell, ECACE Anna Giolbas, ECACE Carola Gruen, GSP03 Renata Gukovas, GSP03 Aylin Isik-Dikmelik, GSP03 Tullio Jappelli, ECACE Igor Kheyfets, GED03 Mathilde Sylvie Maria Lebrand, GTI10
Mattia Makovec, GSP03 Laura Maratou, GSP03 Andrew D. Mason, GSP03 Roberto Nistico, ECACE Vito Peragine, ECACE Tara Sharafudheen, ECASD Rizal Shidiq, GPV05 Emcet Oktay Tas, ECASD Sailesh Tiwari, GPV05 Ivan Torre, ECACE Mitchell Wiener, GSP03 Hernan Winkler, GPSJB
Advisors: Francois Bourguignon, Paris School of Economics Francisco Ferreira, DEC, World Bank Marc Fleurbaey, Princeton University Ravi Kanbur, Cornell University
Peer Reviewers: Ana Revenga, DEC, World Bank Elena Ianchovichina, MNACE, World Bank Arup Banerji, ECCEU, World Bank
Timeline
Milestone Date
PCN Review May 2, 2017
Decision Meeting December 21, 2017
Revised Draft March 15, 2018
Printed Report May 15, 2018
Dissemination Spring/Summer 2018

43 43
Annexes
Annex 1: Driver of distributional tensions: A review of the literature
Technological change, globalization, and demographic forces can be an important source of rising distributional tensions. Rising relative demand for skills has been driven by skill-biased technological changes, linked to the ITC revolution (Bound and Johnson, 1991; Berman et al., 1994; Autor et al., 1998; Acemoglu, 2003; Autor, 2014). For example, Mincer (1991) finds that changes in the US wage structure from 1963 to 1987 favoring educated workers were strongly related to an index of research and development. Krusell et al. (2000) estimate that falling equipment prices coupled with an increase in their sophistication in the 1980s increased demand for high-skilled workers (who were complements for this equipment) and reduced demand for low-skilled workers (who were substitutes for this equipment). Berman et al. (1998) document consistent and strong evidence for pervasive skill-biased technological change (across countries and industries) in developed countries, and some evidence for similar effects in developing countries. More recently, there is growing empirical evidence that employment has expanded in high-wage and low-wage occupations at the expense of middle-wage jobs (Autor et al. 2008), as ICT complements highly educated workers engaged in abstract tasks, substitutes for moderately educated workers performing routine tasks, and has little or no influence on low-skilled workers performing manual tasks (Autor and Murnane, 2002; Goos and Manning, 2007).
Increases in trade relative to output may also lead to distributional tensions within both developing and developed countries. Workers in the United States who are most exposed to trade competition experience greater job churning and reduced lifetime earnings, while non-exposed industries have not offset this loss (Autor et al. 2016). While social transfers, unemployment and disability benefits

44 ● Leveling the Playing Field: Rethinking the Social Contract in ECA
also rise sharply in more trade-exposed labor markets, earnings losses are larger for workers in the manufacturing sectors continuously exposed to trade shocks (Autor et al. 2013). Wood (1994) finds that imports accounted for a 22 percent reduction in the demand for low-skilled workers in manufacturing in the Northern hemisphere, although he acknowledges that this estimate may be too high because it ignores the contribution of unskilled labor saving technology.
Trade with less developed countries increases the opportunities for outsourcing and foreign direct production, and reduces the bargaining power of domestic workers. To the extent that trade relations with the developing world are widespread across sectors, domestic labor markets cannot completely insulate the affected workers from international product and labor market shocks (Borjas and Ramey, 1995; Rodrik, 1997; Bertrand, 1999; Goldberg and Pavcnik, 2007). Feenstra and Hanson (1996, 1999) show that outsourcing of low-skill intensive goods can explain 15–33 percent of the shifts toward high-skilled workers within US manufacturing industries during the period 1979-1985. In a follow-up paper, using data between 1979 and 1990, they find that 25 percent of the increase in the relative wage of high-skilled workers is explained by offshoring, and 30 percent by technological change.
Trade can also lead to increasing skill premia in middle-income countries. Returns to high-skilled labor rose following trade liberalization in Chile (Robbins 1996 and Beyer et al. 1999) and in Costa Rica (Gindling and Robbins 2001), while trade is found to be related to skill premia in Brazil (Green et al. 2001) and Argentina (Galiani and Sanguinetti 2003). Cuts in import tariffs reduced low-skilled wages in Columbia (Goldberg and Pavcnik 2005) and in prices and wages in low-skilled industries in Mexico (Hanson and Harrison 1999). Amiti and Davis (2012) find that a 10-percentage-point decrease in import-export tariffs in Indonesia manufacturing lowered wages of import-competing firms by 3 percent but raised wages at exporting firms by the same percentage over 1991-2000. Goldberg and Pavcnik (2007) conclude that trade openness was associated with higher inequality across the developing world, except for Singapore, South Korea and Taiwan, China.
Trade openness can also be associated with increasing income inequality across regions. Trade openness was significantly associated with regional inequality from 1975-2000 over 28 countries (Rodriguez-Pose 2012) and in a set of developing countries and the United States over 1980-2000 (Milanovic 2011). Chinese regions witnessed a considerable increase in spatial inequality after the liberalization process begun in 1978 (Kanbur and Zhang 2005), and regional polarization rose in Mexico after the introduction of the NAFTA free trade agreement (Rodriguez-Pose and Sanchez-Reaza 2005).
Population aging may also be linked to rising skill differentials, as an aging labor force is replaced by an influx of relatively unskilled workers, predominantly immigrants (Katz and Murphy, 1992; Murphy and Welch, 1992; Borjas et al., 1997). However, this literature tends to find that demographic secular effects are

Annexes ● 45
milder than policy effects (Lam 1997). In a pioneering work, Lam (1984) finds that in the United States and Brazil, the youngest male cohorts (15-19 year-olds) have a lower mean income than the elderly. In a series of papers, Deaton and Paxson (1994, 1995, 1997, 1998 and 2001) find that within-cohort inequality of consumption and of total income, though not necessarily inequality of earnings, increases with the age of the cohort.
Finally, several researchers emphasize that the decline in unionization, erosion of the real value of the minimum wage, and changes in wage setting rules have contributed to pressures on low-skilled workers (DiNardo et al., 1996; Freeman, 1996; Lee, 1999, Acemoglu et al., 2001). Some contributors to the labor market institution view emphasize problems and puzzles with the skill-biased technological trade explanation for rising wage inequality, Card and DiNardo (2002); for example, skill-biased technological change by itself fails to explain dimensions in inequality such as racial and gender wage gaps.
46 ● Leveling the Playing Field: Rethinking the Social Contract in ECA
Annex 2: Estimating the distributional impact of the changing occupational structure
This methodology draws heavily from Bourguignon and Ferreira (2005), Bourguignon, Ferreira and Leite (2008) and Inchauste et al. (2014). We adapt this methods to the particular question we want to address, i.e. how have occupational changes affected inequality and shared prosperity in Europe?
a. Occupational choices
In our model, individuals first choose their occupation according to the following model:
𝐼𝑖𝑘 = 1 𝑖𝑓 𝑍𝑖Γ𝑘 + 휀𝑖
𝑘 > 𝑀𝑎𝑥(0, 𝑍𝑖Γ𝑚 + 휀𝑖
𝑚), 𝑘 = 1, … , 𝐾, ∀𝑚 ≠ 𝑘 (1)
𝐼𝑖𝑘 = 0 for all 𝑘 = 1, … , 𝐾 if 𝑍𝑖Γ𝑘 + 휀𝑖
𝑘 ≤ 0 for all 𝑘 = 1, … , 𝐾
Where 𝑍𝑖 is a vector of individuals characteristics and Γ𝑘 is a vector of
coefficients for each occupation, 𝑘; and 휀𝑖𝑘 is a vector of random variables
identically and independently distributed across individuals and activities according to the law of extreme values. The intuition behind this model is that individual 𝑖 chooses occupation 𝑘 if the utility associated from being in such
occupation, 𝑍𝑖Γ𝑘 + 휀𝑖
𝑘, is greater than that associated from every other occupation. Without imposing more structure to the model and ignoring the dynamic aspect of occupational choices, this model fails to capture the actual process by which individuals choose an occupation as in the Roy model. Thereby, we argue that instead of estimating occupational choices, we model the conditional distributions of occupations based on individual characteristics such as education, age, gender, region and area. In other words, our model tries to account for occupational choices rather than estimating their causal determinants.
We estimate model (1) using a multinomial logit considering five mutually exclusive occupations: 1: Not working 2: Non-routine manual occupation, 3: Routine manual and cognitive, 4: Non-routine cognitive occupation
b. Earnings equations
In the next steps, we estimate earnings equations for each occupation 𝑘 using a log-linear Mincerian model:

Annexes ● 47
ln(𝑦𝑖𝑘) = 𝑋𝑖Ω
𝑘 + 𝜖𝑖𝑘 (2)
Where 𝑋𝑖 is a vector of individual characteristics such as individual characteristics such as education, age, gender, region, area and sector of
economic activity; Ω𝑘 is a vector of coefficients and 𝜖𝑖𝑘 is a random variable
assumed to be distributed identically and independently across individuals according to the standard normal distribution. We estimate equation (2) by ordinary least squares.
c. Total household income
Total household income per capita is given by:
𝑌ℎ =(∑ 𝐼𝑖
𝑘𝑦𝑖𝑘(𝑋𝑖, Ω𝑘, 𝜖𝑖
𝑘)𝑛𝑖=1 + 𝑦ℎ
𝑁𝐿)
𝑛
Where 𝐼𝑖𝑘 is an indicator variable equal to one if individual 𝑖 in household ℎ is
in occupation 𝑘; 𝑦𝑖𝑘 are individual earnings that depend on individual endowments
𝑋𝑖 , their returns Ω𝑘 and unobservable factors 𝜖𝑖𝑘; 𝑦ℎ
𝑁𝐿 is household non-labor income, and 𝑛 is the number of household members.
e. Decomposition approach
We estimate models (1) and (2) for two years, and simulate the impact of occupational changes by substituting the estimated parameters for one year with the parameters of the other year, and then re-calculate the total household income per capita adding the simulated earnings to the actual non-labor income of the households and dividing by household size. We then use this hypothetical household income to calculate a series of distributional statistics and compare them against those estimated using the actual income data.
Accounting for the impact of occupational changes
To carry out this simulation, we assign the estimated coefficients of equation (1) in year 𝑠 to the household survey in year 𝑡. To allow individuals to change
occupations in the simulation, we need the residual terms 휀𝑖𝑘 of the multinomial
logit in equation (1), which are unobserved. Following Inchauste et al. (2014) and Train and Wilson (2008), we draw the residuals from an extreme value distribution in a way that is consistent with observed choices. The simulated earnings for individual 𝑖 are given by:
ln(𝑦𝑖𝑘) 𝑠→𝑡 = 𝑦𝑖,𝑡
𝑘 𝐼𝑖,𝑡�� ( 𝑍𝑖,𝑡, Γ𝑘,��, 휀𝑖
𝑘)
We then use this simulated individual income to re-calculate household income per capita. Then, we argue that the difference between the Gini

48 ● Leveling the Playing Field: Rethinking the Social Contract in ECA
coefficient using the simulated income and the actual Gini coefficient in year 𝑡 is accounted by the change in the occupational structure.
Accounting for the impact of occupational wage premiums
To perform this simulation, we carry out an experiment similar to the one above, but using the wage equation. More specifically, the simulated earnings for individual 𝑖 are given by:
ln(𝑦𝑖𝑘) 𝑠→𝑡 = 𝐼𝑖,𝑡
𝑘 𝑦𝑖,𝑡�� (𝑋𝑖,𝑡, Ω𝑘,��, 𝜖𝑖,𝑡
𝑘 )
Accounting for both the impact of occupational wage premiums and occupational changes
To run this simulation, we combine the two steps described above into one. This exercise would allow us to estimate the change in inequality explained by both the change in the occupational structure and associated wage premiums.
Since the results of these simulations will depend on the year chosen as the baseline, we will also run them in reverse order, that is assigning the coefficients of year 𝑡 to the characteristics of year 𝑠. Accordingly, we may also try to investigate the role played by changes in the distribution of residuals of the wage equation as well as individual and household characteristics (such as education or non-labor income). We could perform these additional simulations using non-parametric methods as in Inchauste et al. (2014).
e. Country and period coverage
Survey Time-Period
Central Europe
Hungary Tarki Household Monitor Survey (LIS harmonized)
1999-2012
Poland Household Budget Survey (LIS harmonized)
1992-2013
Slovak Republic Microcensus/EU-SILC (LIS harmonized)
1992-2010
Slovenia Household Budget Survey (LIS harmonized)
1997-2012
Northern Europe
Denmark Law Model (LIS harmonized) 1992-2013
Estonia Estonian Social Survey (LIS harmonized)
2004-2013
Finland Income Distribution Survey (LIS harmonized)
1991-2013

Annexes ● 49
Survey Time-Period
Southern Europe
Italy ?
Spain Household Budget Survey/EU-SILC (LIS harmonized)
1990-2013
Western Europe
France Household Budget Survey (LIS harmonized)
1989-2010
Germany German Socio-Economic Panel (LIS harmonized)
1989-2013
Ireland ECHP/EU-SILC (LIS harmonized)
2000-2010
United Kingdom Family Expenditure/Resources Survey (LIS Harmonized)
1991-2013
Western Balkans
Serbia Household Budget Survey (LIS harmonized)
2006-2013
Other ECA countries
Kyrgyz Republic Kyrgyz Integrated Household Survey
2007-2013
Russian Federation Russia Longitudinal Monitoring Survey
1994-2014
Turkey Household Income and Consumption Expenditure Survey
2003-2013
Annex 2 References
Bourguignon, F. and Ferreira, F., 2005. Decomposing changes in the distribution of household incomes: methodological aspects. The microeconomics of income distribution dynamics in East Asia and Latin America, pp.17-46.
Bourguignon, François, Francisco HG Ferreira, and Phillippe G. Leite. "Beyond Oaxaca–Blinder: Accounting for differences in household income distributions." The Journal of Economic Inequality 6.2 (2008): 117-148.
Inchauste, Gabriela, João Pedro Azevedo, Boniface Essama-Nssah, Sergio Olivieri, Trang Van Nguyen, Jaime Saavedra-Chanduvi, and Hernan Winkler. Understanding Changes in Poverty. World Bank Publications, 2014.
Train, K., & Wilson, W. W. (2008). Estimation on stated-preference experiments constructed from revealed-preference choices. Transportation Research Part B: Methodological, 42(3), 191-203.

50 ● Leveling the Playing Field: Rethinking the Social Contract in ECA
Annex 3: Methodology and data sources for the analysis of birth cohorts inequality
Using repeated cross sections of household surveys, it is possible to track the
average consumption and the average income of cohorts (defined as groups of individuals with the same year of birth) over the life cycle. Denoting individuals by ‘i’, cohorts by ‘c’ and age by ‘a’ and assuming that the interest rate is constant, the life cycle theory predicts that, for individual i, consumption at a specific age should be proportional to lifetime resources and that such proportion should depend on age,1 i.e.:
ci,a = 𝑓𝑖(𝑎)𝑊𝑖
Taking the average of the logs of the equation above for all individuals born within cohort 𝑐, gives:
ln cc,a = ln 𝑓(𝑎) + ln 𝑊𝑐
(1)
where the bar denotes the average. The above equation can be estimated by regressing the average of the
logarithm of consumption for cohort 𝑐 observed at 𝑐 + 𝑎 on a set of age dummies,
which will capture the age effect ln 𝑓(𝑎) , and cohort dummies, accounting for the lifetime resources ln 𝑊𝑐:
ln c = 𝐷𝑎𝛼𝑐𝑠𝑝 + 𝐷𝑐𝛾𝑐𝑠𝑝 + 𝑢𝑐𝑠𝑝 (2)
where ln c is a stacked vector of log consumption levels with elements corresponding to each cohort in each year, 𝐷𝑎 is a matrix of age dummies, and 𝐷𝑐 is a matrix of cohort (i.e. year of birth) dummies. The coefficients 𝛼𝑐𝑠𝑝 and 𝛾𝑐𝑠𝑝
are the age and cohort effects in consumption, and 𝑢𝑐𝑠𝑝 is the sampling (or
equivalently measurement) error that comes from the fact that ln cc,a is a sample
estimate of the average log consumption of all individuals born in cohort 𝑐 and observed at 𝑐 + 𝑎.
Corresponding to equation (2), income is estimated according to the following equation:
ln y = 𝐷𝑎𝛼𝑖𝑛𝑐 + 𝐷𝑐𝛾𝑖𝑛𝑐 + 𝑢𝑖𝑛𝑐 (3)
where 𝛼𝑖𝑛𝑐 and 𝛾𝑖𝑛𝑐 are the age and cohort effects in income. Subtracting (2) from (3) yields:
𝑠𝑖,𝑎 𝑦𝑖,𝑎⁄ ≈ ln y − ln c = 𝐷𝑎(𝛼𝑖𝑛𝑐 − 𝛼𝑐𝑠𝑝) + 𝐷𝑐(𝛾𝑖𝑛𝑐 − 𝛾𝑐𝑠𝑝) + (𝑢𝑖𝑛𝑐 − 𝑢𝑐𝑠𝑝)
= 𝐷𝑎𝛼𝑠𝑎𝑣 + 𝐷𝑐𝛾𝑠𝑎𝑣 + 𝑢𝑠𝑎𝑣 (4)
In addition to the cohort and age effects taken into account so far, aggregate economic shocks and business cycle fluctuations affect income, consumption and saving in each year. In order to disentangle the age pattern from the cohort and time effects, our methodology follows the approach outlined by Deaton and

Annexes ● 51
Paxson (1994) and Deaton (1997) suggesting the following estimation model, which adds a time or business cycle component to the basic life-cycle framework for income:
ln y 𝑐,𝑡 = 𝐷𝑎𝛼𝑖𝑛𝑐 + 𝐷𝑐𝛾𝑖𝑛𝑐+𝐷𝑡 𝜑𝑖𝑛𝑐 + 𝑢𝑖𝑛𝑐 (5)
and savings:
s𝑐,𝑡/y𝑐,𝑡 = 𝐷𝑎𝛼𝑠𝑎𝑣 + 𝐷𝑐𝛾𝑠𝑎𝑣 + 𝐷𝑡 𝜑𝑠𝑎𝑣 + 𝑢𝑠𝑎𝑣 (6)
where the subscripts 𝑡 refer to time (year). Cohorts are defined in five year brackets, with the youngest born between 1985 and 1989 and the oldest born between 1920 and 1924.
For the model specification, Deaton (1997) outlines various possibilities to restrict the age, cohort and time effects to follow a predefined functional form. As there is no obvious a priori pattern for the year effects, dummy variables are included. Although cohort effects are likely to be trend-like, i.e. to be linear in 𝑐, it was decided to add cohort dummies that allow the data to choose any pattern in order to investigate possible non-linearities between cohorts born before versus cohorts born after the Soviet era. Age effects are modeled as a quintic polynomial in age in order to test the validity of the assumed hump-shaped age pattern as suggested by economic theory, yielding the following model specification:
𝐿𝐻𝑆 𝑐𝑡 = ∑ 𝛼𝑖 age𝑐𝑡
𝑖
5
𝑖=1
+ 𝐷𝑐𝛾 + 𝐷𝑡 𝜑 + 휀𝑐𝑡 (7)
where 𝐿𝐻𝑆 𝑐𝑡 is a stacked vector of cohort-year observations on log incomes and
the saving rate respectively, age is the age of the household head, 𝐷𝑐 is a matrix of dummies identifying the birth cohort to which the household head belongs, and 𝐷𝑡 is a matrix of dummies identifying the year in which the household was interviewed.
In a series of papers Deaton and Paxson (1994, 1995) extend this cohort, age and time effect decomposition analysis to the variance (instead of just the level) of the log of consumption, (and income), i.e. to the inequality of consumption. Starting from the result of Hall (1978), the rule of the constant lifetime consumption in the permanent income hypothesis with uncertainty can be re-written as one in which consumption does not change except when the consumer receives new information; in other words, consumption follows a martingale:
𝑐𝑖,𝑡+1 = 𝑐𝑖,𝑡 + 𝑢𝑖,𝑡+1 (8)
So that ui,t+1 is the (innovation, or) component of consumption related to new information received in time t+1 by agent i (note that the agent can be an individual, or given that surveys usually measure consumption at the household level, a household). This innovation has mean zero.

52 ● Leveling the Playing Field: Rethinking the Social Contract in ECA
Given the availability of cross sections for both periods t and t+1, it is possible to take variances of both sides of (8) and, assuming that the cross-sectional co-variance of ci,t and ui,t+1 is zero, one can write:
𝑣𝑎𝑟(𝑐𝑡+1) = 𝑣𝑎𝑟(𝑐𝑡) + 𝜎𝑡+1 (9)
where 𝜎𝑡+1 is the cross-sectional variance of consumption innovations. Equation (9) establishes that the variance is increasing with time. If we measure inequality by the variance of the logs, and we consider individuals (or households) i as those with the same age (belonging to same birth cohort), then (9) also says that inequality within a generation will increase with age. If independence is assumed between the innovations and the previous level of consumption, then the result becomes even stronger as “the distribution of consumption at t+1 is the distribution of consumption at time t with the addition of mean-zero random variation, so that the Lorenz curve of consumption in t will lie everywhere within the Lorenz curve of consumption in any later period. In consequence, any measure of inequality that respects the principle of transfers will show increasing inequality over time.”2
Deaton and Paxson do not discuss the cohort effect. In their 1995 paper, they explicitly state that the cohort effect does not play a role in their analysis (of the effect of aging on overall inequality) but still document that “younger cohorts appear to start their lives with slightly more inequality in log consumption than do their elders”. Deaton (1997) also explains that the fact that inequality of consumption (or income) increases within cohorts as they age does not imply that inequality for the whole society has to increase. Aggregate inequality will depend “depend on whether old generations pass on their inequality to their children, so that each new generation has a higher level of inequality at the start of their lives, and overall inequality is increasing, or whether there is no inheritance of inequality, so that each generation begins with the same starting level of inequality, and aggregate inequality is constant” (Deaton, 1997 p.385).

Annexes ● 53
Table A3.1: Data sources and main variables

54 ● Leveling the Playing Field: Rethinking the Social Contract in ECA
Annex 4: Data sources on perceptions
The analysis of this report relies on data from the Life in Transition Survey (LiTS) complemented by data from the International Social Survey Programme (ISSP), the World Values Survey (WVS), the European Social Survey (ESS), and the European Values Study (EVS).
The majority of the analysis is conducted on data from the LiTS. This survey was run jointly by the World Bank and the European Bank for Reconstruction and Development in 2006, 2010, and 2015. All three waves of the LiTS include 29 transition countries in Europe and Central Asia. In addition to these 29 countries, the second and third wave also include Kosovo and a varying sample of Western European and other countries as illustrated in Table A1. The sample of households in each country is nationally representative. One member of each household was randomly selected for a face-to-face interview. The sample size of households per country is about 1500.
Perceptions of the income distribution, dynamics in inequality, and preferences for redistribution are elicited from the following questions. In all three waves, respondents are asked to assess their own income at the current point in time as well as four years in the past3 on a 10-step ladder where the first rank stands for the poorest 10 percent in the country and the 10th rank stands for the richest 10 percent. In LiTS II and LiTS III respondents are also asked where on the ladder they believe their household will be 4 years in the future. This set of questions allows to analyze the respondents’ perceived position in their country’s income distribution. It also holds information on perceived past and future social mobility. Moreover, in all three waves respondents are asked to indicate their agreement with the statements ‘I have done better in life than my parents’ and ‘Children who are born today will have a better life than my generation’ on a five-point scale ranging from 1 for ‘strongly disagree’ to 5 for ‘strongly agree’. These questions are used to measure perceived past and future intergenerational mobility.
Regarding perceptions of dynamics in inequality, in LiTS III respondents are asked whether they think that the gap between the rich and the poor has increased, decreased, or stayed the same in the past 4 years. Another question that indicates preferences for inequality has been included in LiTS II and LiTS III. Respondents are asked to place their views on a 10-point scale where 1 means complete agreement with the statement ‘Incomes should be made more equal’ and 10 means complete agreement with the statement ‘We need larger income differences as incentives for individual effort’.
Finally, the measure of the demand for redistribution is the respondents’ agreement to the statement ‘The gap between the rich and the poor in our country should be reduced’ which is indicated on a five-point scale ranging from one for ‘strongly disagree’ to five for ‘strongly agree’.

Annexes ● 55
The ISSP has conducted a survey titled Social Inequality in 1987, 1992, 1999 and 2009. It provides information of factual and self-perceived income, assessments of inequality and judgments about its fairness as well as attitudes towards progressive taxation. The core sample of 10 countries (8 from ECA region) in 1987, was expanded in each wave to 40 countries (26 from ECA) in 2009.
The World Values Survey covers a large set of countries over 6 waves; the first was conducted in 1981-1984, the sixth in 2010-2014. It includes the same question on inequality preferences as the LiTS. Respondents are asked to indicate their agreement on a 10-point scale with the statement ‘Incomes should be made more equal’ vs. ‘We need larger income differences as incentives for individual effort’.
The European Social Survey includes a module on welfare attitudes in 2008 and 2016 (not yet available) that covers attitudes on taxes and social spending from 31 countries.
The European Values Study was conducted in 1981, 1990, 1999, and 2008. The first wave covers 16 mainly Western European countries. The most recent waves extend to 47 countries/regions from the ECA region. Respondents are asked to indicate overall happiness with their life on a 6-point scale.

56 ● Leveling the Playing Field: Rethinking the Social Contract in ECA
Table A4.1: LiTS country coverage
Country 2006 2010 2015
Albania yes yes yes
Armenia yes yes yes
Azerbaijan yes yes yes
Belarus yes yes yes
Bosnia and Herzegovina yes yes yes
Bulgaria yes yes yes
Croatia yes yes yes
Czech Republic yes yes yes
Estonia yes yes yes
FYR Macedonia yes yes yes
Georgia yes yes yes
Hungary yes yes yes
Kazakhstan yes yes yes
Kyrgyz Republic yes yes yes
Latvia yes yes yes
Lithuania yes yes yes
Moldova yes yes yes
Mongolia yes yes yes
Montenegro yes yes yes
Poland yes yes yes
Romania yes yes yes
Russian Federation yes yes yes
Serbia yes yes yes
Slovak Republic yes yes yes
Slovenia yes yes yes
Tajikistan yes yes yes
Turkey yes yes yes
Ukraine yes yes yes
Uzbekistan yes yes yes
Cyprus yes
France yes
Germany yes yes
United Kingdom yes
Greece yes
Italy yes yes
Kosovo yes yes
Sweden yes
Total 29 35 34

Annexes ● 57
Table A4.2: ISSP Social Inequality country coverage
Country 1987 1992 1999 2009
Austria yes yes yes yes
Bulgaria yes yes yes
Cyprus yes yes
Czech Republic yes yes yes
France yes yes
Germany yes yes yes yes
United Kingdom yes yes yes yes
Hungary yes yes yes yes
Italy yes yes
Latvia yes yes
Norway yes yes yes
Poland yes yes yes yes
Portugal yes yes
Russian Federation yes yes yes
Slovak Republic yes yes yes
Slovenia yes yes yes
Spain yes yes
Sweden yes yes yes
Switzerland yes yes
Total 7 13 17 18

58 ● Leveling the Playing Field: Rethinking the Social Contract in ECA
Table A4.3: WVS country coverage
Country 1989–1993 1994–1998 1999–2004 2005–2009 2010–2014
Albania yes yes
Azerbaijan yes yes
Armenia yes yes
Bosnia yes
Bulgaria yes yes
Belarus yes yes yes
Croatia yes
Cyprus yes yes
Czech Republic yes yes
Estonia yes yes
Finland yes yes
France yes
Georgia yes yes yes
Germany yes yes yes
Hungary yes yes
Italy yes
Kazakhstan yes
Kyrgyz Republic yes yes
Latvia yes
Lithuania yes
Moldova yes yes yes
Montenegro yes yes
Netherlands yes yes
Norway yes yes
Poland yes yes yes yes
Russian Federation yes yes yes yes
Serbia yes yes
Slovak Republic yes yes
Slovenia yes yes yes
Spain yes yes yes yes yes
Sweden yes yes yes
Switzerland yes yes
Turkey yes yes yes yes yes
Ukraine yes yes yes
Macedonia yes yes
United Kingdom yes yes
Uzbekistan yes
Serbia yes
Bosnia yes
Total 7 30 9 21 18
Annexes ● 59
Annex 5: data and methods for analysis on spatial inequalities
First, the report will explore the levels and trends in spatial disparities, particularly in poverty and inequality by subregion and urban/rural in each country. In addition, it will assess the contributions of inequality “between” and “within” subregions and urban/rural to total inequality. The former refers to changes in average income from subregion to subregion (“between”), while the latter looks at how income (or consumption) vary within each subregion (“within”). Harmonized household survey data for about 17 countries in the region are the main source for this analysis. Data will cover a period starting around the early 2000s (with variation across countries on available years).
To further explore spatial trends, data from household surveys will be complemented with available data over time on regional economic indicators, namely regional GDP growth and regional-level night time lights (NTL) growth rates (as a proxy for economic growth), as well as indices of market potential at the city-level, which can also help assess economic inequalities across regions. These are part of a separate dataset by the World Bank, available for 16 countries in the ECA region. The report will also draw from existing work using the poverty mapping methodology for a static but more geographically disaggregated data on poverty and inequality (e.g. Albania, Serbia, EU countries), as well as the 2015 LiTS database (representative at the urban/rural level and available for 34 countries in the region, see Table 1) to explore regional differences.
Second, going beyond trends, the report will aim at shedding light on the underlying reasons for inequalities by analyzing available policy-relevant indicators that reflect access to services and infrastructure. Specifically, the paper will explore the geographic discontinuity of the state as defined by Ceriani and Lopez Calva (2016), and how it has evolved over time. This indicator captures the inequality in overall policy effectiveness of the state between regions in a country by looking at differences across regions in educational outcomes and access to basic services, available in the household surveys.
Third, this analysis will be complemented by using individual-level data from household surveys and the Life in Transition Survey to explore what drives the urban-rural differentials. Using a Oaxaca-Blinder decomposition it will assess the role of individual characteristics/attributes (e.g. education, occupation, age) and their returns in explaining the welfare differential between urban and rural areas (see for example Skoufias and Katayama, 2008)4. To the extent that individual characteristics account for a significant share of the differential, in turn linked to the discussion of the geographical discontinuity of the state, findings can provide links to policy to address spatial inequalities by influencing (directly) access to services and infrastructure, and with (indirect) impacts through facilitating higher returns for people’s attributes.

60 ● Leveling the Playing Field: Rethinking the Social Contract in ECA
Annex 6: Inequality of opportunity measurement methodology and data sources
The measurement of inequality of opportunity
The conceptual basis for the definition of inequality of opportunity is provided by the distinction between individual efforts and pre-determined circumstances. For comprehensive reviews of the inequality of opportunity literature see the recent surveys by Ramos and Van de Gaer (2015), Roemer and Trannoy (2015) and Ferreira and Peragine (2015).
In what follows we will follow the simple framework introduced by Checchi and Peragine (2010) to measure inequality of opportunity.
Consider a distribution of income x in a given population. Suppose that all
determinants of x , including the different forms of luck, can be classified into
either a set of circumstances C that lie beyond individual control, or as
responsibility characteristics, summarized by a variable5 e , denoting effort.
Circumstances belong to a finite set . For example, suppose that the only circumstance variables are race, which can only take values in the set {black, white}, and parental education, that only takes values in the set {college
education, high school education}. In this case the set would be the following: = ({black, parents with high school education}, {black, parents with college education}, {white, parents with high school education}, {white, parents with college education}).
Effort may be treated as either a continuous or a discrete variable belonging
to the set . The outcome of interest is generated by a function Rg : such that:
eCgx , (1)
This can be seen as a reduced-form model in which incomes are exclusively determined by circumstances and effort, such that all individuals having the same circumstances and the same effort obtain the same income. Neither opportunities themselves, nor the process by which some particular outcomes are chosen, are explicitly modelled in this framework. The idea is to infer the opportunities available to individuals by observing joint distributions of circumstances, effort and outcomes. Roughly speaking, the source of unfairness in this model is given by the effect that circumstance variables (which lie beyond individual responsibility) have on individual outcomes.
Thus, we have a population of individuals, each of whom is fully characterised
by the triple eCx ,, . For simplicity, treat effort e , as well as each element of the
vector of circumstances, C , as discrete variables. Then this population can be
partitioned in two ways: into types iT , within which all individuals share the same

Annexes ● 61
circumstances, and into tranches jT , within which everyone shares the same
degree of effort. Denote by ijx the income generated by circumstances iC and
effort je . Suppose in addition that there are n types, indexed by ni ,...,1 , and m tranches, indexed by mj ,...,1 . In this discrete setting6, the population can be
represented by a matrix ijX with n rows, corresponding to types, and m columns, corresponding to tranches:
Table A6.1: Distribution of outcomes according to circumstances and effort
1e 2e 3e … me 1C 11x 12x 13x … mx1 2C 21x 22x 23x … mx2 3C 31x 32x 33x … mx3
… … … … … …
nC 1nx 2nx 3nx … nmx
To the mn dimensional matrix ijX in Table 1, let there be associated a mn dimensional matrix ijP where each element ijp represents the proportion
of total population with circumstances iC and effort je . Given this model, the measurement of inequality of opportunity can be thought of as a two-step
procedure: first, the actual distribution ijX is transformed into a counterfactual
distribution ijX~
that reflects only and fully the unfair inequality in ijX , while all the fair inequality is removed. In the second step, a measure of inequality is
applied to ijX~
. The construction of the counterfactual distribution ijX~
should reflect the principle of equality of opportunity.
Within this framework, the opportunity egalitarian principle can be decomposed into two distinct and independent sub-principles: the Reward Principle, which is concerned with the apportion of outcome to effort and, in some of its formulations, requires to respect the outcome inequalities due to effort7; and the Compensation Principle, according to which all outcome inequalities due
to C are unfair and should be compensated by society. Any satisfactory measure of opportunity inequality should respect both the compensation and the reward principles. The existing literature has developed two main versions of the compensation principle and two consequent approaches to the measurement of opportunity inequality, namely the ex-ante and the ex-post approach.
According to the ex-ante approach, there is equality of opportunity if the set of opportunities is the same for all individuals, regardless of their circumstances. Hence in the ex-ante version, the compensation principle is formulated with respect to individual opportunity sets: it requires reducing the inequality between

62 ● Leveling the Playing Field: Rethinking the Social Contract in ECA
opportunity sets. In the model introduced above, a given row i , that is the income distribution of a given type, is interpreted as the opportunity set of all individuals
with circumstances iC . Hence the focus is on the rows of the matrix above: the counterfactual distribution should eliminate the inequality within the rows (reward) and reflect the inequality between the rows (ex-ante compensation).
On the other side, according to the ex-post approach, there is equality of opportunity if and only if all those who exert the same effort end up with the same outcome. The compensation principle, in the ex-post version, is thus defined with respect to individuals with the same effort but different outcomes: it requires reducing income inequality among the individuals with the same effort. This means that opportunity inequality within this approach is measured as inequality within the columns of the matrix. Hence, the corresponding counterfactual distribution should reflect the inequality within the columns (ex-post compensation) but should eliminate the inequality between the columns (reward).
Different measures, which are either consistent with the ex-ante or the ex-post approaches, have been proposed in the literature (see Ferreira and Peragine (2015), Ramos and Van de Gaer (2015)): they express different and sometimes conflicting views on equality of opportunity and in fact the rankings they generate may be different.8 In addition, their informational requirements are quite different: while for the ex-ante approach one needs to observe the individual outcome and the set of circumstances, for the ex-post approach a measure of individual effort is required. Therefore, in addition to normative considerations, the choice of the methodology to adopt should reflect also the data availability. We will explore both the ex ante and the ex post approach.
In particular, within the ex ante approach we will use the Between-Types Inequality measure, which was variously proposed by Peragine (2002), Checchi and Peragine (2010) and Ferreira and Gignoux (2011). It relies on a counterfactual
distribution BTX~
, which is obtained by replacing each individual income ijx by
the average income of the type she belongs to ( i ), abstracting from individual level of effort9. This smoothing transformation is intended to remove all inequality
within types. Formally: Between-types counterfactual distribution BTX~
:
mj ,...,1 , ni ,...,1 ,
m
j
ij
m
j
ijij
iij
p
xp
x
1
1~
.
Once the smoothed distribution BTX~
is obtained, any inequality measure I
applied to such distribution, BTI X~
is to be interpreted as a measure of inequality of opportunity.

Annexes ● 63
Within the ex post approach we will use the Within-Tranches inequality measure, proposed by Checchi and Peragine (2010): It relies on a counterfactual
distribution WTRX~
, which is obtained by rescaling each individual income ijx by
the average income of the tranche she belongs to ( j). This transformation is
intended to remove all inequality between tranches. Any inequality measure I
applied to such distribution, W TRI X~
is to be interpreted as a measure of inequality of opportunity.
Based on the methodology summarized above, estimates of inequality of opportunity have been recently computed for different countries in the world, both for low incoma and for medium and high income regions: see Brunori et al (2013) for a collection and a discussion of the main results.
However, cross-countries comparisons are less frequent in the literature, probably because of data limitations.10 Ferreira and Gignoux (2011), by using different data sets, present comparative evidence on inequality of opportunity over six Latin-American countries, showing that race and region of birth are more relevant in explaining opportunity deprivation than in attaining poverty status. Brunori et al. (2015), use a set of surveys to compute measures of inequality of opportunities over eleven Sub-Saharan African countries, showing that ethnicity and region of birth are the most relevant factors in explaining inequality of opportunity in consumption. While in both Ferreira and Gignoux (2011) and Brunori et al. (2015) cross countries comparability is severely limited by estimates based on country-specific surveys, Checchi et al. (2016) presents cross-country evidence on 25 European countries using a harmonised data set (the EU-SILC survey conducted in 2005 and 2011). Moreover, with respect to previous literature, Checchi et al. (2016) propose a more careful modelling strategy to account for employment opportunities, by including the potential incomes of those who are unemployed (computed according to a selection equation à la Heckman) and focus on individual disposable incomes. Checchi et al. (2016) show that the standard country ranking based on total inequality, where Nordic countries are lowest and Mediterranean and Anglo-Saxons are highest, is only partially confirmed when considering opportunity inequality. When comparing the changes overtime of the inequality measures, Checchi et al (2016) show that the 2005 survey (recording information on 2004 incomes) reflects a period of substantial growth, while the 2011 survey (data referred to 2010 incomes) is significantly affected by the consequences of the financial crisis: thus total inequality exhibits larger cyclical fluctuations when compared to inequality of opportunity, with a general trend to declining values (due to income compressions generated by the crisis). It is also interesting to notice that in few countries the inequality of opportunity remain almost stable over the time interval (Czech Republic, Poland and Hungary, but also Finland and Slovenia at a lesser extent). This may suggest that inequality of opportunity measures capture underlying

64 ● Leveling the Playing Field: Rethinking the Social Contract in ECA
mechanisms of income generation, which are deeply rooted in the country social systems. Finally, they correlate total inequality and opportunity inequality to institutions, exploiting the availability of two data points per country, and they find significant correlations with educational variables (expenditure in education, especially in pre-primary education) and labour market policies variables (passive labour market policies).
A recent paper by Brzeziński M. and Magda I. (2016) uses the same dataset of Checchi et al. (2016), that is the EU SILC 2005 and 2011, to study changes in income inequality and inequality of opportunity (IO) in seven Central and Eastern European (CEE) countries. They make a first attempt to apply inequality decompositions based on RIF regression to the problem of changes in IO over time. Their results confirm that there is considerable heterogeneity in levels of inequality and in the evolution of inequality over time in CEE countries, linked to both changes in the parental backgrounds of individuals and the effects of these changes on current incomes, and to micro-economic factors that correspond to the labour market status and educational attainment levels of households. Differentiating between the CEE countries, they provide evidence of a strong decrease in both overall income inequality and absolute IO in Poland; a decrease in absolute IO accompanied by modest changes in income distribution in Lithuania; and a relatively high and growing share of “unfair” inequality accompanied by a low levels of overall income dispersion in Hungary. They find that the returns to circumstances were the major drivers of reduced absolute IO in Poland and Lithuania, with changes in the distribution of circumstances (e.g. improving distribution of parental education) playing a smaller role. The effects of other household characteristics (age structure, education, labour market status of households) on changes in absolute IO were negligible. The growing share of IO in total income inequality in Hungary and Slovak Republic was driven primarily by changes in the returns associated with having fathers with medium education (Hungary) and changes in wages across various groups defined by the same circumstances (Slovak Republic).
Given the evidence summarized above, the first contribution of the project will be that of providing estimates of inequality of opportunity for a set of countries—the non EU countries included in the ECA region—which have been neglected by the existing literature.
Ex ante and ex post inequality measures will be computed for each country and, possibly, for different periods, according to data availability.
Moreover, we will follow Brunori et al. (2016) and apply the Shapley decomposition in order to detect the contribution of the different circumstances to inequality of opportunity in different countries.
Data
The following dataset will be used.

Annexes ● 65
1. Luxemburg income study. LIS currently hosts and makes available micro-data for income distribution in representative samples of resident population for more than 50 countries, with 3-5 year waves extending in some cases back to the 80’s. Based on a specific Agreement between WB and LIS, which is part of the present project, LIS will undertake a full revision of original datasets, in order to improve existing information with respect to the informational requirements of the IOp analysis. In particular, it is expected to retrieve from original data (if available) information on i) presence of both parents (typically measured at the age of 14); ii) parental education and occupation; iii) birth order and number of siblings; iv) migration experiences; v) maximum educational attainment (possibly to be converted into years of education, also exploiting information on age of school leaving). This information will be used to compute measures of IOP at country/survey/age cohort level for countries which contain the relevant information.
2. The European Union Statistics on Income and Living Conditions (EU-SILC) waves 2006 and 2011.
3. The LiTS1, LiTS2, LiTS3, a cross-sectional household survey administered by the EBRD and the World Bank in 30 former communist countries as well as 4 Western European comparator countries in 2006, 2010 and 2016.
4. Country specific surveys: SHIW, SOEP.

66 ● Leveling the Playing Field: Rethinking the Social Contract in ECA
Annex Notes
1 The setup of the theoretical model and its empirical specification in this annex follows closely to Deaton and Paxson (2000). 2 Deaton (1997) p. 384. 3 In LiTS I respondents were asked to assess their income in 1989 instead of 4 years in the past. 4 Skoufias and Katamaya (2008) “Sources of Welfare Disparities across and within Regions of Brazil”. Policy Research Working Paper 4803. World Bank. 5 Effort could also be treated as a vector. However, we follow the literature and treat it as a scalar. 6 In an alternative formulation, that would treat effort as a continuous variable, xFi would
denote the advantage distribution in type i and iq denote its population share. The overall
distribution for the population as a whole would be
n
i
ii xFqxF1
.
7 See Ferreira and Peragine (2015) for a discussion of the different formulations of the reward principle proposed in the literature. One of such formulations, Utilitarian Reward, states that society should express full neutrality with respect to inequalities due to effort; since in the ex-ante approach the income distribution of types is interpreted as the opportunity set of individuals in that type, it follows that, according to Utilitarian Reward, the social evaluation of the opportunity set is based on the means of the type distribution. 8 See Fleurbaey and Peragine (2013) for a discussion of the clash between ex-ante and ex-post equality of opportunity. 9 Hence the between-types measure satisfies ex-ante compensation and utilitarian reward. See Ferreira and Peragine (2015). 10 Some papers provide regional disaggregation of the opportunity inequality measures (Checchi and Peragine (2010) for Italy, Marrero and Rodriguez (2013) for US states) but the differences are difficult to interpret when confronted with a homogeneous institutional framework at the national level. There is a parallel literature on cross-country comparisons of intergenerational mobility (see for example Corak (2013)) that we leave aside here, because it focuses on a specific set of circumstances (typically parental income and/or education) neglecting the contribution to inequality of all other components. Comparisons of opportunity inequality and intergenerational mobility indices can be found in Brunori et al. (2013).