Embed Size (px)
Citation preview
Easing Tensions:
Concept Mapping of Food Safety and Food Security
Wanda Martin, RN, PhD(c)
School of Nursing
University of Victoria
Easing Tensions
Concept Mapping of
Food Safety and Food Security
Wanda Martin, RN
PhD Candidate
School of Nursing, University of Victoria
Victoria, BC Canada
Funded by the Canadian Institutes of
Health Research
January 2012
~ 1 ~
This report is part of my dissertation work “Convergence of Food Safety and Food Security in British Columbia” and will go towards the completion of a doctoral degree in Nursing at the University of Victoria. My supervisor is Dr. Marjorie MacDonald and committee members are Dr. Bernie Pauly and Dr. Aleck Ostry. Data for this project was collected May and June, 2011. This work is supported by a Frederick Banting and Charles Best Doctoral Award from the Institute of Population and Public Health, Canadian Institutes of Health Research.
~ 2 ~
Table of Contents Table of Figures ............................................................................................................................................. 3
Executive Summary ....................................................................................................................................... 4
Recommendations .................................................................................................................................... 5
Introduction .................................................................................................................................................. 6
Food Safety ............................................................................................................................................... 6
Food Security ............................................................................................................................................ 7
Tensions .................................................................................................................................................... 8
Concept Mapping Methodology ................................................................................................................... 9
Phase 1 – Preparing .................................................................................................................................. 9
Phase 2 – Brainstorming ........................................................................................................................... 9
Phase 3 – Sorting and Ranking ................................................................................................................ 10
Phase 4 – Data Analysis ........................................................................................................................... 10
Phase 5 – Interpretation ......................................................................................................................... 11
Phase 6 – Utilization ................................................................................................................................ 11
Results ......................................................................................................................................................... 12
Demographics ......................................................................................................................................... 12
Point Map ................................................................................................................................................ 13
Cluster Map ............................................................................................................................................. 14
Ratings map ............................................................................................................................................ 16
Cluster Ratings Map and Ladder Graphs ................................................................................................ 19
Go Zone Maps ......................................................................................................................................... 25
Discussion.................................................................................................................................................... 35
Conclusion ................................................................................................................................................... 37
References .................................................................................................................................................. 38
~ 3 ~
Table of Figures Figure 1 Point Map ...................................................................................................................................... 13
Figure 2 Cluster Map ................................................................................................................................... 14
Figure 3 Point Rating Importance ............................................................................................................... 16
Figure 4 Point Rating Feasibility .................................................................................................................. 17
Figure 5 Overall Importance ....................................................................................................................... 19
Figure 6 Overall Feasibility .......................................................................................................................... 19
Figure 7 Overall Importance by Feasibility ................................................................................................. 20
Figure 8 Importance for Food Safety .......................................................................................................... 21
Figure 9 Importance for Food Security ....................................................................................................... 21
Figure 10 Importance of Clusters between Groups .................................................................................... 22
Figure 11 Feasibility for Food Safety ........................................................................................................... 23
Figure 12 Feasibility for Food Security ........................................................................................................ 23
Figure 13 Feasibility of Clusters between Groups ...................................................................................... 24
Figure 14 Overall ......................................................................................................................................... 25
Figure 15 Communicating ........................................................................................................................... 25
Figure 16 Understanding Intent .................................................................................................................. 28
Figure 17 Educating ..................................................................................................................................... 29
Figure 18 Understanding Risk and Regulation ............................................................................................ 31
Figure 19 Enhancing Partnerships............................................................................................................... 32
Figure 20 Recognizing Scale ........................................................................................................................ 33
~ 4 ~
Executive Summary Tensions between those working in food security and those working in food safety in British Columbia
surfaced due to policy changes that highlighted different perspectives on safe food production (e.g.,
meat inspection regulation). I used Concept Mapping to explore those tensions. The objective of the
exercise was to solicit ideas from those working in these areas with regard to the best approaches for
easing tensions and enhancing intersectoral collaboration.
Food safety is highly regulated under the Public Health Act, with the food safety core program focused
on inspection, education and surveillance. The food security core program is community-based with a
Food Security Coordinator providing resources, advocacy, and leadership support. These two programs
share a common goal of access to a safe food supply, but finding the right balance between full access
and full safety is challenging due to the different disciplinary perspectives operating across subsectors
within the public health system.
Concept mapping is a participatory mixed methodology that can contribute to the exploration of
reframing the relationship between those working in food security and those in food safety. It is a type
of structured conceptualization that consists of six phases (Trochim, 1989). This method enables a group
to describe ideas in response to a focused question, which translates to maps for visual representation
(Trochim, et al., 2006). I found 6 clusters identifying the best ways to ease tensions.
“Communicating” emphasizes the importance of finding common ground and language and recognizing
the interdependence of the groups.
“Understanding Intent” refers to understanding the intention of providing food security initiatives in an
urban versus a rural or isolated setting. Additionally, the intention of food safety regulations in
promoting safe food handling is important with regard to understanding how to apply food safety
principles across food security initiatives.
“Educating” stresses the need to have a balanced understanding of what constitutes a safe and secure
food supply. An example from a participant was for reader-friendly information on regulatory
environments.
“Understanding Risk and Regulation” suggests that a better understanding of the benefits and
limitations of broad-based regulations intended for health protection could be one way forward to ease
tensions.
“Enhancing Partnerships” refers to the need to work collectively to develop policy, programs and
guidelines that apply to food activities, and to create working models illustrating common goals and
objectives.
“Recognizing Scale” is the primary concern that the same regulations are applied to both large and small
producers and processors; the suggestion is to consider appropriate regulations for non-industrial food
production/processing and to sort out issues of locality and size.
~ 5 ~
The most important and feasible statements recommend that food security and food safety groups
meet face to face to discuss common goals and how conflicts can be resolved. The range of statements
highlighted the diverse views, and that only by building relationships will tensions ease and the value of
intersectoral collaboration be recognized.
Recommendations 1. Form a provincial level collaborative group that has authority between food security activist
groups, agriculture sector, and health sector.
2. Include an environmental health officer or food safety specialist along with community
nutritionists and food security activists on food policy councils at the municipal level.
3. Encourage relationships in a systematic way locally, regionally and provincially. This requires
dedicated time to be allocated from the health authority.
4. Provide reader-friendly information on regulatory environments. Creating easy-to-understand
messaging is essential to food procurement decision making.
5. Increase food safety system capacity to allow for flexibility in regulations to match the context
of the small food producer.
~ 6 ~
Introduction Public Health renewal in British Columbia (BC) involved the introduction of evidence-based and
comprehensive core programs to be delivered by the health authorities (HAs). The majority of the
programs were not new, but some programs offered an opportunity for HAs to link various public health
programs to ensure a comprehensive delivery of public health services. Food safety is a long-standing
health protection service offered by HAs, while the food security program was formed in 2005 as part of
the public health renewal process.
The food safety core program is highly regulated under the Public Health Act, with Environmental Health
Officer’s (EHO’s) focused on inspection, education, and surveillance. The food security core program is
community-based with a Food Security Coordinator providing community support through resources,
advocacy, and leadership, with the help of community nutritionists. The food programs share a common
goal of access to a safe food supply, but finding the right balance between full access and full safety is
challenging due to the different disciplinary perspectives operating across sub-sectors within the public
health system and policies in one area may not support policies in the other.
Food Safety The purpose of food safety systems is to prevent the consumption of microbial or chemical
contaminated food in order to prevent foodborne illness (Serapiglia, Kennedy, Thompson, & de Burger,
2007). Foodborne illness has a larger impact on the lives of those in “developing” countries with
weaker public health infrastructure, but still affects post-industrial countries. The extent of the impact is
unknown but the World Health Organization (WHO) is working on an initiative to estimate the global
burden of foodborne disease (Kuchenmuller et al., 2009). A recent report from the United States
estimates that each year 31 major pathogens causes 9.4 million episodes of foodborne illness, over 55
thousand hospitalizations, and 1,351 deaths (Scallan, Griffin, Angulo, Tauxe, & Hoekstra, 2011).
Although great improvements have been made to reduce the risk, new pathogens are emerging
challenging the food system (Baines, Ryan, & Davies, 2004; Scallan, Griffin, et al., 2011). There is some
suggestion that in-spite of efforts to reduce foodborne illness, the rates have risen over the past ten
years or at least there is no evidence of sustained improvement (Morris, 2011). The largest class of
emerging infectious diseases in Canada is foodborne illness (Weatherill, 2009). Foodborne illness can be
inconvenient at the least and deadly at worst. It has economic implications for affected individuals, for
the establishments linked to contaminated food, and for society in terms of health care costs and lost
productivity (Copeland & Wilcott, 2006).
The origins of foodborne illnesses are not easily detected because unspecified agents are major
contributors of acute gastroenteritis (Scallan et al., 2011). Additionally, resources are not necessarily
available to pursue food vehicle and origin of contamination. As reported by Jones et al, (2004), the
food vehicle was only identified in 54% of the 336 outbreaks under study, and of those outbreaks, 66%
of sources were in restaurants, 9% involved catered food, and 7% were in private homes. It is not
surprising, therefore, that the majority of the food safety effort tends toward food service
~ 7 ~
establishments and public education, which comprises the traditional work of EHOs related to food
(Copeland & Wilcott, 2006).
Food Security A commonly cited definition of food security comes from the World Health Summit held in Rome in
1996 and states “food security exists when all people, at all times, have physical and economic access to
sufficient safe and nutritious food to meet their dietary needs and food preferences for a healthy and
active life” (FAO, 1996) . There are other similar descriptions (Cook, 2008; Hamm & Bellows, 2003), but
generally food security definitions revolve around access, affordability, and nutrition. Some definitions,
however, include environmental sustainability and the economic livelihood of producers, harvesters,
and processors as important elements (Epp, 2009). For the purpose of this project, the focus is
community food security as defined by the BC MoH adopted from Bellows and Hamm (Bellows & Hamm,
2003) who define food security as “... a situation in which all community residents obtain a safe,
culturally acceptable, nutritionally adequate diet through a sustainable food system that maximizes
community self-reliance and social justice” (p. 37). This definition of food security requires a community
approach to ensure everyone is fed and resources are used appropriately and are protected for future
use (Hamm, 2009).
Community food security initiatives in the Victoria Capital Regional District include a number of broad
areas as identified by the Capital Region-Food and Agriculture Initiatives Round Table (CR-FAIR), an
organization identified as a food security hub in Victoria (Anonymous, 2011) . CR-FAIR has identified
food security initiatives to include activities involving urban agriculture, food processing, farmlands and
farming, access to healthy diets, education and training, food distribution, and policy and planning, as
well as others (Anonymous, 2008). As an example, urban agriculture involves backyard, balcony,
rooftop, community and school food gardens, edible landscapes and urban forests, shared fruit tree
picking, sharing backyards program, city farms, pocket and farmers markets, education, training and
demonstration gardens, and raising small animals and chickens in the city. Processing includes activities
such as community kitchens, and processing collectives and cooperatives. Activities involving access to
healthy diets include campaigns for a guaranteed liveable Income and other advocacy, food recovery
and distribution programs, Good Food Box programs, urban gardens, commons and community gardens,
and food buying clubs. Distribution activities include pocket markets, distributors’ cooperatives,
emergency food distribution agencies and networks, Good Food Box and other food box programs,
school fruit and vegetable programs, and neighbourhood based retail food outlets. Finally, policy and
planning food security activities include activities such as local food purchasing policies; agriculture
advisory bodies and agriculture area plans, regional food and health action plans, regional food charter,
food and nutrition policies, and comprehensive school health policies. The broad list of food security
activities includes a range of professionals and lay people who generally share a passion or strong
affinity with food production, processing, procurement or distribution.
Many types of lay people and professionals work on food security. The scope of food security covers
fulfilling the immediate needs of those who are hungry (i.e. food banks and soup kitchens), to redesign
or radical restructuring at the roots of the problem (Cook, 2008). Those working on individual and
community capacity-building activities may include community developers, nurses, nutritionists,
~ 8 ~
farmers, and active lay people who have a vision for an improved way of meeting nutritional needs for
everyone. Many people who are interested in food security activities participate in networks. There is
at least one food security network in every province in Canada and there are approximately 100 food
security and policy groups throughout Canada (Egbers, 2009). The majority of these grassroots
movements have two primary intents: they focus on issues of hunger and nutrition from a systems
perspective, and they bring people together to influence policy. Food-based social movements have
been instrumental in evolving policy debates on topics such as fair trade foods and animal welfare
standards, for example (Lang, 2009). Broad reaching networks of actively engaged lay people and
professionals help to create synergy where new ideas emerge.
Tensions There has been a slight shift in the day-to-day work of EHOs with the introduction of the food security
core program. For example, there has been an increase in temporary food markets and a rising
awareness of the value of local food production and consumption. This activity may have opened new
or additional areas of concern or focus for prevention of foodborne illness. Given the challenges in
identifying agents and origins of foodborne illness, EHO’s and those involved in food safety at the BC
Centre of Disease Control appear to have proceeded, justifiably, with caution during the rapid growth of
food security awareness in addressing increased food security activity. However, some could perceive
this caution as interfering with the progress of community food security. The identification of such
tensions is the driver for this study.
Those working in food safety are in a very regulatory environment where guidelines and policies are set
to maximize safety for the majority of the population at the provincial or federal level. For those working
in food security, the emphasis is on food access, and local responses to challenges to the food system.
Tensions between food security and food safety in BC surfaced due to policy changes that highlighted
different perspectives on safe food production (e.g. meat inspection regulation). The provincial policies
for abattoirs in BC resulted in reduced meat production for small-scale producers, and therefore, lack of
local access. Additional challenges have been the production and distribution of raw milk, home-
produced products for sale, and the increase in temporary markets. In these cases, it is the small-scale
producers for the local market that are affected by policies meant to encompass the provincial context.
There is a great need for knowledge on intersectoral coordination and collaboration, given the broad
spectrum of individuals who are engaged in food security activities. Therefore, to better understand
and describe the interface between food security and food safety, particularly related to coordination
and collaboration efforts among sectors, I chose a web-based approach to reach a national
representation of those working in and across both sectors. The objective of the concept mapping
exercise was to solicit ideas on how to ease the tensions to enhance intersectoral collaboration and
communication between those working in food safety and in food security. A strong theme throughout
the public health core programs is maximizing collaboration and communication. If that were effectively
put into practice, then there would be fewer tensions between these two groups.
~ 9 ~
Concept Mapping Methodology Concept mapping is a participatory mixed methodology that can contribute to the exploration of
redesigning the relationship between those working in food security and in food safety. It can provide
insight to practical approaches from the participant’s perspective on a focused issue. Participants not
only contribute their responses to the research question, but also add to the analysis by sorting and
ranking the responses provided by the group.
Concept Systems software was designed specifically for concept mapping and provides a framework for
a structured conceptualization consisting of six phases (Trochim, 1989). This method enables a group to
describe ideas in response to a focused question, which translates to maps for visual representation
(Trochim, et al., 2006). The group that was chosen to participate was a national representation of those
working in food security and in food safety. The invitation to participate in the concept mapping exercise
was sent to food security networks in each province, academic institutions providing food related
courses, and to food safety contacts including the Canadian Institute of Public Health Inspectors. E-mail
recipients were asked to forward the invitation on to anyone who they thought might be interested, so
there is no way of knowing how many people could potentially have received the invitation. The
Concept Systems software student license permitted a maximum of 50 people to log onto the system to
participate in this project (see Table 1). The methodology technically does not have any limit to the
number of participants, but it was initially developed for 40 people or less to be done face-to-face (Kane
& Trochim, 2007). According to Trochim (1993) with a greater number of participants, while potentially
adding greater clarity to the results, there are likely to be diminishing returns as the number grows.
Therefore, the response rate is not of great concern with this methodology.
Prior to inviting the participants to log-in, the website needed to be prepared. Overall, there are six
phases to the method from preparing the question to utilization of the maps.
Phase 1 – Preparing Phase 1 consists of establishing a focused question and choosing participants (Trochim, 1989). For this
preparatory phase, I specifically sought input from people who are less affected by day-to-day
operations, but more engaged in policy formation and decision-making, thinking they would have
experienced the tensions, and in positions to resolving challenging issues that may have surfaced
between food safety and food security. This included national representation of managers for food
inspectors, food security activists, and interested academics. The purpose here was to engage the
people who could best use the results to improve communication and collaboration. The focus prompt
is a statement or question that participants completed in Phase 2 and provides the concepts for
mapping. The statement used for generating concepts was “A way to maximize understanding and
collaboration between those working in food safety and food security is...”.
Phase 2 – Brainstorming Phase 2 involves asking participants to generate as many ideas as possible to answer the focus prompt
(Trochim, 1989). There were 43 participants in this phase. This brainstorming stage occurred on-line
using a secure site. Throughout the phase, all ideas generated were visible to all participants in order
allow one person’s ideas to spark another’s ideas. A benefit of on-line participation is that everyone was
~ 10 ~
free to make their statement without fear of criticism or controversy (Trochim, 1989). There was
potential for participants to generate an unlimited number of statements but Trochim recommends no
more than 100 statements for phase 3, to avoid serious practical constraints. There were 73 statements
generated and this was reduced to 60 once duplicated statements were deleted.
Phase 3 – Sorting and Ranking In Phase 3, statements were distilled and clarified by the researcher and a colleague so that all the
participants could understand their essential meaning. In this phase, I reconnected with all 43
participants, asking them to log on to the website where they were then able to sort the statements into
themes or categories based on the similarity of ideas (Trochim, 1989). They also ranked the statements
on a Likert-type scale from 1 to 5, according to the dimensions of importance and feasibility, with 1
being less and 5 being more important and feasible. An additional 7 participants joined for this phase,
for a total of 50 who could do the sorting and ranking. The software provided space for five
demographic questions in this phase that could be used to generate sub-group analyses. I chose 1)
province participants are from, 2) occupation or professional designation, 3) whether primary work is in
food safety or food security, 4) type of organization they work for or are involved with regarding food,
and 5) gender.
Phase 4 – Data Analysis The fourth phase involves the processing of data and production of the concept map, point-rating map,
ladder graph, and go-zone map. The Concept System software does all the statistics and creates the
maps. Starting with the information from the sorting of statements, the program identifies two
statements clustered together in the same category. On a matrix of NxN statements, the program
assigns a 1 if the statements are placed together and 0 if not placed together, allowing for the total
across all participants for each statement pair to have a number between one and the total number of
participants (Trochim, 1989). The total similarity matrix is analyzed using non-metric multidimensional
scaling (MDS) analysis on two dimensions, allowing for representation on an XY axis that is called a point
map (Trochim, 1989). Statements piled together most often are closer together on the map. The
program then uses the point map output in hierarchical cluster analysis that partitions the configuration
into non-overlapping clusters in two-dimensional space (called a cluster map) (Trochim, 1989). The
number of clusters is decided by the researcher. Starting with any number of clusters, the researcher
considers the statements in each cluster to decide if they are better grouped together or make more
sense if divided. One concept per cluster contributes to the overall framework to answer the focused
question. Additionally, the importance and feasibility ratings were averaged across participants for each
item and for each cluster. This produces a point-rating map, which was generated for the entire set of
statements and for each cluster. It is also possible to examine any differences between two groups as
set up in the demographic questions. A ladder graph shows the extent of consensus on the importance
of statements between group A and group B, giving a Pearson’s r to suggest the extent of the correlation
(Trochim, 1989). When there is strong agreement between the groups, the graph looks like a ladder.
Given the distinct differences between those working in food safety and food security, this map has the
potential to identify common ground and highlight areas where more effort could have a positive effect.
~ 11 ~
The go-zone map uses the importance and feasibility ratings to produce a 2x2 table with the most
important and most feasible statements or clusters in the top right hand quadrant.
Phase 5 – Interpretation Phase 5 is the interpretation of maps. The software program shows the top ten cluster names assigned
by the participants. I reviewed those names, and along with reading the set of statements for each
cluster, I assigned a name or short phrase to describe the set. The closer statements are located on the
map, the closer they are conceptually. In other words clusters of statements are used to structure ideas,
producing what could be a conceptual framework for the issue or problem. The point-rating and
cluster-rating maps show the height of a point or cluster, representing the average rating for that
statement or cluster of statements (Trochim, 1989). Intuitively, it makes sense that the higher rated
statements or clusters are the most important concepts on the map.
Phase 6 – Utilization The final phase, Phase 6, is the utilization of the maps. Evaluation and planning are common areas for
the use of concept maps because they are the result of collective thinking on a specific question.
Strategic direction and action planning can occur with the use of Go-Zone maps. Specifically, each
identified cluster is mapped to identify statements that have the highest importance and feasibility
(Kane & Trochim, 2007). The statements that sit within the green area, or the Go-Zone, are the
statements that many of the participants agree on as both important and feasible. These are the first
issues to think about for action planning (Kane & Trochim, 2007). This could be a particular area of
interest for the BC Ministry of Health as they work toward closer alignment of the two programs. That is
not to suggest that other statements should not be considered. The statements that are ranked as most
important but less feasible offer areas of reflection and deliberation on ways they could be achieved.
~ 12 ~
Results
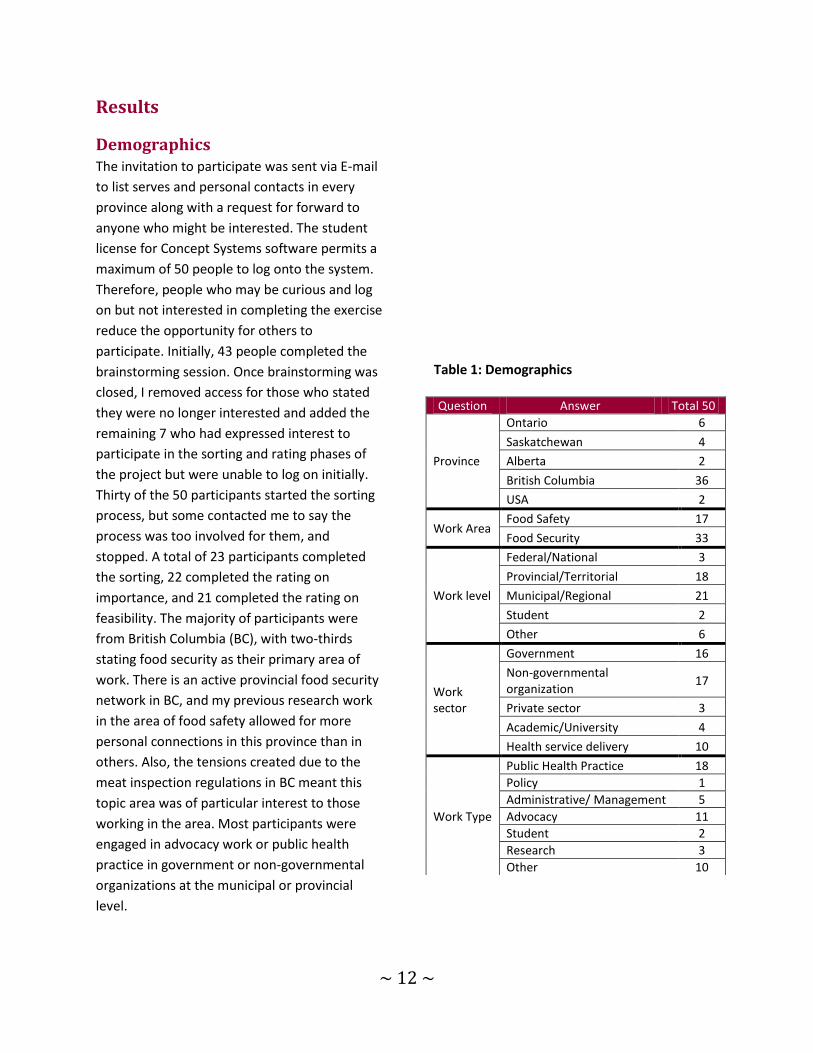
Demographics The invitation to participate was sent via E-mail
to list serves and personal contacts in every
province along with a request for forward to
anyone who might be interested. The student
license for Concept Systems software permits a
maximum of 50 people to log onto the system.
Therefore, people who may be curious and log
on but not interested in completing the exercise
reduce the opportunity for others to
participate. Initially, 43 people completed the
brainstorming session. Once brainstorming was
closed, I removed access for those who stated
they were no longer interested and added the
remaining 7 who had expressed interest to
participate in the sorting and rating phases of
the project but were unable to log on initially.
Thirty of the 50 participants started the sorting
process, but some contacted me to say the
process was too involved for them, and
stopped. A total of 23 participants completed
the sorting, 22 completed the rating on
importance, and 21 completed the rating on
feasibility. The majority of participants were
from British Columbia (BC), with two-thirds
stating food security as their primary area of
work. There is an active provincial food security
network in BC, and my previous research work
in the area of food safety allowed for more
personal connections in this province than in
others. Also, the tensions created due to the
meat inspection regulations in BC meant this
topic area was of particular interest to those
working in the area. Most participants were
engaged in advocacy work or public health
practice in government or non-governmental
organizations at the municipal or provincial
level.
Table 1: Demographics
Question Answer Total 50
Province
Ontario 6
Saskatchewan 4
Alberta 2
British Columbia 36
USA 2
Work Area Food Safety 17
Food Security 33
Work level
Federal/National 3
Provincial/Territorial 18
Municipal/Regional 21
Student 2
Other 6
Work sector
Government 16
Non-governmental organization
17
Private sector 3
Academic/University 4
Health service delivery 10
Work Type
Public Health Practice 18
Policy 1
Administrative/ Management 5
Advocacy 11
Student 2
Research 3
Other 10
~ 13 ~
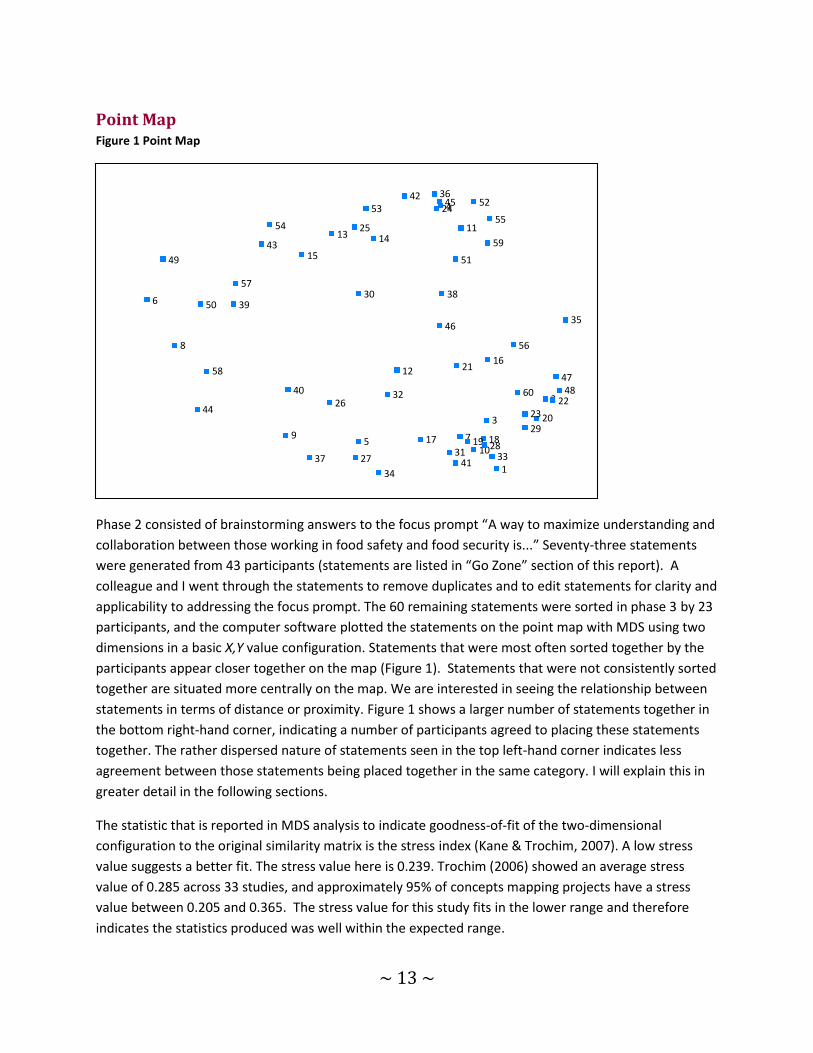
Point Map Figure 1 Point Map
Phase 2 consisted of brainstorming answers to the focus prompt “A way to maximize understanding and
collaboration between those working in food safety and food security is...” Seventy-three statements
were generated from 43 participants (statements are listed in “Go Zone” section of this report). A
colleague and I went through the statements to remove duplicates and to edit statements for clarity and
applicability to addressing the focus prompt. The 60 remaining statements were sorted in phase 3 by 23
participants, and the computer software plotted the statements on the point map with MDS using two
dimensions in a basic X,Y value configuration. Statements that were most often sorted together by the
participants appear closer together on the map (Figure 1). Statements that were not consistently sorted
together are situated more centrally on the map. We are interested in seeing the relationship between
statements in terms of distance or proximity. Figure 1 shows a larger number of statements together in
the bottom right-hand corner, indicating a number of participants agreed to placing these statements
together. The rather dispersed nature of statements seen in the top left-hand corner indicates less
agreement between those statements being placed together in the same category. I will explain this in
greater detail in the following sections.
The statistic that is reported in MDS analysis to indicate goodness-of-fit of the two-dimensional
configuration to the original similarity matrix is the stress index (Kane & Trochim, 2007). A low stress
value suggests a better fit. The stress value here is 0.239. Trochim (2006) showed an average stress
value of 0.285 across 33 studies, and approximately 95% of concepts mapping projects have a stress
value between 0.205 and 0.365. The stress value for this study fits in the lower range and therefore
indicates the statistics produced was well within the expected range.
1
2
3
4
5
6
7
8
9
10
11
12
13 14
15
16
17 18 19
20
21
22 23
24
25
26
27 28
29
30
31
32
33
34
35
36
37
38 39
40
41
42
43
44
45
46
47 48
49
50
51
52 53
54 55
56
57
58
59
60
~ 14 ~
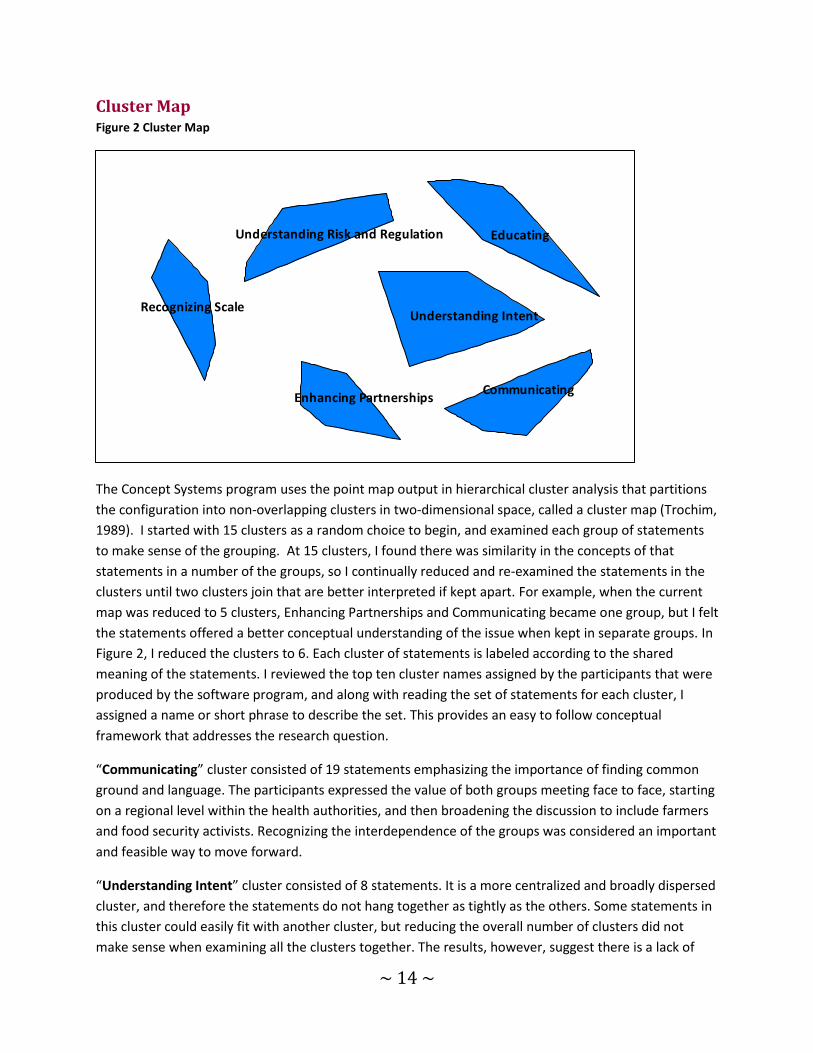
Cluster Map Figure 2 Cluster Map
The Concept Systems program uses the point map output in hierarchical cluster analysis that partitions
the configuration into non-overlapping clusters in two-dimensional space, called a cluster map (Trochim,
1989). I started with 15 clusters as a random choice to begin, and examined each group of statements
to make sense of the grouping. At 15 clusters, I found there was similarity in the concepts of that
statements in a number of the groups, so I continually reduced and re-examined the statements in the
clusters until two clusters join that are better interpreted if kept apart. For example, when the current
map was reduced to 5 clusters, Enhancing Partnerships and Communicating became one group, but I felt
the statements offered a better conceptual understanding of the issue when kept in separate groups. In
Figure 2, I reduced the clusters to 6. Each cluster of statements is labeled according to the shared
meaning of the statements. I reviewed the top ten cluster names assigned by the participants that were
produced by the software program, and along with reading the set of statements for each cluster, I
assigned a name or short phrase to describe the set. This provides an easy to follow conceptual
framework that addresses the research question.
“Communicating” cluster consisted of 19 statements emphasizing the importance of finding common
ground and language. The participants expressed the value of both groups meeting face to face, starting
on a regional level within the health authorities, and then broadening the discussion to include farmers
and food security activists. Recognizing the interdependence of the groups was considered an important
and feasible way to move forward.
“Understanding Intent” cluster consisted of 8 statements. It is a more centralized and broadly dispersed
cluster, and therefore the statements do not hang together as tightly as the others. Some statements in
this cluster could easily fit with another cluster, but reducing the overall number of clusters did not
make sense when examining all the clusters together. The results, however, suggest there is a lack of
Communicating
Understanding Intent
EducatingUnderstanding Risk and Regulation
Enhancing Partnerships
Recognizing Scale
~ 15 ~
common understanding of what "food safety" and "food security" mean, or that one group feels the
other group does not fully understand the scope and purpose of the work. Participants suggest that
understanding the intention of food security in an urban versus a rural or isolated setting, for example,
would help to ease tensions. The statements suggested there is a lack of understanding about what it
means to be food secure in rural or remote setting. Additionally, the intention of food safety regulations
in promoting safe food handling is important to understand to apply across food security initiatives.
There may be unique challenges in applying a safety standard across a vast geographical area with
different climate zones and population densities. Understanding the intention of each area toward
health protection and promotion could help to find a balance and ease tensions.
“Educating” cluster has 11 statements stressing the need to educate people so they have a balanced
understanding of what constitutes a safe and secure food supply. Participants expressed a need to
recognize that there is no food situation that is totally without risk, and food security is about having
enough food, local is not necessarily safer than imported, and canned or frozen are acceptable
alternatives to fresh. This cluster, more than others, reflects the divide in the two cultures with some
statements clearly focused on the need to educate for safety, while others clearly show a preference
toward security. A very practical statement calls for more reader-friendly information on regulatory
environments.
“Understanding Risk and Regulation” has 9 statements. A main emphasis in this grouping is on the
protection of broader public health and the role of government. There are tensions between individual
choice and protection of the general public, a classic public health tension. There is an expressed
concern that food safety will trump right to eat issues. The problem, it seems, is how to ensure an
efficient and economically sound safe food system across multiple contexts. If, as a society, we proceed
with broad-based provincial regulations, we provide the same safety standard across the province. The
implication, then, is that every part of the province has the same access and the same set of needs. The
suggestion of removing the word “regulation” from the discussion suggests negative connotations to the
word, while still appreciating the need for broader health protection. This group of statements suggest
that a better understanding of the benefits and limitations of broad-based regulations intended for
health protection could be one way forward to ease tensions.
“Enhancing Partnerships” is very close to “Communicating” but separated out with 7 statements
specific to partnerships. The suggestions in this cluster are to work collectively to develop policy,
programs, and guidelines that apply to food activities, and to create working models illustrating
common goals and objectives. A collaborative group, such as a provincial level food policy council
consisting of people from agriculture sector, health sector and grassroots food security activists can help
to identify needs and reduce tensions. Representatives from food safety should be on municipal food
policy councils. It is important to have integrated, multidisciplinary working teams developing policies,
recommendations and strategies for the food system.
“Recognizing Scale” is the smallest cluster consisting of 6 statements. It is the farthest to the left of the
map, loosely joined and well separated from the other clusters, suggesting these statements were
rarely, if ever, piled with other statements in the set. The primary concern with this cluster is that the
~ 16 ~
same regulations are applied to both large and small producers and processors and the suggestion is to
consider appropriate regulations for non-industrial food production/processing and to sort out issues of
locality and size.
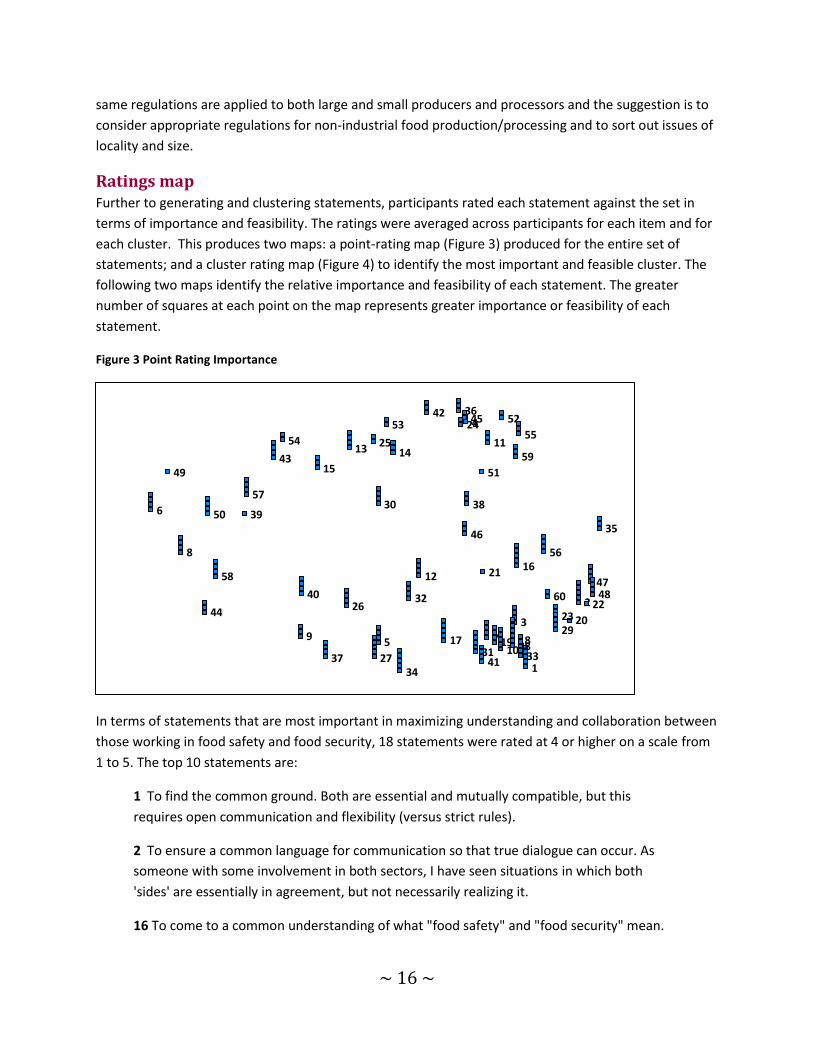
Ratings map Further to generating and clustering statements, participants rated each statement against the set in
terms of importance and feasibility. The ratings were averaged across participants for each item and for
each cluster. This produces two maps: a point-rating map (Figure 3) produced for the entire set of
statements; and a cluster rating map (Figure 4) to identify the most important and feasible cluster. The
following two maps identify the relative importance and feasibility of each statement. The greater
number of squares at each point on the map represents greater importance or feasibility of each
statement.
Figure 3 Point Rating Importance
In terms of statements that are most important in maximizing understanding and collaboration between
those working in food safety and food security, 18 statements were rated at 4 or higher on a scale from
1 to 5. The top 10 statements are:
1 To find the common ground. Both are essential and mutually compatible, but this
requires open communication and flexibility (versus strict rules).
2 To ensure a common language for communication so that true dialogue can occur. As
someone with some involvement in both sectors, I have seen situations in which both
'sides' are essentially in agreement, but not necessarily realizing it.
16 To come to a common understanding of what "food safety" and "food security" mean.
1
2
3
4
5
6
7
8
9 10
11
12
13 14
15
16
17 18 19
20
21
22 23
24
25
26
27 28
29
30
31
32
33
34
35
36
37
38 39
40
41
42
43
44
45
46
47 48
49
50
51
52 53
54 55
56
57
58
59
60
~ 17 ~
18 To strengthen the relationship by recognizing common goals and values to create an
image of what the future can look like if they work together, then those working in food
safety and food security can make a plan to work toward specific goals.
27 To form a collaborative group that has authority between food security activist,
agriculture sector and health sector that can move this forward rather than the current ad
hoc community/regional voluntary groups.
33 Within public health, create opportunities for inspectors and nutritionists to dialogue
and collaborate.
17 To work on regional or community basis. Begin with facilitated dialogue between public
health food safety staff and food security staff, reach a shared understanding, and then
broaden the discussion to include local farmers and community advocates. Document
outcomes.
10 To talk and really listen to each other so as to gain an understanding of the different
perspectives from each field, then to come to an area of common ground and an
agreement about where the two groups can work together.
28 To have an opportunity to share expertise and decide where they intersect and where
the 'common'ness is, and also the gaps that create issues in the community.
31 To examine what each other are doing and show the interdependence of one on the
other. Knowing that one's work is dependent on another area strengthens the need to
understand, appreciate, and want to be involved in the other area.
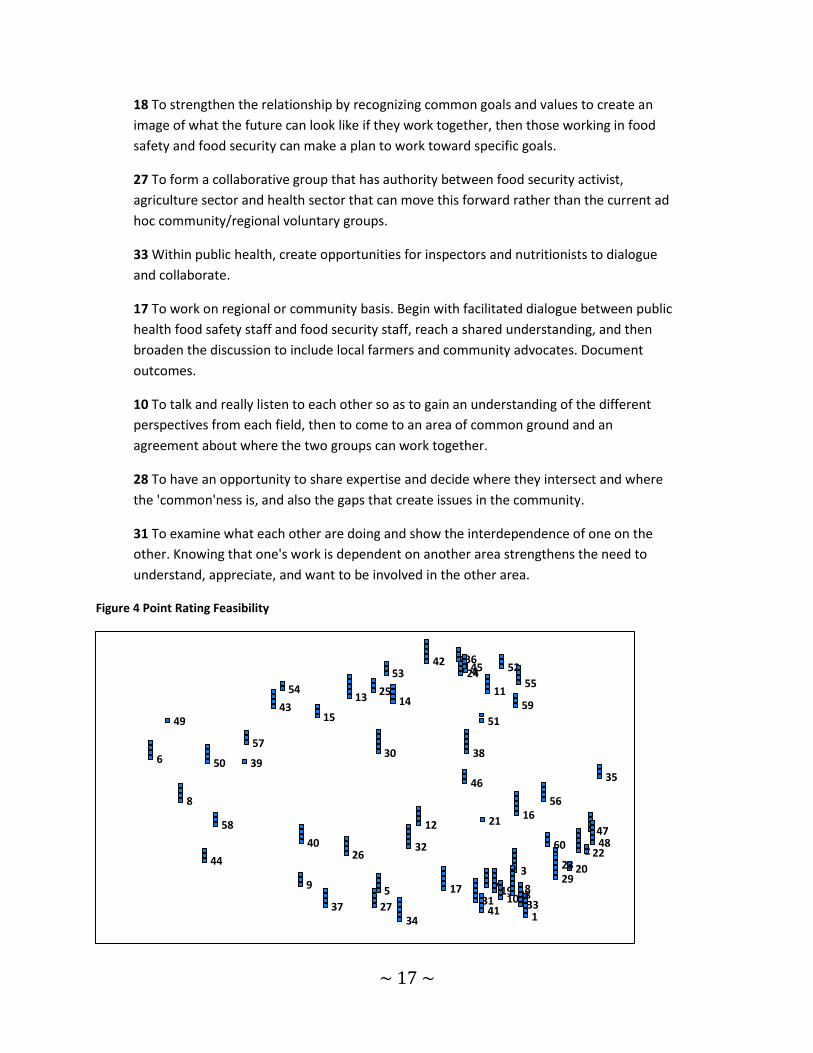
Figure 4 Point Rating Feasibility
1
2
3
4
5
6
7
8
9 10
11
12
13 14
15
16
17 18 19
20
21
22 23
24
25
26
27 28
29
30
31
32
33
34
35
36
37
38 39
40
41
42
43
44
45
46
47 48
49
50
51
52 53
54 55
56
57
58
59
60
~ 18 ~
Thirteen statements were rated by participants as 4 or higher on a feasibility scale ranging from 1 to 5.
The most feasible statements are those identified as being the easiest to address. The 10 most feasible
statements are:
3 For the employer ( e.g. regional health authority) to host a meeting/conference so public
health inspectors and nutritionists and/or dieticians can talk face-to-face and discuss
common goals and how conflicts can be resolved.
33 Within public health, create opportunities for inspectors and nutritionists to dialogue
and collaborate.
1 To find the common ground. Both are essential and mutually compatible, but this requires
open communication and flexibility (versus strict rules).
31 To examine what each other are doing and show the interdependence of one on the
other. Knowing that one's work is dependent on another area strengthens the need to
understand, appreciate, and want to be involved in the other area.
30 To understand the intents of food safety regulations and safe food handling practices, so
that the principles can be applied to food security initiatives; and such initiatives can be
achieved.
2 To ensure a common language for communication so that true dialogue can occur. As
someone with some involvement in both sectors, I have seen situations in which both
'sides' are essentially in agreement, but not necessarily realizing it.
28 To have an opportunity to share expertise and decide where they intersect and where
the 'common'ness is, and also the gaps that create issues in the community.
16 To come to a common understanding of what "food safety" and "food security" mean.
18 To strengthen the relationship by recognizing common goals and values to create an
image of what the future can look like if they work together, then those working in food
safety and food security can make a plan to work toward specific goals.
17 To work on regional or community basis. Begin with facilitated dialogue between public
health food safety staff and food security staff, reach a shared understanding, and then
broaden the discussion to include local farmers and community advocates. Document
outcomes.
~ 19 ~
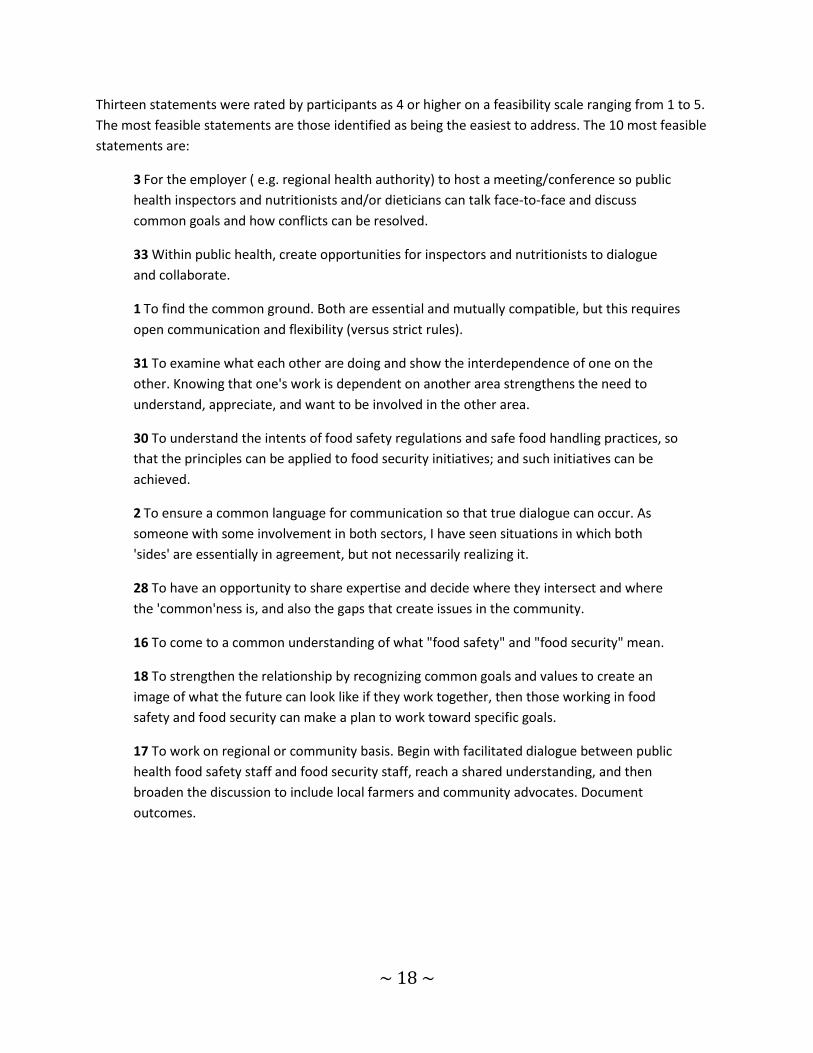
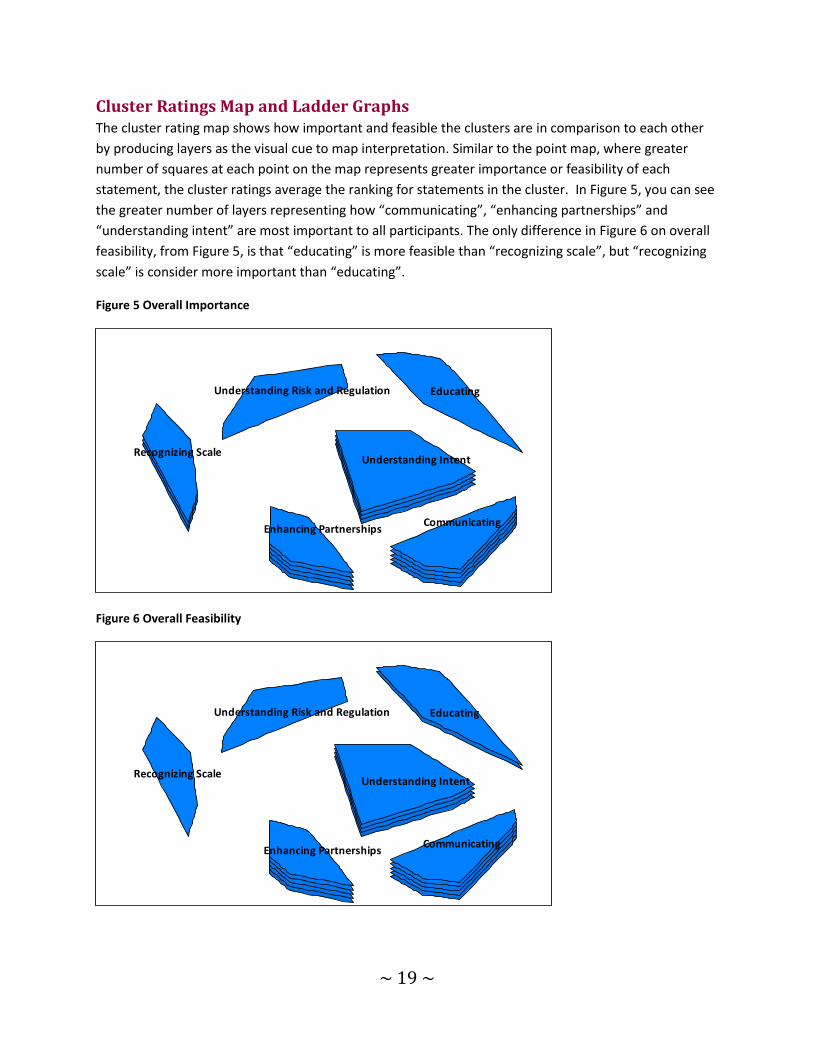
Cluster Ratings Map and Ladder Graphs The cluster rating map shows how important and feasible the clusters are in comparison to each other
by producing layers as the visual cue to map interpretation. Similar to the point map, where greater
number of squares at each point on the map represents greater importance or feasibility of each
statement, the cluster ratings average the ranking for statements in the cluster. In Figure 5, you can see
the greater number of layers representing how “communicating”, “enhancing partnerships” and
“understanding intent” are most important to all participants. The only difference in Figure 6 on overall
feasibility, from Figure 5, is that “educating” is more feasible than “recognizing scale”, but “recognizing
scale” is consider more important than “educating”.
Figure 5 Overall Importance
Figure 6 Overall Feasibility
Communicating
Understanding Intent
EducatingUnderstanding Risk and Regulation
Enhancing Partnerships
Recognizing Scale
Communicating
Understanding Intent
EducatingUnderstanding Risk and Regulation
Enhancing Partnerships
Recognizing Scale
~ 20 ~
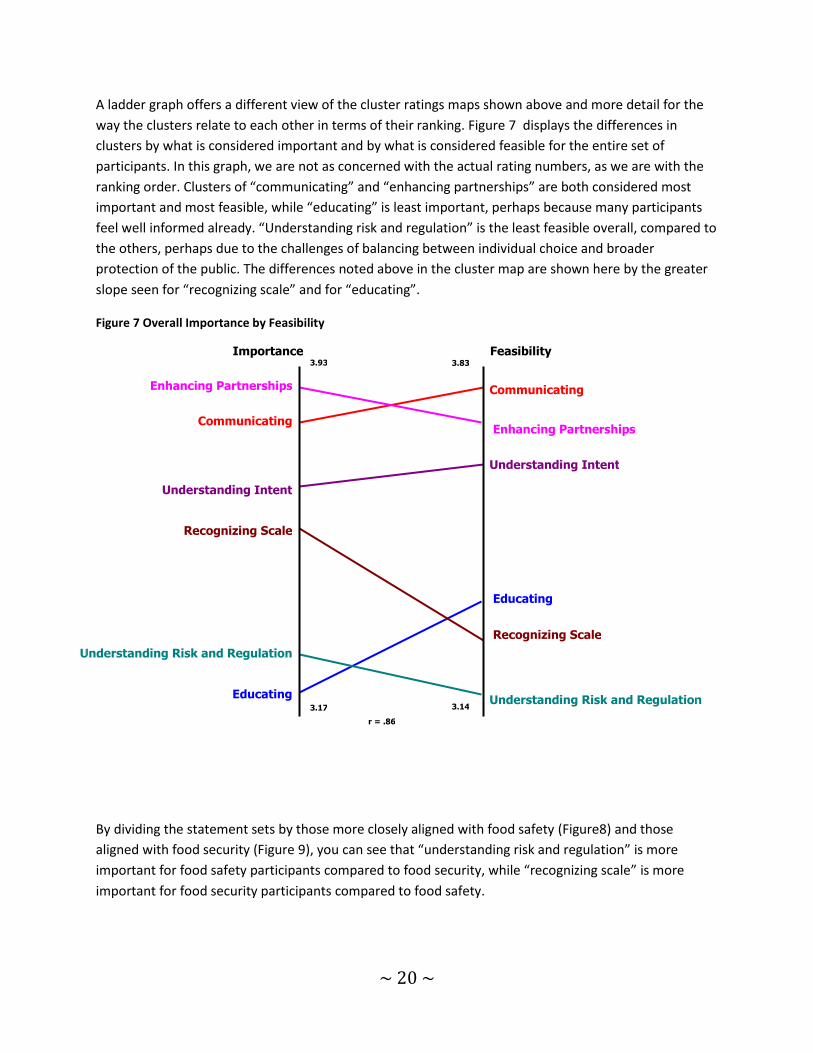
A ladder graph offers a different view of the cluster ratings maps shown above and more detail for the
way the clusters relate to each other in terms of their ranking. Figure 7 displays the differences in
clusters by what is considered important and by what is considered feasible for the entire set of
participants. In this graph, we are not as concerned with the actual rating numbers, as we are with the
ranking order. Clusters of “communicating” and “enhancing partnerships” are both considered most
important and most feasible, while “educating” is least important, perhaps because many participants
feel well informed already. “Understanding risk and regulation” is the least feasible overall, compared to
the others, perhaps due to the challenges of balancing between individual choice and broader
protection of the public. The differences noted above in the cluster map are shown here by the greater
slope seen for “recognizing scale” and for “educating”.
Figure 7 Overall Importance by Feasibility
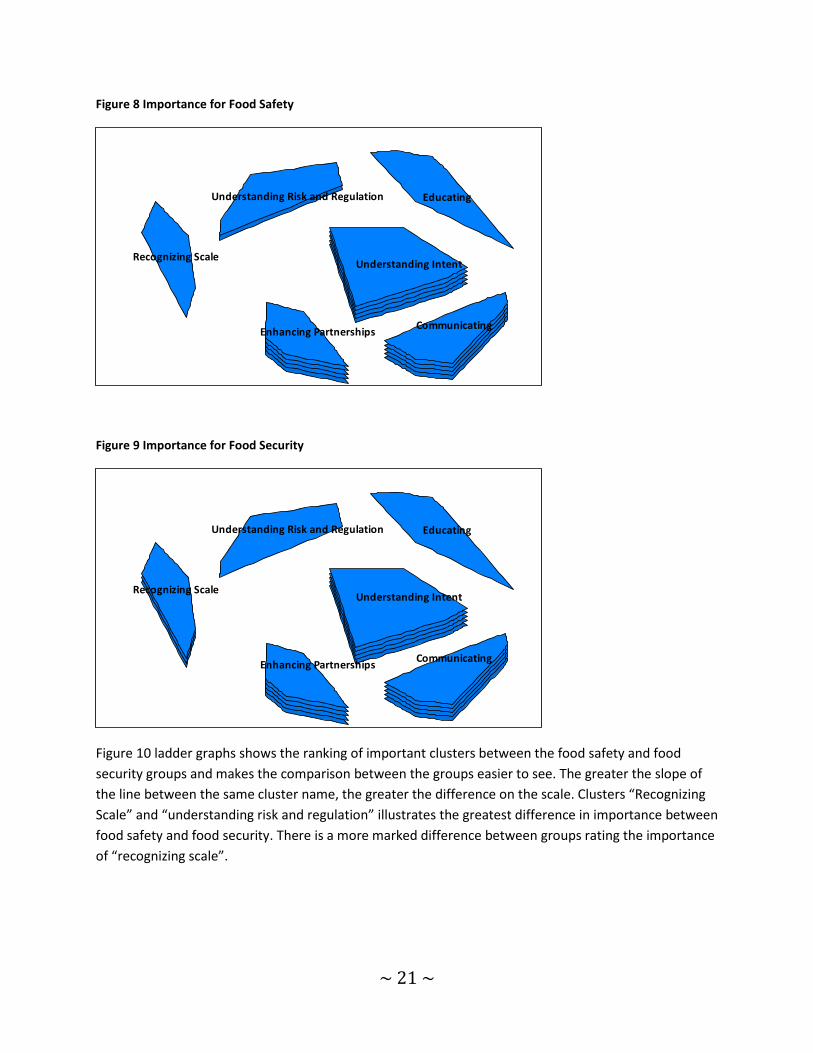
By dividing the statement sets by those more closely aligned with food safety (Figure8) and those
aligned with food security (Figure 9), you can see that “understanding risk and regulation” is more
important for food safety participants compared to food security, while “recognizing scale” is more
important for food security participants compared to food safety.
r = .86
3.93
3.17
3.83
3.14 Understanding Risk and Regulation
Recognizing Scale
Educating
Educating
Understanding Intent
Understanding Risk and Regulation
Communicating
Communicating Enhancing Partnerships
Understanding Intent
Recognizing Scale
Enhancing Partnerships
Importance Feasibility
~ 21 ~
Figure 8 Importance for Food Safety
Figure 9 Importance for Food Security
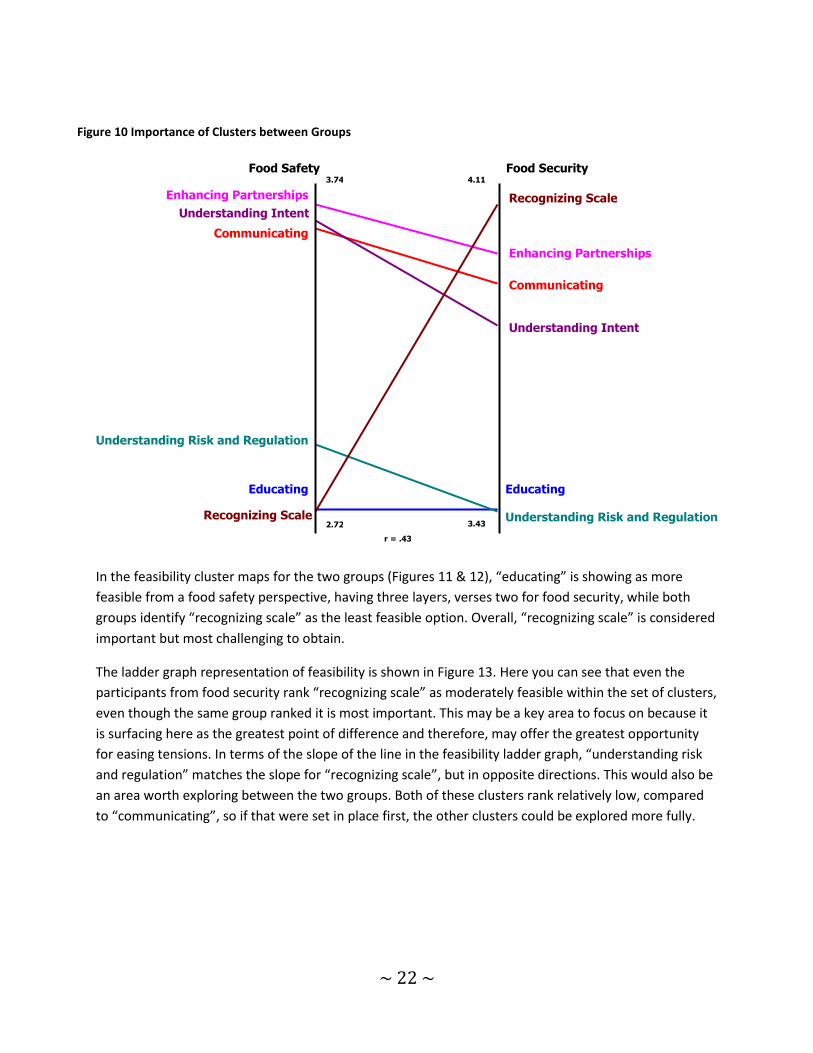
Figure 10 ladder graphs shows the ranking of important clusters between the food safety and food
security groups and makes the comparison between the groups easier to see. The greater the slope of
the line between the same cluster name, the greater the difference on the scale. Clusters “Recognizing
Scale” and “understanding risk and regulation” illustrates the greatest difference in importance between
food safety and food security. There is a more marked difference between groups rating the importance
of “recognizing scale”.
Communicating
Understanding Intent
EducatingUnderstanding Risk and Regulation
Enhancing Partnerships
Recognizing Scale
Communicating
Understanding Intent
EducatingUnderstanding Risk and Regulation
Enhancing Partnerships
Recognizing Scale
~ 22 ~
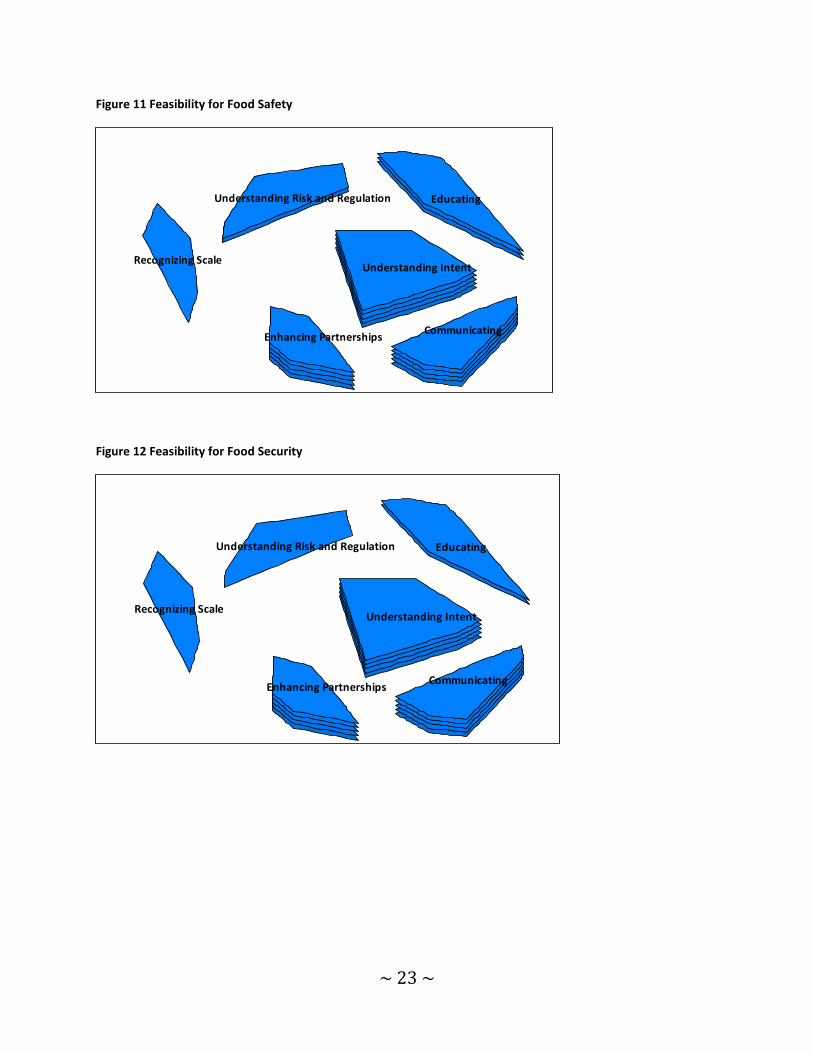
In the feasibility cluster maps for the two groups (Figures 11 & 12), “educating” is showing as more
feasible from a food safety perspective, having three layers, verses two for food security, while both
groups identify “recognizing scale” as the least feasible option. Overall, “recognizing scale” is considered
important but most challenging to obtain.
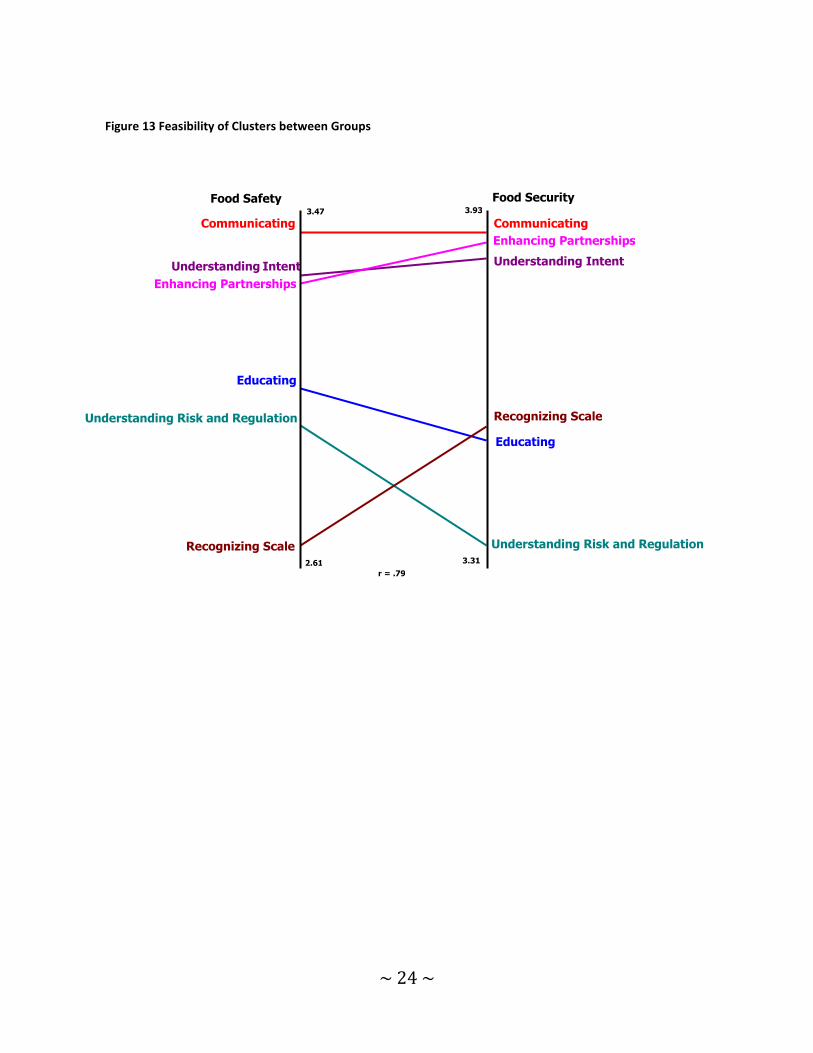
The ladder graph representation of feasibility is shown in Figure 13. Here you can see that even the
participants from food security rank “recognizing scale” as moderately feasible within the set of clusters,
even though the same group ranked it is most important. This may be a key area to focus on because it
is surfacing here as the greatest point of difference and therefore, may offer the greatest opportunity
for easing tensions. In terms of the slope of the line in the feasibility ladder graph, “understanding risk
and regulation” matches the slope for “recognizing scale”, but in opposite directions. This would also be
an area worth exploring between the two groups. Both of these clusters rank relatively low, compared
to “communicating”, so if that were set in place first, the other clusters could be explored more fully.
r = .43
3.74
2.72
4.11
3.43 Understanding Risk and Regulation Recognizing Scale
Educating Educating
Understanding Intent
Understanding Risk and Regulation
Communicating
Communicating
Enhancing Partnerships
Understanding Intent Recognizing Scale Enhancing Partnerships
Food Safety Food Security
r = .43
3.74
2.72
4.11
3.43 Understanding Risk and Regulation Recognizing Scale
Educating Educating
Understanding Intent
Understanding Risk and Regulation
Communicating
Communicating
Enhancing Partnerships
Understanding Intent Recognizing Scale Enhancing Partnerships
Food Safety Food Security
Figure 10 Importance of Clusters between Groups
~ 23 ~
Figure 11 Feasibility for Food Safety
Figure 12 Feasibility for Food Security
Communicating
Understanding Intent
EducatingUnderstanding Risk and Regulation
Enhancing Partnerships
Recognizing Scale
Communicating
Understanding Intent
EducatingUnderstanding Risk and Regulation
Enhancing Partnerships
Recognizing Scale
~ 24 ~
Figure 13 Feasibility of Clusters between Groups
r = .79
3.47
2.61
3.93
3.31 Understanding Risk and Regulation Recognizing Scale
Educating
Understanding Risk and Regulation Recognizing Scale
Educating
Understanding Intent
Enhancing Partnerships
Enhancing Partnerships
Understanding Intent
Communicating Communicating
Food Safety Food Security
~ 25 ~
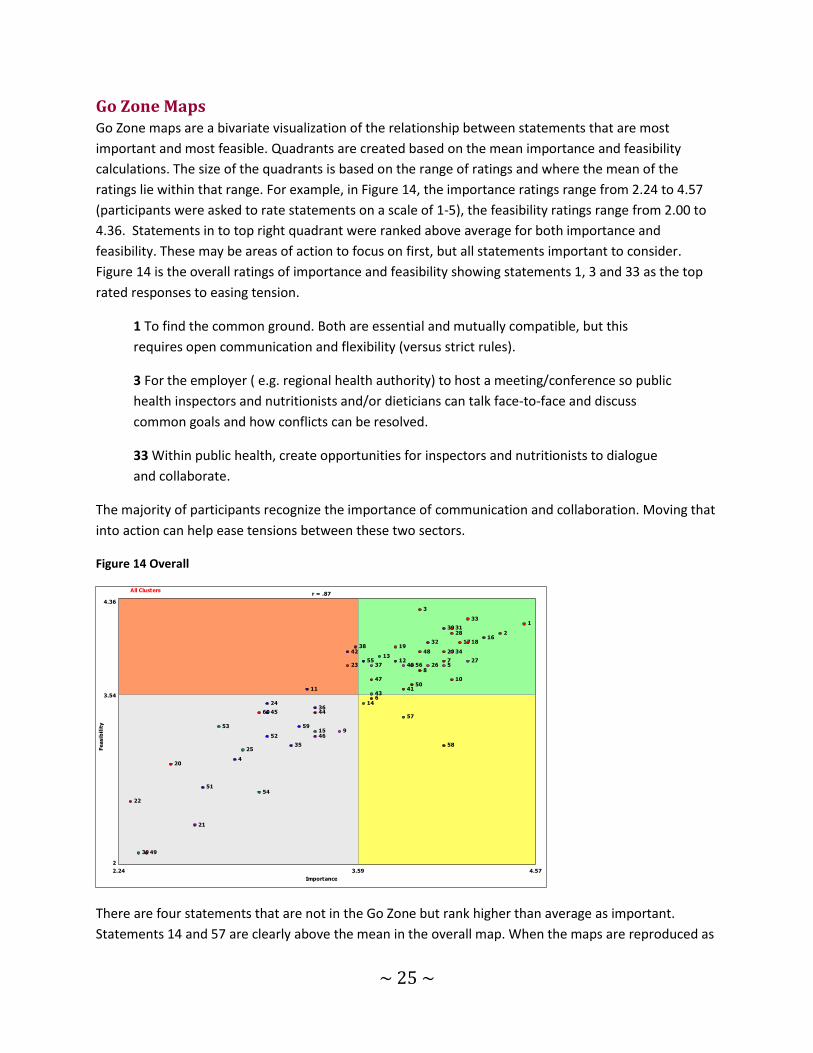
Go Zone Maps Go Zone maps are a bivariate visualization of the relationship between statements that are most
important and most feasible. Quadrants are created based on the mean importance and feasibility
calculations. The size of the quadrants is based on the range of ratings and where the mean of the
ratings lie within that range. For example, in Figure 14, the importance ratings range from 2.24 to 4.57
(participants were asked to rate statements on a scale of 1-5), the feasibility ratings range from 2.00 to
4.36. Statements in to top right quadrant were ranked above average for both importance and
feasibility. These may be areas of action to focus on first, but all statements important to consider.
Figure 14 is the overall ratings of importance and feasibility showing statements 1, 3 and 33 as the top
rated responses to easing tension.
1 To find the common ground. Both are essential and mutually compatible, but this
requires open communication and flexibility (versus strict rules).
3 For the employer ( e.g. regional health authority) to host a meeting/conference so public
health inspectors and nutritionists and/or dieticians can talk face-to-face and discuss
common goals and how conflicts can be resolved.
33 Within public health, create opportunities for inspectors and nutritionists to dialogue
and collaborate.
The majority of participants recognize the importance of communication and collaboration. Moving that
into action can help ease tensions between these two sectors.
Figure 14 Overall
There are four statements that are not in the Go Zone but rank higher than average as important.
Statements 14 and 57 are clearly above the mean in the overall map. When the maps are reproduced as
All Clusters
3.592.24 4.57
2
4.36
Importance
Feasib
ilit
y
3.54
1
2
3
4
5
6
7
8
9
10
11
1213
14
15
1617 18
19
20
21
22
23
24
25
2627
28
29
30 31
32
33
34
35
36
37
38
39
40
41
42
43
4445
46
47
48
49
50
51
52
53
54
5556
57
58
59
60
r = .87
~ 26 ~
clusters, you can see that these two statements are in the Go Zone for that set (“understanding risk and
regulation”). Similarly with statement 6 which is in the cluster “regulating scale”, while on the border
here in the overall map, it shows as more important in the cluster group. The only statement that is
considered very important, but not very feasible in the overall map and in the cluster group, is
statement 58: “To make food safety and security part of all areas of government... making food first in
all decisions will increase peoples understanding and collaboration.” This statement sits in the cluster
“recognizing scale”. This may be an interesting area for further study, to sort out why it is considered so
important, and what it would take to make it a more feasible.
The remainder of the graphs are detailed views of each cluster, organized according to the number of
statements each cluster contains. The statements are listed numerically, according to what is in the Go
Zone or ranked as both most important and most feasible, and then the remainder of the statements for
that cluster.
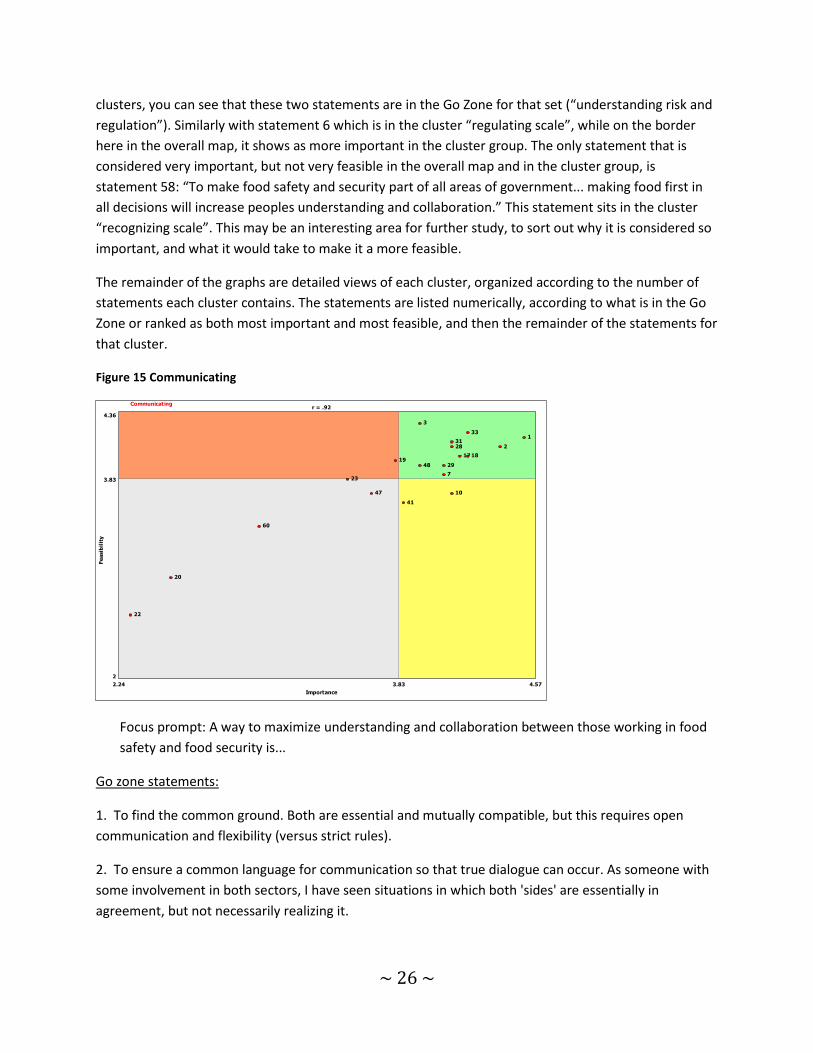
Figure 15 Communicating
Focus prompt: A way to maximize understanding and collaboration between those working in food
safety and food security is...
Go zone statements:
1. To find the common ground. Both are essential and mutually compatible, but this requires open
communication and flexibility (versus strict rules).
2. To ensure a common language for communication so that true dialogue can occur. As someone with
some involvement in both sectors, I have seen situations in which both 'sides' are essentially in
agreement, but not necessarily realizing it.
Communicating
3.832.24 4.57
2
4.36
Importance
Feasib
ilit
y
3.83
1
2
3
7
10
17 1819
20
22
23
28
29
31
33
41
47
48
60
r = .92
~ 27 ~
3. For the employer ( e.g. regional health authority) to host a meeting/conference so public health
inspectors and nutritionists and/or dieticians can talk face-to-face and discuss common goals and how
conflicts can be resolved.
7. To foster dialogue amongst the sectors, exploring the commonalities and differences and clarifying
the rationale and evidence behind each.
17. To work on regional or community basis. Begin with facilitated dialogue between public health food
safety staff and food security staff, reach a shared understanding, and then broaden the discussion to
include local farmers and community advocates. Document agreements.
18. To strengthen the relationship by recognizing common goals and values to create an image of what
the future can look like if they work together, then those working in food safety and food security can
make a plan to work toward specific goals.
28. To have an opportunity to share expertise and decide where they intersect and where the
'common'ness is, and also the gaps that create issues in the community.
29. For local food security activists to meet local food safety experts and build a relationships.
31. To examine what each other are doing and show the interdependence of one on the other. Knowing
that one's work is dependent on another area strengthens the need to understand, appreciate, and
want to be involved in the other area.
33. Within public health, create opportunities for inspectors and nutritionists to dialogue and
collaborate.
48. By bringing people to work together - food literacy, food skills capacity building, and food safety go
hand in hand. The silos should be broken down.
Statements not in the Go Zone
10. To talk and really listen to each other so as to gain an understanding of the different perspectives
from each field, then to come to an area of common ground and an agreement about where the two
groups can work together.
19. To schedule a meeting to build relationships and explore common goals and values to imagine what
the future would look like if those working in food safety and food security worked together (this
method is called scenario thinking).
20. By building the relationship with each other by going for a walk together and enjoying a meal
together then schedule a more formal meeting with those working in food safety and food security to
explore their common goals and values around food.
~ 28 ~
22. To enjoy a meal together (specifically a picnic, outdoors, with the families of those working in food
safety and food security present). After/during the meal talk about food safety and food security issues
in an informal way.
23. To organize collaborative workshops and field-days where information and ideas are shared and a
sense of common purpose can be developed.
41. To secure shared goals and priorities between the two groups whereby the responsibilities of both
interests are achieved.
47. Bring people together to explore the mandates of food safety and the advocacy entailed in food
security.
60. To establish or promote existing central interface on the internet, and yearly in person events, that
allows for continued permanent conversations between individuals and organizations from different
levels of involvement and different sectors.
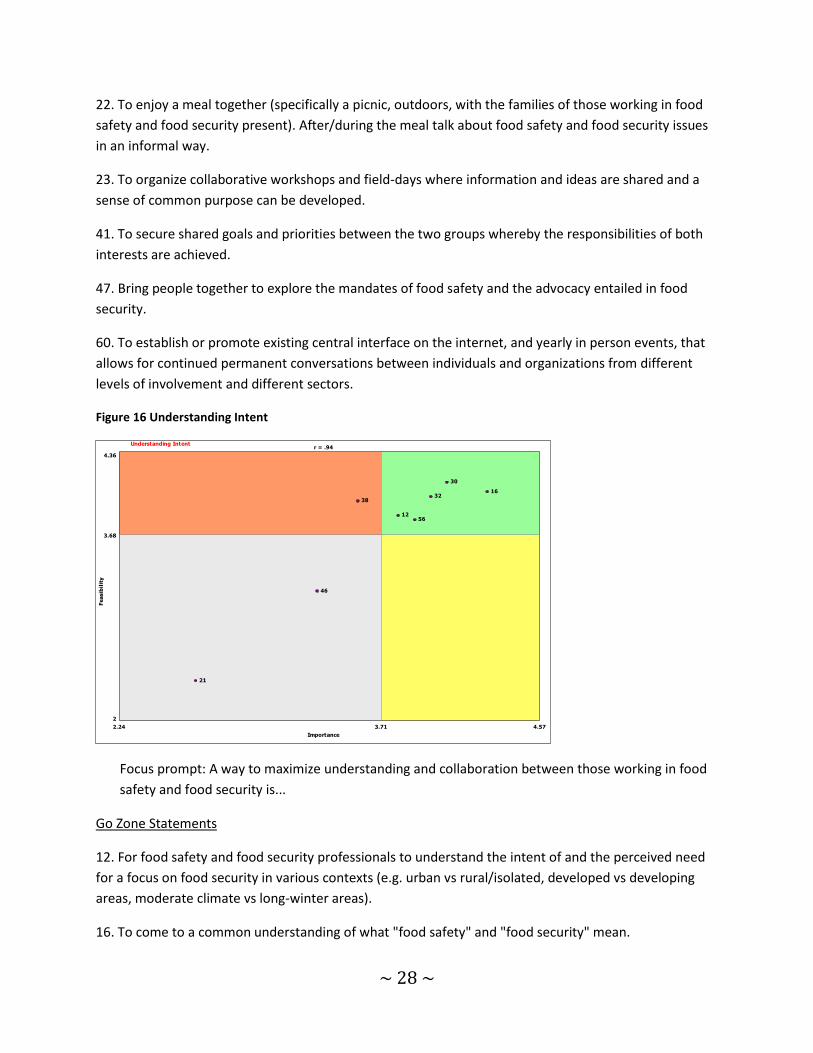
Figure 16 Understanding Intent
Focus prompt: A way to maximize understanding and collaboration between those working in food
safety and food security is...
Go Zone Statements
12. For food safety and food security professionals to understand the intent of and the perceived need
for a focus on food security in various contexts (e.g. urban vs rural/isolated, developed vs developing
areas, moderate climate vs long-winter areas).
16. To come to a common understanding of what "food safety" and "food security" mean.
Understanding Intent
3.712.24 4.57
2
4.36
Importance
Feasib
ilit
y
3.68
12
16
21
30
3238
46
56
r = .94
~ 29 ~
30. To understand the intents of food safety regulations and safe food handling practices, so that the
principles can be applied to food security initiatives; and such initiatives can be achieved.
32. To identify where inspectors and nutritionist converge and diverge. Is food access as central to
public health inspectors as it is to nutritionists when we talk about food security?
Not in the Go Zone
21. To go for a walk together in a low income neighbourhood. During or after walking, talk informally
about what they see or observed related to food while walking.
38. To emphasize that food safety and food security are not mutually exclusive.
46. To have discussions about the relationship of food safety to food security/sovereignty so we can
figure out the best balance. Paid service providers (inspectors) are the judge of local food events,
processing and growing, and we need to discuss the separation that judgement creates between people
and food.
56. To have a forum for food security initiatives to be discussed with food safety staff and public groups
to assist with overcoming barriers rather that halting projects due to lack of regulatory compliance.
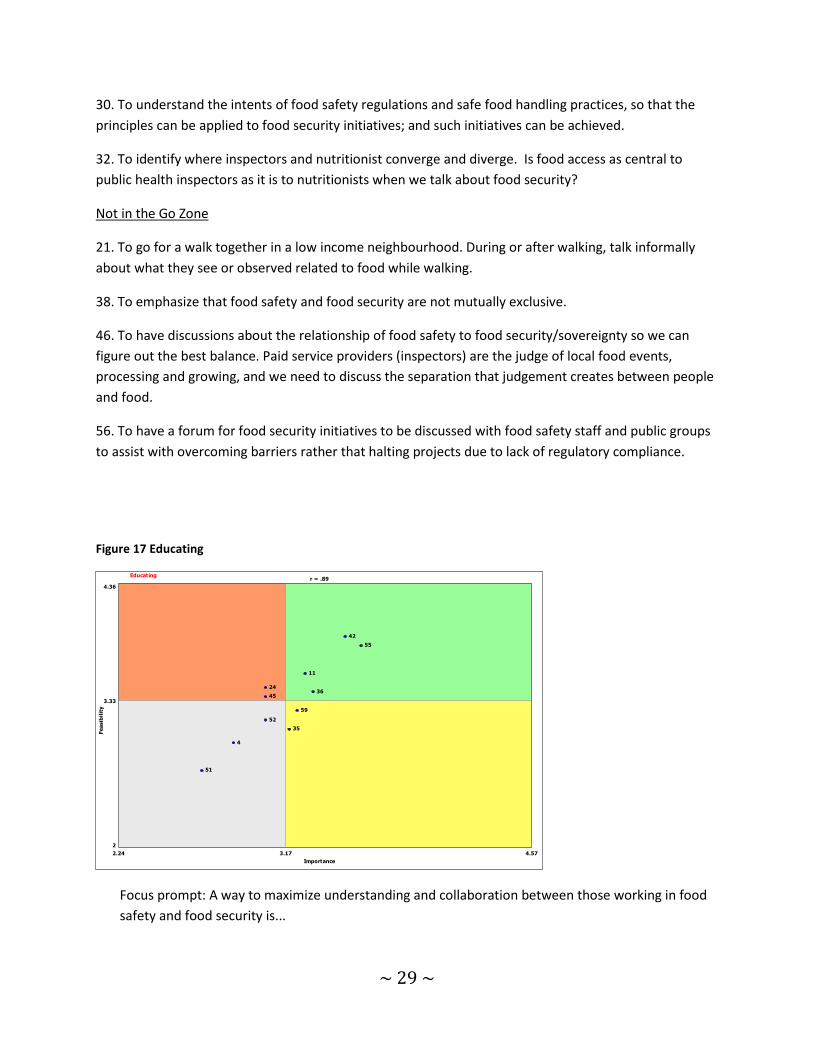
Figure 17 Educating
Focus prompt: A way to maximize understanding and collaboration between those working in food
safety and food security is...
Educating
3.172.24 4.57
2
4.36
Importance
Feasib
ilit
y
3.33
4
11
24
35
36
42
45
51
52
55
59
r = .89
~ 30 ~
Statements in the Go Zone
11. For everyone to remember that local does not guarantee safety nor does greater than 100 miles,
that neither home prepared nor commercially prepared guarantees safety, that neither raw nor cooked
guarantees safety, that neither inspected nor uninspected guarantees safety.
36. To engage all levels of populations around the importance of healthy accessible foods, and
education around the benefits of eating, cooking, growing, and producing natural foods.
42. By providing more reader-friendly information on regulatory environments, especially meat
processing. Creating easy-to-understand messaging around the differences between provincially and
federally inspected abattoirs is key to food procurement decision making.
55. By holding public information sessions to inform on the value of food security initiatives, the need
for food safety to be in place, and what constitutes food safety.
Not in the Go Zone
4. To educate the public that local food is not any safer than imported food. It feels better to have local
food but safety should be the priority.
24. By realizing that enough food doesn't necessarily mean 150 different types of items from the
produce section of the grocery store in winter. Frozen and canned foods are also acceptable.
35. To use everyone's available resources to reach out to everyone, to meet them where they are
currently in the food culture and help them along with resources, info and support, to improve the
culture for themselves.
45. To educate and empower people to be responsible to research where their food comes from and
decide for themselves if they will eat it - e.g. - label things that are genetically altered.
51. To communicate that without food, "safety" is meaningless; that safety is subservient to security.
52. To improve public understanding of their personal role in food safety, so they understand that the
safest food comes from someone you know and trust.
59. To create a public awareness campaign that is directed at people in power and within administration
of different organizations across sectors so that their knowledge of this issue is enhanced and they are
able to identify the need to support initiatives.
~ 31 ~
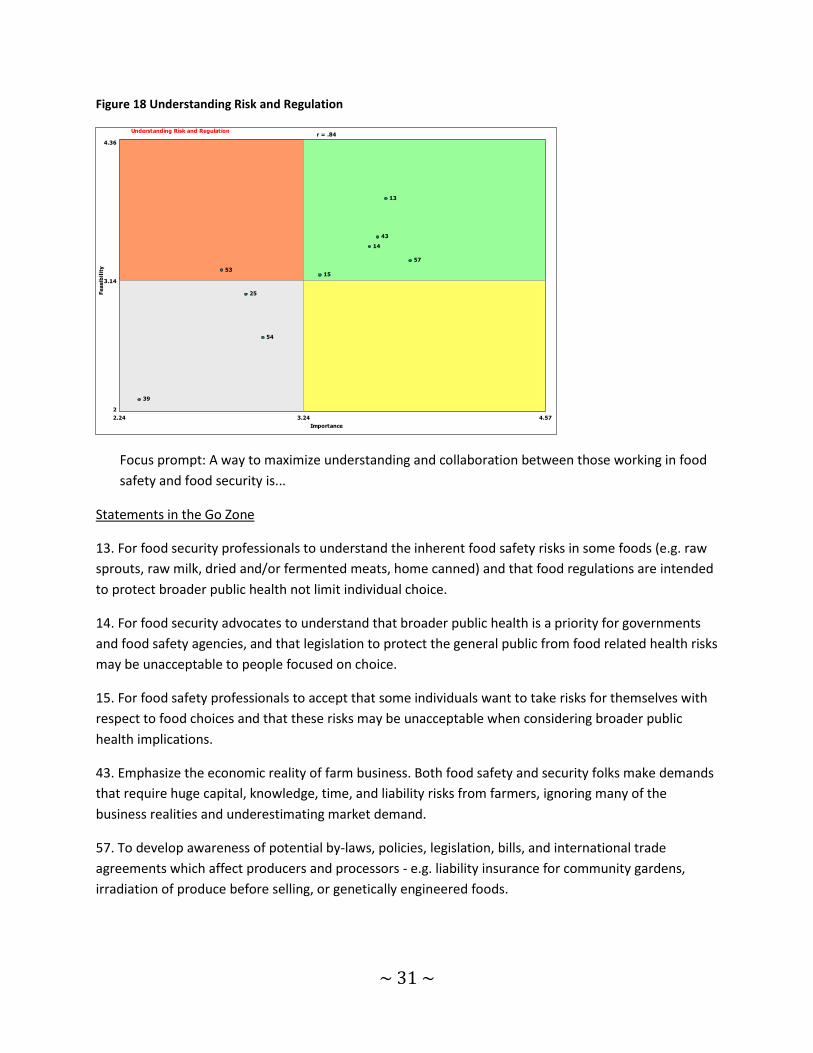
Figure 18 Understanding Risk and Regulation
Focus prompt: A way to maximize understanding and collaboration between those working in food
safety and food security is...
Statements in the Go Zone
13. For food security professionals to understand the inherent food safety risks in some foods (e.g. raw
sprouts, raw milk, dried and/or fermented meats, home canned) and that food regulations are intended
to protect broader public health not limit individual choice.
14. For food security advocates to understand that broader public health is a priority for governments
and food safety agencies, and that legislation to protect the general public from food related health risks
may be unacceptable to people focused on choice.
15. For food safety professionals to accept that some individuals want to take risks for themselves with
respect to food choices and that these risks may be unacceptable when considering broader public
health implications.
43. Emphasize the economic reality of farm business. Both food safety and security folks make demands
that require huge capital, knowledge, time, and liability risks from farmers, ignoring many of the
business realities and underestimating market demand.
57. To develop awareness of potential by-laws, policies, legislation, bills, and international trade
agreements which affect producers and processors - e.g. liability insurance for community gardens,
irradiation of produce before selling, or genetically engineered foods.
Understanding Risk and Regulation
3.242.24 4.57
2
4.36
Importance
Feasib
ilit
y
3.14
13
14
15
25
39
43
53
54
57
r = .84
~ 32 ~
Not in the Go Zone
53. To engage the public in education that ultimately, food safety issues rest with the consumer, NOT
the government.
54. To ensure that "food safety" issues do NOT intrude in "right to eat" issues.
25. To realize that food, unless it is sterile, is not safe and when it is sterile it is not particularly healthy
typically. Food that doesn't rot isn't food so we need to let go of our desire for guaranteed safe food.
39. To remove the word 'regulation' from the discussion.
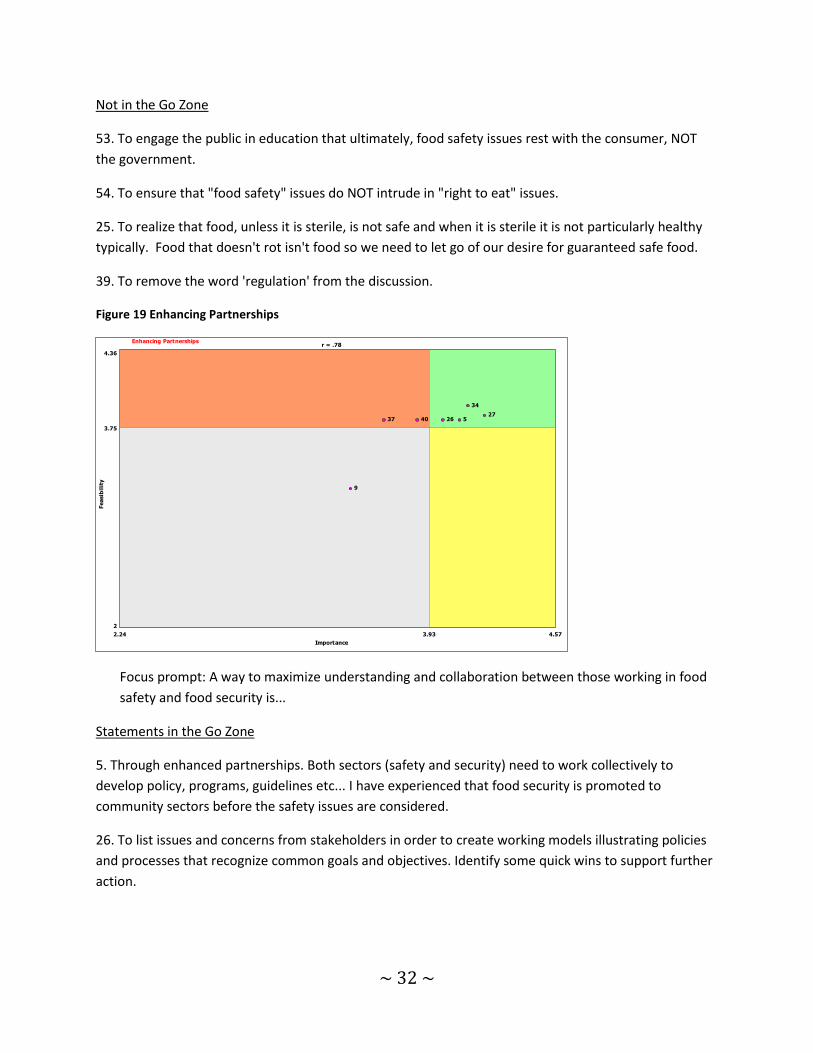
Figure 19 Enhancing Partnerships
Focus prompt: A way to maximize understanding and collaboration between those working in food
safety and food security is...
Statements in the Go Zone
5. Through enhanced partnerships. Both sectors (safety and security) need to work collectively to
develop policy, programs, guidelines etc... I have experienced that food security is promoted to
community sectors before the safety issues are considered.
26. To list issues and concerns from stakeholders in order to create working models illustrating policies
and processes that recognize common goals and objectives. Identify some quick wins to support further
action.
Enhancing Partnerships
3.932.24 4.57
2
4.36
Importance
Feasib
ilit
y
3.75
5
9
2627
34
37 40
r = .78
~ 33 ~
27. To form a collaborative group that has authority between food security activist, agriculture sector
and health sector that can move this forward rather than the current ad hoc community/regional
voluntary groups.
34. To increase opportunities to work together on food policy council and food system initiatives
occurring at the municipal level.
Not in the Go Zone
9. To identify the level of focus for the understanding and collaboration. National level XYZ won't
necessarily be able to understand and/or collaborate effectively with local level ABC because
constituencies and purposes are so different.
37. To create integrated, multidisciplinary work teams that bring the skills and knowledge from both sets
of expertise together when developing outputs (policies, recommendations, strategies).
40. To identify the greatest areas of concern and then to sort through those that have broad
implications and those that involve the least risk or the least ties to real food security.
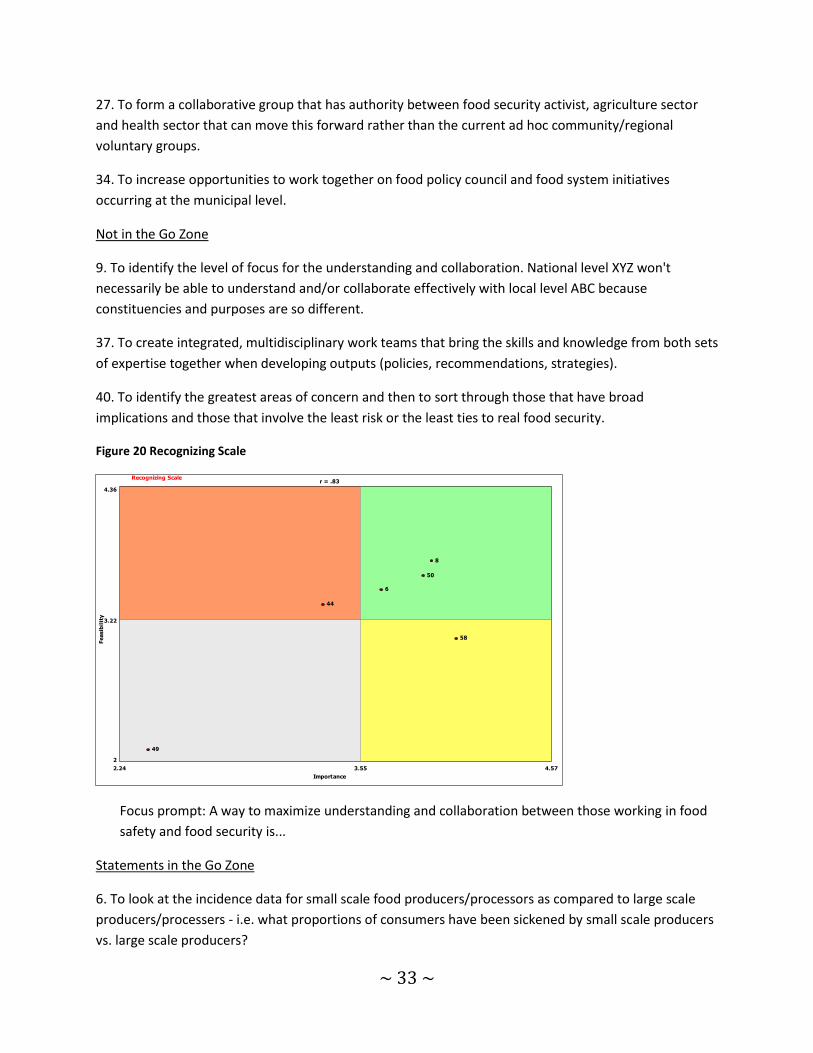
Figure 20 Recognizing Scale
Focus prompt: A way to maximize understanding and collaboration between those working in food
safety and food security is...
Statements in the Go Zone
6. To look at the incidence data for small scale food producers/processors as compared to large scale
producers/processers - i.e. what proportions of consumers have been sickened by small scale producers
vs. large scale producers?
Recognizing Scale
3.552.24 4.57
2
4.36
Importance
Feasib
ilit
y
3.22
6
8
44
49
50
58
r = .83
~ 34 ~
8. To look together at the various scales of food production and distribution and consider their impact
on both safety and security. In particular to consider what would be appropriate regulations for non-
industrial food production/processing.
50. To sort out issues of locality and size; to come to mutual understanding that small, local food
producers have fundamentally different food safety needs than big industrial food producers.
Not in the Go Zone
44. Get government agencies, hospitals, etc. to support local growers and help to strengthen local food
growing - by example.
49. To bring an end to draconian food safety actions, such as the arbitrary shutting down of raw dairy
herd share operations.
58. To make food safety and security part of all areas of government... making food first in all decisions
will increase peoples understanding and collaboration.
~ 35 ~
Discussion Concept mapping offers a unique means to involve a cross section of interested individuals in a
participatory mixed methodology project focused on a specific question of concern. In the course of this
project, concept mapping provided a platform for two diverse groups to share ideas on ways to ease
tensions between them. The call for intersectoral coordination and collaboration has been clear from
the onset of the core functions framework and core program process in BC, and is also a key health
promotion strategy. Putting that call into action requires a deliberate strategy with a focus on action.
Intersectoral coordination and collaboration are important aspects to a healthy food system, especially
given the broad spectrum of individuals who are engaged in food safety and food security activities.
Intersectoral collaboration is a joint working arrangement through which those working in different
sectors unite to address an issue to achieve a common goal (O'Neill, Lemieux, Groleau, Fortin, &
Lamarche, 1997; Dowling, Powell, & Glendinning, 2004). Health Canada developed an Intersectoral
Action Toolkit (Health Canada, 2000) that describes collaboration as a commitment to a common vision,
creating new channels for communication, committing to planning together, determining authority and
shared power, contributing both resources and reputation, and jointly sharing all risks, outcomes, and
rewards. Lasker, Weiss and Miller (2001) identify collaboration as a means to identify new and better
ways of thinking about an issue. Intersectoral collaboration is not new but evidence for successful
partnerships is sparse (Dowling et al., 2004; Lawn et al., 2008; Green & Kreuter, 2005). Stern (1990)
wrote about the tensions and contradictions of developing alliances stemming from the ‘Achieving
Health for All’ framework. This included competition for resources, competition for leadership between
professionals, and mistrust by community groups of professional associations and bureaucrats. Stern
advises leaders of alliances to be aware of the need to develop credibility, which takes time.
Additionally, she encourages debate about different and similar agendas, noting the need for a
combination of skills including political, analytical, mediator, facilitator and communication. Other
challenges include cultural differences, risk orientations, and decision-making styles (Alexander et al.,
2010). It can take considerable time and effort to develop trust and respect among the group, and there
needs to be full awareness of the challenges that an alliance can present.
Hawe and Stickney (1997) report that in forming a new coalition, direction setting and specifying goals
can be a long and difficult process involving values clarification. These authors also provide a warning
about the tendency of the health sector to slip into a position of assuming others will follow their lead
(Hawe & Stickney, 1997). The concern is that the community is working under the direction of the health
professionals, rather than everyone is working together. This can result in increased tension between
food security activists and regulatory authorities. Food security is a highly community driven program
with health authority staff working to support community activities. The food safety program is highly
regulatory, with health authority staff more often seen as enforcers, than as professionals working with
community members. Forming a new coalition between food security and food safety may help to
balance perceived power differentials. Benefits of an alliance or coalition could be increased
networking, information sharing, access to resources, participation in decision-making, and experiencing
a sense of accomplishment (Cramer, Atwood, & Stoner, 2006). There is an advantage to early
identification of problems and developing interventions together.
~ 36 ~
According to the participants, ways to maximize understanding and collaboration between those
working in food safety and food security fall into three broad areas: relationships, education and
context.
Relationships: Communicating and enhancing partnerships are about building relationships to be better
informed about the work and values of the other group. There is a need for a formal process of working
together to recognize common goals and objectives, in which policy, programs and guidelines can be
developed. The collaborative group needs to have authority balanced between food security activist,
agriculture sector, and health sector rather than the current ad hoc community/regional voluntary
groups. At the municipal level, there needs to be an environmental health officer or food safety
specialist sitting on food policy councils with community nutritionists and food security activists. The
relationships need to be encouraged in a systematic way locally, regionally and provincially; this requires
dedicated time to be allocated from the health authority so the relationship building is recognized as
important between these groups. It is as important to develop and maintain good working relationships
across professions as it is between the professionals and the community clients they work with on a
regular basis. The cross professional relationships will only enhance the work done with the community.
Education: Education needs to be focused on surfaced through the clusters of understanding intent,
educating, and understanding risk and regulations. The participants identified a lack of understanding of
how food security needs are different for those living in an urban versus living in a rural setting in terms
of access, and there is a lack of consideration about the intention toward developing a food secure
community in rural setting. Physical and social environments impact food access. In rural areas, there is
less access, in both a physical and economic sense, to the mainstream food system that supplies urban
areas (Smith & Morton, 2009). Food available through a retail market is limited in rural areas. According
to Morton, Bitto, Oakland and Sand (2008), rural low-income households have more frequent non-
market food exchanges than urban low-income households, and small scale food production is the most
economical way to have healthy food available to the community. Understanding the food security
needs in different settings is important to for a comprehensive approach to the food system. Similarly,
food safety guidelines are intended to prevent and reduce incidents of foodborne illness. It is not just
about knowing how to apply rules or guidelines, but understanding the bigger picture of what it takes to
create and support a safe food supply.
The regulatory environment is challenging to navigate. Demystifying regulations is one way to bridge the
gap between those who enforce regulations and those who work in environments needing to be
regulated. There is attention to the idea of food product labels being easy-to-read regarding safety,
nutrition, and allergens (Mackey & Metz, 2009; Mills & Valovirta 2004), but there is less concern that
food safety regulations be put into plain language. More could be done to describe regulatory
documents to assist in better communication between regulators and lay-people.
The final education piece is the role of public health and government in protection of the public as well
as the right to food and individual choice. This may be an issue of values. One participant wrote of a
concern that food safety would trump right to eat issues. So, on one hand there are those who value the
a precautionary approach and focus on the safety aspect of food, while on the other hand there are
~ 37 ~
those that perceive the risk of foodborne illness as minimal and the restraints on food access as
impeding the health and wellbeing of individuals and communities. These are complicated and value-
laden issues requiring relationship building, trust and respect to work out a balance.
Context: The final group, which stands alone, is “Recognizing Scale”. This group stands alone as a
structural set of statements, and as being most important to those working in food security and least
important to those working in food safety. It is related to the regulatory environment because the issue
is the same regulations that are applied to large-scale food production are applied to small-scale food
production, impacting the ability of small-scale producers to comply with standards that are not
completely fitting with the setting. Seed (2011) refers to the issue of scale in terms of standardization of
regulations as a subject of power. According to Dahlberg (as cited by Seed 2011), standardization allows
for a structurally simple society and therefore, more easily dominated. The tension here is clear, that
one group strives for simplicity while the other is seeking flexibility that adds a level of complexity
beyond the capacity of the system. Therefore systems change is necessary to operate in terms of what is
logical for the smaller context versus blanket regulations that are applied for simplicity sake.
Conclusion There are no easy or quick means to ease tensions between those working in food safety and food
security. There is, however, no mention of distrust between the groups and a general recognition of the
value of both safety and security for a healthy food system. Concept mapping has provided a way for
food safety and food security stakeholders to have direct input to resolving the problem. Specifically, we
identify five priorities to focus on for easing tensions:
1) There is a need to form a provincial level collaborative group that shares authority among food
security activist sector, agriculture sector, and health sector.
2) Food policy councils at the municipal level should include an environmental health officer or food
safety specialist along with community nutritionists and food security activists.
3) Relationships need to be encouraged in a systematic way locally, regionally and provincially and this
requires dedicated time to be allocated from the health authority.
4) There is a need to provide reader-friendly information on regulatory environments in order to
facilitate food procurement decision-making.
5) There is a need to increase food safety system capacity to allow for flexibility in regulations to match
the context of the small food producer.
Further exploration into these priorities is necessary to determine their value and success.
~ 38 ~
References Alexander, J. A., J. B. Christianson, et al. (2110). "Challenges of Capacity Building in Multisector
Community Health Alliances." Health Education & Behavior 37(5): 645-664.
Anonymous (2008). A Snapshot of Food Security Initiative in BC's Capital Region. Victoria, BC, CR-FAIR.
Anonymous (2011). VIHA Food Security Hubs. Victoria, BC, Vancouver Island Health Authority.
Baines, R. N., P. J. Ryan, et al. (2004). HACCP at the farm level - the missing link in food safety & security.
2004 World Food and Agribusiness Congress.
Cook, B. (2008). Food Security Issues in a Public Health Context. Literature Review. Antigonish, NS,
National Collaborating Centre for Determinants of Health.
Copeland, L. and L. Wilcott (2006). Evidence Review: Food Safety, Population Health and Wellness, B.C.
Ministry of Health.
Cramer, M. E., J. R. Atwood, et al. (2006). "A conceptual model for understanding effective coalitions
involved in health promotion programing." Public Health Nursing 23(1): 67-73.
Dowling, B., M. Powell, et al. (2004). "Conceptualising successful partnerships." Health & Social Care in
the Community 12(4): 309-317.
Egbers, A. (2009). The lay of the land: local food initiatives in Canada. Ottawa, ON, Canadian Co-
operative Association.
Epp, S. (2009). Provincial Approaches to Food Security: A Scan of Food Security Related Policies in
Canada. Winnipeg, Manitoba Food Charter.
FAO (1996). Declaration on world food security. World Food Summit, Rome, FAO.
Green, L. W. and M. W. Kreuter (2005). Health Program Planning: An educational and ecological
approach. New York, McGraw-Hill.
Hamm, M. W. (2009). "Principles for Framing a Healthy Food System." Journal of Hunger &
Environmental Nutrition 4(3): 241-250.
Hamm, M. W. and A. C. Bellows (2003). "Community Food Security and Nutrition Educators." Journal of
Nutrition Education & Behavior 35(1): 37-43.
Hawe, P. and E. K. Stickney (1997). "Developing the effectiveness of an intersectoral food policy coalition
through formative evaluation." Health Education Research 12(2): 213-225.
Health Canada. (2000, 9/10/02/). "Policy Development Framework for Management of Risks Associated
with the Consumption of Raw Food of Animal Origin." from http://www.hc-sc.gc.ca/fn-
an/legislation/pol/policy_development_framework-cadre_d_elaboration_politiques-eng.php.
~ 39 ~
Kane, M. and W. M. Trochim (2007). Concept Mapping for Planning and Evaluation. Thousand Oaks,
Sage Publications.
Kuchenmuller, T., S. Hird, et al. (2009). Estimating the global burden of foodborne diseases - a
collaborative effort. Eurosurveillance: pii=19195.
Lang, T. (2009). "Reshaping the Food System for Ecological Public Health." Journal of Hunger &
Environmental Nutrition 4(3): 315-335.
Lasker, R. D., E. S. Weiss, et al. (2001). "Promoting collaborations that improve health." Education for
Health 14(2): 163-172.
Lawn, J. E., J. Rohde, et al. (2008). "Alma-Ata 30 years on: revolutionary, relevant, and time to revitalise."
The Lancet 372(9642): 917-927.
Mackey, M. A. and M. Metz (2009). "Ease of reading of mandatory information on Canadian food
product labels." International Journal of Consumer Studies 33(4): 369-381.
Mills, E. N. C., E. Valovirta, et al. (2004). "Information provision for allergic consumers – where are we
going with food allergen labelling?" Allergy 59(12): 1262-1268.
Morris, J. G. (2011). "How safe is our food?" Emerging Infectious Diseases [Epub ahead of print].
Morton, L., E. Bitto, et al. (2008). "Accessing food resources: Rural and urban patterns of giving and
getting food." Agriculture and Human Values 25(1): 107-119.
O'Neill, M., V. Lemieux, et al. (1997). "Coalition theory as a framework for understanding and
implementing intersectoral health-related interventions." Health Promotion International 12(1): 79-87.
Scallan, E., R. M. Hoekstra, et al. (2011). "Foodborne illness acquired in the United States - major
pathogens." Emerging Infectious Diseases [EPub ahead of print]
Seed, B. (2011). Food Security in Public Health and other Government Programs in British Columbia,
Canada: A Policy Analysis. Dissertation submitted to Centre for Food Policy in the School of Community
and Health Sciences, City University, London, UK.
Serapiglia, T., E. Kennedy, et al. (2007). "Association of food premises inspection and disclosure program
with retail-acquired foodborne illness and operator noncompliance in Toronto." Journal of
Environmental Health 70(1): 54-59.
Smith, C. and L. W. Morton "Rural Food Deserts: Low-income Perspectives on Food Access in Minnesota
and Iowa." Journal of Nutrition Education and Behavior 41(3): 176-187.
Stern, R. (1990). "Healthy communities, reflections on building alliances in Canada." Health Promotion
International 5(3): 225-231.
~ 40 ~
Trochim, W. M. (1989). "An introduction to concept mapping for planning and evaluation." Evaluation
Program Planning 12: 1-16.
Trochim, W. (1993). The reliability of concept mapping. Paper presented at the Annual Conference of
the American Evaluation Association, Dallas, TX.
Trochim, W. M., D. A. Cabrera, et al. (2006). "Practical challenges of systems thinking and modeling in
public health." American Journal of Public Health 96(3): 538-546.
Weatherill, S. (2009). Report of the independent investigator into the 2008 Listeriosis outbreak,
Government of Canada.