Embed Size (px)
Citation preview
Level crossing safety performance report June 2006
If you would like to give feedback on any of the material contained in this report, or if you have any suggestions for future editions, please contact: Adrian Smith Safety Intelligence Analyst Rail Safety and Standards Board Evergreen House 160 Euston Road London NW1 2DX [email protected] The report can be downloaded at no cost from the RSSB website www.rssb.co.uk.
© Copyright Rail Safety and Standards Board 2006
Executive summary 3 1 Introduction 5 2 Aims and objectives 6
2.1 Aims of the safety performance reports 6 2.2 Aims of the level crossing safety performance report 6
3 Scope and structure of the report 7 3.1 Report structure 7 3.2 Types of level crossing covered by the report 7 3.3 Data issues 8
4 Safety performance 9 4.1 Overall level of risk from the level crossing interface 9 4.2 Benchmarking of UK performance 15 4.3 Pedestrian safety at level crossings 17 4.4 Accidents involving road vehicles at level crossings 24 4.5 Level crossing equipment failures 35 4.6 Trains striking level crossing gates 37 4.7 Category A SPADs at level crossings 39
5 Risk profile 42 5.1 Risk profile - overall risk 42 5.2 Risk profile - summary and conclusions 46
6 Current initiatives 48 Appendix.1 Level crossing descriptions 51 Appendix.2 Level crossing related research projects 54 Appendix.3 Level crossings with the highest level of misuse 57 Appendix.4 Level crossings with the highest level of near misses 58 Glossary 59 Definitions 60
2 June 2006 Level crossing safety performance report
Executive summary
Executive summary Level crossings are a key interface between the railway and the public. There are around 7,500 on the mainline railway network, and while they contribute only 6% of the overall railway risk profile, they do provide a significant proportion (35%) of the risk associated with train accidents.1 Misuse by crossing users contributes 95% of the risk at level crossings.
Some of the main facts arising from the analysis in this report are as follows:
• There have been no train occupant fatalities or major injuries in accidents at level crossings since the incident at Ufton Nervet in November 2004.
• The level of risk from level crossing collisions has shown a slight improvement over the last five years.
• The rate of collisions with road vehicles at level crossings has remained constant, with 16 occurring in both 2004 and 2005.
• 2005 was the first year since 1999 where no derailment occurred as the result of a train striking a road vehicle on a level crossing.
• There were 13 accidental fatalities (ie not including suicides and suspected suicides) at level crossings in 2005 – three were road vehicle occupants, 10 were pedestrians (including the two passengers who died in the accident at Elsenham in December 2005).
• Near miss and misuse incidents rose in 2005, compared with 2004.
Since RSSB’s last level crossing report (July 2005), the most significant level crossing event took place at Elsenham station footpath crossing on 3 December 2005. While attempting to cross the line to catch a train on the Down platform, two young girls did not react to the red miniature warning light and yodel alarm, which visually and audibly indicated that it was not safe to open the wicket gate and use the crossing. Unfortunately, this resulted in the girls stepping into the path of a moving train. A formal inquiry was conducted into all circumstances of the incident, the report of which may be accessed in full at www.rssb.co.uk.
Although level crossings are the largest source of train accident risk on the mainline railway in Great Britain, the accident rate (when viewed on a per crossing basis), shows that Britain’s railways experience significantly fewer accidents per crossing, than their European neighbours.
The overall level of risk has remained largely static over the last five years, indicating, if anything, a very slight improvement in the general trend. However, the small number of reported incidents means that this change is likely to be the result of statistical variations in the data, rather than a significant improvement in safety performance.
1 This figure is derived from version 4 of the Safety Risk Model (SRM), a comprehensive mathematical representation of more than 120 hazardous events that could lead directly to injury or fatality on the railway.
3
© Copyright Rail Safety and Standards Board 2006
Executive summary This report provides information on some of the initiatives Network Rail has in place to reduce this risk, such as a level crossing media campaign, which has been launched to inform and educate the wider public about the hazards involved.
Until recently, the reporting of level crossing safety performance involved the term ‘trespass’, which was used to describe inappropriate behaviour at the interface. This approach was reviewed for the 2005 Annual Safety Performance Report (ASPR) and has now been replaced by a consideration of level crossing events in terms of ‘proper use’ and ‘misuse’. The change is described in detail both in the ASPR and this report.
4 June 2006 Level crossing safety performance report
Introduction
1 Introduction This is the third edition of RSSB’s Safety Performance Report (SPR) for level crossings. It includes pedestrian footpath crossings and is one of a quartet of topic SPRs that are produced twice a year. (The other three cover station safety, workforce safety and railway crime.)
As with its predecessor (issued in July 2005), this report includes detailed analysis of level crossings, but excludes discussion of road vehicle incursions (which will be dealt with in the half-yearly SPR). It presents details of the level of risk to passengers, the workforce and members of the public from incidents at the road-rail interface. Recent trends are also identified, in order to highlight areas of changing safety performance. The report outlines the underlying causes that contribute to the current level of risk and the initiatives and research projects in hand to improve safety further.
Future reports will build on this one by undertaking additional detailed analysis into the areas of greatest significance. We would appreciate any views you may have on the content of this document, along with any ideas about supplementary information that you would like to see in subsequent editions.
Information on the numbers of fatalities and injuries that occurred during the year is discussed throughout this report. In all cases, the numbers of fatalities associated with a particular event, or group of events, are first considered separately. The numbers of major and minor injuries that arose are then taken into account. In doing this, the numbers of injuries are weighted in recognition of their relatively less serious outcome. The current weighting is 0.1 for each major injury and 0.005 for each minor injury, the combined measure being deemed ‘fatalities and weighted injuries’ (FWI).
The term ‘fatalities and weighted injuries’ (FWI) replaces ‘equivalent fatalities’ (ef), which was used previously within the industry.
5 © Copyright Rail Safety and Standards Board 2006
Aims and objectives
2 Aims and objectives
2.1 Aims of the safety performance reports The aim of RSSB’s suite of safety performance reports is, in general, to inform the industry and external stakeholders about the scale and composition of risk in key areas of the railway. The anticipated audience for the reports ranges from directors through to frontline managers, who have a responsibility for managing safety.
The above aim is achieved through collating accident, incident and precursor information from a range of data sources and analysing it to provide consistent, reliable and in-depth information about risk.
The safety performance reports support the industry’s Strategic Safety Plan (SSP) by presenting detailed information in targeted areas. The reports are updated periodically so that trends in risk may be observed as the industry addresses areas of high risk by the introduction of actions and initiatives.
2.2 Aims of the level crossing safety performance report The key aim of this report is to present information on the composition of risk that occurs at level crossings. Specifically, the topics cover:
• Fatalities and injuries at level crossings.
• Near misses of pedestrians and road users.
• Misuse of level crossings by pedestrians and road users.
• Equipment failures at level crossings.
• Comparison of the relative safety performance at different types of level crossing.
• Identification of the higher-risk level crossings.
In addition to analysing current safety performance, this report also presents the latest initiatives and research that are being undertaken to improve safety at level crossings.
6 June 2006 Level crossing safety performance report
Scope and structure
3 Scope and structure of the report
3.1 Report structure All the analysis in this report is based on data records from SMIS up to the end of December 2005.
The safety performance and risk profiling sections in the report cover those incidents occurring at level crossings. These are broken down into three areas that contribute to the risk: acts of pedestrians, road users in vehicles and level crossing failures. These are further subdivided as follows:
Pedestrians
• Injured during the use of the level crossing, not involving a train.
• Struck by train.
• Near misses and misuse for user worked and automatic level crossings.
Road vehicle occupants2
• Struck by trains.
• Train derailments due to striking vehicles.
• Near misses and misuse.
Level crossing failures
• Mechanical failure.
• Trains striking gates.
The analysis also covers category A SPADs at level crossings and unauthorised access to level crossings.
3.2 Types of level crossing covered by the report The latest census states that there are 7,674 level crossings on the Network Rail Controlled Infrastructure (NRCI), all of which are within the scope of this report; the distribution of these geographically and by type is presented in Table 1, the information being derived from the level crossing census as at 31 December 2005. 1 explains the characteristics of each level crossing type.
2 For the analyses presented here, vehicles types include motorcycles, as well as lorries and
tractors.
7 © Copyright Rail Safety and Standards Board 2006
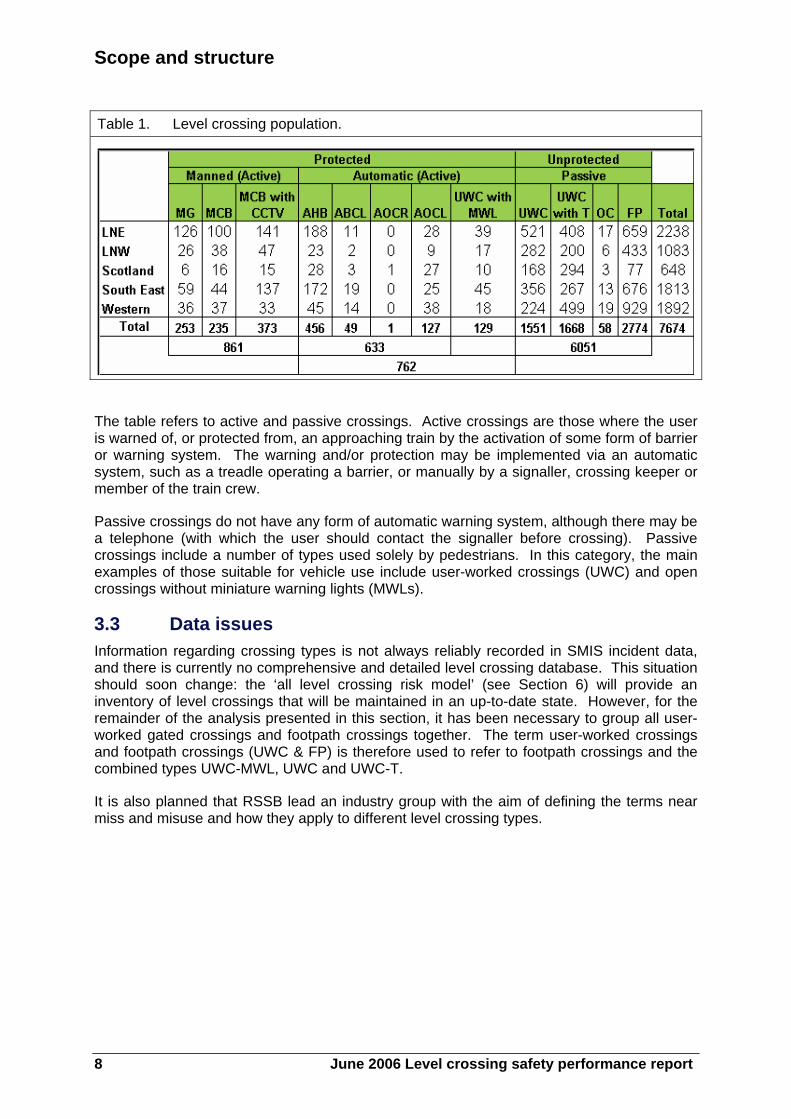
Scope and structure Table 1. Level crossing population.
The table refers to active and passive crossings. Active crossings are those where the user is warned of, or protected from, an approaching train by the activation of some form of barrier or warning system. The warning and/or protection may be implemented via an automatic system, such as a treadle operating a barrier, or manually by a signaller, crossing keeper or member of the train crew.
Passive crossings do not have any form of automatic warning system, although there may be a telephone (with which the user should contact the signaller before crossing). Passive crossings include a number of types used solely by pedestrians. In this category, the main examples of those suitable for vehicle use include user-worked crossings (UWC) and open crossings without miniature warning lights (MWLs).
3.3 Data issues Information regarding crossing types is not always reliably recorded in SMIS incident data, and there is currently no comprehensive and detailed level crossing database. This situation should soon change: the ‘all level crossing risk model’ (see Section 6) will provide an inventory of level crossings that will be maintained in an up-to-date state. However, for the remainder of the analysis presented in this section, it has been necessary to group all user-worked gated crossings and footpath crossings together. The term user-worked crossings and footpath crossings (UWC & FP) is therefore used to refer to footpath crossings and the combined types UWC-MWL, UWC and UWC-T.
It is also planned that RSSB lead an industry group with the aim of defining the terms near miss and misuse and how they apply to different level crossing types.
8 June 2006 Level crossing safety performance report
Safety performance
4 Safety performance
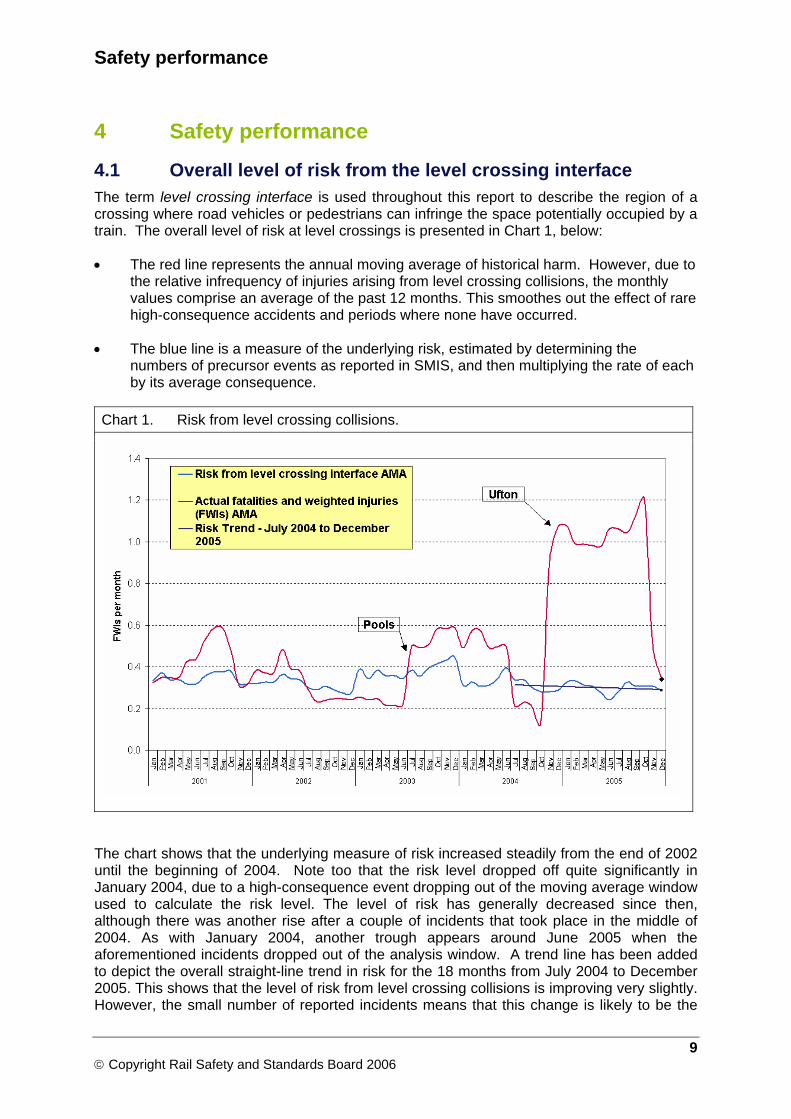
4.1 Overall level of risk from the level crossing interface The term level crossing interface is used throughout this report to describe the region of a crossing where road vehicles or pedestrians can infringe the space potentially occupied by a train. The overall level of risk at level crossings is presented in Chart 1, below:
• The red line represents the annual moving average of historical harm. However, due to the relative infrequency of injuries arising from level crossing collisions, the monthly values comprise an average of the past 12 months. This smoothes out the effect of rare high-consequence accidents and periods where none have occurred.
• The blue line is a measure of the underlying risk, estimated by determining the numbers of precursor events as reported in SMIS, and then multiplying the rate of each by its average consequence.
Chart 1. Risk from level crossing collisions.
The chart shows that the underlying measure of risk increased steadily from the end of 2002 until the beginning of 2004. Note too that the risk level dropped off quite significantly in January 2004, due to a high-consequence event dropping out of the moving average window used to calculate the risk level. The level of risk has generally decreased since then, although there was another rise after a couple of incidents that took place in the middle of 2004. As with January 2004, another trough appears around June 2005 when the aforementioned incidents dropped out of the analysis window. A trend line has been added to depict the overall straight-line trend in risk for the 18 months from July 2004 to December 2005. This shows that the level of risk from level crossing collisions is improving very slightly. However, the small number of reported incidents means that this change is likely to be the
9 © Copyright Rail Safety and Standards Board 2006
Safety performance result of statistical variations in the data, rather than a significant improvement in safety performance.
The measure of reported injuries (shown in red) is more variable, the peaks being dominated by low-frequency, high-consequence events.
During the last four years, there have been six level crossing incidents where the accidental fatalities and weighted injuries were greater than one:
• Midge Hall on 29 April 2002 (London North Western – one fatality, one minor injury).
• Fishbourne on 31 January 2003 (South Eastern – one fatality, one minor injury).
• Pools level crossing on 7 July 2003 (London North Western – three fatalities, one major injury, five minor injuries).
• Ufton Nervet on 6 November 2004 (Western – seven fatalities, 10 major injuries, 27 minor injuries). In addition, there was also one suicide.
• Blotoft Siding on 6 December 2004 (London North Eastern – two fatalities).
• Swainsthorpe on 13 November 2005 (Anglia – one fatality, one minor injury).
• Elsenham on 3 December 2005 (South Eastern – two fatalities).
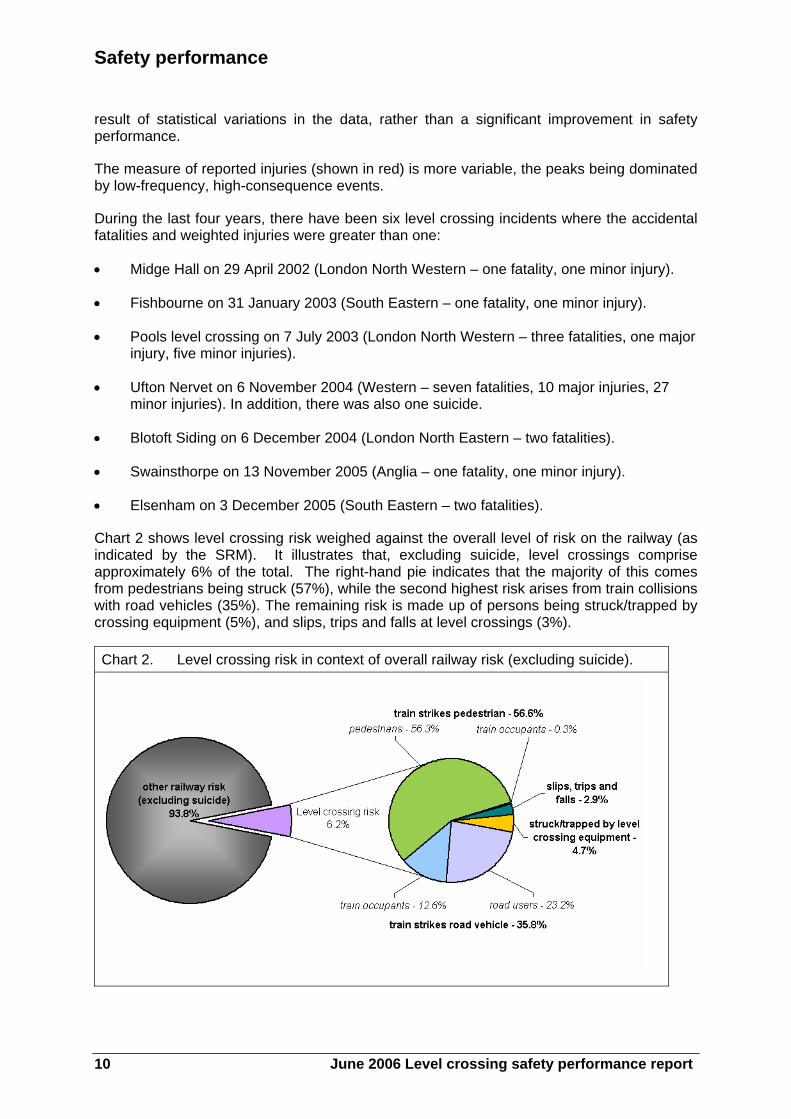
Chart 2 shows level crossing risk weighed against the overall level of risk on the railway (as indicated by the SRM). It illustrates that, excluding suicide, level crossings comprise approximately 6% of the total. The right-hand pie indicates that the majority of this comes from pedestrians being struck (57%), while the second highest risk arises from train collisions with road vehicles (35%). The remaining risk is made up of persons being struck/trapped by crossing equipment (5%), and slips, trips and falls at level crossings (3%).
Chart 2. Level crossing risk in context of overall railway risk (excluding suicide).
10 June 2006 Level crossing safety performance report
Safety performance
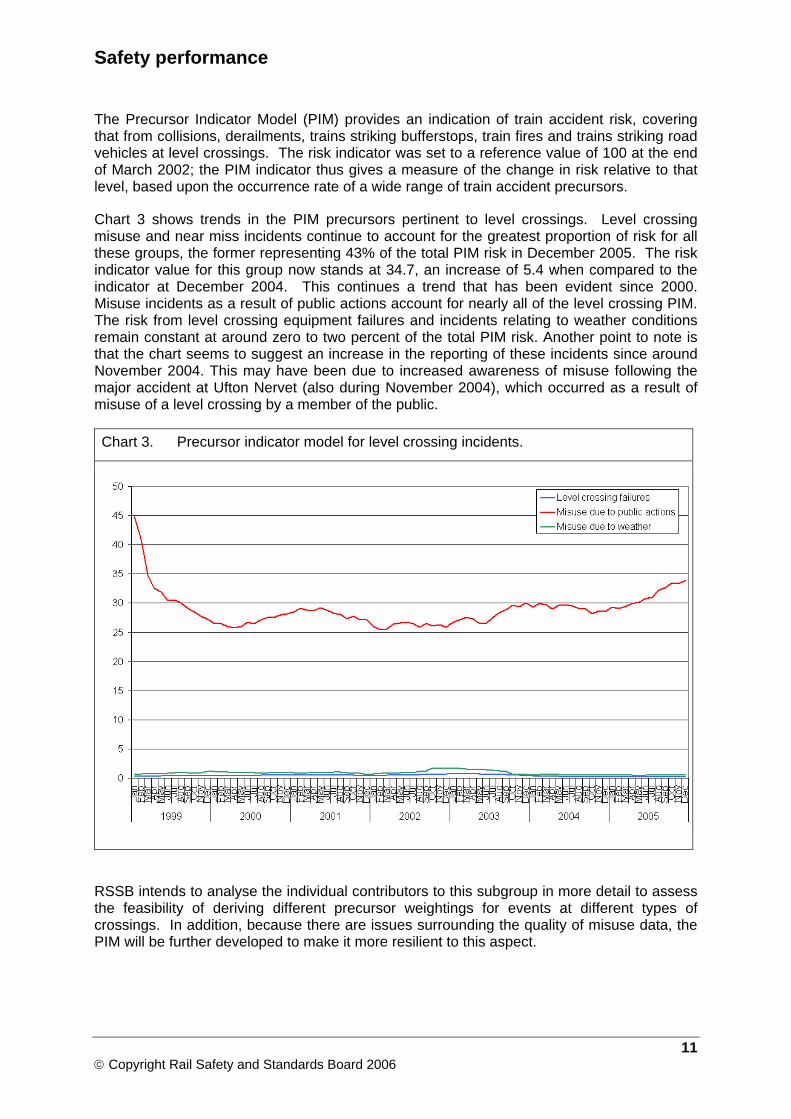
The Precursor Indicator Model (PIM) provides an indication of train accident risk, covering that from collisions, derailments, trains striking bufferstops, train fires and trains striking road vehicles at level crossings. The risk indicator was set to a reference value of 100 at the end of March 2002; the PIM indicator thus gives a measure of the change in risk relative to that level, based upon the occurrence rate of a wide range of train accident precursors.
Chart 3 shows trends in the PIM precursors pertinent to level crossings. Level crossing misuse and near miss incidents continue to account for the greatest proportion of risk for all these groups, the former representing 43% of the total PIM risk in December 2005. The risk indicator value for this group now stands at 34.7, an increase of 5.4 when compared to the indicator at December 2004. This continues a trend that has been evident since 2000. Misuse incidents as a result of public actions account for nearly all of the level crossing PIM. The risk from level crossing equipment failures and incidents relating to weather conditions remain constant at around zero to two percent of the total PIM risk. Another point to note is that the chart seems to suggest an increase in the reporting of these incidents since around November 2004. This may have been due to increased awareness of misuse following the major accident at Ufton Nervet (also during November 2004), which occurred as a result of misuse of a level crossing by a member of the public.
Chart 3. Precursor indicator model for level crossing incidents.
RSSB intends to analyse the individual contributors to this subgroup in more detail to assess the feasibility of deriving different precursor weightings for events at different types of crossings. In addition, because there are issues surrounding the quality of misuse data, the PIM will be further developed to make it more resilient to this aspect.
11 © Copyright Rail Safety and Standards Board 2006
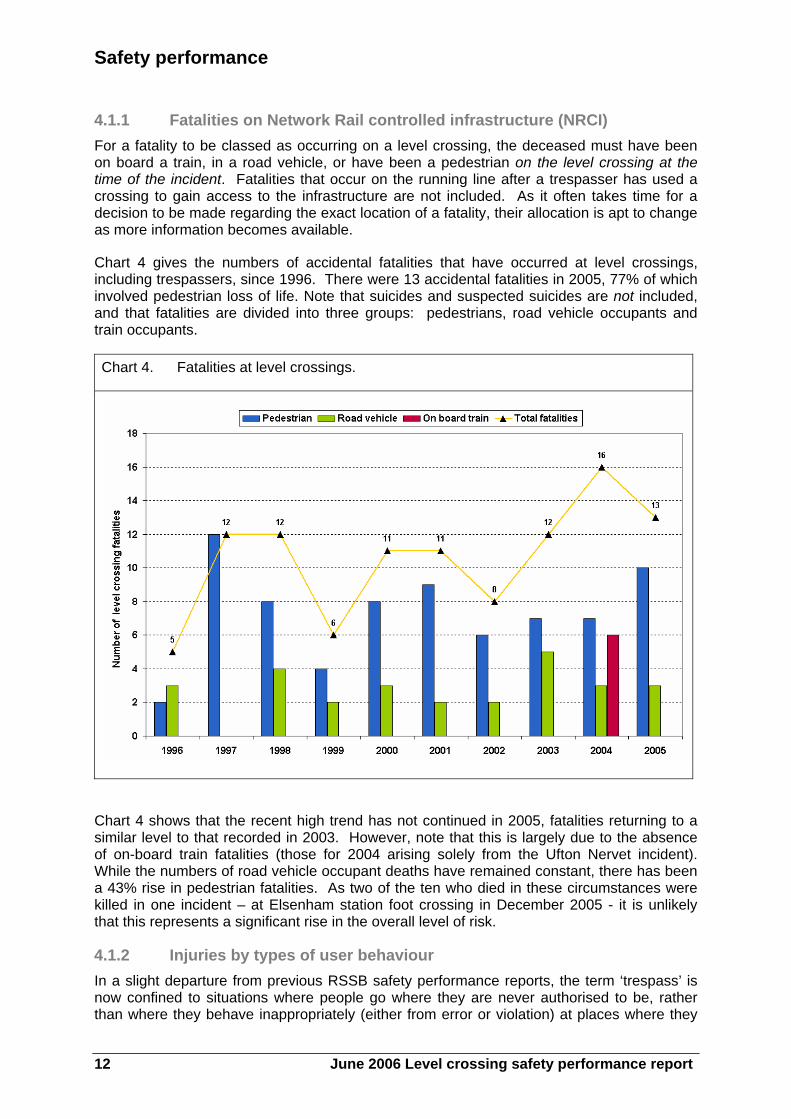
Safety performance 4.1.1 Fatalities on Network Rail controlled infrastructure (NRCI) For a fatality to be classed as occurring on a level crossing, the deceased must have been on board a train, in a road vehicle, or have been a pedestrian on the level crossing at the time of the incident. Fatalities that occur on the running line after a trespasser has used a crossing to gain access to the infrastructure are not included. As it often takes time for a decision to be made regarding the exact location of a fatality, their allocation is apt to change as more information becomes available.
Chart 4 gives the numbers of accidental fatalities that have occurred at level crossings, including trespassers, since 1996. There were 13 accidental fatalities in 2005, 77% of which involved pedestrian loss of life. Note that suicides and suspected suicides are not included, and that fatalities are divided into three groups: pedestrians, road vehicle occupants and train occupants.
Chart 4. Fatalities at level crossings.
Chart 4 shows that the recent high trend has not continued in 2005, fatalities returning to a similar level to that recorded in 2003. However, note that this is largely due to the absence of on-board train fatalities (those for 2004 arising solely from the Ufton Nervet incident). While the numbers of road vehicle occupant deaths have remained constant, there has been a 43% rise in pedestrian fatalities. As two of the ten who died in these circumstances were killed in one incident – at Elsenham station foot crossing in December 2005 - it is unlikely that this represents a significant rise in the overall level of risk.
4.1.2 Injuries by types of user behaviour In a slight departure from previous RSSB safety performance reports, the term ‘trespass’ is now confined to situations where people go where they are never authorised to be, rather than where they behave inappropriately (either from error or violation) at places where they
12 June 2006 Level crossing safety performance report
Safety performance
are allowed to be at certain times and under certain conditions. This revision was brought about by a review of the circumstances surrounding recent level crossing accidents. In several cases, correctly functioning equipment was unable to prevent some users from crossing in error. To describe the victims of such accidents as trespassers is not appropriate, as this behaviour is very different from taking a short cut along the trackside, for example. Thus, accidents occurring to users at level crossings are now classified as one of three types: proper use, misuse (error), or misuse (violation). The three categories concerned may be defined as follows:
Proper use: users begin to cross entirely legitimately, but unforeseen events lead to a transgression (as when a motor vehicle breaks down half-way across a crossing, or the level crossing fails due to an error outside the users control).
Misuse: Error - users cross when a train is imminent, but are honestly mistaken about its proximity and the warnings given by signs, sirens etc.
Misuse: Violation - users cross when a train is imminent, but deliberately disregard warnings and signage (as when users weave between half-barriers, or play ‘chicken’ with oncoming trains).
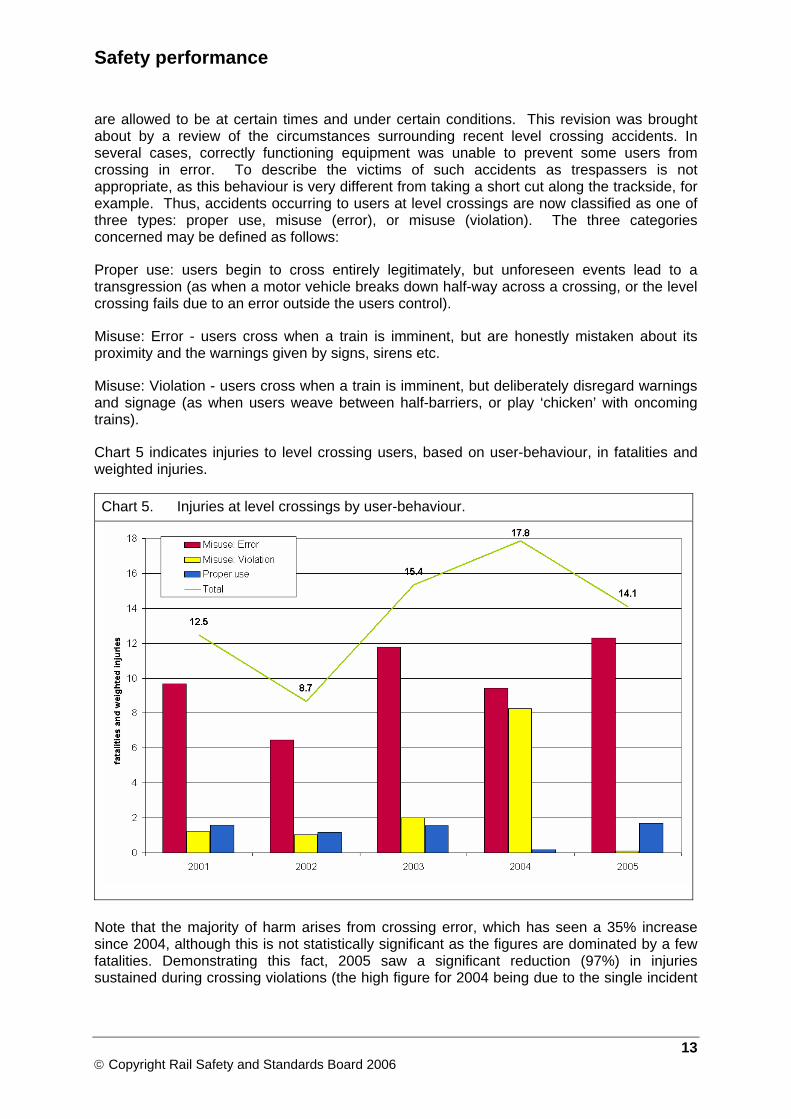
Chart 5 indicates injuries to level crossing users, based on user-behaviour, in fatalities and weighted injuries.
Chart 5. Injuries at level crossings by user-behaviour.
Note that the majority of harm arises from crossing error, which has seen a 35% increase since 2004, although this is not statistically significant as the figures are dominated by a few fatalities. Demonstrating this fact, 2005 saw a significant reduction (97%) in injuries sustained during crossing violations (the high figure for 2004 being due to the single incident
13 © Copyright Rail Safety and Standards Board 2006
Safety performance at Ufton Nervet - as with Chart 4)3. Apart from the drop witnessed last year, harm from proper use appears to remain consistent with the average levels seen over the previous four years.
4.1.3 Near miss, misuse and harm at level crossings Because of the relatively small number of accidents that occur at level crossings, it is difficult to monitor trends and identify patterns using accident data alone. The industry therefore also collects data on near misses, misuse, and equipment failures.
Typically, near misses are reported by a train driver who has to take action to avoid a collision, or feels that he or she came close to striking a road vehicle or pedestrian. There is an element of subjective judgement regarding what constitutes a near miss, and the prevailing light and visibility conditions may also affect the likelihood of an event being reported. In general, between 20 and 30 near misses are reported for every pedestrian hit by a train, and around ten near misses reported for every road vehicle that is struck. The difficulty in ensuring objective reporting of near misses means that overall trends are of greater significance than the actual numbers.
Misuse refers to a variety of situations in which crossing users attempt to traverse a crossing when it is unsafe to do so, or otherwise fail to use the equipment correctly. Typical reports involve road users jumping red lights or trying to beat the barriers, pedestrians ignoring warnings (including cases of children playing ‘chicken’), damage to crossing equipment (caused by road accidents or vandalism) and, at user-worked crossings, gates being left open, telephones off the hook, and users failing to report when they are clear of the tracks. Misuse is thought to be considerably under-reported, because the majority of crossings are not monitored by railway staff. Evidence from the formal inquiry conducted into the incident at Elsenham in December 2005 suggested that, even when a crossing is monitored, all the incidents of misuse recorded locally are not necessarily entered into SMIS. RSSB will be initiating a review of the SMIS input requirements for these types of events. Again, in the light of these difficulties, overall trends are more significant than the numbers themselves.
The relative frequency of near miss and misuse reports varies by crossing type as a result of their different nature and usage and – crucially – the likelihood of misuse being detected.
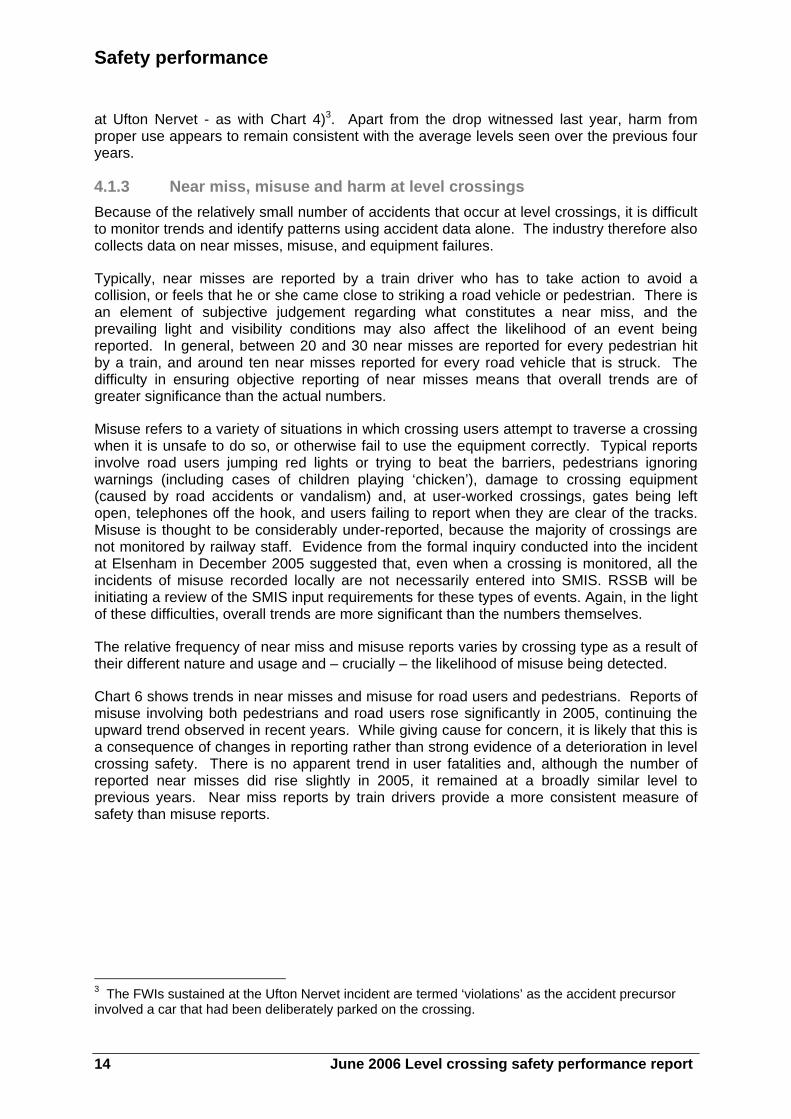
Chart 6 shows trends in near misses and misuse for road users and pedestrians. Reports of misuse involving both pedestrians and road users rose significantly in 2005, continuing the upward trend observed in recent years. While giving cause for concern, it is likely that this is a consequence of changes in reporting rather than strong evidence of a deterioration in level crossing safety. There is no apparent trend in user fatalities and, although the number of reported near misses did rise slightly in 2005, it remained at a broadly similar level to previous years. Near miss reports by train drivers provide a more consistent measure of safety than misuse reports.
3 The FWIs sustained at the Ufton Nervet incident are termed ‘violations’ as the accident precursor involved a car that had been deliberately parked on the crossing.
14 June 2006 Level crossing safety performance report
Safety performance
Chart 6. Near miss, misuse and harm at level crossings.
4.2 Benchmarking of UK performance 4.2.1 International comparison Level crossings represent the largest source of train accident risk across the network. However, the principal risk is to road users, rather than train occupants. Almost all level crossing risk is the result of public misuse.
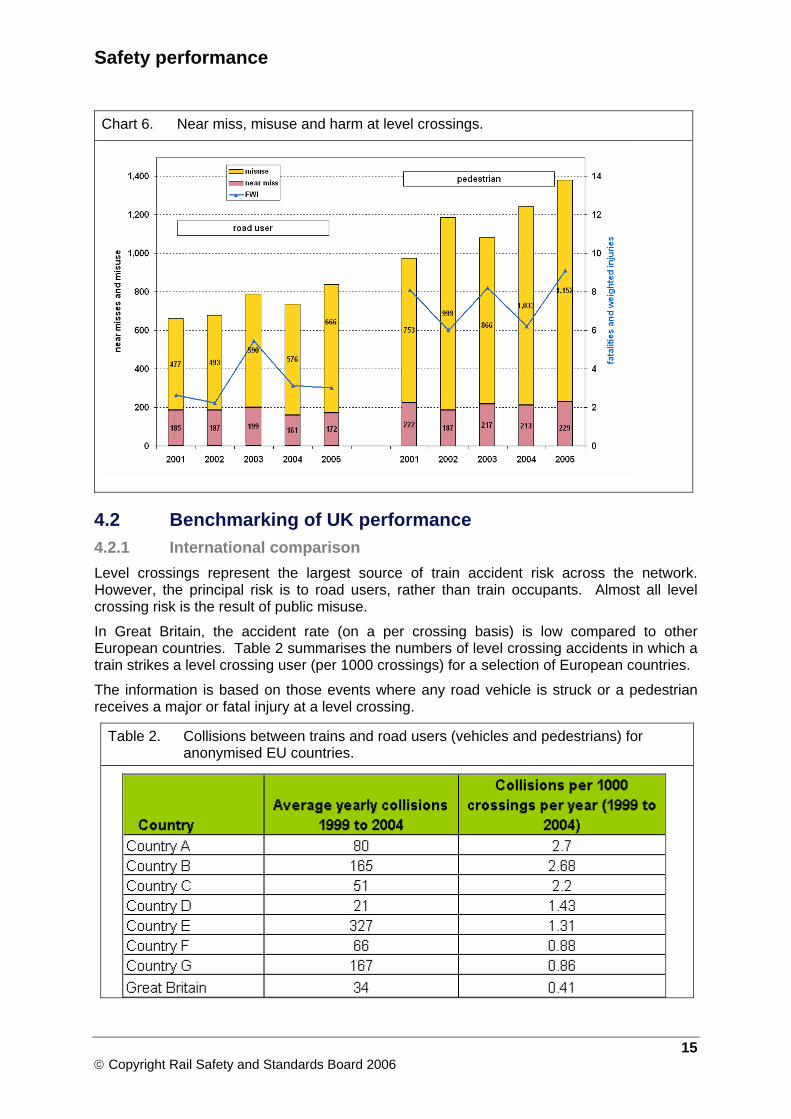
In Great Britain, the accident rate (on a per crossing basis) is low compared to other European countries. Table 2 summarises the numbers of level crossing accidents in which a train strikes a level crossing user (per 1000 crossings) for a selection of European countries.
The information is based on those events where any road vehicle is struck or a pedestrian receives a major or fatal injury at a level crossing.
Table 2. Collisions between trains and road users (vehicles and pedestrians) for anonymised EU countries.
15 © Copyright Rail Safety and Standards Board 2006
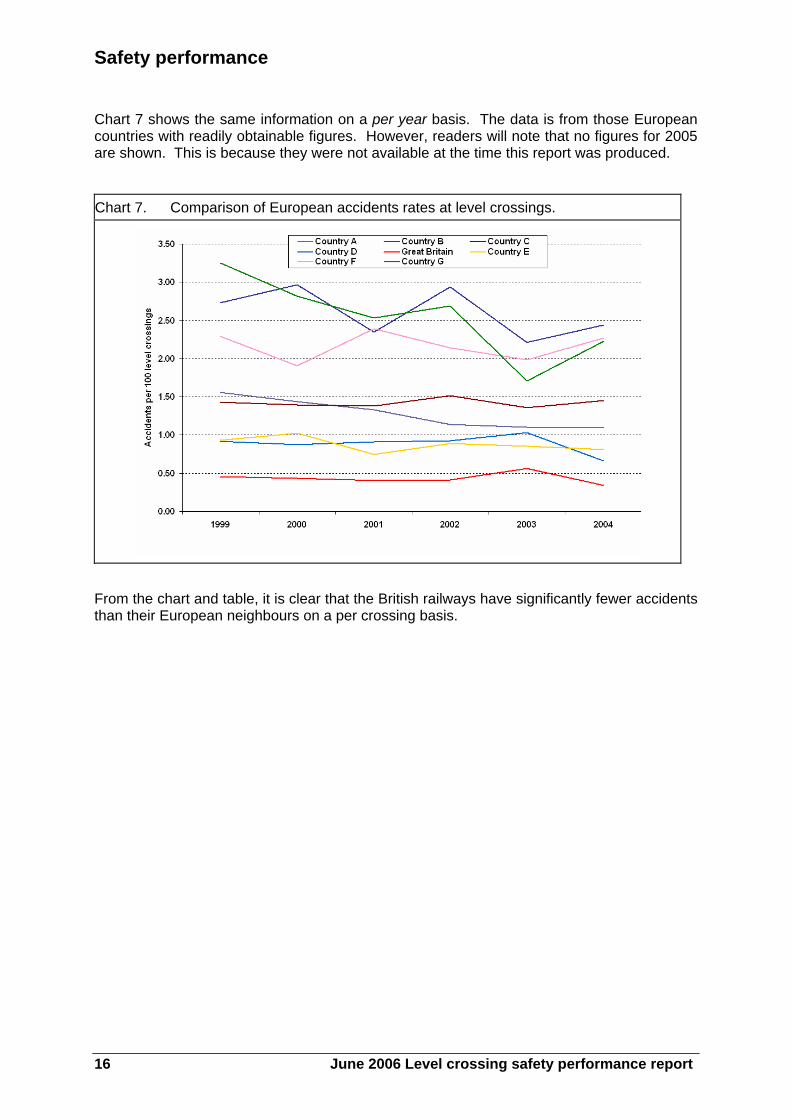
Safety performance Chart 7 shows the same information on a per year basis. The data is from those European countries with readily obtainable figures. However, readers will note that no figures for 2005 are shown. This is because they were not available at the time this report was produced.
Chart 7. Comparison of European accidents rates at level crossings.
From the chart and table, it is clear that the British railways have significantly fewer accidents than their European neighbours on a per crossing basis.
16 June 2006 Level crossing safety performance report
Safety performance
4.3 Pedestrian safety at level crossings The following sections characterise the risk to pedestrians at level crossings based upon an analysis of SMIS data. Information is presented on misuse and near miss accident precursors, the higher numbers of which allow trends in risk to be analysed. Information is also provided on annual trends and seasonal variation.
4.3.1 Pedestrian fatalities and weighted injuries (FWIs) by error type As highlighted in the overview of safety performance section of the report, accidents occurring to users at level crossing are classified as one of three types: proper use, misuse (error), or misuse (violation).
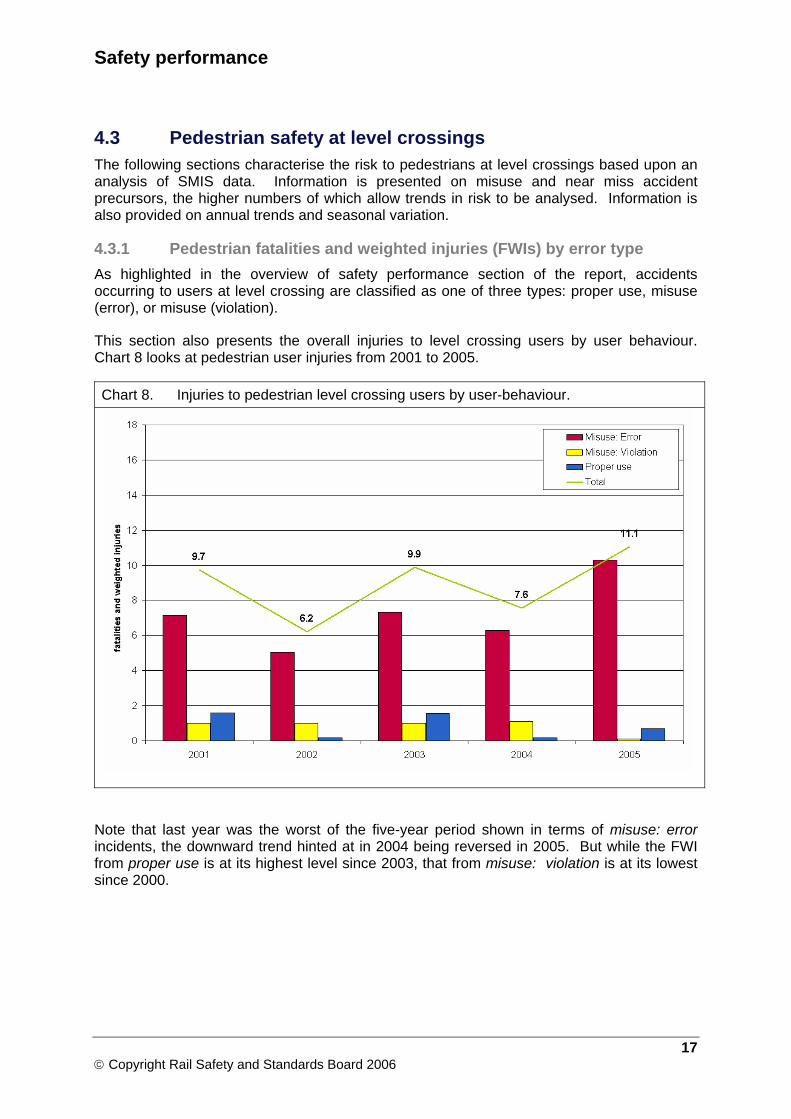
This section also presents the overall injuries to level crossing users by user behaviour. Chart 8 looks at pedestrian user injuries from 2001 to 2005.
Chart 8. Injuries to pedestrian level crossing users by user-behaviour.
Note that last year was the worst of the five-year period shown in terms of misuse: error incidents, the downward trend hinted at in 2004 being reversed in 2005. But while the FWI from proper use is at its highest level since 2003, that from misuse: violation is at its lowest since 2000.
17 © Copyright Rail Safety and Standards Board 2006
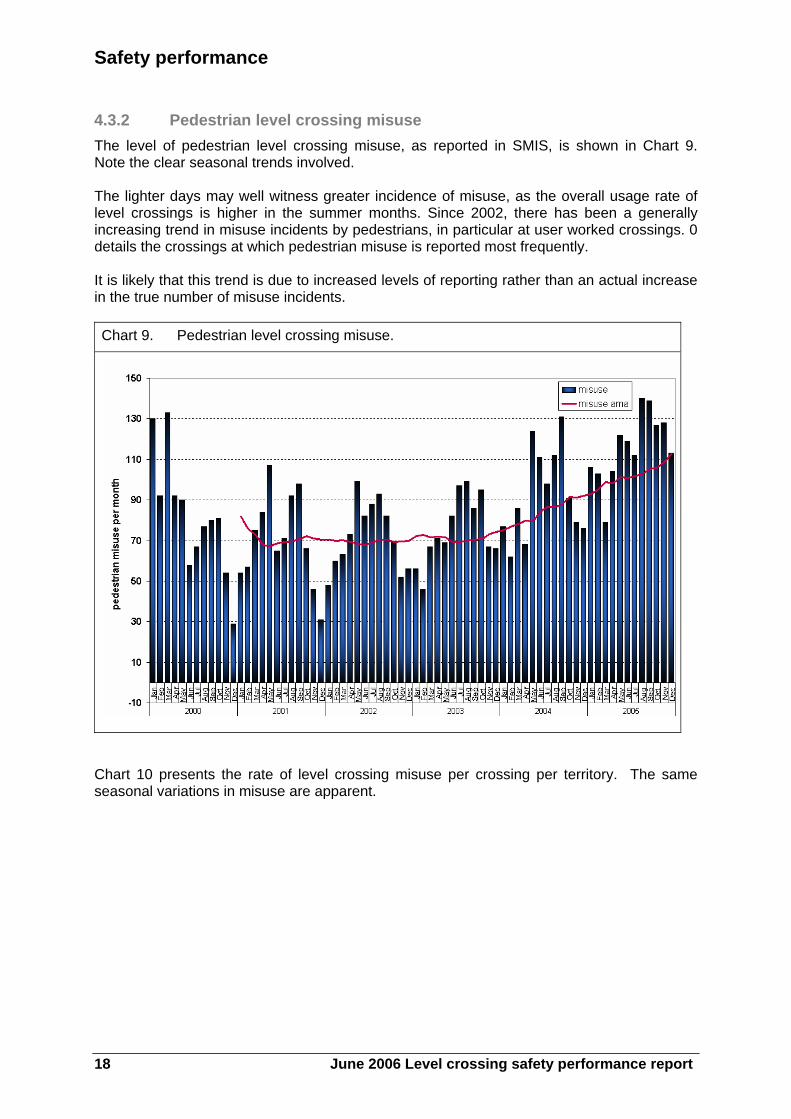
Safety performance 4.3.2 Pedestrian level crossing misuse The level of pedestrian level crossing misuse, as reported in SMIS, is shown in Chart 9. Note the clear seasonal trends involved. The lighter days may well witness greater incidence of misuse, as the overall usage rate of level crossings is higher in the summer months. Since 2002, there has been a generally increasing trend in misuse incidents by pedestrians, in particular at user worked crossings. 0 details the crossings at which pedestrian misuse is reported most frequently. It is likely that this trend is due to increased levels of reporting rather than an actual increase in the true number of misuse incidents. Chart 9. Pedestrian level crossing misuse.
Chart 10 presents the rate of level crossing misuse per crossing per territory. The same seasonal variations in misuse are apparent.
18 June 2006 Level crossing safety performance report

Safety performance
Chart 10. Pedestrian level crossing misuse by territory.
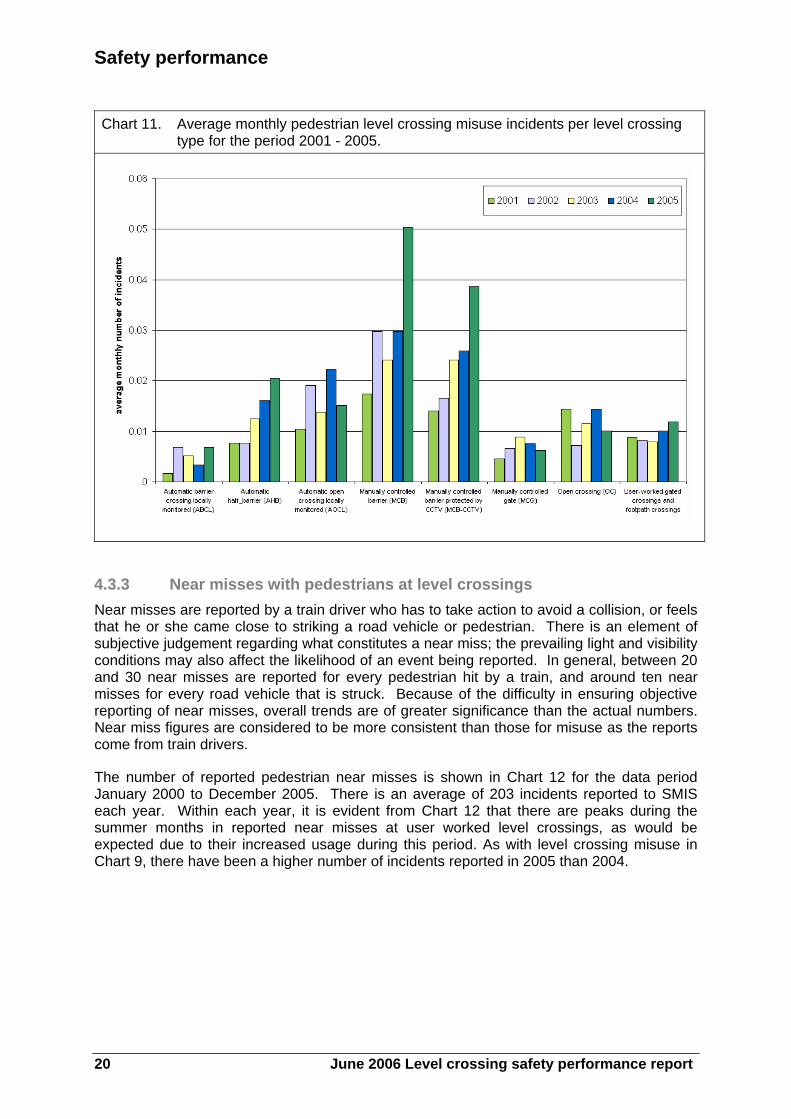
Chart 11 shows a comparison of the monthly average level of misuse by crossing type between 2001 and 2005. The data is normalised to account for the number of level crossings of each type. However, it is important to be aware that the incidents are normalised using the current level crossing numbers, which have changed more than a little over the five-year period. The chart shows that the highest level of misuse (per crossing) occurs at MCB and MCB protected by CCTV crossings. MCB and CCTV crossings have experienced a significant increase in reported incidents over the period, with automatic half-barrier crossings (AHB) and automatic barrier locally monitored (ABCL) crossings also increasing in the period, although at a much lower rate.
Both MCB and CCTV crossings are monitored. Therefore, it is likely that there is a significantly higher detection rate of misuse incidents, rather than a higher rate of misuse per se. AOCL crossings have no physical barrier and so have a high vulnerability to misuse.
The final category on the chart groups all user-worked and footpath crossing types together. Currently, there is insufficient level crossing type resolution in the database to make firm conclusions as to the type of crossings that are bad actors within the group.
19 © Copyright Rail Safety and Standards Board 2006
Safety performance Chart 11. Average monthly pedestrian level crossing misuse incidents per level crossing
type for the period 2001 - 2005.
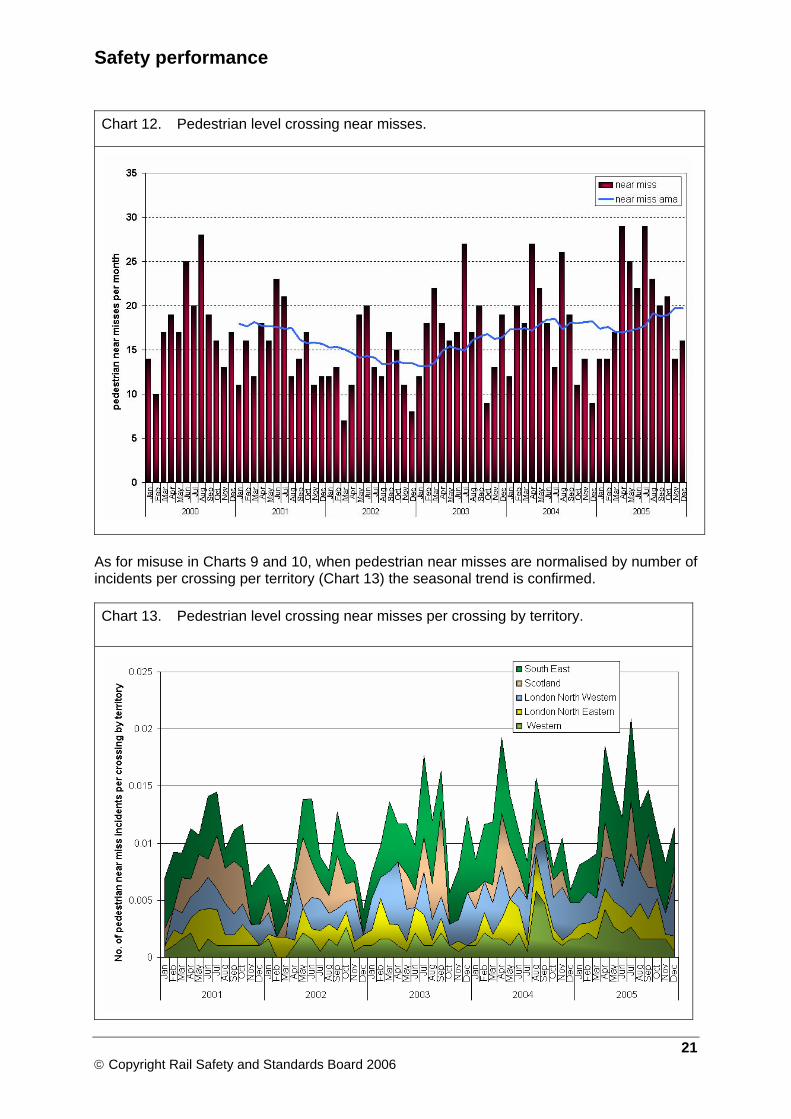
4.3.3 Near misses with pedestrians at level crossings Near misses are reported by a train driver who has to take action to avoid a collision, or feels that he or she came close to striking a road vehicle or pedestrian. There is an element of subjective judgement regarding what constitutes a near miss; the prevailing light and visibility conditions may also affect the likelihood of an event being reported. In general, between 20 and 30 near misses are reported for every pedestrian hit by a train, and around ten near misses for every road vehicle that is struck. Because of the difficulty in ensuring objective reporting of near misses, overall trends are of greater significance than the actual numbers. Near miss figures are considered to be more consistent than those for misuse as the reports come from train drivers.
The number of reported pedestrian near misses is shown in Chart 12 for the data period January 2000 to December 2005. There is an average of 203 incidents reported to SMIS each year. Within each year, it is evident from Chart 12 that there are peaks during the summer months in reported near misses at user worked level crossings, as would be expected due to their increased usage during this period. As with level crossing misuse in Chart 9, there have been a higher number of incidents reported in 2005 than 2004.
20 June 2006 Level crossing safety performance report
Safety performance
Chart 12. Pedestrian level crossing near misses.
As for misuse in Charts 9 and 10, when pedestrian near misses are normalised by number of incidents per crossing per territory (Chart 13) the seasonal trend is confirmed.
Chart 13. Pedestrian level crossing near misses per crossing by territory.
21 © Copyright Rail Safety and Standards Board 2006
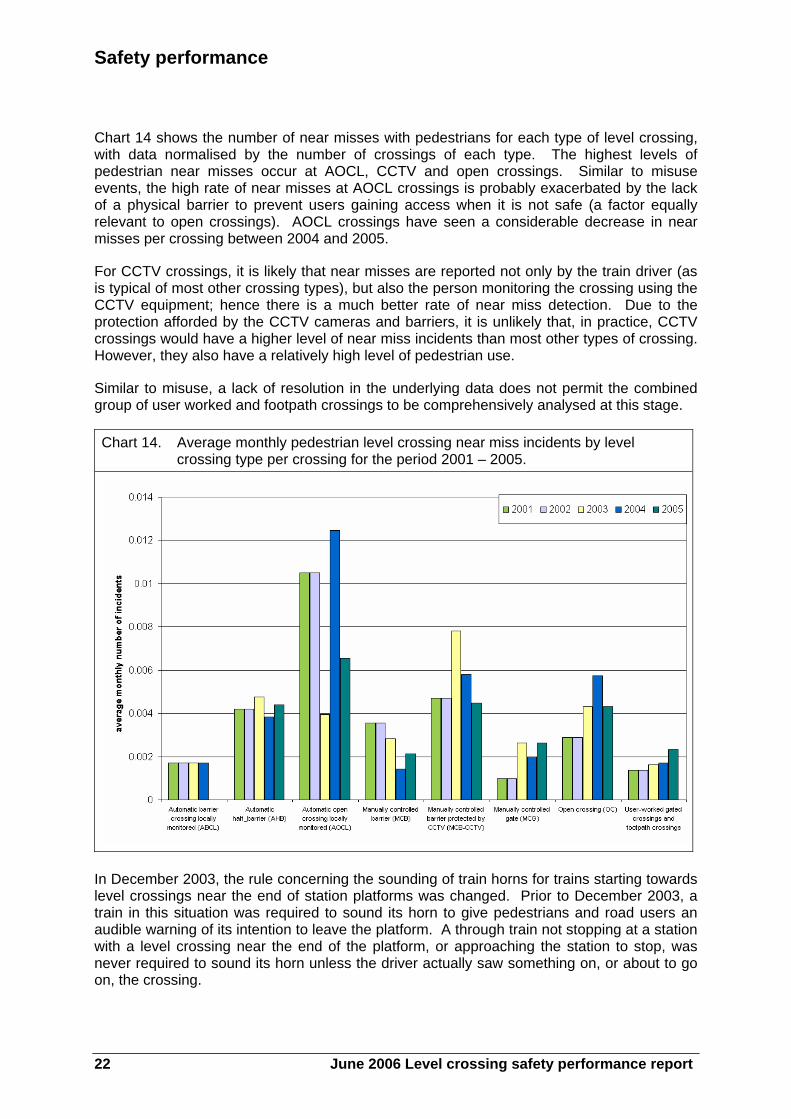
Safety performance Chart 14 shows the number of near misses with pedestrians for each type of level crossing, with data normalised by the number of crossings of each type. The highest levels of pedestrian near misses occur at AOCL, CCTV and open crossings. Similar to misuse events, the high rate of near misses at AOCL crossings is probably exacerbated by the lack of a physical barrier to prevent users gaining access when it is not safe (a factor equally relevant to open crossings). AOCL crossings have seen a considerable decrease in near misses per crossing between 2004 and 2005.
For CCTV crossings, it is likely that near misses are reported not only by the train driver (as is typical of most other crossing types), but also the person monitoring the crossing using the CCTV equipment; hence there is a much better rate of near miss detection. Due to the protection afforded by the CCTV cameras and barriers, it is unlikely that, in practice, CCTV crossings would have a higher level of near miss incidents than most other types of crossing. However, they also have a relatively high level of pedestrian use.
Similar to misuse, a lack of resolution in the underlying data does not permit the combined group of user worked and footpath crossings to be comprehensively analysed at this stage.
Chart 14. Average monthly pedestrian level crossing near miss incidents by level crossing type per crossing for the period 2001 – 2005.
In December 2003, the rule concerning the sounding of train horns for trains starting towards level crossings near the end of station platforms was changed. Prior to December 2003, a train in this situation was required to sound its horn to give pedestrians and road users an audible warning of its intention to leave the platform. A through train not stopping at a station with a level crossing near the end of the platform, or approaching the station to stop, was never required to sound its horn unless the driver actually saw something on, or about to go on, the crossing.
22 June 2006 Level crossing safety performance report
Safety performance
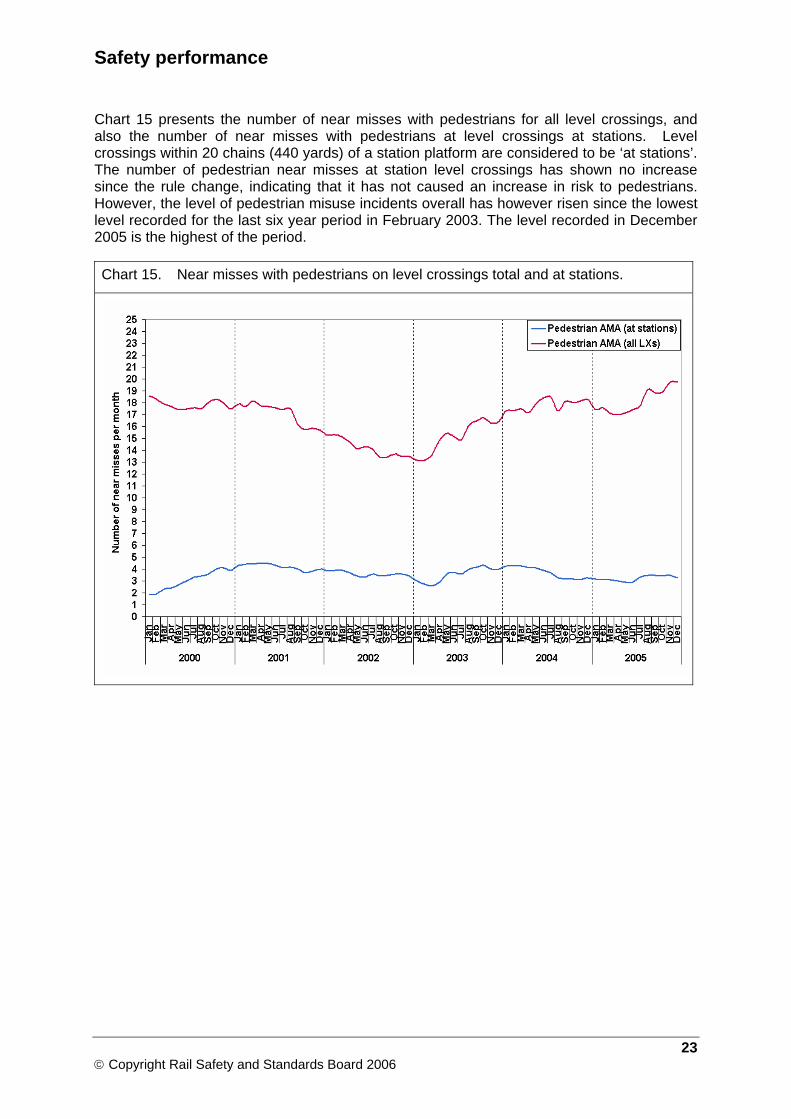
Chart 15 presents the number of near misses with pedestrians for all level crossings, and also the number of near misses with pedestrians at level crossings at stations. Level crossings within 20 chains (440 yards) of a station platform are considered to be ‘at stations’. The number of pedestrian near misses at station level crossings has shown no increase since the rule change, indicating that it has not caused an increase in risk to pedestrians. However, the level of pedestrian misuse incidents overall has however risen since the lowest level recorded for the last six year period in February 2003. The level recorded in December 2005 is the highest of the period.
Chart 15. Near misses with pedestrians on level crossings total and at stations.
23 © Copyright Rail Safety and Standards Board 2006
Safety performance
4.4 Accidents involving road vehicles at level crossings The following sections characterise the risk from road vehicles being struck at level crossings based upon an analysis of SMIS data. As with the assessment of the risk to pedestrians, information is presented on precursors, accidents, injuries and fatalities. Information is also provided on annual trends and seasonal variation. Unlike incidents involving pedestrians, road vehicle accidents at level crossing have potentially much higher consequences, due to the possibility of derailing a train and injuring its occupants.
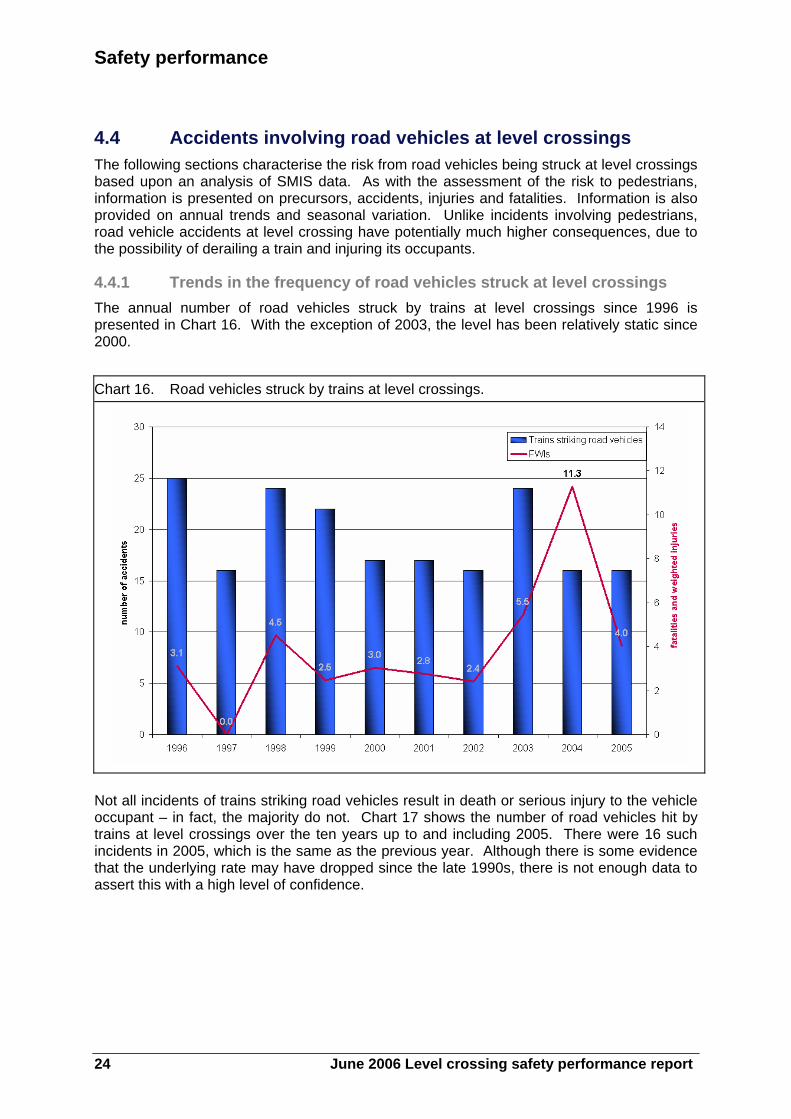
4.4.1 Trends in the frequency of road vehicles struck at level crossings The annual number of road vehicles struck by trains at level crossings since 1996 is presented in Chart 16. With the exception of 2003, the level has been relatively static since 2000.
Chart 16. Road vehicles struck by trains at level crossings.
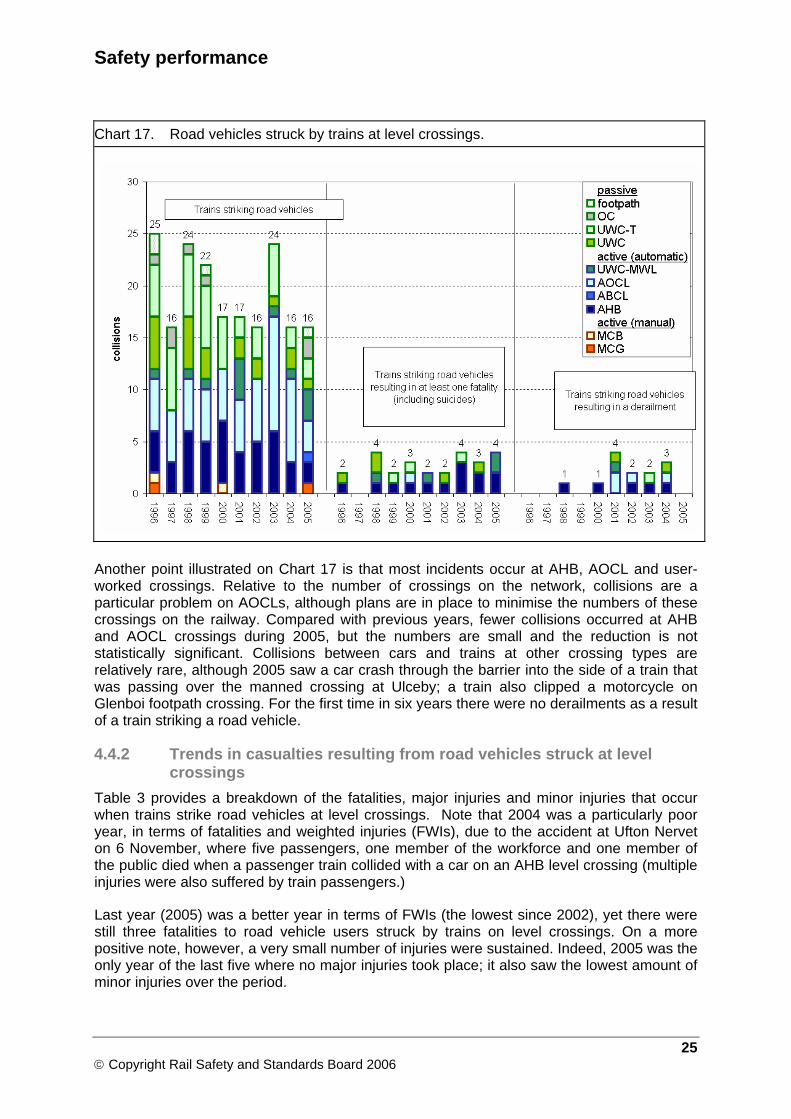
Not all incidents of trains striking road vehicles result in death or serious injury to the vehicle occupant – in fact, the majority do not. Chart 17 shows the number of road vehicles hit by trains at level crossings over the ten years up to and including 2005. There were 16 such incidents in 2005, which is the same as the previous year. Although there is some evidence that the underlying rate may have dropped since the late 1990s, there is not enough data to assert this with a high level of confidence.
24 June 2006 Level crossing safety performance report
Safety performance
Chart 17. Road vehicles struck by trains at level crossings.
Another point illustrated on Chart 17 is that most incidents occur at AHB, AOCL and user-worked crossings. Relative to the number of crossings on the network, collisions are a particular problem on AOCLs, although plans are in place to minimise the numbers of these crossings on the railway. Compared with previous years, fewer collisions occurred at AHB and AOCL crossings during 2005, but the numbers are small and the reduction is not statistically significant. Collisions between cars and trains at other crossing types are relatively rare, although 2005 saw a car crash through the barrier into the side of a train that was passing over the manned crossing at Ulceby; a train also clipped a motorcycle on Glenboi footpath crossing. For the first time in six years there were no derailments as a result of a train striking a road vehicle.
4.4.2 Trends in casualties resulting from road vehicles struck at level crossings
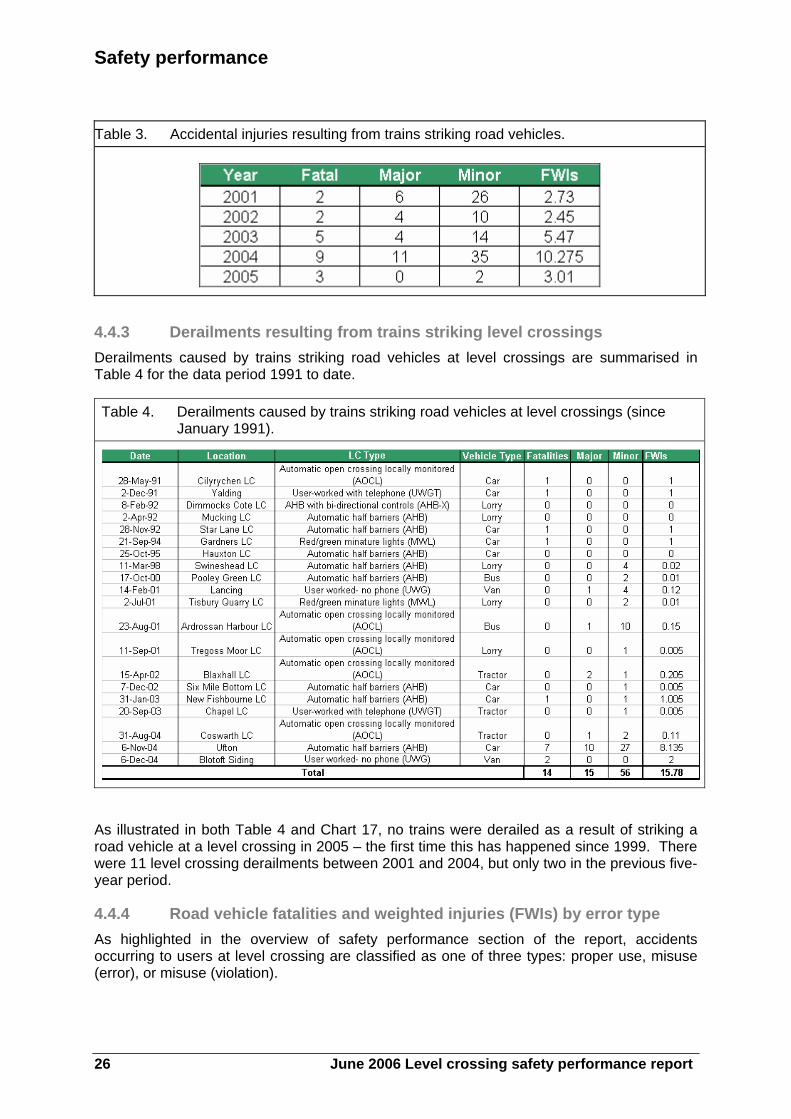
Table 3 provides a breakdown of the fatalities, major injuries and minor injuries that occur when trains strike road vehicles at level crossings. Note that 2004 was a particularly poor year, in terms of fatalities and weighted injuries (FWIs), due to the accident at Ufton Nervet on 6 November, where five passengers, one member of the workforce and one member of the public died when a passenger train collided with a car on an AHB level crossing (multiple injuries were also suffered by train passengers.)
Last year (2005) was a better year in terms of FWIs (the lowest since 2002), yet there were still three fatalities to road vehicle users struck by trains on level crossings. On a more positive note, however, a very small number of injuries were sustained. Indeed, 2005 was the only year of the last five where no major injuries took place; it also saw the lowest amount of minor injuries over the period.
25 © Copyright Rail Safety and Standards Board 2006
Safety performance
Table 3. Accidental injuries resulting from trains striking road vehicles.
4.4.3 Derailments resulting from trains striking level crossings Derailments caused by trains striking road vehicles at level crossings are summarised in Table 4 for the data period 1991 to date.
Table 4. Derailments caused by trains striking road vehicles at level crossings (since January 1991).
As illustrated in both Table 4 and Chart 17, no trains were derailed as a result of striking a road vehicle at a level crossing in 2005 – the first time this has happened since 1999. There were 11 level crossing derailments between 2001 and 2004, but only two in the previous five-year period.
4.4.4 Road vehicle fatalities and weighted injuries (FWIs) by error type As highlighted in the overview of safety performance section of the report, accidents occurring to users at level crossing are classified as one of three types: proper use, misuse (error), or misuse (violation).
26 June 2006 Level crossing safety performance report
Safety performance
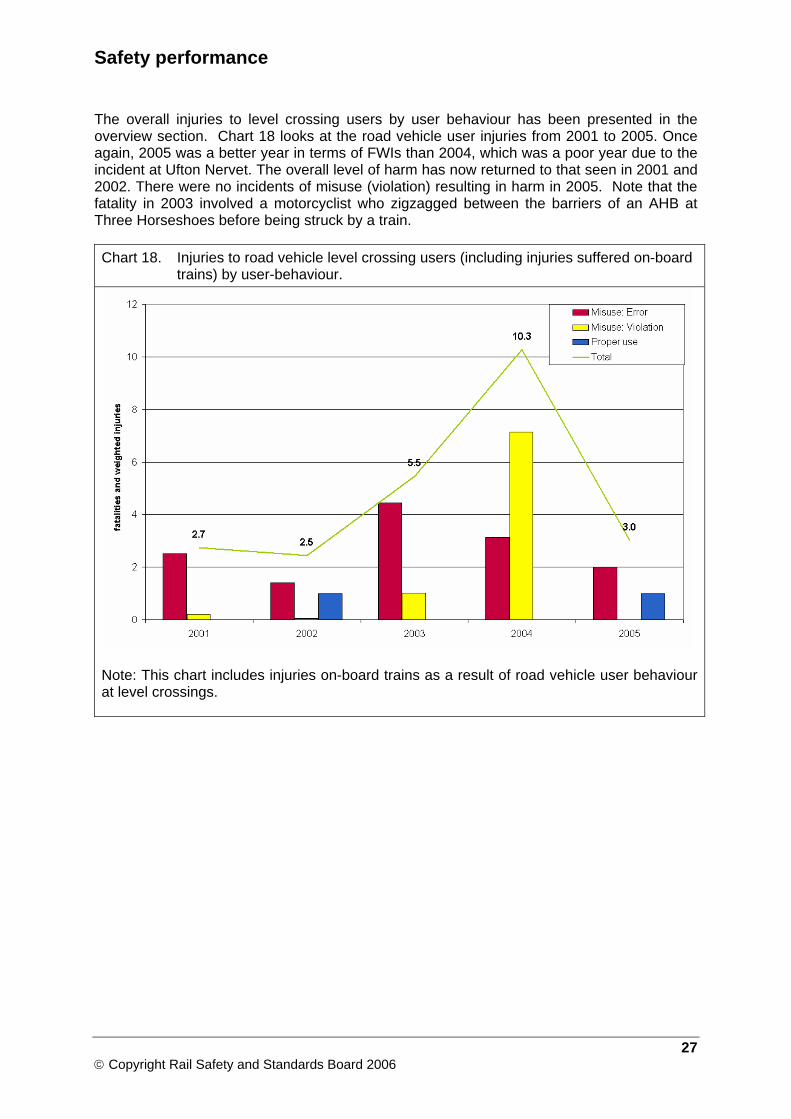
The overall injuries to level crossing users by user behaviour has been presented in the overview section. Chart 18 looks at the road vehicle user injuries from 2001 to 2005. Once again, 2005 was a better year in terms of FWIs than 2004, which was a poor year due to the incident at Ufton Nervet. The overall level of harm has now returned to that seen in 2001 and 2002. There were no incidents of misuse (violation) resulting in harm in 2005. Note that the fatality in 2003 involved a motorcyclist who zigzagged between the barriers of an AHB at Three Horseshoes before being struck by a train.
Chart 18. Injuries to road vehicle level crossing users (including injuries suffered on-board trains) by user-behaviour.
Note: This chart includes injuries on-board trains as a result of road vehicle user behaviour at level crossings.
27 © Copyright Rail Safety and Standards Board 2006
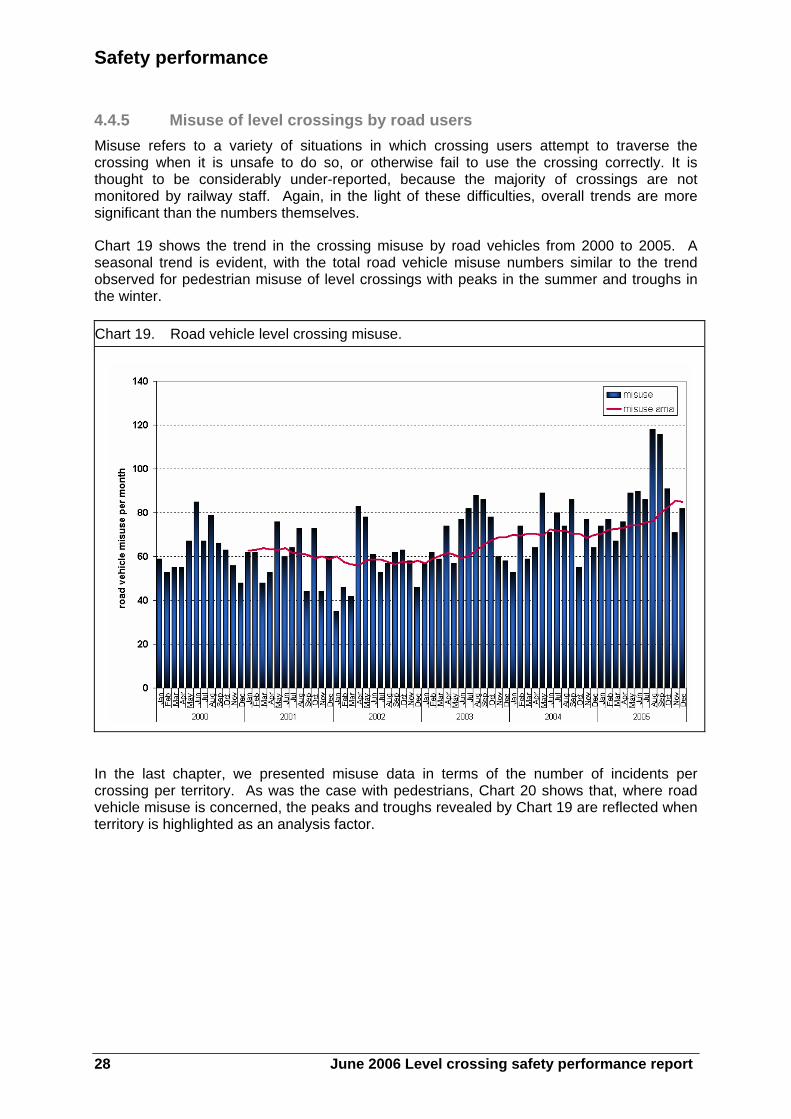
Safety performance 4.4.5 Misuse of level crossings by road users Misuse refers to a variety of situations in which crossing users attempt to traverse the crossing when it is unsafe to do so, or otherwise fail to use the crossing correctly. It is thought to be considerably under-reported, because the majority of crossings are not monitored by railway staff. Again, in the light of these difficulties, overall trends are more significant than the numbers themselves.
Chart 19 shows the trend in the crossing misuse by road vehicles from 2000 to 2005. A seasonal trend is evident, with the total road vehicle misuse numbers similar to the trend observed for pedestrian misuse of level crossings with peaks in the summer and troughs in the winter.
Chart 19. Road vehicle level crossing misuse.
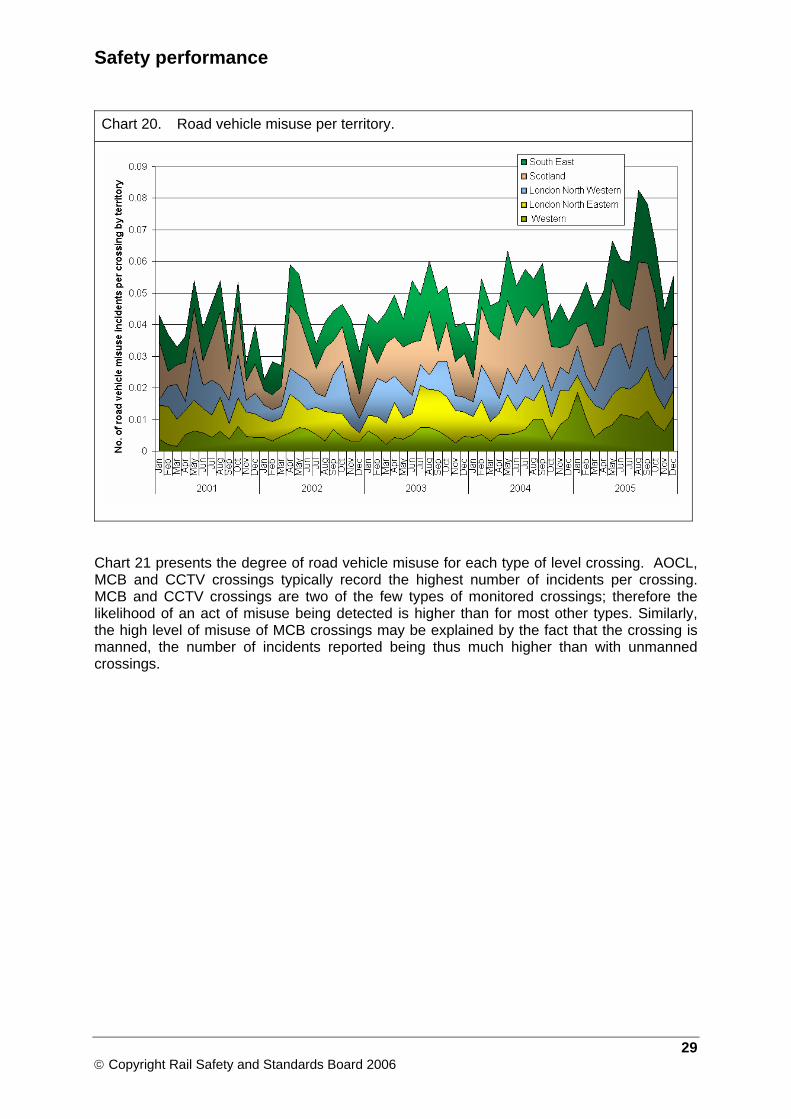
In the last chapter, we presented misuse data in terms of the number of incidents per crossing per territory. As was the case with pedestrians, Chart 20 shows that, where road vehicle misuse is concerned, the peaks and troughs revealed by Chart 19 are reflected when territory is highlighted as an analysis factor.
28 June 2006 Level crossing safety performance report
Safety performance
Chart 20. Road vehicle misuse per territory.
Chart 21 presents the degree of road vehicle misuse for each type of level crossing. AOCL, MCB and CCTV crossings typically record the highest number of incidents per crossing. MCB and CCTV crossings are two of the few types of monitored crossings; therefore the likelihood of an act of misuse being detected is higher than for most other types. Similarly, the high level of misuse of MCB crossings may be explained by the fact that the crossing is manned, the number of incidents reported being thus much higher than with unmanned crossings.
29 © Copyright Rail Safety and Standards Board 2006
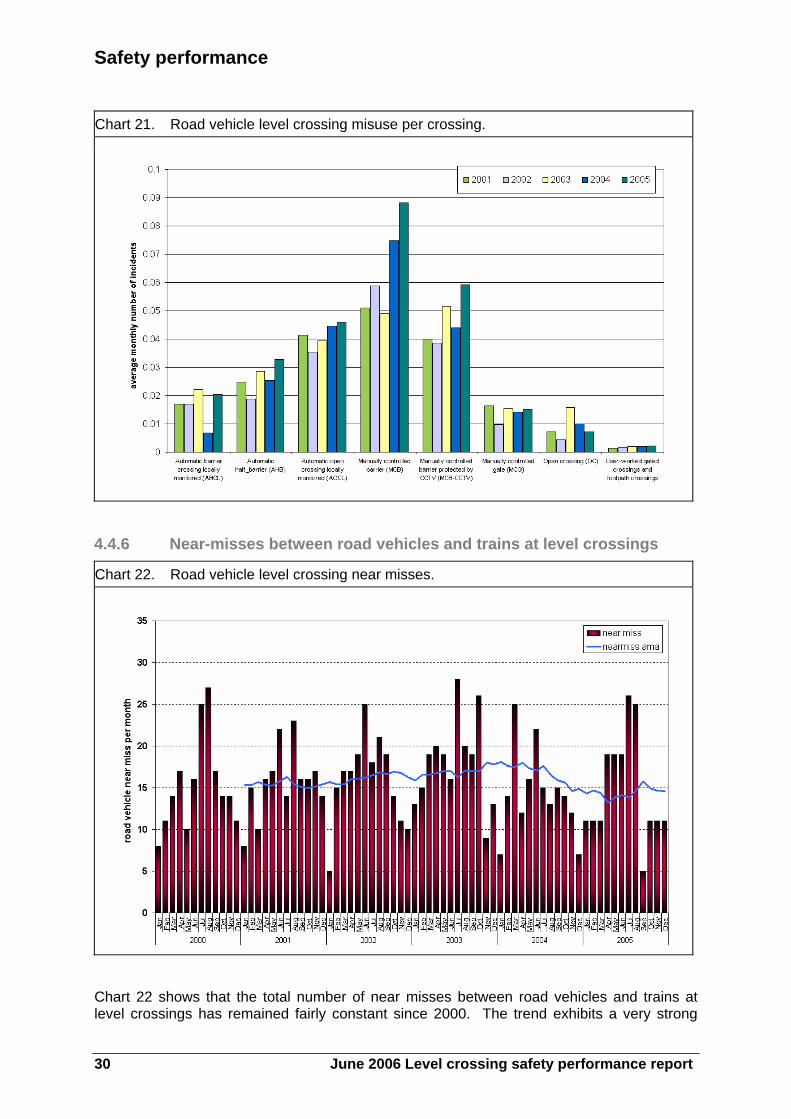
Safety performance Chart 21. Road vehicle level crossing misuse per crossing.
4.4.6 Near-misses between road vehicles and trains at level crossings
Chart 22. Road vehicle level crossing near misses.
Chart 22 shows that the total number of near misses between road vehicles and trains at level crossings has remained fairly constant since 2000. The trend exhibits a very strong
30 June 2006 Level crossing safety performance report
Safety performance
seasonal pattern, with peaks in the summer and troughs in the winter. The peaks recorded in the summer months since 2000 have been very consistent, although it is quite evident that more near misses were recorded in summer 2005, compared to summer 2004. The period June – August showed a 37% increase of these incidents in 2005.
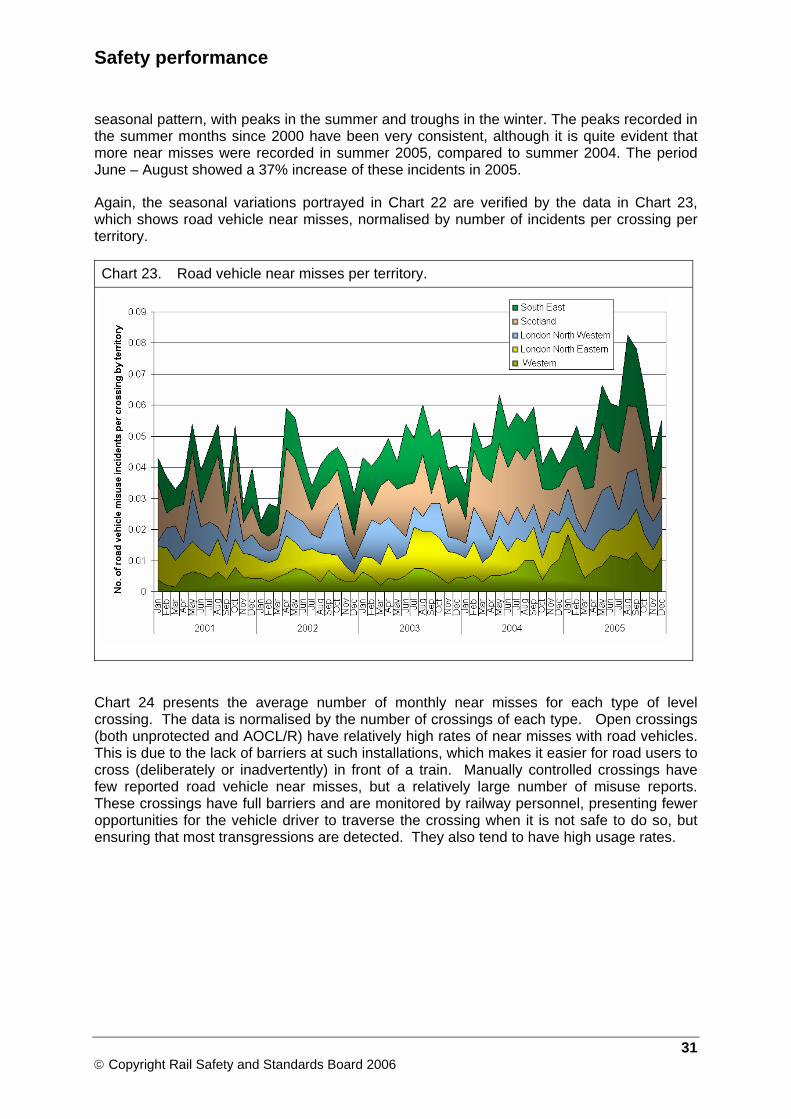
Again, the seasonal variations portrayed in Chart 22 are verified by the data in Chart 23, which shows road vehicle near misses, normalised by number of incidents per crossing per territory.
Chart 23. Road vehicle near misses per territory.
Chart 24 presents the average number of monthly near misses for each type of level crossing. The data is normalised by the number of crossings of each type. Open crossings (both unprotected and AOCL/R) have relatively high rates of near misses with road vehicles. This is due to the lack of barriers at such installations, which makes it easier for road users to cross (deliberately or inadvertently) in front of a train. Manually controlled crossings have few reported road vehicle near misses, but a relatively large number of misuse reports. These crossings have full barriers and are monitored by railway personnel, presenting fewer opportunities for the vehicle driver to traverse the crossing when it is not safe to do so, but ensuring that most transgressions are detected. They also tend to have high usage rates.
31 © Copyright Rail Safety and Standards Board 2006
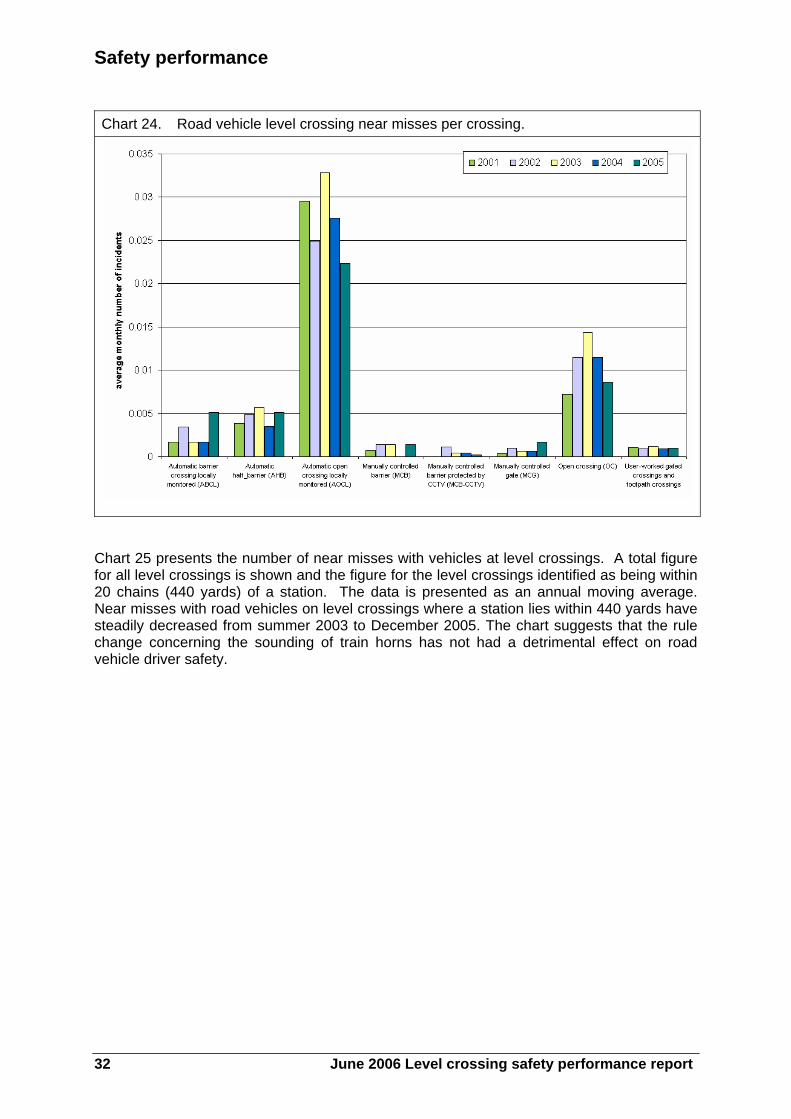
Safety performance Chart 24. Road vehicle level crossing near misses per crossing.
Chart 25 presents the number of near misses with vehicles at level crossings. A total figure for all level crossings is shown and the figure for the level crossings identified as being within 20 chains (440 yards) of a station. The data is presented as an annual moving average. Near misses with road vehicles on level crossings where a station lies within 440 yards have steadily decreased from summer 2003 to December 2005. The chart suggests that the rule change concerning the sounding of train horns has not had a detrimental effect on road vehicle driver safety.
32 June 2006 Level crossing safety performance report

Safety performance
Chart 25. Road vehicle near misses on level crossings at stations.
The relationship between near misses and collisions at level crossings is shown in Chart 26. The blue line represents an annual moving average ratio of near misses to collisions since 2000. At the end of December 2005, the rate stood at approximately one collision for every 11 reported near misses. The chart indicates that the best performance was observed in August 2000, when the rate stood at 17 near misses per collision. The worst performance was observed in June 2003, when the rate stood at only seven near misses per collision. The current rate is below the longer-term average since 1998.
33 © Copyright Rail Safety and Standards Board 2006
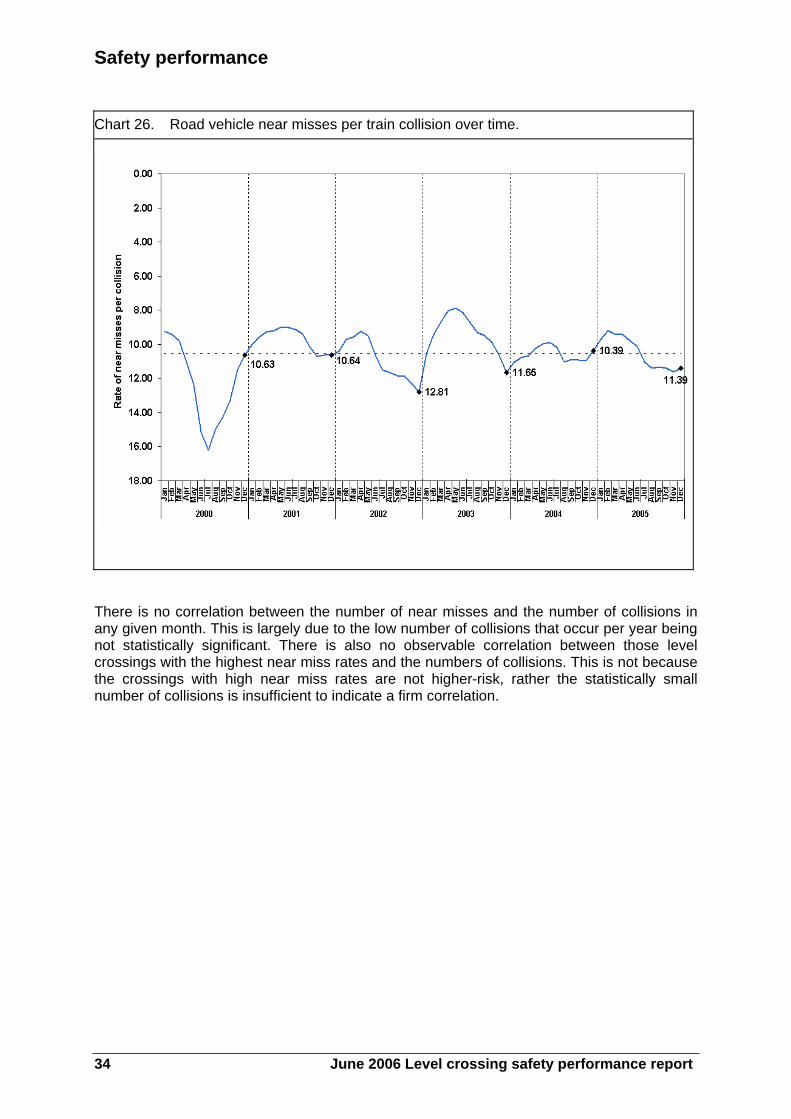
Safety performance Chart 26. Road vehicle near misses per train collision over time.
There is no correlation between the number of near misses and the number of collisions in any given month. This is largely due to the low number of collisions that occur per year being not statistically significant. There is also no observable correlation between those level crossings with the highest near miss rates and the numbers of collisions. This is not because the crossings with high near miss rates are not higher-risk, rather the statistically small number of collisions is insufficient to indicate a firm correlation.
34 June 2006 Level crossing safety performance report

Safety performance
4.5 Level crossing equipment failures This section of the report provides details of reportable level crossing failures. These are defined as:
‘Failures of the equipment at a level crossing which could endanger users of the road or path crossing the railway are reportable and include “wrong-side” failures of equipment (where equipment fails to a dangerous condition) whether or not any train or crossing user is involved at the time of failure.’
Equipment failure is only a very small contribution (4%) to level crossing risk as user behaviour (misuse) dominates the risk profile.
Chart 27 shows that there was a significant decline in reportable level crossing failures between 2000 and 2004. After a plateau in performance in 2004, 2005 has seen a marked increase in the reportable level crossing failures trend.
Most of the apparent reduction in equipment failures during the early part of the decade may be attributed to the South East territory, which submitted around 65% of all RIDDOR-reportable failures in 2001. Similarly, the increase observed from May 2005 is largely the result of a sharp increase in reports from London North East (LNE) territory, which was responsible for around 50% of all reports during 2005, and an upturn in reports from the South East (SE) territory. This coincides with Network Rail issuing new guidance on the reporting of level crossing equipment failures, which suggests that the apparent increase is the result of changes to reporting rather than a deterioration of level crossing equipment.
Chart 27. Reportable level crossing failures.
35 © Copyright Rail Safety and Standards Board 2006
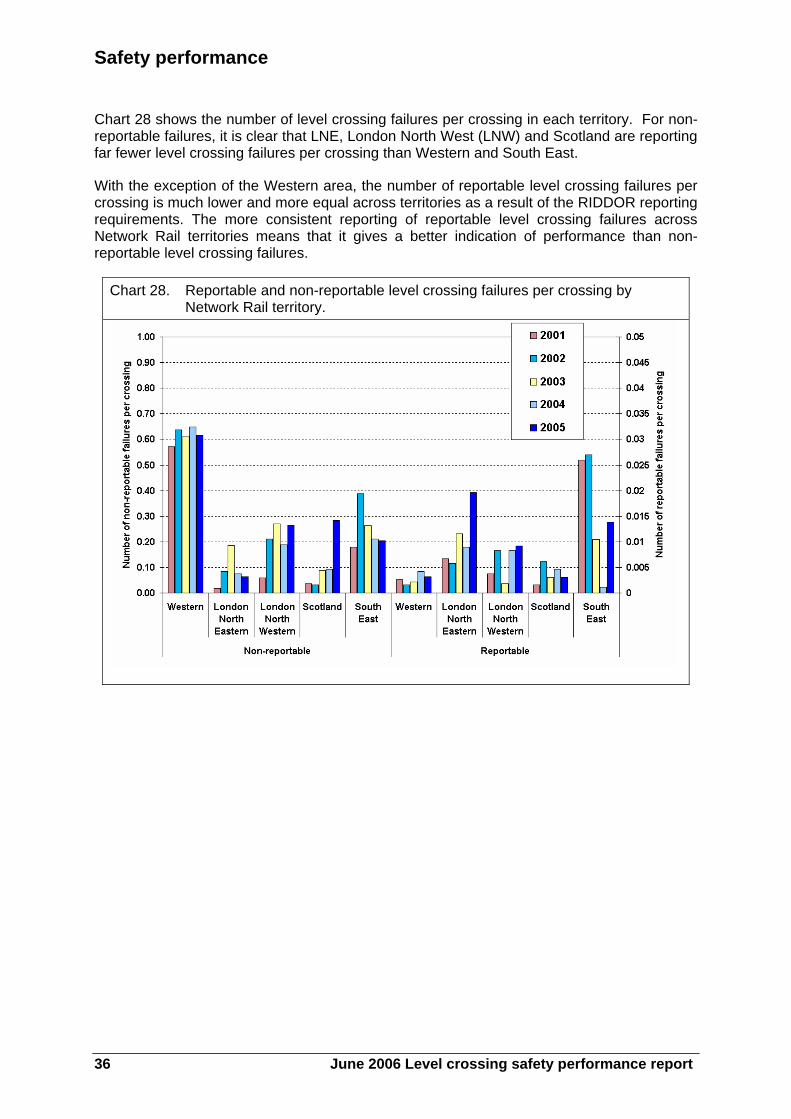
Safety performance Chart 28 shows the number of level crossing failures per crossing in each territory. For non-reportable failures, it is clear that LNE, London North West (LNW) and Scotland are reporting far fewer level crossing failures per crossing than Western and South East.
With the exception of the Western area, the number of reportable level crossing failures per crossing is much lower and more equal across territories as a result of the RIDDOR reporting requirements. The more consistent reporting of reportable level crossing failures across Network Rail territories means that it gives a better indication of performance than non-reportable level crossing failures.
Chart 28. Reportable and non-reportable level crossing failures per crossing by Network Rail territory.
36 June 2006 Level crossing safety performance report
Safety performance
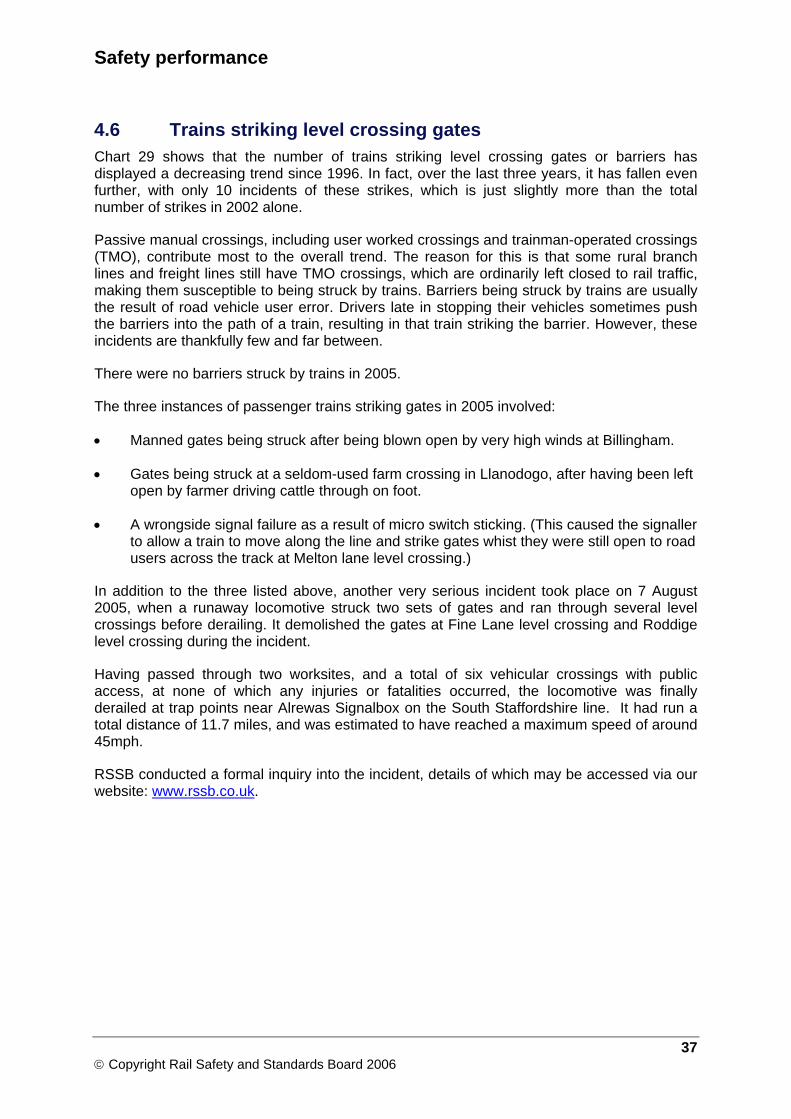
4.6 Trains striking level crossing gates Chart 29 shows that the number of trains striking level crossing gates or barriers has displayed a decreasing trend since 1996. In fact, over the last three years, it has fallen even further, with only 10 incidents of these strikes, which is just slightly more than the total number of strikes in 2002 alone.
Passive manual crossings, including user worked crossings and trainman-operated crossings (TMO), contribute most to the overall trend. The reason for this is that some rural branch lines and freight lines still have TMO crossings, which are ordinarily left closed to rail traffic, making them susceptible to being struck by trains. Barriers being struck by trains are usually the result of road vehicle user error. Drivers late in stopping their vehicles sometimes push the barriers into the path of a train, resulting in that train striking the barrier. However, these incidents are thankfully few and far between.
There were no barriers struck by trains in 2005.
The three instances of passenger trains striking gates in 2005 involved:
• Manned gates being struck after being blown open by very high winds at Billingham.
• Gates being struck at a seldom-used farm crossing in Llanodogo, after having been left open by farmer driving cattle through on foot.
• A wrongside signal failure as a result of micro switch sticking. (This caused the signaller to allow a train to move along the line and strike gates whist they were still open to road users across the track at Melton lane level crossing.)
In addition to the three listed above, another very serious incident took place on 7 August 2005, when a runaway locomotive struck two sets of gates and ran through several level crossings before derailing. It demolished the gates at Fine Lane level crossing and Roddige level crossing during the incident.
Having passed through two worksites, and a total of six vehicular crossings with public access, at none of which any injuries or fatalities occurred, the locomotive was finally derailed at trap points near Alrewas Signalbox on the South Staffordshire line. It had run a total distance of 11.7 miles, and was estimated to have reached a maximum speed of around 45mph.
RSSB conducted a formal inquiry into the incident, details of which may be accessed via our website: www.rssb.co.uk.
37 © Copyright Rail Safety and Standards Board 2006
Safety performance
Chart 29. Level crossing gates or barriers struck by trains.
38 June 2006 Level crossing safety performance report
Safety performance
4.7 Category A SPADs at level crossings If a train passes a signal at danger without authority (ie has a category A SPAD) where the signal concerned protects a level crossing, then the train might run onto the level crossing without the crossing offering the normal protection or warning to the road user. The potential consequences of SPADs is more likely to be serious if the level crossing is situated near to the signal (eg within the overlap) and is open to road traffic and/or pedestrians at the time.
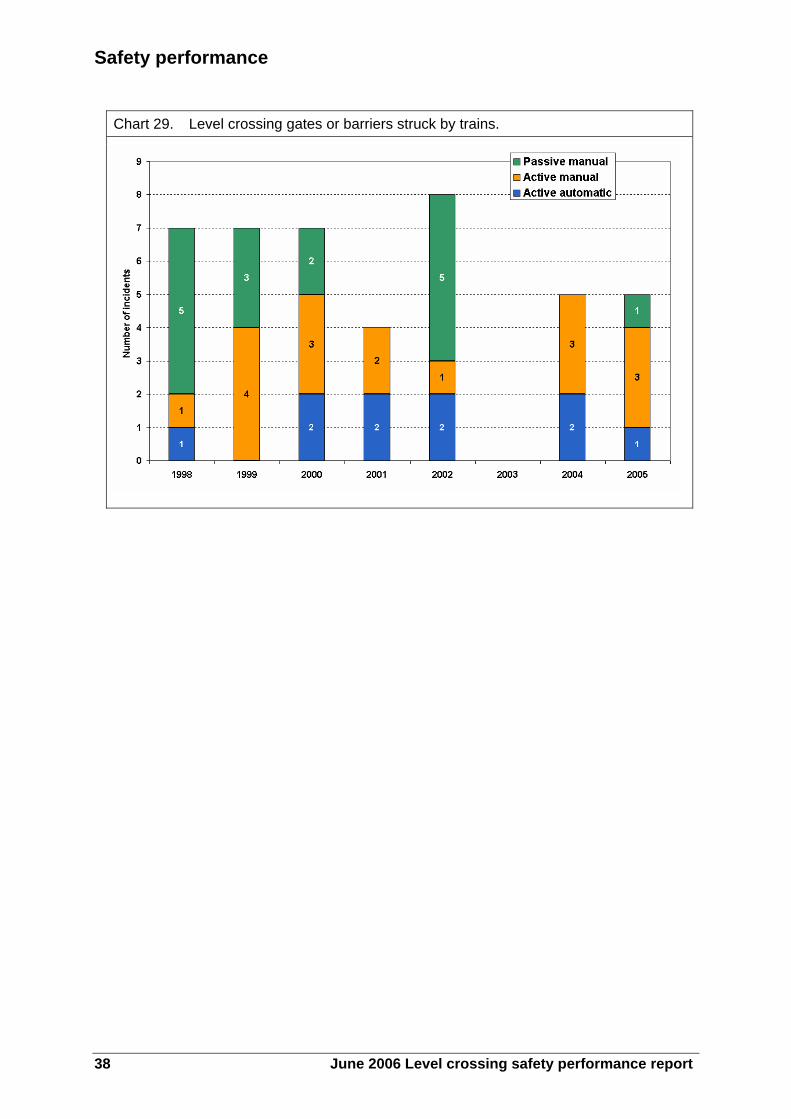
Chart 30 shows the annual number of category A SPADs, as well as the number of these incidents resulting in a train running onto a level crossing irregularly. The annual total number of SPADs is plotted against the right-hand side axis, whereas the numbers of those that resulted in a level crossing incursion are plotted against the left-hand side axis.
Chart 30. Category A SPADs with level crossing incursions.
During the five-year period 2001-2005, there have been 21 category A SPADs involving a level crossing incursion. Chart 31 shows these SPADs broken down by type of level crossing involved. This chart shows that there have been more incursions at MCB level crossings than at any other type, MCBs accounting for 42% of the 21 incidents in the period.
The types of crossing are:
MG – Manually operated gates.
MCB – Manually controlled barriers.
CCTV – Manually controlled barriers, operated remotely with the aid of closed-circuit television.
AHB – Automatic half-barriers.
39 © Copyright Rail Safety and Standards Board 2006
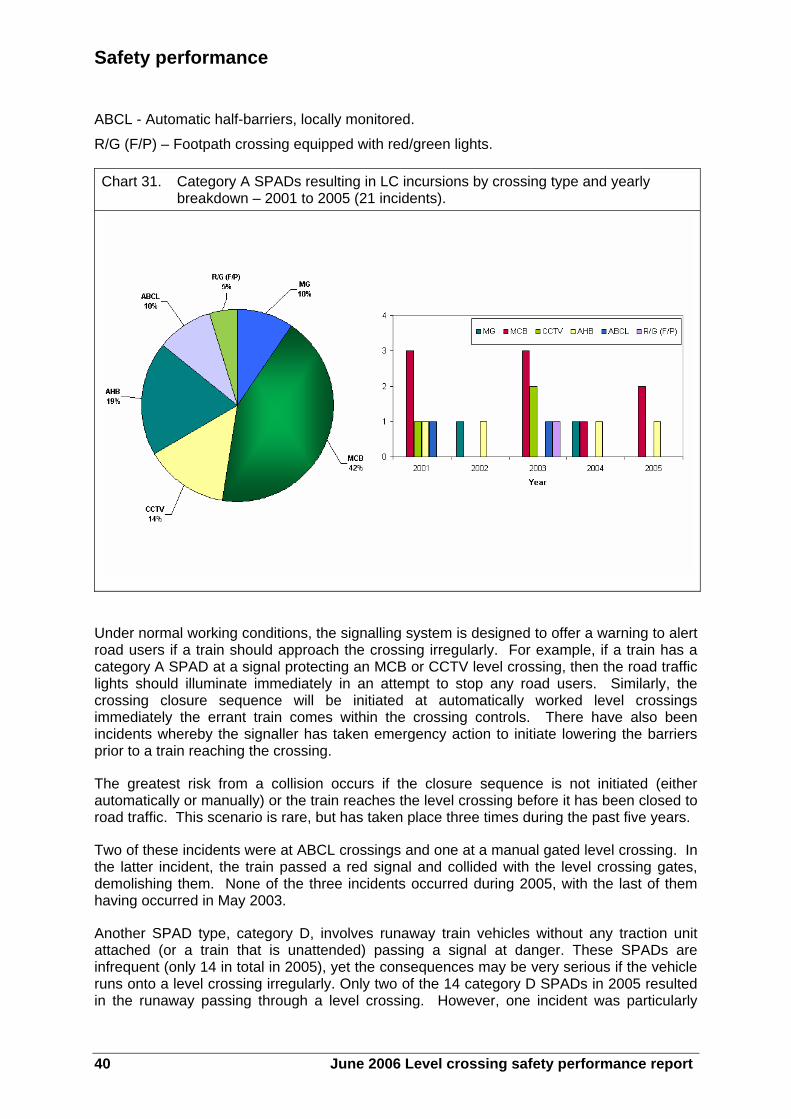
Safety performance ABCL - Automatic half-barriers, locally monitored.
R/G (F/P) – Footpath crossing equipped with red/green lights.
Chart 31. Category A SPADs resulting in LC incursions by crossing type and yearly breakdown – 2001 to 2005 (21 incidents).
Under normal working conditions, the signalling system is designed to offer a warning to alert road users if a train should approach the crossing irregularly. For example, if a train has a category A SPAD at a signal protecting an MCB or CCTV level crossing, then the road traffic lights should illuminate immediately in an attempt to stop any road users. Similarly, the crossing closure sequence will be initiated at automatically worked level crossings immediately the errant train comes within the crossing controls. There have also been incidents whereby the signaller has taken emergency action to initiate lowering the barriers prior to a train reaching the crossing.
The greatest risk from a collision occurs if the closure sequence is not initiated (either automatically or manually) or the train reaches the level crossing before it has been closed to road traffic. This scenario is rare, but has taken place three times during the past five years.
Two of these incidents were at ABCL crossings and one at a manual gated level crossing. In the latter incident, the train passed a red signal and collided with the level crossing gates, demolishing them. None of the three incidents occurred during 2005, with the last of them having occurred in May 2003.
Another SPAD type, category D, involves runaway train vehicles without any traction unit attached (or a train that is unattended) passing a signal at danger. These SPADs are infrequent (only 14 in total in 2005), yet the consequences may be very serious if the vehicle runs onto a level crossing irregularly. Only two of the 14 category D SPADs in 2005 resulted in the runaway passing through a level crossing. However, one incident was particularly
40 June 2006 Level crossing safety performance report
Safety performance
serious and may have resulted in worse consequences had circumstances been different.. A locomotive, which had been stabled on a line that was under an engineer’s absolute possession, ran away in the wrong direction on a falling gradient. It travelled 11¾ miles, passing a number of engineers’ marker boards and one possession limit board. The locomotive also passed over six vehicular crossings with public access, demolishing two sets of level crossing gates before coming to rest when it was derailed by trap points. For further details, see section 4.6.
41 © Copyright Rail Safety and Standards Board 2006
Risk profile 5 Risk profile The risk profile for level crossings has been derived from version 4 of the safety risk model (SRM). The SRM is based on the quantification of the risk resulting from hazardous events occurring on the mainline railway that have the potential to lead to fatalities, major injuries or minor injuries to passengers, staff or members of the public (MOPs).
The hazardous events, which form the basis of the risk profile for level crossings are as follows:
• HET-10 Passenger train collision with road vehicle on level crossing.
• HET-11 Non-passenger train collision with road vehicle on level crossing.
• HEM-27 MOP pedestrian struck/crushed by train on level crossing.
• HEM-28 MOP pedestrian struck/crushed by train on footpath crossing.
• HEN-44 MOP struck/trapped by level crossing equipment.
• HEN-46 MOP slip, trip or fall on level crossing.
• HEN-47 MOP slip, trip or fall on footpath crossing.
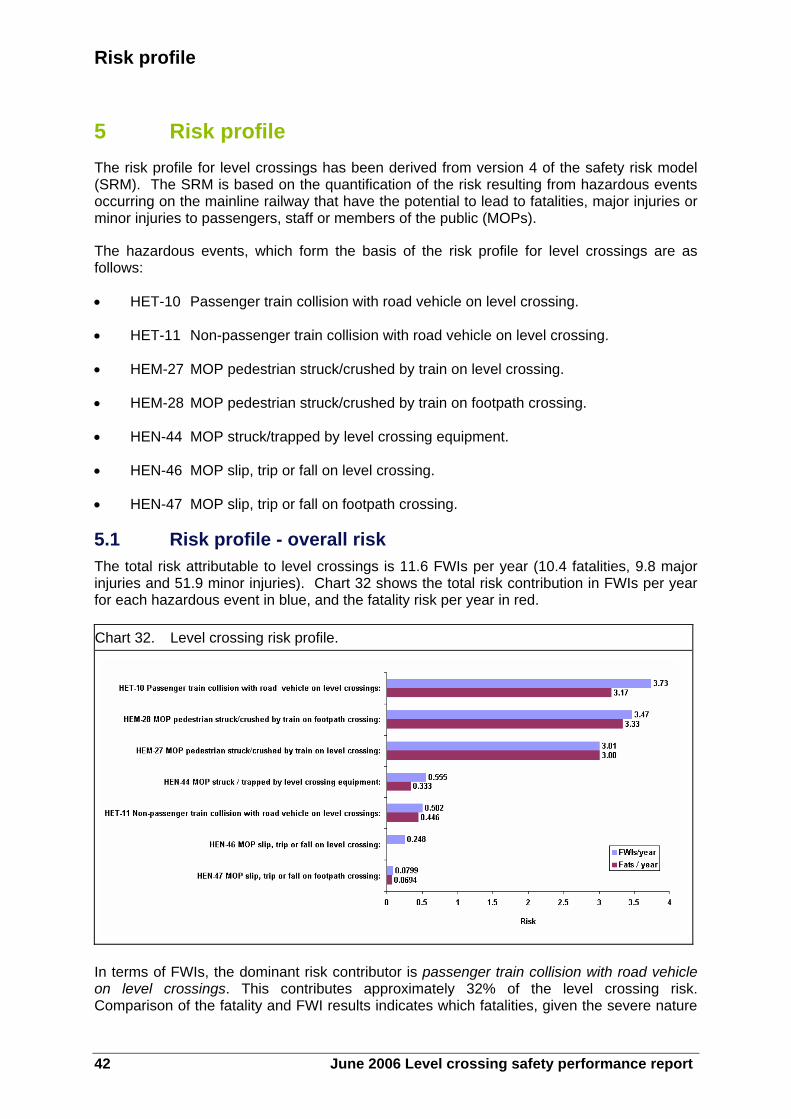
5.1 Risk profile - overall risk The total risk attributable to level crossings is 11.6 FWIs per year (10.4 fatalities, 9.8 major injuries and 51.9 minor injuries). Chart 32 shows the total risk contribution in FWIs per year for each hazardous event in blue, and the fatality risk per year in red.
Chart 32. Level crossing risk profile.
In terms of FWIs, the dominant risk contributor is passenger train collision with road vehicle on level crossings. This contributes approximately 32% of the level crossing risk. Comparison of the fatality and FWI results indicates which fatalities, given the severe nature
42 June 2006 Level crossing safety performance report
Risk profile
of the type of accidents associated with level crossings, are the dominant component within the overall FWI profile. Major and minor injuries make a relatively small contribution at just over one FWI per year.
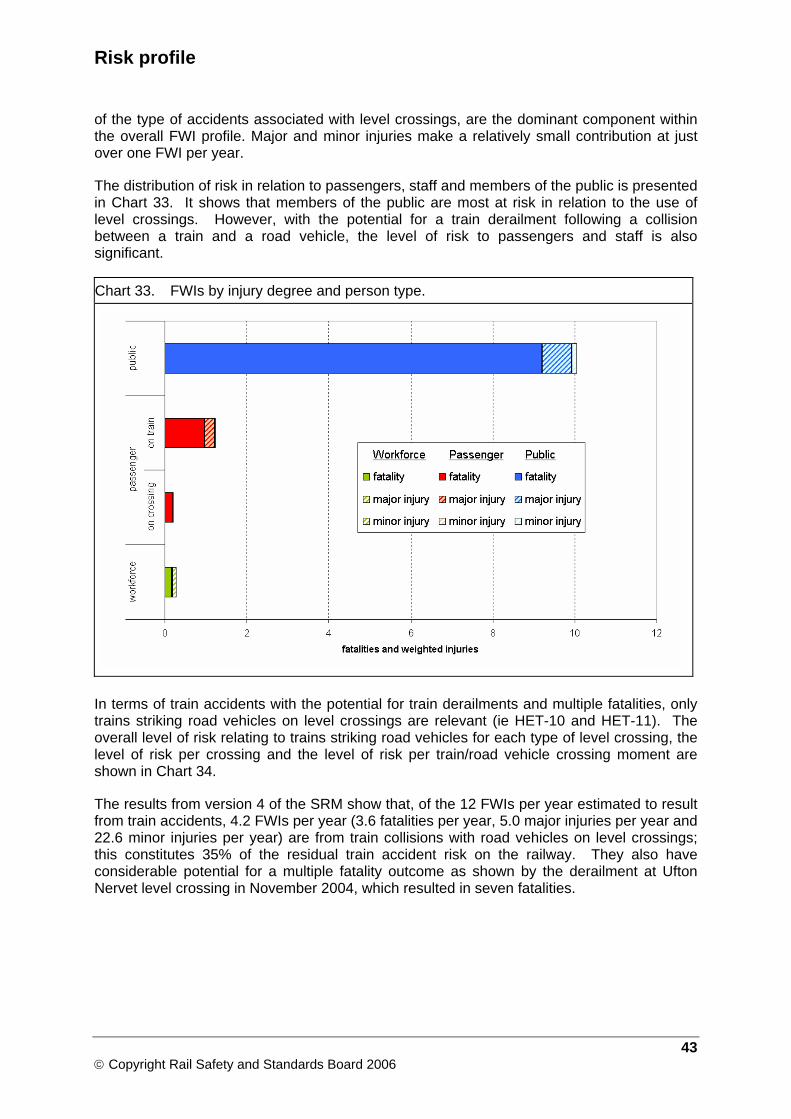
The distribution of risk in relation to passengers, staff and members of the public is presented in Chart 33. It shows that members of the public are most at risk in relation to the use of level crossings. However, with the potential for a train derailment following a collision between a train and a road vehicle, the level of risk to passengers and staff is also significant.
Chart 33. FWIs by injury degree and person type.
In terms of train accidents with the potential for train derailments and multiple fatalities, only trains striking road vehicles on level crossings are relevant (ie HET-10 and HET-11). The overall level of risk relating to trains striking road vehicles for each type of level crossing, the level of risk per crossing and the level of risk per train/road vehicle crossing moment are shown in Chart 34.
The results from version 4 of the SRM show that, of the 12 FWIs per year estimated to result from train accidents, 4.2 FWIs per year (3.6 fatalities per year, 5.0 major injuries per year and 22.6 minor injuries per year) are from train collisions with road vehicles on level crossings; this constitutes 35% of the residual train accident risk on the railway. They also have considerable potential for a multiple fatality outcome as shown by the derailment at Ufton Nervet level crossing in November 2004, which resulted in seven fatalities.
43 © Copyright Rail Safety and Standards Board 2006
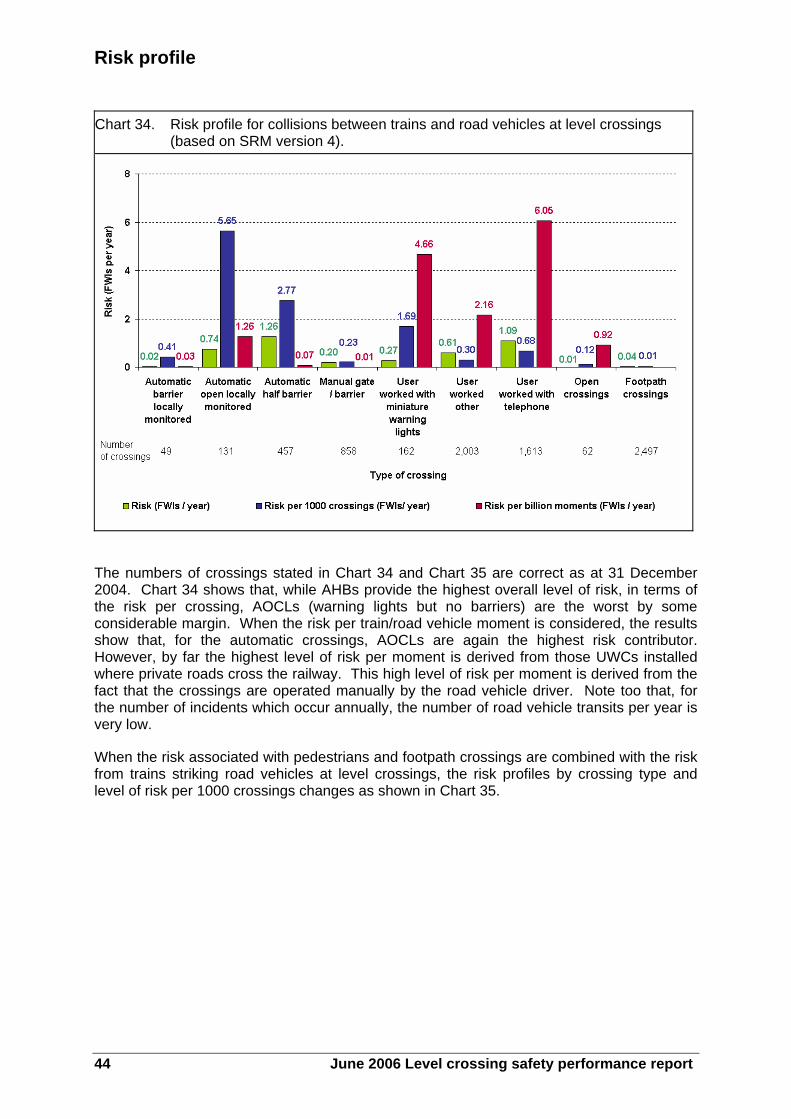
Risk profile Chart 34. Risk profile for collisions between trains and road vehicles at level crossings
(based on SRM version 4).
The numbers of crossings stated in Chart 34 and Chart 35 are correct as at 31 December 2004. Chart 34 shows that, while AHBs provide the highest overall level of risk, in terms of the risk per crossing, AOCLs (warning lights but no barriers) are the worst by some considerable margin. When the risk per train/road vehicle moment is considered, the results show that, for the automatic crossings, AOCLs are again the highest risk contributor. However, by far the highest level of risk per moment is derived from those UWCs installed where private roads cross the railway. This high level of risk per moment is derived from the fact that the crossings are operated manually by the road vehicle driver. Note too that, for the number of incidents which occur annually, the number of road vehicle transits per year is very low.
When the risk associated with pedestrians and footpath crossings are combined with the risk from trains striking road vehicles at level crossings, the risk profiles by crossing type and level of risk per 1000 crossings changes as shown in Chart 35.
44 June 2006 Level crossing safety performance report
Risk profile
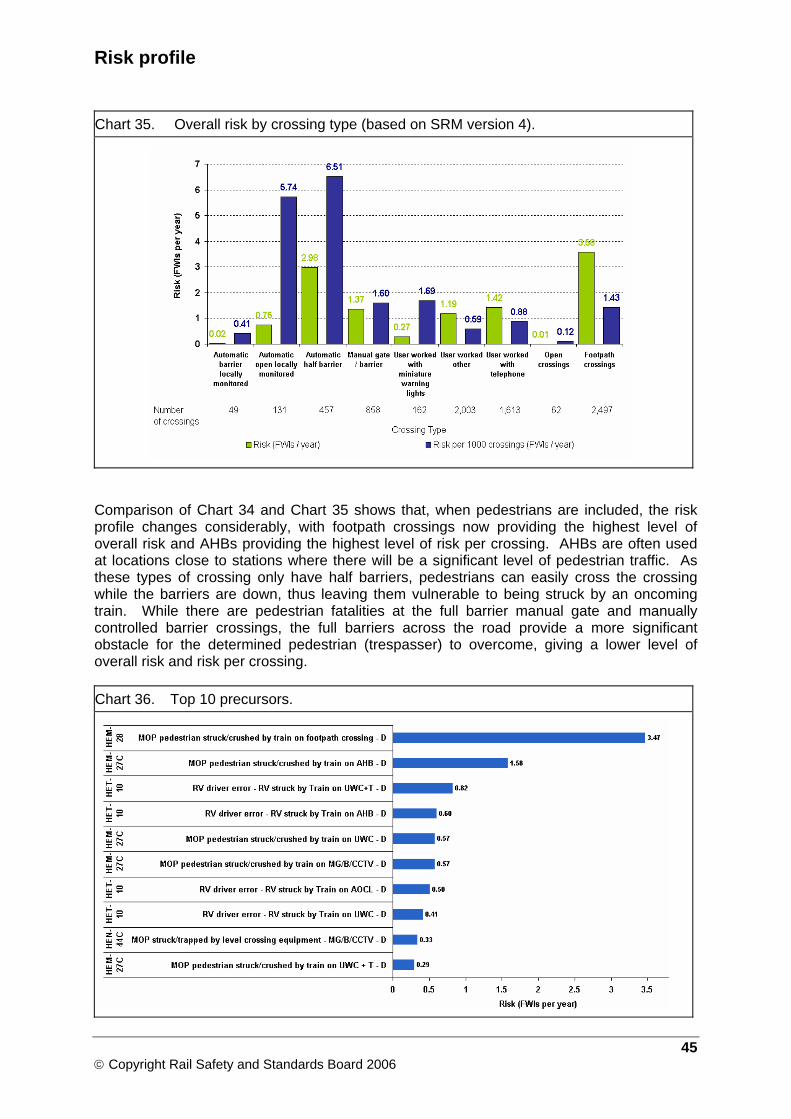
Chart 35. Overall risk by crossing type (based on SRM version 4).
Comparison of Chart 34 and Chart 35 shows that, when pedestrians are included, the risk profile changes considerably, with footpath crossings now providing the highest level of overall risk and AHBs providing the highest level of risk per crossing. AHBs are often used at locations close to stations where there will be a significant level of pedestrian traffic. As these types of crossing only have half barriers, pedestrians can easily cross the crossing while the barriers are down, thus leaving them vulnerable to being struck by an oncoming train. While there are pedestrian fatalities at the full barrier manual gate and manually controlled barrier crossings, the full barriers across the road provide a more significant obstacle for the determined pedestrian (trespasser) to overcome, giving a lower level of overall risk and risk per crossing.
Chart 36. Top 10 precursors.
45 © Copyright Rail Safety and Standards Board 2006
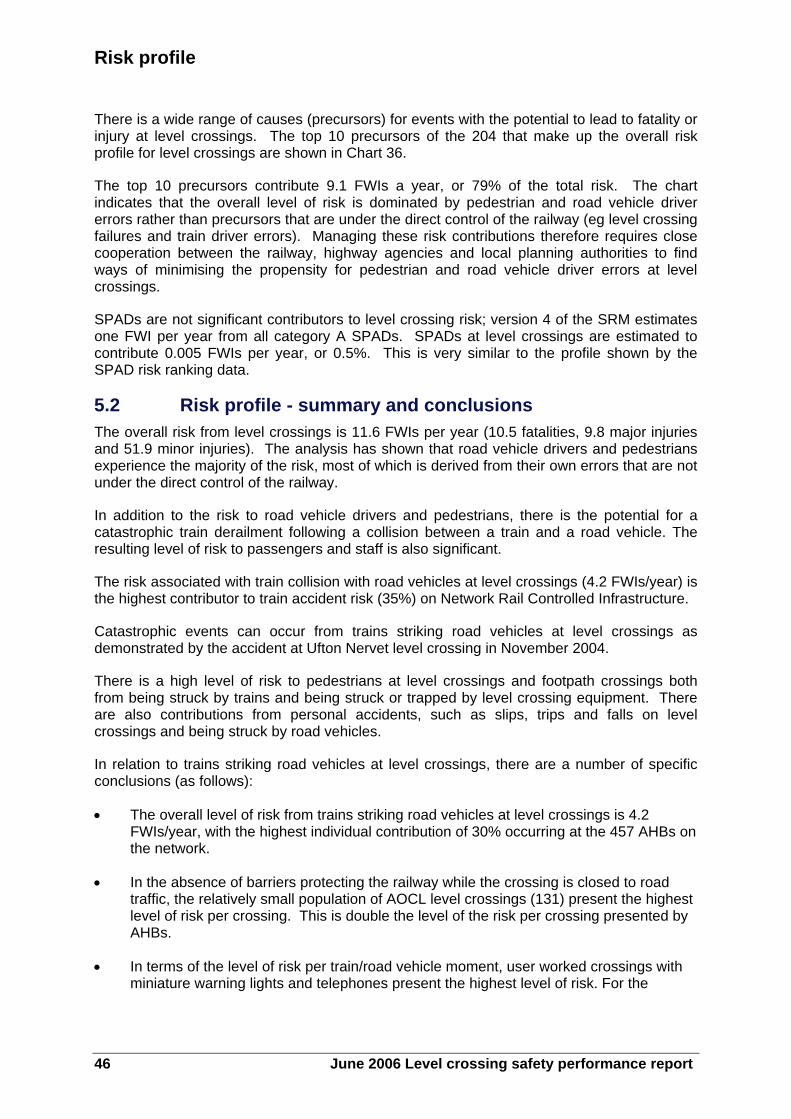
Risk profile There is a wide range of causes (precursors) for events with the potential to lead to fatality or injury at level crossings. The top 10 precursors of the 204 that make up the overall risk profile for level crossings are shown in Chart 36.
The top 10 precursors contribute 9.1 FWIs a year, or 79% of the total risk. The chart indicates that the overall level of risk is dominated by pedestrian and road vehicle driver errors rather than precursors that are under the direct control of the railway (eg level crossing failures and train driver errors). Managing these risk contributions therefore requires close cooperation between the railway, highway agencies and local planning authorities to find ways of minimising the propensity for pedestrian and road vehicle driver errors at level crossings.
SPADs are not significant contributors to level crossing risk; version 4 of the SRM estimates one FWI per year from all category A SPADs. SPADs at level crossings are estimated to contribute 0.005 FWIs per year, or 0.5%. This is very similar to the profile shown by the SPAD risk ranking data.
5.2 Risk profile - summary and conclusions The overall risk from level crossings is 11.6 FWIs per year (10.5 fatalities, 9.8 major injuries and 51.9 minor injuries). The analysis has shown that road vehicle drivers and pedestrians experience the majority of the risk, most of which is derived from their own errors that are not under the direct control of the railway.
In addition to the risk to road vehicle drivers and pedestrians, there is the potential for a catastrophic train derailment following a collision between a train and a road vehicle. The resulting level of risk to passengers and staff is also significant.
The risk associated with train collision with road vehicles at level crossings (4.2 FWIs/year) is the highest contributor to train accident risk (35%) on Network Rail Controlled Infrastructure.
Catastrophic events can occur from trains striking road vehicles at level crossings as demonstrated by the accident at Ufton Nervet level crossing in November 2004.
There is a high level of risk to pedestrians at level crossings and footpath crossings both from being struck by trains and being struck or trapped by level crossing equipment. There are also contributions from personal accidents, such as slips, trips and falls on level crossings and being struck by road vehicles.
In relation to trains striking road vehicles at level crossings, there are a number of specific conclusions (as follows):
• The overall level of risk from trains striking road vehicles at level crossings is 4.2 FWIs/year, with the highest individual contribution of 30% occurring at the 457 AHBs on the network.
• In the absence of barriers protecting the railway while the crossing is closed to road traffic, the relatively small population of AOCL level crossings (131) present the highest level of risk per crossing. This is double the level of the risk per crossing presented by AHBs.
• In terms of the level of risk per train/road vehicle moment, user worked crossings with miniature warning lights and telephones present the highest level of risk. For the
46 June 2006 Level crossing safety performance report
Risk profile
automatic crossings, the AOCLs again provide by far the highest level of risk (greater than 10 times the risk/moment presented by the AHBs).
• When the risk to pedestrians is considered the footpath crossings and AHBs present the highest overall level of risk with AHBs and AOCLs presenting the highest level of risk per crossing.
There is currently a requirement in the Railway Group Standard GI/RT7011, where reasonably practicable, to upgrade or remove the AOCL type of crossings over a 10-year period. As these, and other types of crossing, continue to present a high level of risk, there is a wide range of initiatives and research activities being undertaken to develop less costly and risk-based risk reduction measures.
47 © Copyright Rail Safety and Standards Board 2006

Initiatives
6 Current initiatives The railway industry has carried out a sustained campaign to reduce both crossing user and train occupant risk. Where reasonably practicable, upgrades have been implemented, and new solutions sought to improve safety.
Upgrades and closures
Network Rail continued its programme of level crossing closures, upgrades and renewals in 2005, with all territories undertaking a range of mitigating actions at crossings identified as high risk. For example: the London North West territory has commissioned telephones at 65 user worked crossings and issued mobile telephones to users of 15 other UWCs; the Western territory has closed several crossings, including the CCTV crossing at Silk Mill (which has been replaced by a road bridge); and Scotland has enhanced some of its automatic crossings by introducing improved signage, fencing and anti-skid surfaces.
National Level Crossing Safety Group
The National Level Crossing Safety Group (NLXSG) also continued its programme of work during 2005. To reflect the nature of the risk at level crossings, its membership includes such organisations as the Automobile Association (AA), the Driving Standards Agency (DSA), the British Horse Society, the Ramblers’ Association and the Disabled Persons Transport Advisory Committee (DPTAC).
Following the accident at Ufton Nervet, the NLXSG set up a working party in January 2005 to consider a range of safety issues, including:
• How accidents and other level crossing incidents are recorded, reported and apportioned by the road and rail authorities.
• Road-user awareness of level crossing risk.
• The adequacy and effectiveness of current planning policy guidance, with regard to assessing the impact of changes in land use.
• A review of the recommendations made in previous reports relevant to level crossing safety, commenting on how they are being (or can be) implemented in Britain.
In terms of heightening road user awareness, the NLXSG contributed to the 2005 Highway Code review, with a view to raising the profile of level crossings. This is currently subject to public consultation. The DSA has agreed to add further level crossing questions to driving theory papers, and is interested in producing a film for the hazard perception component of the driving test. Further information was also appended to Driving: The Essential Skills, along with publications aimed at professional drivers.
Network Rail has lobbied to introduce amendments to the Road Safety Bill, which cover level crossing issues related to planning, risk management, closure and penalties for misuse. It continues to work with NLXSG to further these industry objectives.
48 June 2006 Level crossing safety performance report
Initiatives
Level crossing research
Concurrent with the above, RSSB is co-ordinating a number of research projects in this area, including:
• The development of a universal level crossing risk tool.
• Trials of median strips / lane separators on the approach to AHB crossings, to determine whether they assist in the prevention of accidents caused by drivers violating the crossing controls.
• The assessment of the potential opportunities and challenges posed by installing obstacle detectors at level crossings.
Trials of ‘third generation’ red light cameras, designed to prevent road user abuse at level crossings and create better enforcement opportunities, are being developed.
RSSB also established the European Level Crossing Research Forum in 2005. This is an informal gathering of railway and highways authorities from across Europe, which discusses level crossing safety and shares the outcomes of research and education campaigns for improving user behaviour at level crossings. The group met twice during 2005, in February (London) and September (Mainz).
The forum plans to set up a website in 2006, and to work towards a shared database of definitions and accident statistics. For further information on the RSSB research programme, visit www.rssb.co.uk/r_and_d.asp.
Developments for 2006
Level crossings will continue to be a focus of industry effort in 2006. The rail industry is seeking, through education and engineering, to bring about a fundamental change in public understanding and appreciation of risk, and to redress the balance of responsibility at the road-rail interface. To this end, Network Rail has launched a campaign to persuade motorists, pedestrians and other road users that misusing level crossings can and does have fatal results. The company is spending £3m in an all-encompassing campaign, which includes radio and television advertising, billboards, and direct mailing to users of private crossings and those living in the vicinity of crossings identified as ‘hot-spots’ for misuse. The theme is ‘Level crossings: don’t run the risk’. Some 95% of safety risk at level crossings in the UK arises from misuse by motorists and pedestrians. The campaign aims to influence user behaviour by highlighting the potential consequences of misuse. Although level crossings in the UK are the safest in Europe, normalised by accidents per 1000 crossings, Network Rail is keen to influence positively the main source of the remaining risk, and to develop a level of understanding in communities, promoting the idea that minimising risk at level crossings is a shared responsibility.
In early 2006, Network Rail also began to transfer responsibility for level crossing inspections to maintenance staff. Initial indications are that this major change has introduced new discipline into the system, with more rigorous checks against specifications, standardised practices, and new guidance material.
The All Level Crossing Risk Model is due to be implemented in October 2006, and will enable Network Rail to identify key contributors to risk at a detailed level. It will also provide an up-to-date inventory of level crossings on NRCI. In a parallel development, Network Rail
49 © Copyright Rail Safety and Standards Board 2006
Initiatives will also be bringing in a level crossing risk toolkit focused on human and environmental risk contributors. These new tools should help in a period of change, as more responsibility is devolved to individual regions and resources are aligned more closely to Highway Authority areas.
50 June 2006 Level crossing safety performance report
Appendix 1
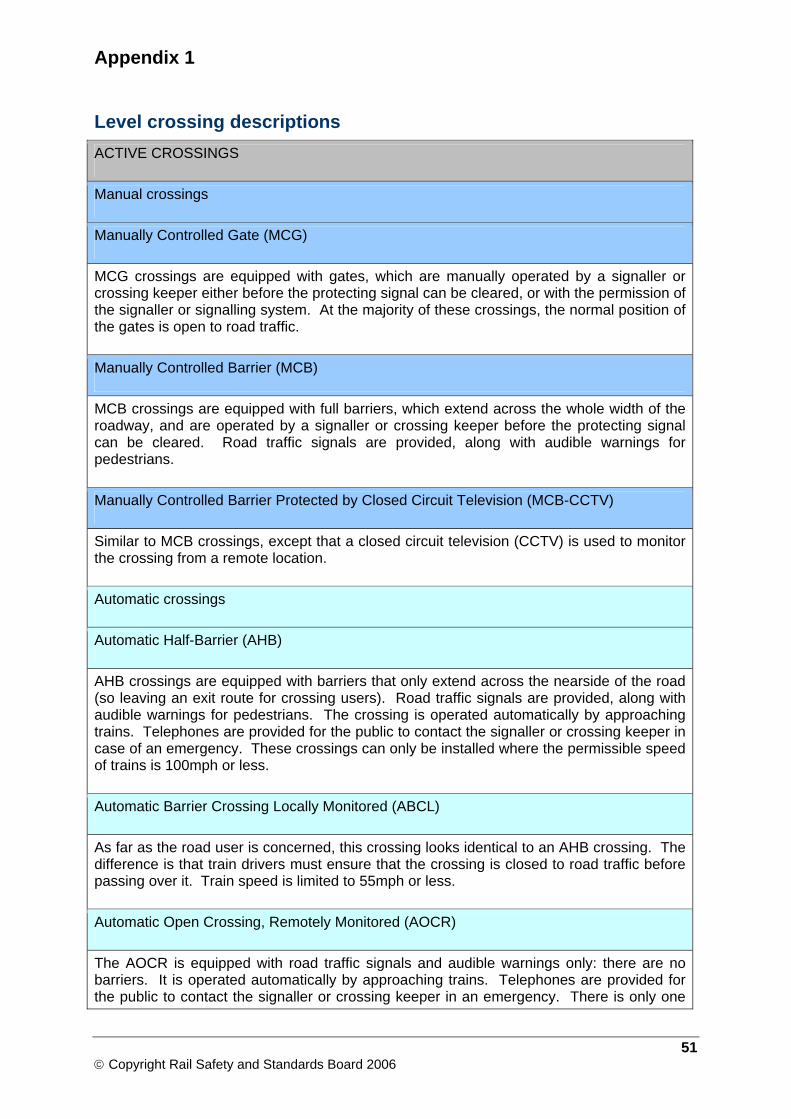
Level crossing descriptions ACTIVE CROSSINGS
Manual crossings
Manually Controlled Gate (MCG)
MCG crossings are equipped with gates, which are manually operated by a signaller or crossing keeper either before the protecting signal can be cleared, or with the permission of the signaller or signalling system. At the majority of these crossings, the normal position of the gates is open to road traffic.
Manually Controlled Barrier (MCB)
MCB crossings are equipped with full barriers, which extend across the whole width of the roadway, and are operated by a signaller or crossing keeper before the protecting signal can be cleared. Road traffic signals are provided, along with audible warnings for pedestrians.
Manually Controlled Barrier Protected by Closed Circuit Television (MCB-CCTV)
Similar to MCB crossings, except that a closed circuit television (CCTV) is used to monitor the crossing from a remote location.
Automatic crossings
Automatic Half-Barrier (AHB)
AHB crossings are equipped with barriers that only extend across the nearside of the road (so leaving an exit route for crossing users). Road traffic signals are provided, along with audible warnings for pedestrians. The crossing is operated automatically by approaching trains. Telephones are provided for the public to contact the signaller or crossing keeper in case of an emergency. These crossings can only be installed where the permissible speed of trains is 100mph or less.
Automatic Barrier Crossing Locally Monitored (ABCL)
As far as the road user is concerned, this crossing looks identical to an AHB crossing. The difference is that train drivers must ensure that the crossing is closed to road traffic before passing over it. Train speed is limited to 55mph or less.
Automatic Open Crossing, Remotely Monitored (AOCR)
The AOCR is equipped with road traffic signals and audible warnings only: there are no barriers. It is operated automatically by approaching trains. Telephones are provided for the public to contact the signaller or crossing keeper in an emergency. There is only one
51 © Copyright Rail Safety and Standards Board 2006
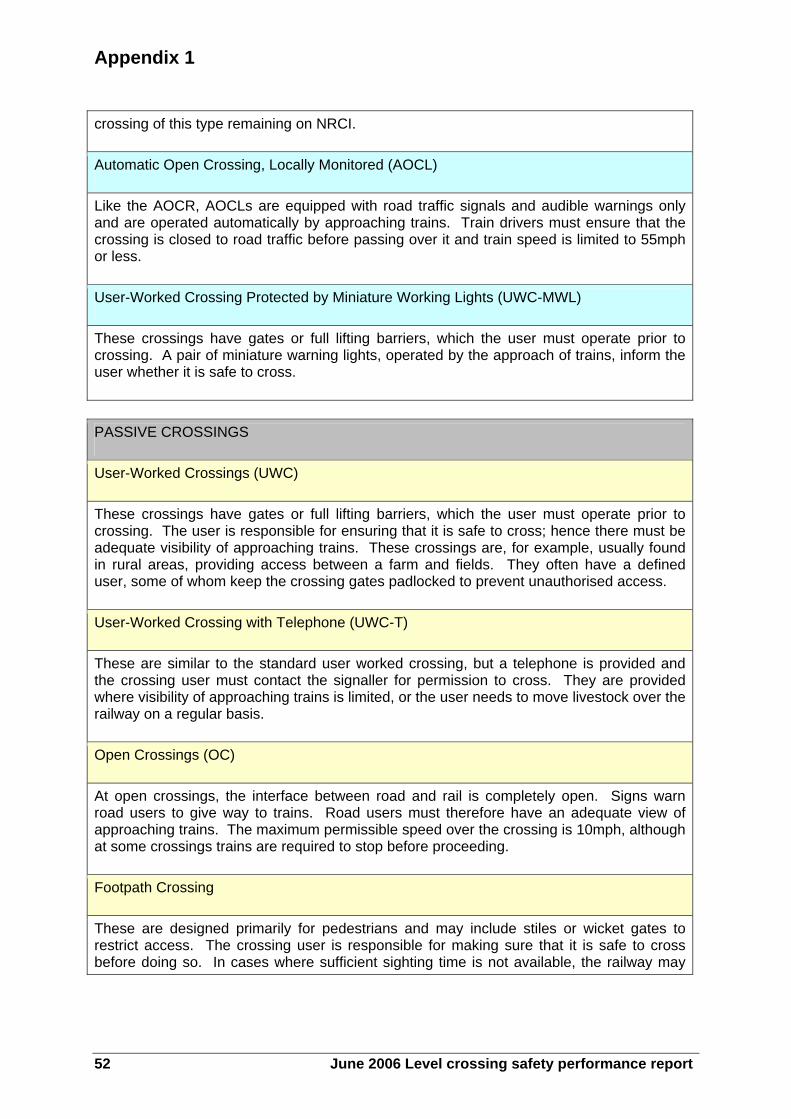
Appendix 1 crossing of this type remaining on NRCI.
Automatic Open Crossing, Locally Monitored (AOCL)
Like the AOCR, AOCLs are equipped with road traffic signals and audible warnings only and are operated automatically by approaching trains. Train drivers must ensure that the crossing is closed to road traffic before passing over it and train speed is limited to 55mph or less.
User-Worked Crossing Protected by Miniature Working Lights (UWC-MWL)
These crossings have gates or full lifting barriers, which the user must operate prior to crossing. A pair of miniature warning lights, operated by the approach of trains, inform the user whether it is safe to cross.
PASSIVE CROSSINGS
User-Worked Crossings (UWC)
These crossings have gates or full lifting barriers, which the user must operate prior to crossing. The user is responsible for ensuring that it is safe to cross; hence there must be adequate visibility of approaching trains. These crossings are, for example, usually found in rural areas, providing access between a farm and fields. They often have a defined user, some of whom keep the crossing gates padlocked to prevent unauthorised access.
User-Worked Crossing with Telephone (UWC-T)
These are similar to the standard user worked crossing, but a telephone is provided and the crossing user must contact the signaller for permission to cross. They are provided where visibility of approaching trains is limited, or the user needs to move livestock over the railway on a regular basis.
Open Crossings (OC)
At open crossings, the interface between road and rail is completely open. Signs warn road users to give way to trains. Road users must therefore have an adequate view of approaching trains. The maximum permissible speed over the crossing is 10mph, although at some crossings trains are required to stop before proceeding.
Footpath Crossing
These are designed primarily for pedestrians and may include stiles or wicket gates to restrict access. The crossing user is responsible for making sure that it is safe to cross before doing so. In cases where sufficient sighting time is not available, the railway may
52 June 2006 Level crossing safety performance report
Appendix 1
provide a ‘whistle’ board, instructing drivers to sound the horn to warn of their train’s approach, or miniature warning lights4. A variant is the bridleway crossing, which is usually on a public right of way, although some are private and restricted to authorised users.
4 Note that a footpath crossing with miniature warning lights should strictly be classified as an active crossing. For reasons of convenience and data quality, footpath crossings are analysed as a single group.
53 © Copyright Rail Safety and Standards Board 2006
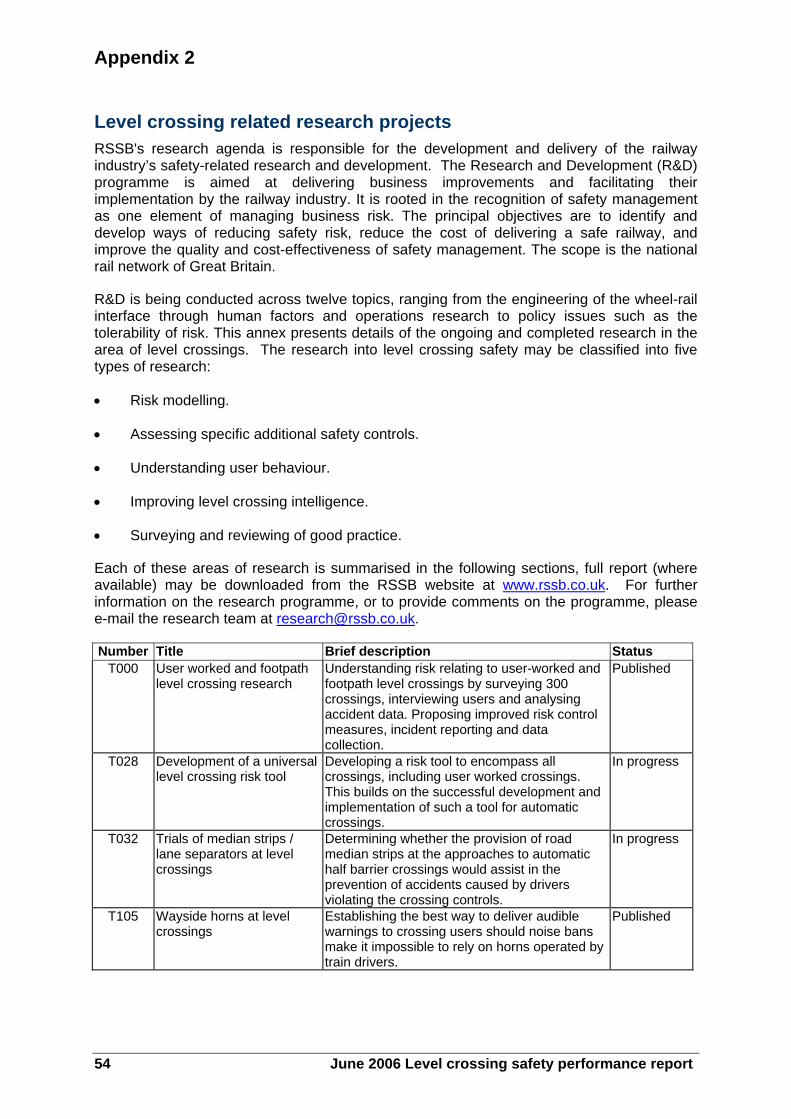
Appendix 2 Level crossing related research projects RSSB's research agenda is responsible for the development and delivery of the railway industry’s safety-related research and development. The Research and Development (R&D) programme is aimed at delivering business improvements and facilitating their implementation by the railway industry. It is rooted in the recognition of safety management as one element of managing business risk. The principal objectives are to identify and develop ways of reducing safety risk, reduce the cost of delivering a safe railway, and improve the quality and cost-effectiveness of safety management. The scope is the national rail network of Great Britain.
R&D is being conducted across twelve topics, ranging from the engineering of the wheel-rail interface through human factors and operations research to policy issues such as the tolerability of risk. This annex presents details of the ongoing and completed research in the area of level crossings. The research into level crossing safety may be classified into five types of research:
• Risk modelling.
• Assessing specific additional safety controls.
• Understanding user behaviour.
• Improving level crossing intelligence.
• Surveying and reviewing of good practice.
Each of these areas of research is summarised in the following sections, full report (where available) may be downloaded from the RSSB website at www.rssb.co.uk. For further information on the research programme, or to provide comments on the programme, please e-mail the research team at [email protected].
Number Title Brief description Status T000 User worked and footpath
level crossing research Understanding risk relating to user-worked and footpath level crossings by surveying 300 crossings, interviewing users and analysing accident data. Proposing improved risk control measures, incident reporting and data collection.
Published
T028 Development of a universal level crossing risk tool
Developing a risk tool to encompass all crossings, including user worked crossings. This builds on the successful development and implementation of such a tool for automatic crossings.
In progress
T032 Trials of median strips / lane separators at level crossings
Determining whether the provision of road median strips at the approaches to automatic half barrier crossings would assist in the prevention of accidents caused by drivers violating the crossing controls.
In progress
T105 Wayside horns at level crossings
Establishing the best way to deliver audible warnings to crossing users should noise bans make it impossible to rely on horns operated by train drivers.
Published
54 June 2006 Level crossing safety performance report
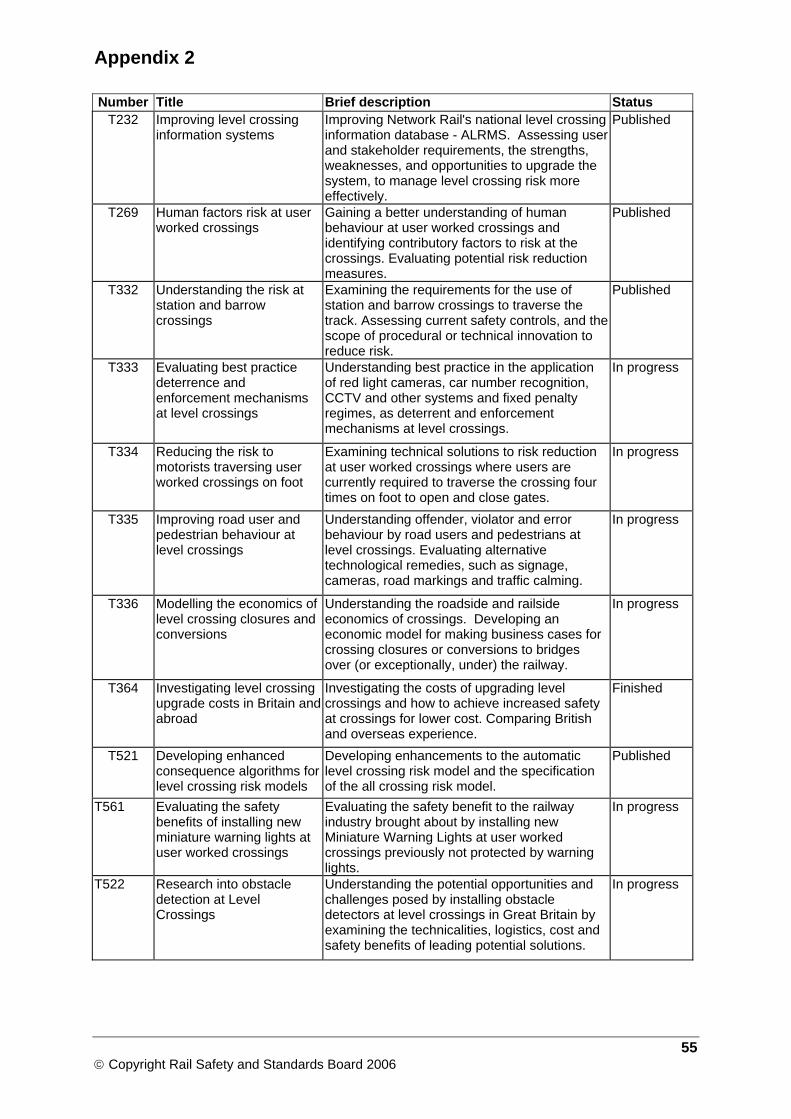
Appendix 2 Number Title Brief description Status
T232 Improving level crossing information systems
Improving Network Rail's national level crossing information database - ALRMS. Assessing user and stakeholder requirements, the strengths, weaknesses, and opportunities to upgrade the system, to manage level crossing risk more effectively.
Published
T269 Human factors risk at user worked crossings
Gaining a better understanding of human behaviour at user worked crossings and identifying contributory factors to risk at the crossings. Evaluating potential risk reduction measures.
Published
T332 Understanding the risk at station and barrow crossings
Examining the requirements for the use of station and barrow crossings to traverse the track. Assessing current safety controls, and the scope of procedural or technical innovation to reduce risk.
Published
T333 Evaluating best practice deterrence and enforcement mechanisms at level crossings
Understanding best practice in the application of red light cameras, car number recognition, CCTV and other systems and fixed penalty regimes, as deterrent and enforcement mechanisms at level crossings.
In progress
T334 Reducing the risk to motorists traversing user worked crossings on foot
Examining technical solutions to risk reduction at user worked crossings where users are currently required to traverse the crossing four times on foot to open and close gates.
In progress
T335 Improving road user and pedestrian behaviour at level crossings
Understanding offender, violator and error behaviour by road users and pedestrians at level crossings. Evaluating alternative technological remedies, such as signage, cameras, road markings and traffic calming.
In progress
T336 Modelling the economics of level crossing closures and conversions
Understanding the roadside and railside economics of crossings. Developing an economic model for making business cases for crossing closures or conversions to bridges over (or exceptionally, under) the railway.
In progress
T364 Investigating level crossing upgrade costs in Britain and abroad
Investigating the costs of upgrading level crossings and how to achieve increased safety at crossings for lower cost. Comparing British and overseas experience.
Finished
T521 Developing enhanced consequence algorithms for level crossing risk models
Developing enhancements to the automatic level crossing risk model and the specification of the all crossing risk model.
Published
T561 Evaluating the safety benefits of installing new miniature warning lights at user worked crossings
Evaluating the safety benefit to the railway industry brought about by installing new Miniature Warning Lights at user worked crossings previously not protected by warning lights.
In progress
T522 Research into obstacle detection at Level Crossings
Understanding the potential opportunities and challenges posed by installing obstacle detectors at level crossings in Great Britain by examining the technicalities, logistics, cost and safety benefits of leading potential solutions.
In progress
55
© Copyright Rail Safety and Standards Board 2006
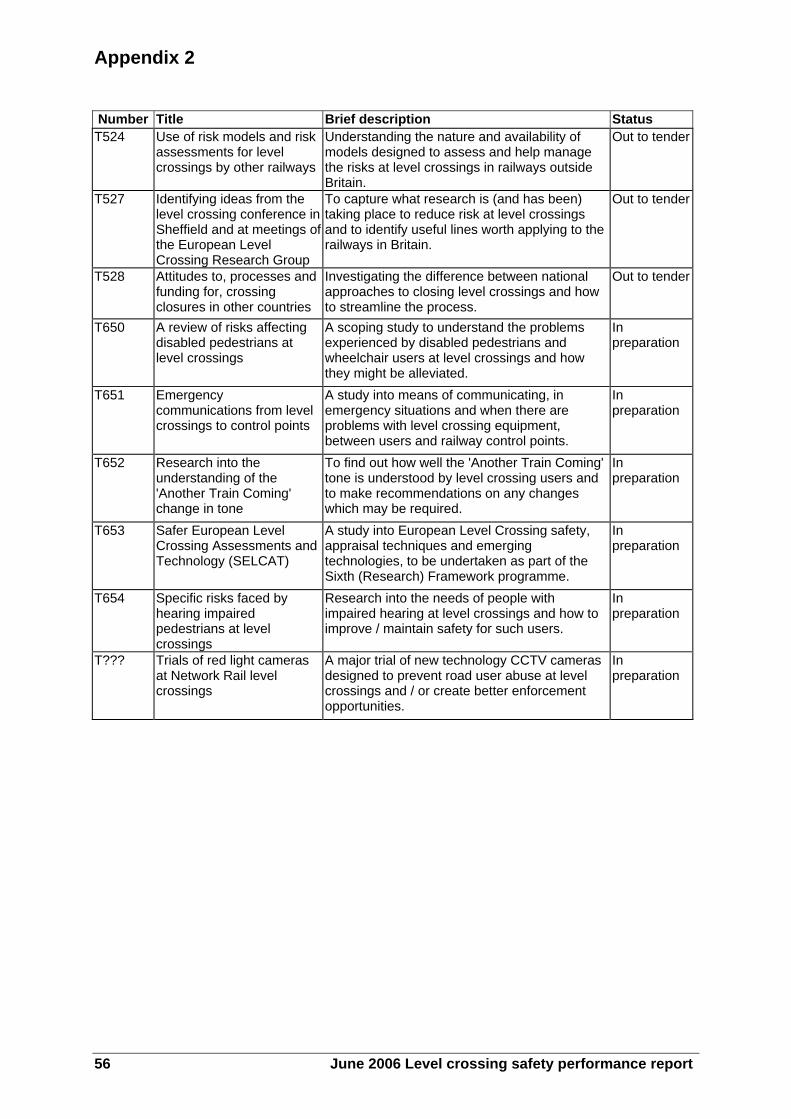
Appendix 2 Number Title Brief description Status T524 Use of risk models and risk
assessments for level crossings by other railways
Understanding the nature and availability of models designed to assess and help manage the risks at level crossings in railways outside Britain.
Out to tender
T527 Identifying ideas from the level crossing conference in Sheffield and at meetings of the European Level Crossing Research Group
To capture what research is (and has been) taking place to reduce risk at level crossings and to identify useful lines worth applying to the railways in Britain.
Out to tender
T528 Attitudes to, processes and funding for, crossing closures in other countries
Investigating the difference between national approaches to closing level crossings and how to streamline the process.
Out to tender
T650 A review of risks affecting disabled pedestrians at level crossings
A scoping study to understand the problems experienced by disabled pedestrians and wheelchair users at level crossings and how they might be alleviated.
In preparation
T651 Emergency communications from level crossings to control points
A study into means of communicating, in emergency situations and when there are problems with level crossing equipment, between users and railway control points.
In preparation
T652 Research into the understanding of the 'Another Train Coming' change in tone
To find out how well the 'Another Train Coming' tone is understood by level crossing users and to make recommendations on any changes which may be required.
In preparation
T653 Safer European Level Crossing Assessments and Technology (SELCAT)
A study into European Level Crossing safety, appraisal techniques and emerging technologies, to be undertaken as part of the Sixth (Research) Framework programme.
In preparation
T654 Specific risks faced by hearing impaired pedestrians at level crossings
Research into the needs of people with impaired hearing at level crossings and how to improve / maintain safety for such users.
In preparation
T??? Trials of red light cameras at Network Rail level crossings
A major trial of new technology CCTV cameras designed to prevent road user abuse at level crossings and / or create better enforcement opportunities.
In preparation
56 June 2006 Level crossing safety performance report
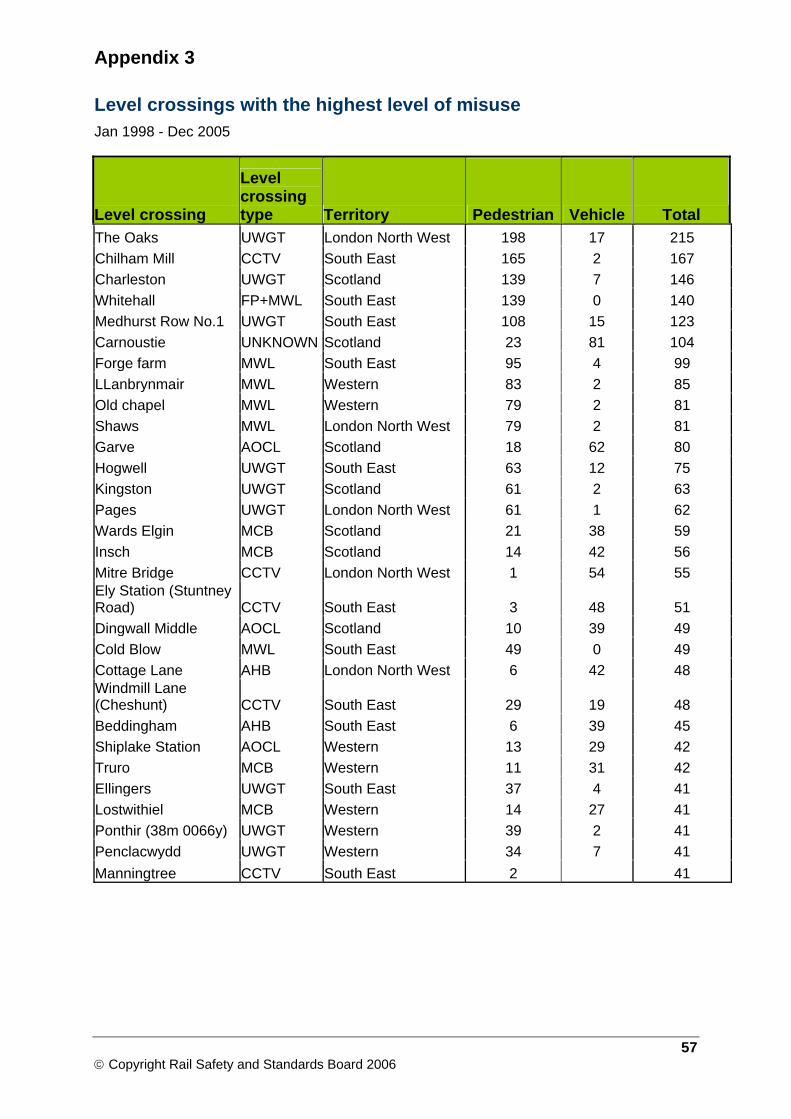
Appendix 3 Level crossings with the highest level of misuse Jan 1998 - Dec 2005
Level crossing
Level crossing type Territory Pedestrian Vehicle Total
The Oaks UWGT London North West 198 17 215 Chilham Mill CCTV South East 165 2 167 Charleston UWGT Scotland 139 7 146 Whitehall FP+MWL South East 139 0 140 Medhurst Row No.1 UWGT South East 108 15 123 Carnoustie UNKNOWN Scotland 23 81 104 Forge farm MWL South East 95 4 99 LLanbrynmair MWL Western 83 2 85 Old chapel MWL Western 79 2 81 Shaws MWL London North West 79 2 81 Garve AOCL Scotland 18 62 80 Hogwell UWGT South East 63 12 75 Kingston UWGT Scotland 61 2 63 Pages UWGT London North West 61 1 62 Wards Elgin MCB Scotland 21 38 59 Insch MCB Scotland 14 42 56 Mitre Bridge CCTV London North West 1 54 55 Ely Station (Stuntney Road) CCTV South East 3 48 51 Dingwall Middle AOCL Scotland 10 39 49 Cold Blow MWL South East 49 0 49 Cottage Lane AHB London North West 6 42 48 Windmill Lane (Cheshunt) CCTV South East 29 19 48 Beddingham AHB South East 6 39 45 Shiplake Station AOCL Western 13 29 42 Truro MCB Western 11 31 42 Ellingers UWGT South East 37 4 41 Lostwithiel MCB Western 14 27 41 Ponthir (38m 0066y) UWGT Western 39 2 41 Penclacwydd UWGT Western 34 7 41 Manningtree CCTV South East 2 41
57
© Copyright Rail Safety and Standards Board 2006
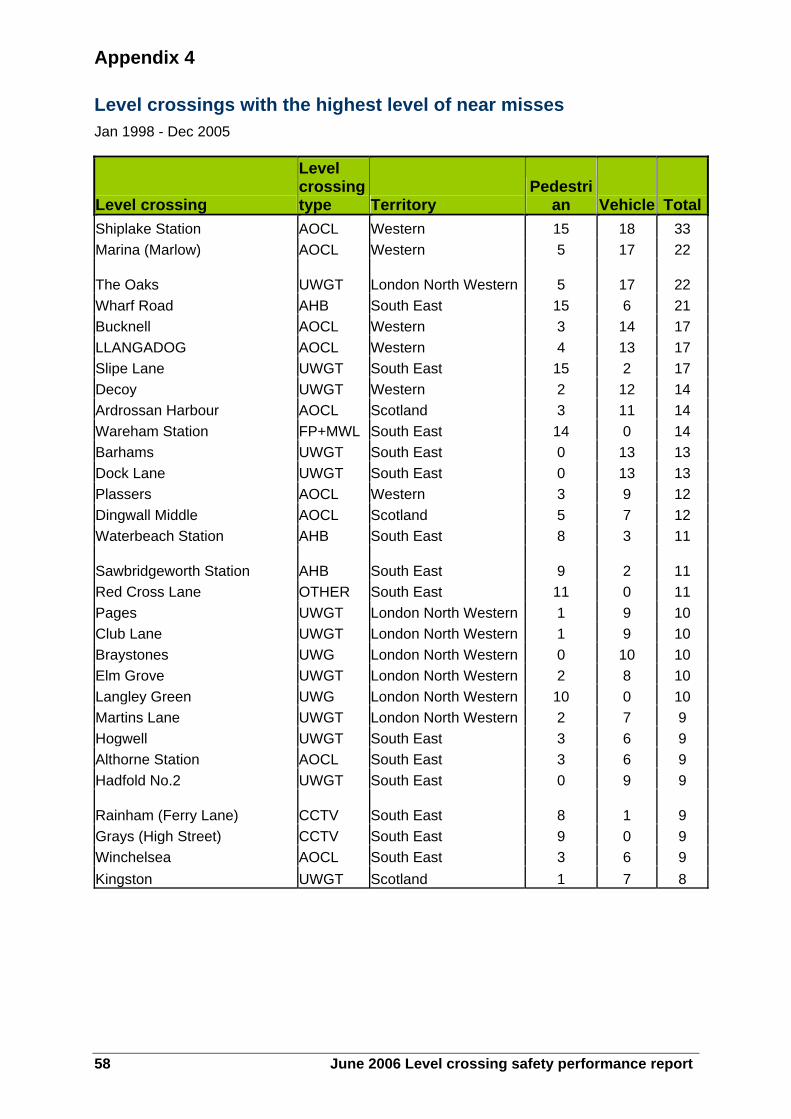
Appendix 4 Level crossings with the highest level of near misses Jan 1998 - Dec 2005
Level crossing
Level crossing type Territory
Pedestrian Vehicle Total
Shiplake Station AOCL Western 15 18 33 Marina (Marlow) AOCL Western 5 17 22
The Oaks UWGT London North Western 5 17 22 Wharf Road AHB South East 15 6 21 Bucknell AOCL Western 3 14 17 LLANGADOG AOCL Western 4 13 17 Slipe Lane UWGT South East 15 2 17 Decoy UWGT Western 2 12 14 Ardrossan Harbour AOCL Scotland 3 11 14 Wareham Station FP+MWL South East 14 0 14 Barhams UWGT South East 0 13 13 Dock Lane UWGT South East 0 13 13 Plassers AOCL Western 3 9 12 Dingwall Middle AOCL Scotland 5 7 12 Waterbeach Station AHB South East 8 3 11
Sawbridgeworth Station AHB South East 9 2 11 Red Cross Lane OTHER South East 11 0 11 Pages UWGT London North Western 1 9 10 Club Lane UWGT London North Western 1 9 10 Braystones UWG London North Western 0 10 10 Elm Grove UWGT London North Western 2 8 10 Langley Green UWG London North Western 10 0 10 Martins Lane UWGT London North Western 2 7 9 Hogwell UWGT South East 3 6 9 Althorne Station AOCL South East 3 6 9 Hadfold No.2 UWGT South East 0 9 9
Rainham (Ferry Lane) CCTV South East 8 1 9 Grays (High Street) CCTV South East 9 0 9 Winchelsea AOCL South East 3 6 9 Kingston UWGT Scotland 1 7 8
58 June 2006 Level crossing safety performance report
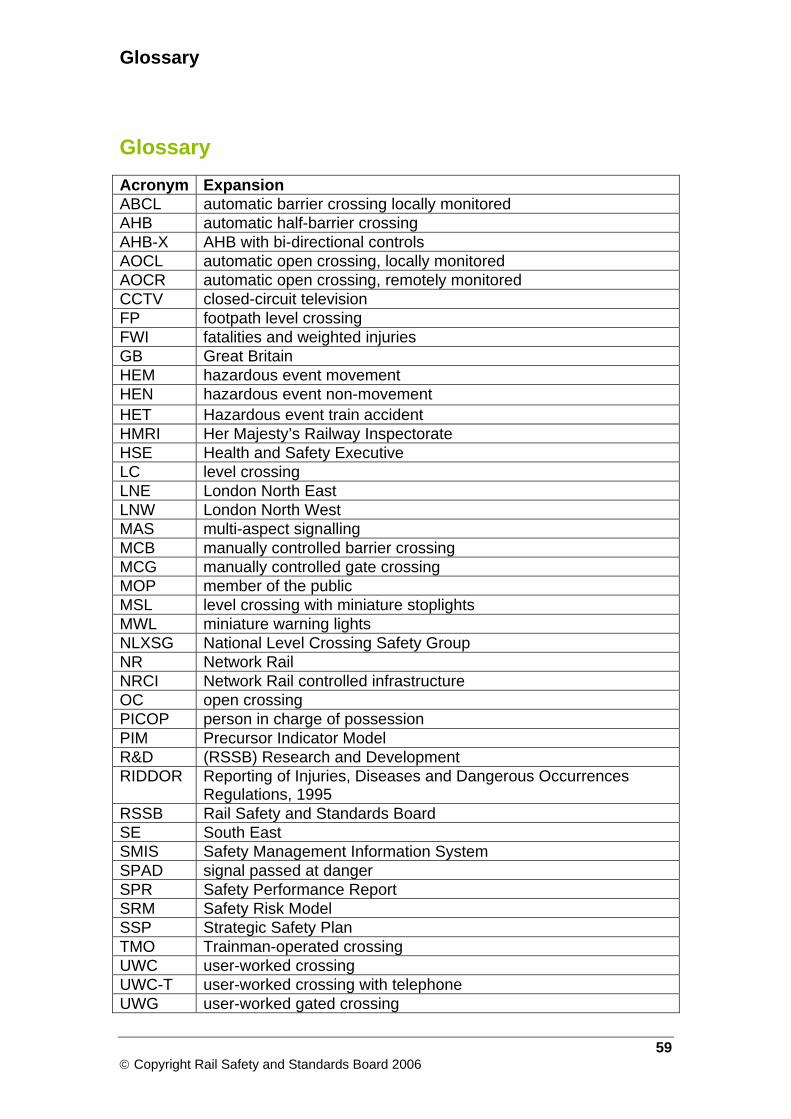
Glossary
Glossary Acronym Expansion ABCL automatic barrier crossing locally monitored AHB automatic half-barrier crossing AHB-X AHB with bi-directional controls AOCL automatic open crossing, locally monitored AOCR automatic open crossing, remotely monitored CCTV closed-circuit television FP footpath level crossing FWI fatalities and weighted injuries GB Great Britain HEM hazardous event movement HEN hazardous event non-movement HET Hazardous event train accident HMRI Her Majesty’s Railway Inspectorate HSE Health and Safety Executive LC level crossing LNE London North East LNW London North West MAS multi-aspect signalling MCB manually controlled barrier crossing MCG manually controlled gate crossing MOP member of the public MSL level crossing with miniature stoplights MWL miniature warning lights NLXSG National Level Crossing Safety Group NR Network Rail NRCI Network Rail controlled infrastructure OC open crossing PICOP person in charge of possession PIM Precursor Indicator Model R&D (RSSB) Research and Development RIDDOR Reporting of Injuries, Diseases and Dangerous Occurrences
Regulations, 1995 RSSB Rail Safety and Standards Board SE South East SMIS Safety Management Information System SPAD signal passed at danger SPR Safety Performance Report SRM Safety Risk Model SSP Strategic Safety Plan TMO Trainman-operated crossing UWC user-worked crossing UWC-T user-worked crossing with telephone UWG user-worked gated crossing
59 © Copyright Rail Safety and Standards Board 2006
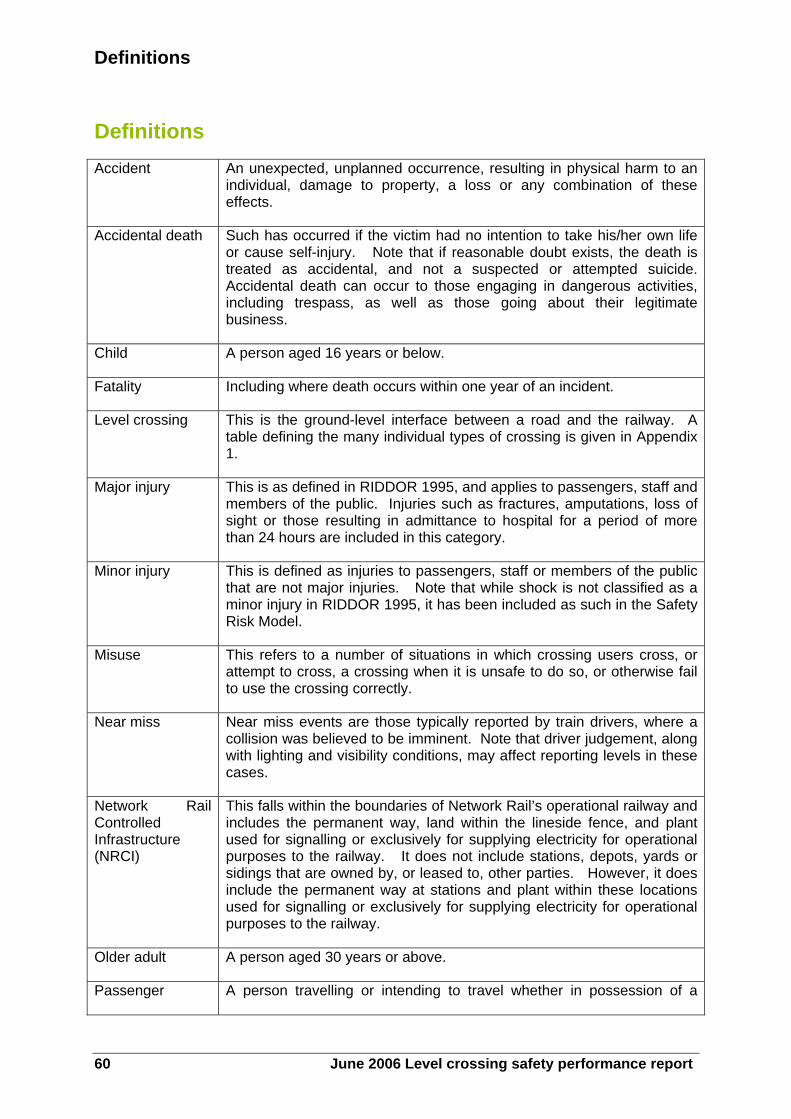
Definitions Definitions Accident An unexpected, unplanned occurrence, resulting in physical harm to an
individual, damage to property, a loss or any combination of these effects.
Accidental death Such has occurred if the victim had no intention to take his/her own life or cause self-injury. Note that if reasonable doubt exists, the death is treated as accidental, and not a suspected or attempted suicide. Accidental death can occur to those engaging in dangerous activities, including trespass, as well as those going about their legitimate business.
Child A person aged 16 years or below.
Fatality Including where death occurs within one year of an incident.
Level crossing This is the ground-level interface between a road and the railway. A table defining the many individual types of crossing is given in Appendix 1.
Major injury This is as defined in RIDDOR 1995, and applies to passengers, staff and members of the public. Injuries such as fractures, amputations, loss of sight or those resulting in admittance to hospital for a period of more than 24 hours are included in this category.
Minor injury This is defined as injuries to passengers, staff or members of the public that are not major injuries. Note that while shock is not classified as a minor injury in RIDDOR 1995, it has been included as such in the Safety Risk Model.
Misuse This refers to a number of situations in which crossing users cross, or attempt to cross, a crossing when it is unsafe to do so, or otherwise fail to use the crossing correctly.
Near miss Near miss events are those typically reported by train drivers, where a collision was believed to be imminent. Note that driver judgement, along with lighting and visibility conditions, may affect reporting levels in these cases.
Network Rail Controlled Infrastructure (NRCI)
This falls within the boundaries of Network Rail’s operational railway and includes the permanent way, land within the lineside fence, and plant used for signalling or exclusively for supplying electricity for operational purposes to the railway. It does not include stations, depots, yards or sidings that are owned by, or leased to, other parties. However, it does include the permanent way at stations and plant within these locations used for signalling or exclusively for supplying electricity for operational purposes to the railway.
Older adult A person aged 30 years or above.
Passenger A person travelling or intending to travel whether in possession of a
60 June 2006 Level crossing safety performance report
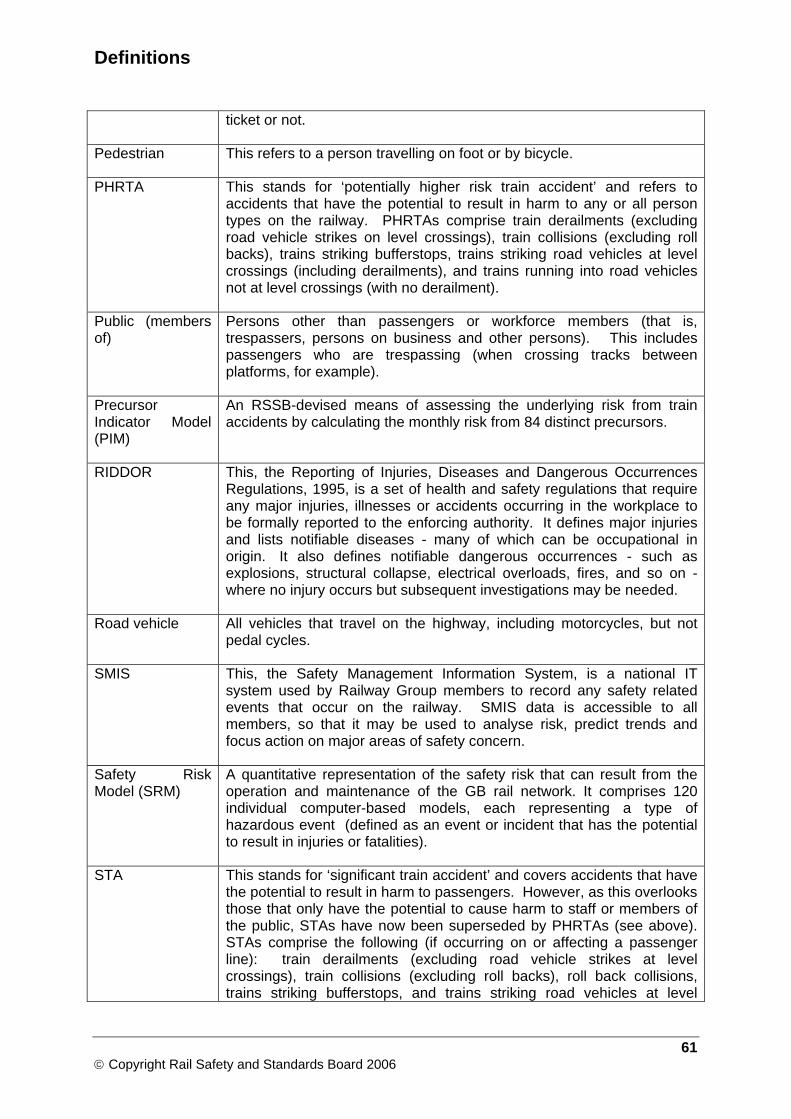
Definitions
ticket or not.
Pedestrian This refers to a person travelling on foot or by bicycle.
PHRTA This stands for ‘potentially higher risk train accident’ and refers to accidents that have the potential to result in harm to any or all person types on the railway. PHRTAs comprise train derailments (excluding road vehicle strikes on level crossings), train collisions (excluding roll backs), trains striking bufferstops, trains striking road vehicles at level crossings (including derailments), and trains running into road vehicles not at level crossings (with no derailment).
Public (members of)
Persons other than passengers or workforce members (that is, trespassers, persons on business and other persons). This includes passengers who are trespassing (when crossing tracks between platforms, for example).
Precursor Indicator Model (PIM)
An RSSB-devised means of assessing the underlying risk from train accidents by calculating the monthly risk from 84 distinct precursors.
RIDDOR This, the Reporting of Injuries, Diseases and Dangerous Occurrences Regulations, 1995, is a set of health and safety regulations that require any major injuries, illnesses or accidents occurring in the workplace to be formally reported to the enforcing authority. It defines major injuries and lists notifiable diseases - many of which can be occupational in origin. It also defines notifiable dangerous occurrences - such as explosions, structural collapse, electrical overloads, fires, and so on - where no injury occurs but subsequent investigations may be needed.
Road vehicle All vehicles that travel on the highway, including motorcycles, but not pedal cycles.
SMIS This, the Safety Management Information System, is a national IT system used by Railway Group members to record any safety related events that occur on the railway. SMIS data is accessible to all members, so that it may be used to analyse risk, predict trends and focus action on major areas of safety concern.
Safety Risk Model (SRM)
A quantitative representation of the safety risk that can result from the operation and maintenance of the GB rail network. It comprises 120 individual computer-based models, each representing a type of hazardous event (defined as an event or incident that has the potential to result in injuries or fatalities).
STA This stands for ‘significant train accident’ and covers accidents that have the potential to result in harm to passengers. However, as this overlooks those that only have the potential to cause harm to staff or members of the public, STAs have now been superseded by PHRTAs (see above). STAs comprise the following (if occurring on or affecting a passenger line): train derailments (excluding road vehicle strikes at level crossings), train collisions (excluding roll backs), roll back collisions, trains striking bufferstops, and trains striking road vehicles at level
61 © Copyright Rail Safety and Standards Board 2006
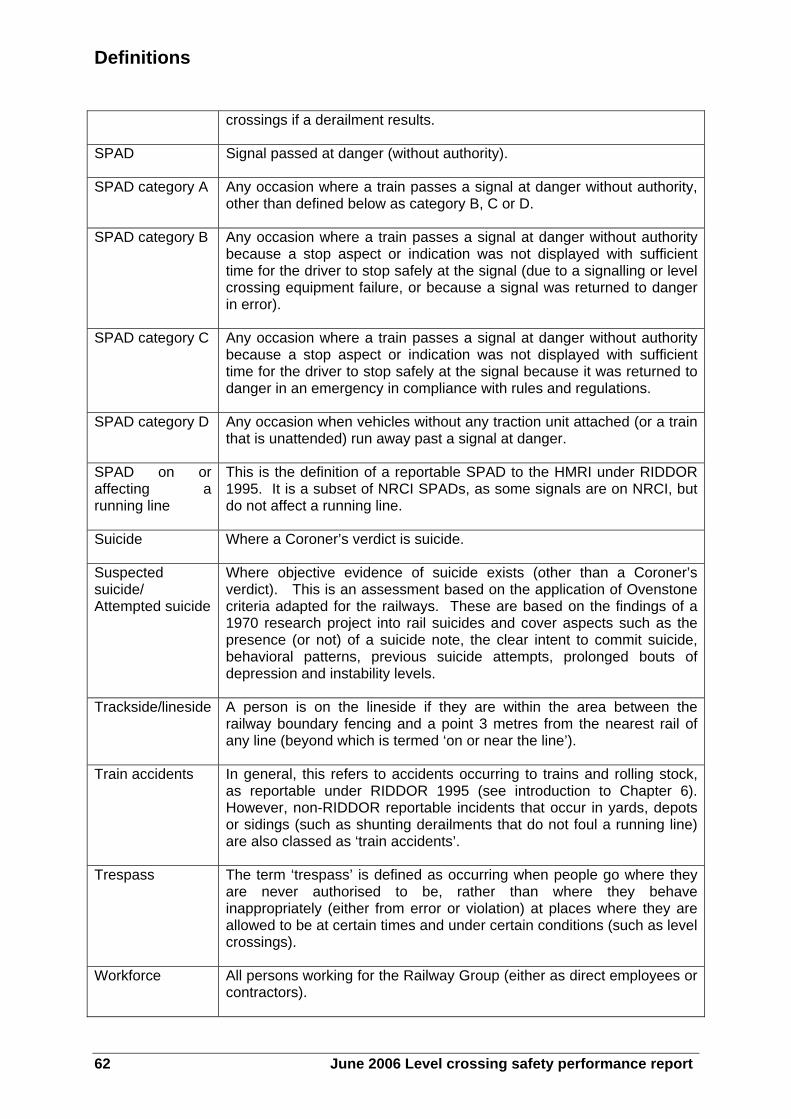
Definitions
crossings if a derailment results.
SPAD Signal passed at danger (without authority).
SPAD category A Any occasion where a train passes a signal at danger without authority, other than defined below as category B, C or D.
SPAD category B Any occasion where a train passes a signal at danger without authority because a stop aspect or indication was not displayed with sufficient time for the driver to stop safely at the signal (due to a signalling or level crossing equipment failure, or because a signal was returned to danger in error).
SPAD category C Any occasion where a train passes a signal at danger without authority because a stop aspect or indication was not displayed with sufficient time for the driver to stop safely at the signal because it was returned to danger in an emergency in compliance with rules and regulations.
SPAD category D Any occasion when vehicles without any traction unit attached (or a train that is unattended) run away past a signal at danger.
SPAD on or affecting a running line
This is the definition of a reportable SPAD to the HMRI under RIDDOR 1995. It is a subset of NRCI SPADs, as some signals are on NRCI, but do not affect a running line.
Suicide Where a Coroner’s verdict is suicide.
Suspected suicide/ Attempted suicide
Where objective evidence of suicide exists (other than a Coroner’s verdict). This is an assessment based on the application of Ovenstone criteria adapted for the railways. These are based on the findings of a 1970 research project into rail suicides and cover aspects such as the presence (or not) of a suicide note, the clear intent to commit suicide, behavioral patterns, previous suicide attempts, prolonged bouts of depression and instability levels.
Trackside/lineside A person is on the lineside if they are within the area between the railway boundary fencing and a point 3 metres from the nearest rail of any line (beyond which is termed ‘on or near the line’).
Train accidents In general, this refers to accidents occurring to trains and rolling stock, as reportable under RIDDOR 1995 (see introduction to Chapter 6). However, non-RIDDOR reportable incidents that occur in yards, depots or sidings (such as shunting derailments that do not foul a running line) are also classed as ‘train accidents’.
Trespass The term ‘trespass’ is defined as occurring when people go where they are never authorised to be, rather than where they behave inappropriately (either from error or violation) at places where they are allowed to be at certain times and under certain conditions (such as level crossings).
Workforce All persons working for the Railway Group (either as direct employees or contractors).
62 June 2006 Level crossing safety performance report
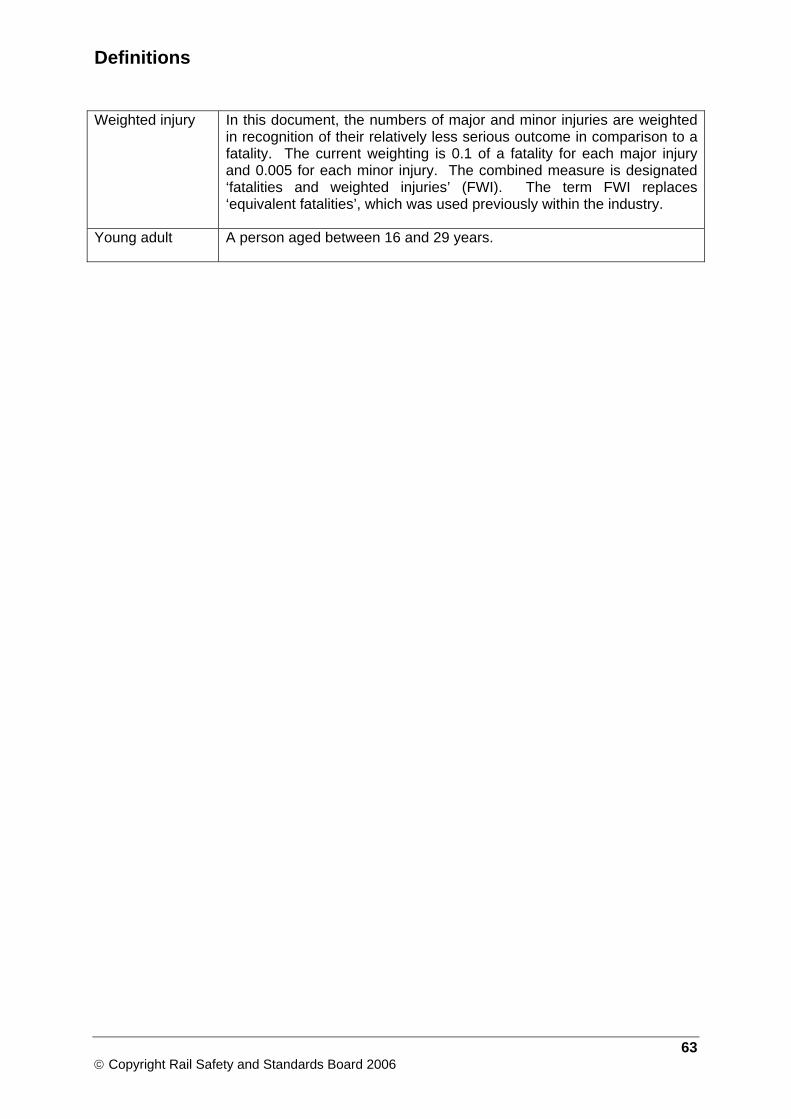
Definitions
Weighted injury In this document, the numbers of major and minor injuries are weighted in recognition of their relatively less serious outcome in comparison to a fatality. The current weighting is 0.1 of a fatality for each major injury and 0.005 for each minor injury. The combined measure is designated ‘fatalities and weighted injuries’ (FWI). The term FWI replaces ‘equivalent fatalities’, which was used previously within the industry.
Young adult A person aged between 16 and 29 years.
63 © Copyright Rail Safety and Standards Board 2006