Embed Size (px)
Citation preview
University of North DakotaUND Scholarly Commons
Undergraduate Theses and Senior Projects Theses, Dissertations, and Senior Projects
2010
Levee Analysis and Design for Proposed MissouriRefining Co. Petroleum Refinery Site.Matthew Carns
Follow this and additional works at: https://commons.und.edu/senior-projects
This Senior Project is brought to you for free and open access by the Theses, Dissertations, and Senior Projects at UND Scholarly Commons. It hasbeen accepted for inclusion in Undergraduate Theses and Senior Projects by an authorized administrator of UND Scholarly Commons. For moreinformation, please contact [email protected].
Recommended CitationCarns, Matthew, "Levee Analysis and Design for Proposed Missouri Refining Co. Petroleum Refinery Site." (2010). UndergraduateTheses and Senior Projects. 105.https://commons.und.edu/senior-projects/105

GeologicalEngineeringSeniorDesignProject
LeveeanalysisanddesignforproposedMissouriRefiningCo.petroleumrefinerysite.
Matthew Carns
12/2/2010

Table of Contents
Description Page
A. Introduction……………………………………………………………………………………..……………………………1
A.1. Problem Definition………………………………………………………..……………………………………1
A.2. Background……………………………………………………………….……………………………………….3
B. Preliminary Analysis…………………………………………………………….…………………………………………3
B.1. Design Constraints……………………………………………………………………………………………..3
B.2. Design Options……………………………………………………………………………………………………4
B.3. Levee Height Analysis…………………………………………………………………………………………5
C. Laboratory Test Results………………………………………………………………………………………………….7
C.1. Field Observations……………………………………………………………………………………………..7
C.2. Grain Size Analysis……………………………………………………………………………………………..8
D. Final Design Analysis..………………………………………………………………………………………………….…9
D.1. Computer Modeling………………………………………………………………………………………..….9
E. Work Plan for Final Design……………………………………………………………………………………………12
E.1. Plans and Specifications……………………………………………………………………………………11
E.1.A. Levee…………………………………………………………………………………………………….11
E.1.B. Borrow Area……………………………………………………….…………………………………12
E.2. Construction Cost Estimates and Work Schedule.………………….…………………………13

Appendix A Map of Proposed Levee Location
Map of Bore Hole (B‐1) Location Map of Access Road Locations Map of Borrow Areas
Appendix B NRCS Maps and Data Appendix C Flood Recurrence Interval Calculations Appendix D Bore Hole Log Sheet Shelby Tube Log Sieve Analysis for all 6 Samples Hydrometer Analysis for all 6 Samples Grain Size Distribution Graphs for all 6 Samples Appendix E Hydraulic Conductivity Calculations Computer Modeling Results Appendix F Cross Section of Proposed Levee Volumetric Calculations for Levee Appendix G Cost Estimate Project Schedule Appendix H Photographs of Site

1
A. Introduction
A.1. Problem Definition
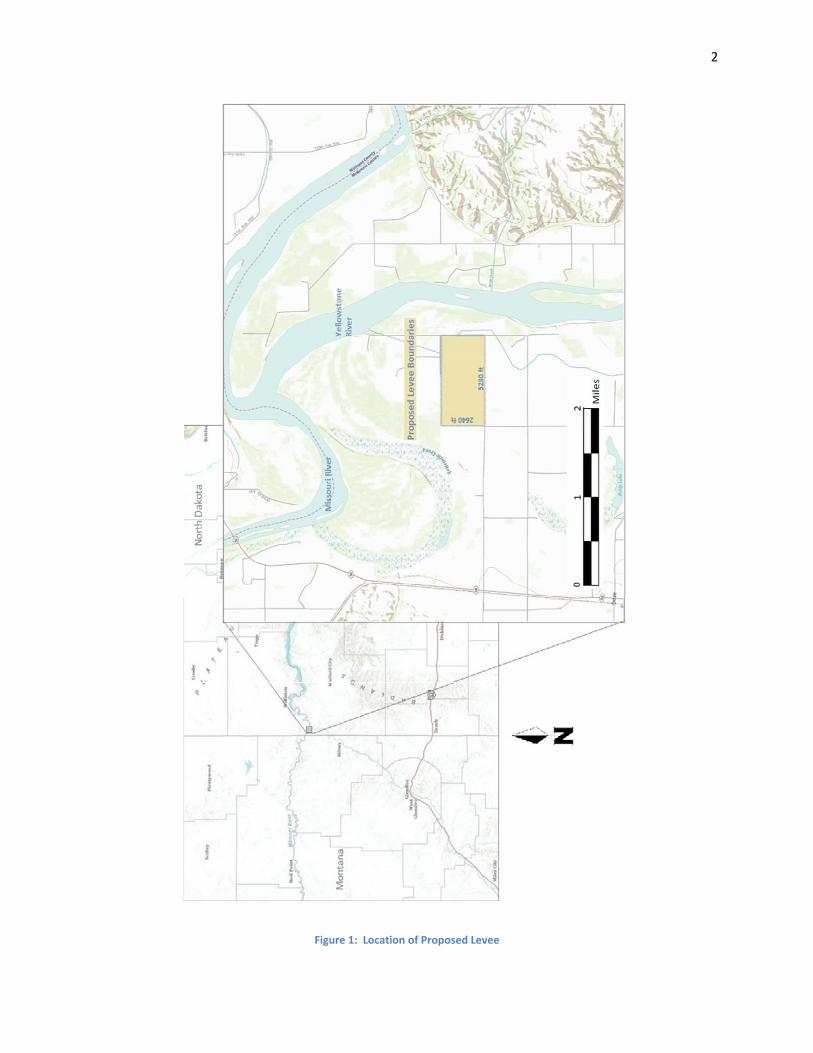
This report is intended to cover the design and construction of a levee around the
proposed Missouri Refining Co. petroleum refinery, see Figure 1 for location. The location is
near the confluence of the Yellowstone and Missouri Rivers in Williams County, North Dakota.
The recent success in extracting unconventional petroleum reserves in the Williston Basin has
led Missouri Refining to consider building the refinery in the area.
With the location so close to the rivers it has been determined that a permanent levee
structure is needed to protect the site from seasonal flooding. The levee will encompass the
site and removable flood walls will be utilized where access roads are needed.
The soil composition and stratigraphy were found to be suitable for levee construction.
The borrow material will be excavated from the site and the undisturbed soil will make a solid
foundation for the levee.
To construct a design the local conditions and how they will affect the site will be
evaluated. These conditions include historical flood levels, soil characteristics, and climatic
influences. A field investigation of the proposed site will be performed so field observations
and soil samples can be collected. Laboratory testing will provide the soil specifications
necessary for the levee design.
2
Figure 1: Location of Proposed Levee

3
A.2. Background
The Yellowstone and Missouri Rivers converge 2 miles north of the proposed location.
The Yellowstone flows northward along the eastern side of the site and the Missouri flows
eastward along the northern side of the site. The Yellowstone River is closer to the proposed
site but a high flood stage in either river could lead to overland flooding of the site.
The proposed location is in an alluvial flood plain. The strata vary from sand to silt to
clay and are layered throughout the upper 5 feet. Below this level the composition is unknown
but it is assumed to also be an alluvial deposit with similar characteristics.
Flooding history of the location will be researched to determine an optimal levee height
to protect the site. This history is limited as the Fort Peck Dam located upstream on the
Missouri was completed in 1940 and the Garrison Dam located downstream was completed in
1953. These two dams were constructed in part to control river levels and lessen flood
intensity. Even with the dams, the rivers have exceeded flood stage numerous times.
B. Preliminary Analysis
B.1. Design Constraints
The area that Missouri Refining wants to protect requires a rectangular levee. The
dimensions are 5280 feet by 2640 feet yielding a total levee length of 15,840 feet. These
4
dimensions are measured along the edge of the landside slope. The area to be enclosed
measures approximately 320 acres.
The site is in the flood plain of both the Yellowstone and Missouri Rivers. The upper soil
strata are comprised of mainly alluvial silts and clays. The upper 60 inches of soil are going to
be the most critical to the design so most of the analysis will be concerned with them. On most
of the site the upper soil is silty clay (CH Unified classification) with some sandy loam areas
(NRCS).
B.2. Design Options
Later analysis and testing has determined the best design for the levee project. The
United States Army Corps of Engineers (USACE) manual EM 1110‐2‐1913 “Engineering and
Design – Design and Construction of Levees” was used as a guideline for the design process.
Erosional factors, slope and foundation stability, seepage control, and possible settlement
issues were also taken into consideration.
The dimensions and components of the levee were also determined after finding soil
specifications and performing computer modeling using the Rocscience software. Components
such as toe drains, drainage ditches, toe trenches, landside berms, drainage layers and a semi‐
permeable core were analyzed and implemented if deemed necessary.
5
The construction of the levee was assessed and broken down into stages. The
techniques that will be used in the construction were also be analyzed. Vegetative cover was
considered and implemented as well where needed.
B.3. Levee Height Analysis
The ground level of the location is 1880 ft MSL. The datum river level for the
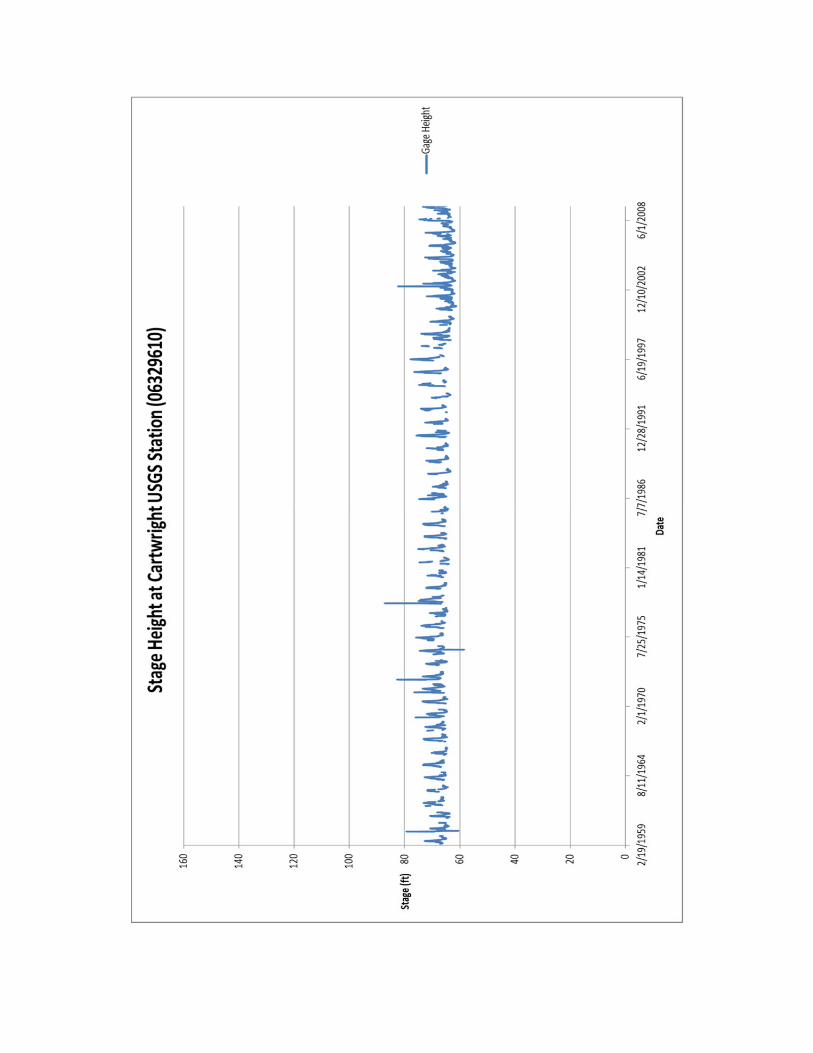
Yellowstone near the site is 1860.54 ft MSL. There are no continuous river level/flow monitors
at the proposed location so the flood levels and stages were taken from the closest USGS
station. This station is located near Cartwright, ND and is approximately 5.5 miles upstream on
the Yellowstone River. The USGS station number is 06329610.
To find the elevation data for the river at the site, information was used from the
Cartwright, ND USGS station and the Williston, ND USGS station. The calculated gage datum
(1796.42 ft MSL) corresponds with the Cartwright, ND gage datum so the stage at that station
can be used exactly with the site gage. Daily gage readings taken by the USGS from 1959 to
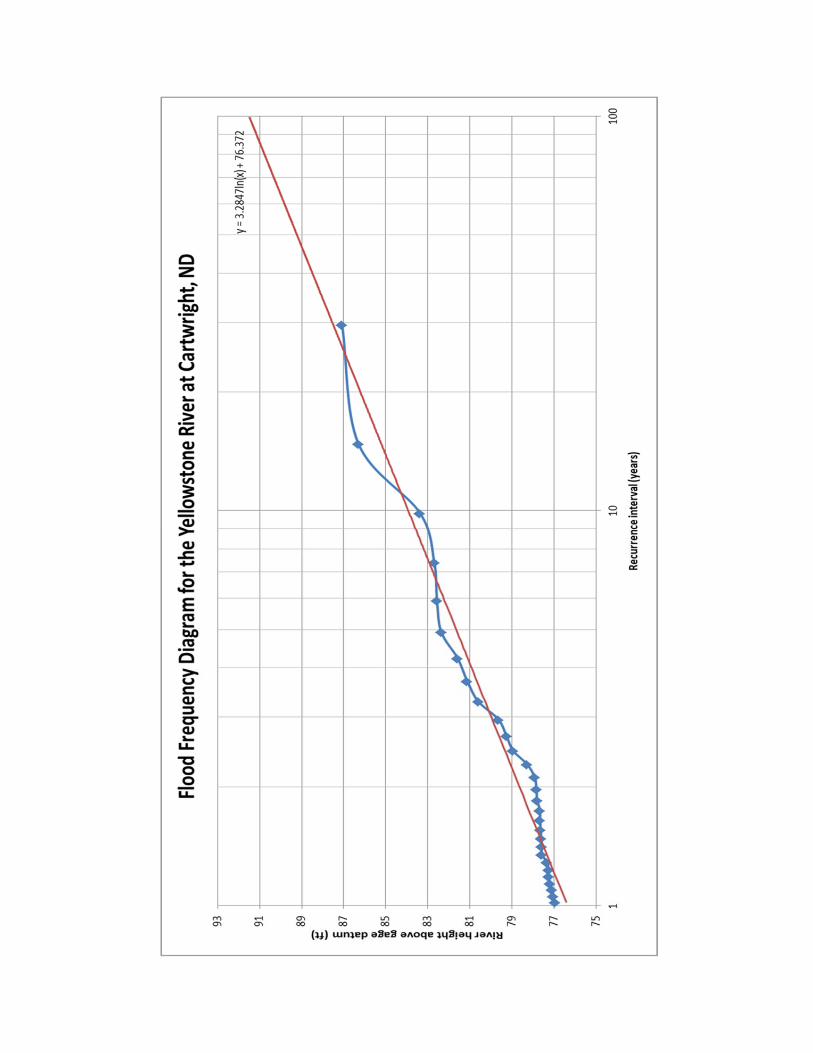
2009 were used to construct a flood frequency diagram to determine the stage of a 100 year
flood, see Appendix C.

6
Figure 2: Flood Frequency Diagram
The recurrence interval for each value was found and values below 1 year were
disregarded. Figure 2 shows the plot of the gage height and recurrence interval on a log scale.
A best‐fit logarithmic line was created and from that the following equation was found.
y(gauge height in ft) = 3.2847*ln(time) + 76.372
This equation yields a gage height for a 100 year flood of 91.5 ft. The actual elevation of this
stage at the site would be 1887.92 ft MSL or 27.38 ft above the datum river elevation.
Thus a 100 year flood would cover the site in almost 8 feet of water (site elevation of
1800 ft MSL). To offer protection against possible future high flood levels the levee will be
constructed to protect against a flood elevation of 1888 ft MSL. The minimum amount of
freeboard required by the USACE is 3 feet. The common allowance for subsidence in semi‐
compacted levees of 10% will be used. The tentative top of the levee is 1892.1 feet MSL
7
factoring in a USACE typical subsidence value of 10%. The height of the levee is going to be
12.1 feet above the ground surface.
C. Laboratory Test Results
C.1. Field Observations
The land that the site is to be constructed on is primarily used for agriculture. There are
a few petroleum production sites and homes in the nearby vicinity. Roads are already in place
for access to the site although they will probably have to be enlarged for heavier traffic. The
vegetative cover in the area is limited to agricultural fields and some stands of trees near the
rivers. The trees are far enough away from the site to not pose a problem with piping.
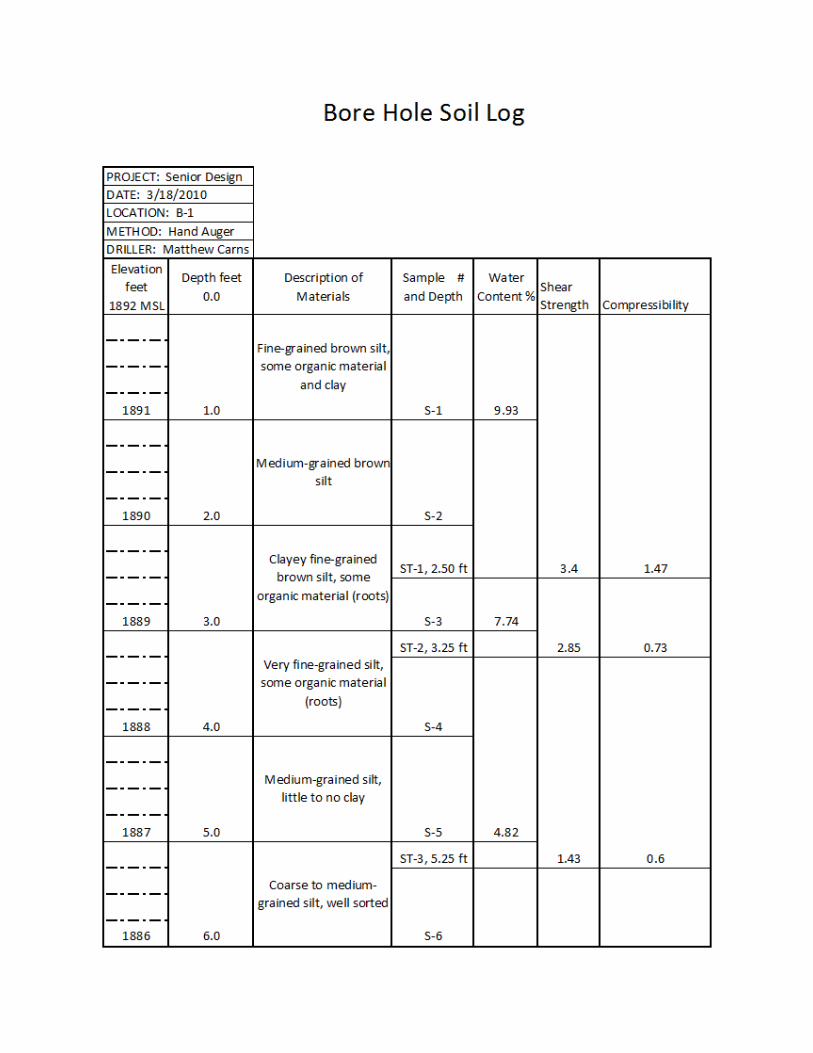
Field samples were collected from a single bore hole along the eastern side of the site
and from a shallow hole on the northwest corner of the site. Appendix A shows the location of
the bore hole (B‐1) which was dug to a depth of 6 feet and the location of the other sample
hole. Samples (S‐1, S‐2, S‐3, S‐4, S‐5, and S‐6) were taken at regular intervals and used for
analysis. The location of the bore hole is at the following coordinates (North 47.94629, West
103.96830).
The samples were immediately logged for initial soil characteristics and then bagged for
lab work. Shelby tube samples (ST‐1, ST‐2, and ST‐3) were collected from 3 intervals and they
were used to determine the shear strength and compressibility of the soil. The shear strength

8
was found using a handheld vane device and the compressibility was found using a pocket
penetrometer.
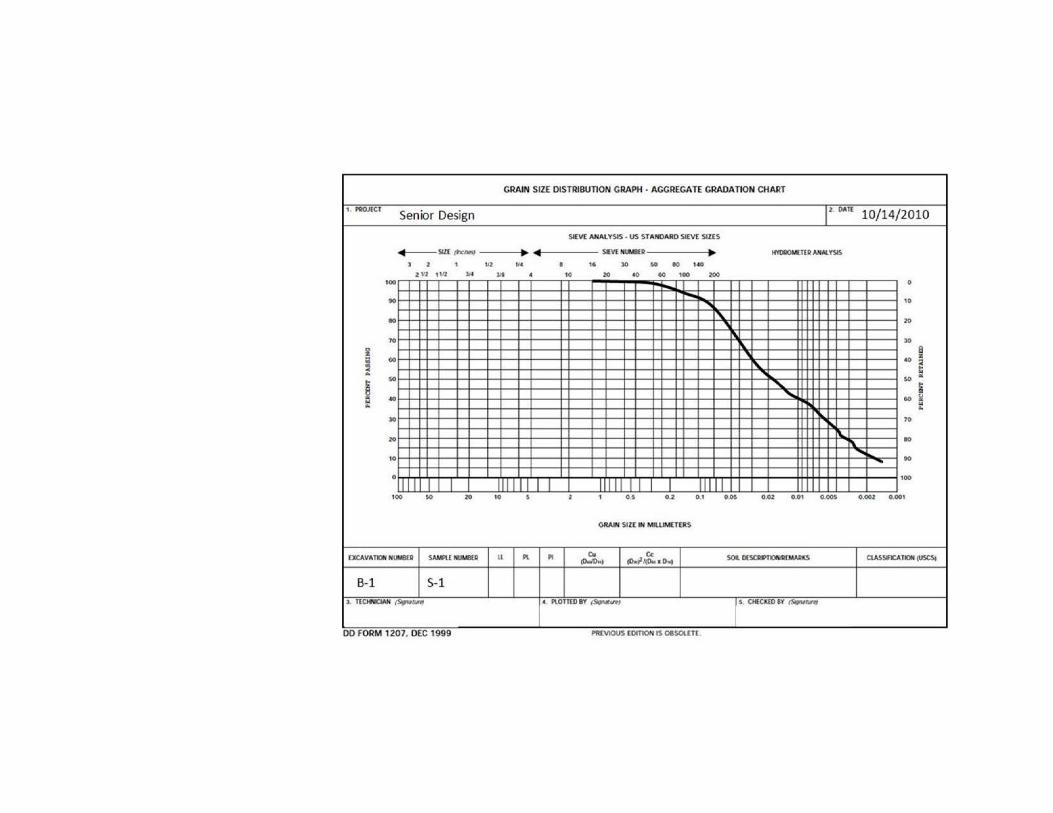
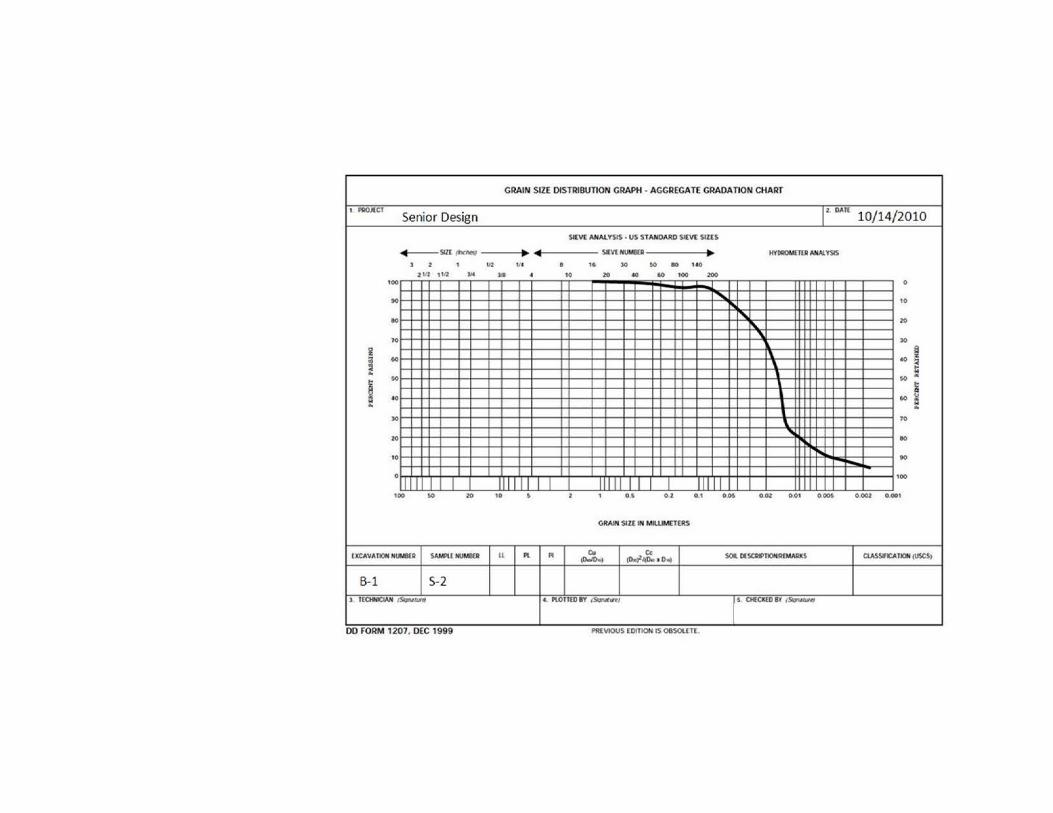
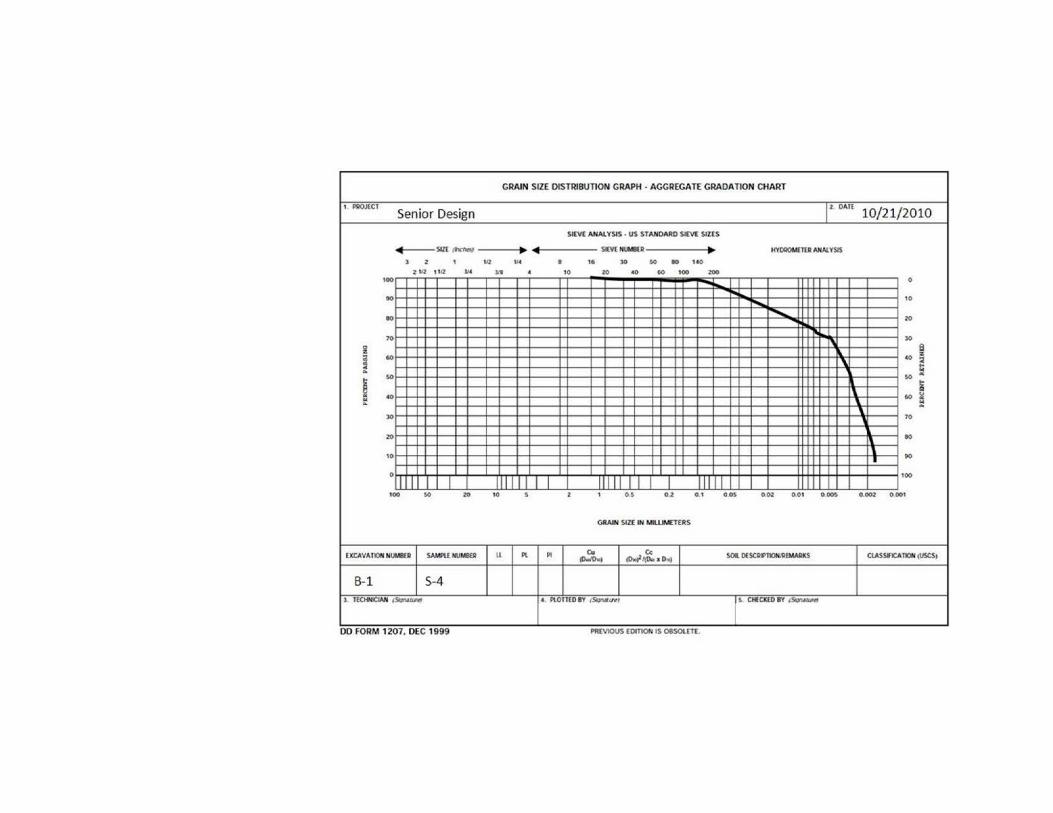
C.2. Grain Size Analysis
Soil characteristics of the area are a vital part of the design of the levee. The location of
the borrow areas for the material to construct the levee is the first and foremost issue. The
intended borrow pits are around the perimeter of the levee. This will reduce the amount of
material hauling and allow for quicker and easier construction. Some sections around the levee
will not be excavated for borrow materials to facilitate road construction and other
utilities/infrastructure.
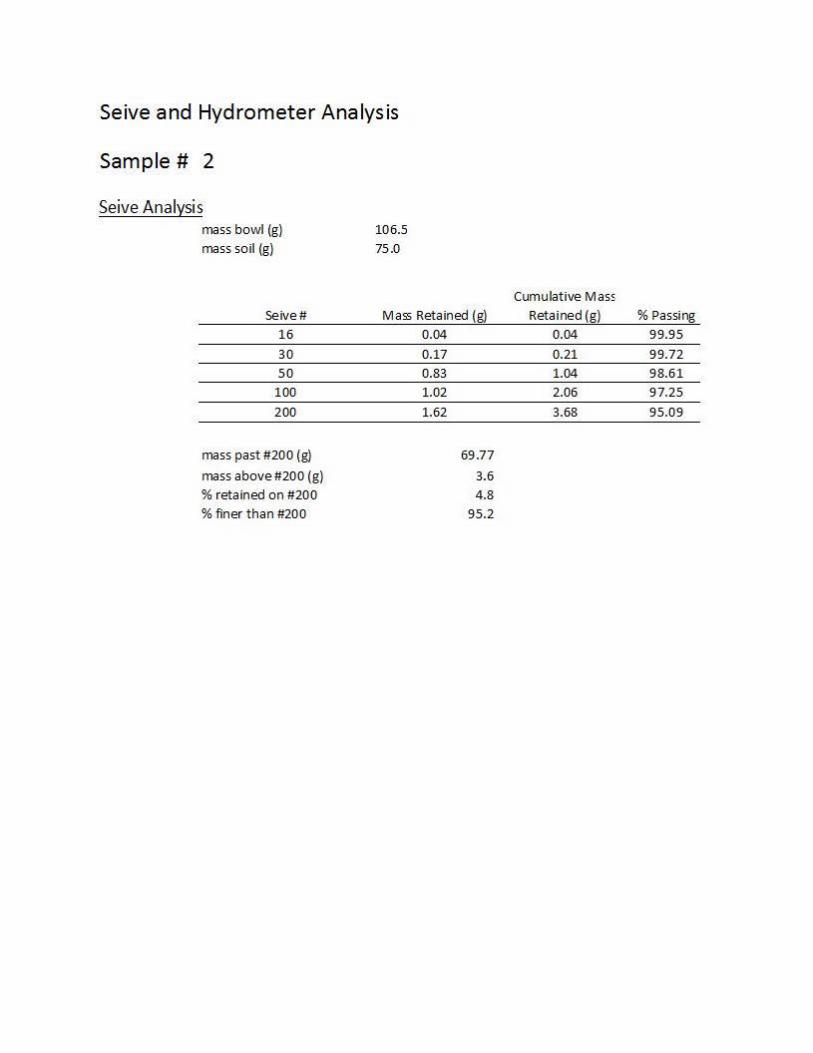
Six samples were used for grain size analysis. These samples are from the borehole that
was dug on the east side of the site and they are from various levels down the hole. Each
sample was sieved initially and then a hydrometer test was performed. The results of these
tests are found in Appendix D.
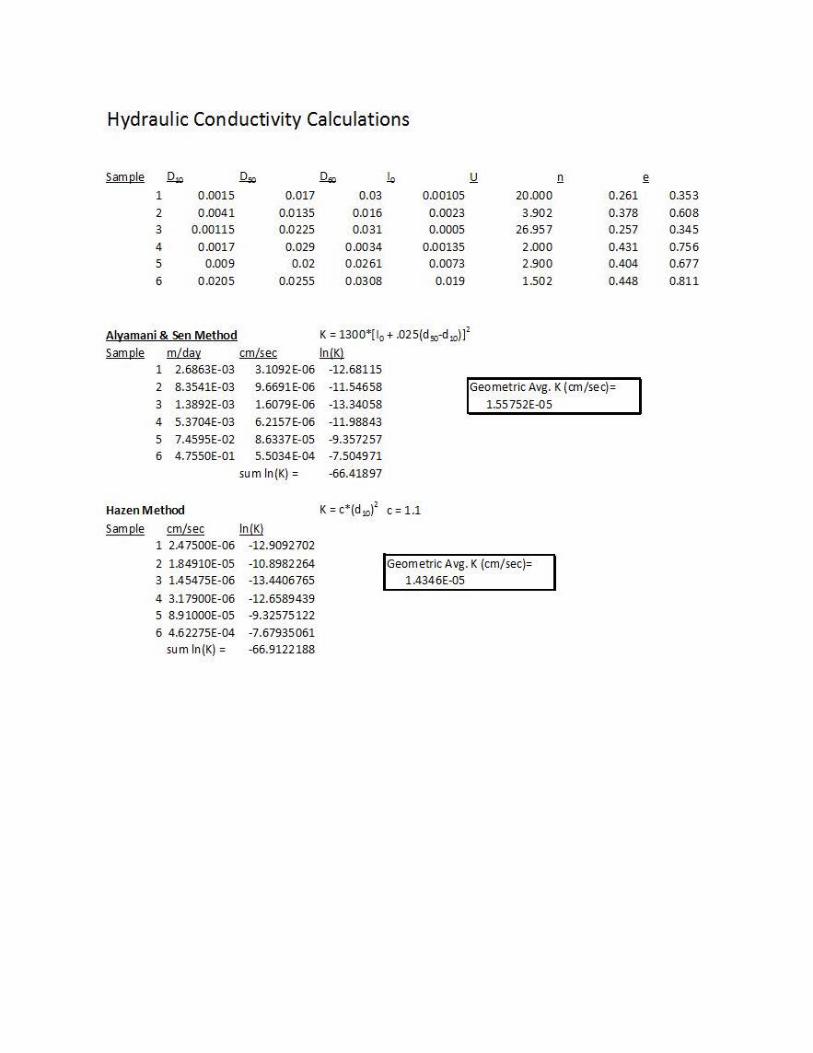
The hydraulic conductivities (K) were found using the grain size distribution graphs. Two
methods of calculating them were used. The primary one is the Alyamani and Sen Method.
The d50 value is the grain size at which 50% of the sample is finer and the d10 is the grain size at
which 10% is finer. The I0 is the x‐intercept of a line drawn between the d50 and d10 values.
K = 1300*[I0 + .025(d50‐d10)]2
9
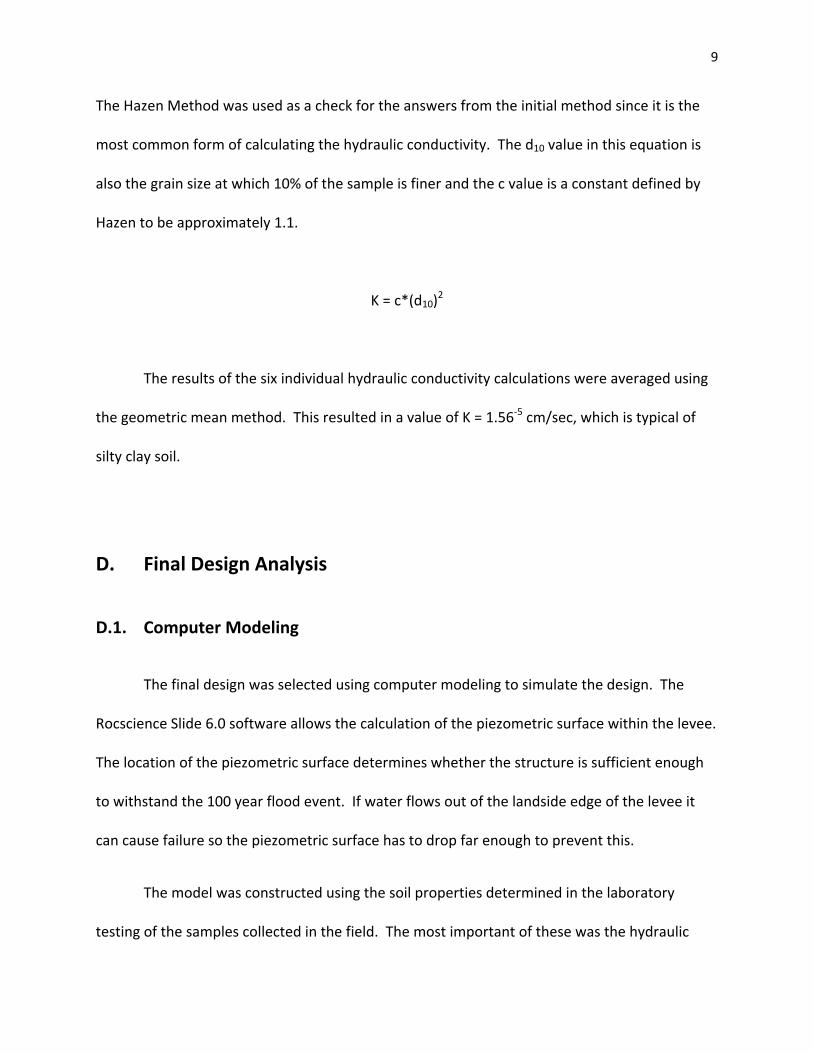
The Hazen Method was used as a check for the answers from the initial method since it is the
most common form of calculating the hydraulic conductivity. The d10 value in this equation is
also the grain size at which 10% of the sample is finer and the c value is a constant defined by
Hazen to be approximately 1.1.
K = c*(d10)2
The results of the six individual hydraulic conductivity calculations were averaged using
the geometric mean method. This resulted in a value of K = 1.56‐5 cm/sec, which is typical of
silty clay soil.
D. Final Design Analysis
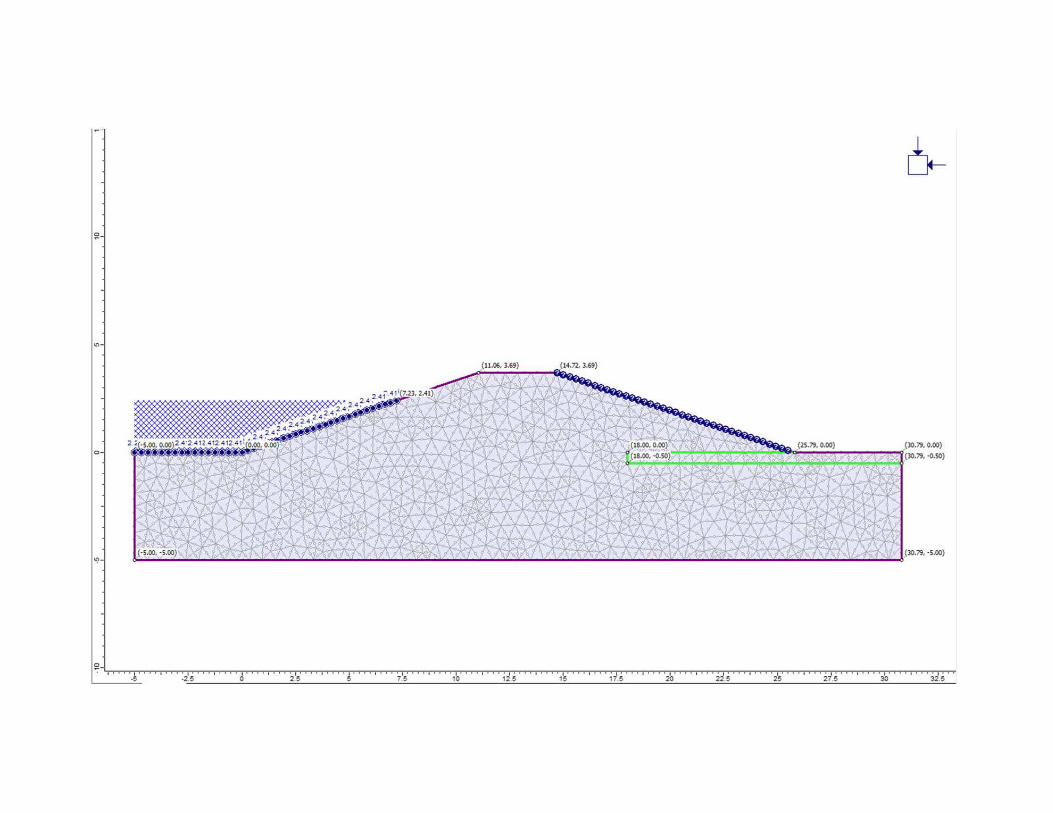
D.1. Computer Modeling
The final design was selected using computer modeling to simulate the design. The
Rocscience Slide 6.0 software allows the calculation of the piezometric surface within the levee.
The location of the piezometric surface determines whether the structure is sufficient enough
to withstand the 100 year flood event. If water flows out of the landside edge of the levee it
can cause failure so the piezometric surface has to drop far enough to prevent this.
The model was constructed using the soil properties determined in the laboratory
testing of the samples collected in the field. The most important of these was the hydraulic

10
conductivity which was averaged between the six values determined experimentally from field
samples. The hydraulic conductivity is the main determinant for the water flow through the
levee and thus controls the majority of the design.
The slope of the levee sides that is best suited to this project is 33.33 degrees or 1:3.
According to the Corps of Engineers manual this allows for vegetation maintenance and ease of
construction. The width of the crest was set at 12 feet which allows vehicle travel for
inspection and maintenance.
The initial analysis was done for a semi‐compacted levee using the hydraulic
conductivity of the underlying soil, which is the same as the borrow material. The result of this
analysis was that another structure would have to be added to the levee to facilitate the
lowering of the piezometric surface to a safe level.
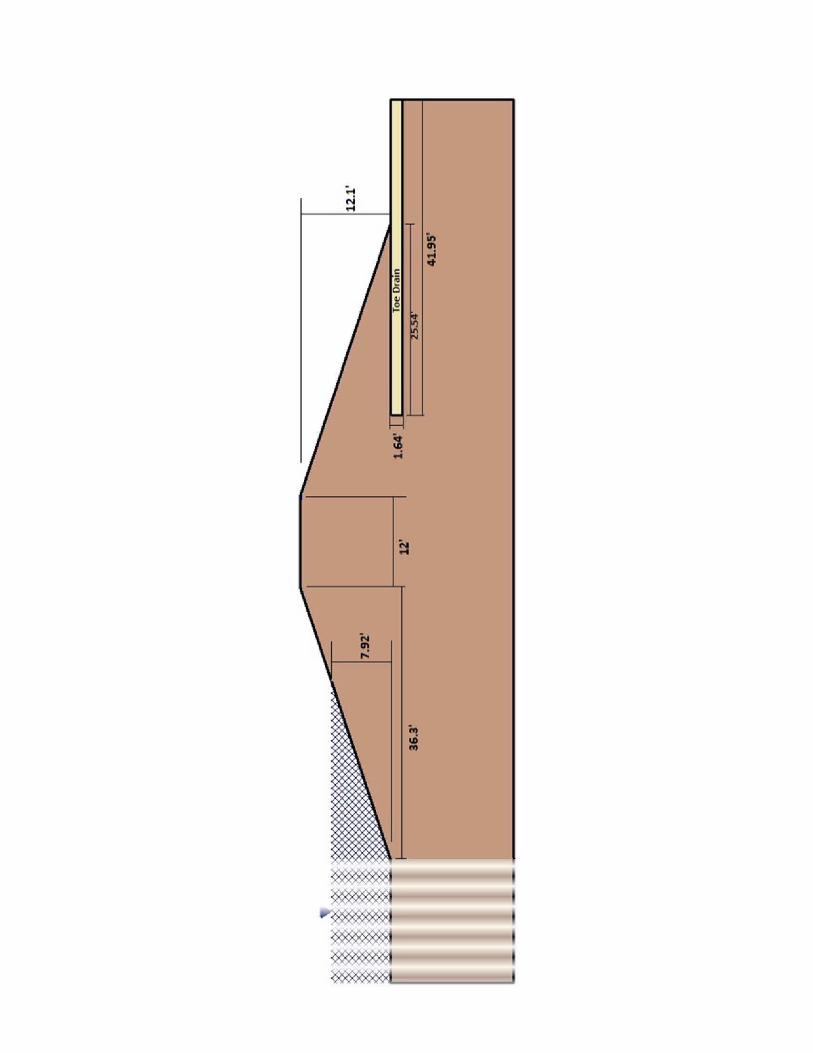
An analysis was done with a toe drain under the landside slope of the levee. The toe
drain measured 1.7 feet thick and 42 feet long. It was placed just below ground level from
25.54 feet from the landside edge of the levee and extended along the base of the levee to
16.41 feet past the landside edge into the protected area. A typical clean sand was the material
selected to be used in the analysis of the toe drain. The hydraulic conductivity of a typical sand
is approximately K = 1 x 10‐1 cm/sec. The result of this analysis was successful and this design
would meet the criteria set forth earlier in the report.

11
E. Work Plan for Final Design
E.1. Plans and Specifications
E.1.A. Levee
Figure 3: Cross Section of Levee
The final cross section for the levee is shown in Fig. 2. These dimensions were chosen
because they meet the design constraints and requirements, they are practical and feasible,
and they follow the guidelines set out by the USACE in the Engineering Manual EM 1110‐2‐
1913.
The final overhead/map view of the levee is shown in Figure 1. These dimensions were
chosen because they also meet the design constraints and requirements, they are practical and
feasible, and they follow the guidelines set out by the USACE in the Engineering Manual EM
1110‐2‐1913.

12
E.1.B. Borrow Areas
The borrow area for the levee construction will be located around the entire levee. It
will begin 50 feet from the base of the riverside toe of the levee, the USACE standard minimum
berm between the borrow pit and the levee toe is 40 feet. Where the access roads are to enter
the levee there will be traverse areas where there is no excavation done for borrow materials.
The traverse width will need to be at the minimum the width of the access road and a stable
slope on either side into the borrow pits.
The depth of the borrow pits will be 5 feet and the slope along the edge will be about 10
degrees or 1:6. To account for compaction the volume of the borrow pits will be approximately
125% of the volume needed for the construction of the levee. This total borrow pit volume is
1.0158 X 107 ft3 or 3.7622 X 10⁵ yd3. If the pit is made 120 feet wide and 5 feet deep around the
levee there will be sufficient building material. Appendix F contains the volumetric calculations
for the borrow areas.
The volume of material needed for the toe drain is 1.0853 X 106 ft3. The source for the
toe drain material will need further investigation. Most of the soils near the levee location are
silt to clay in composition and have too small of a hydraulic conductivity to be of use. One
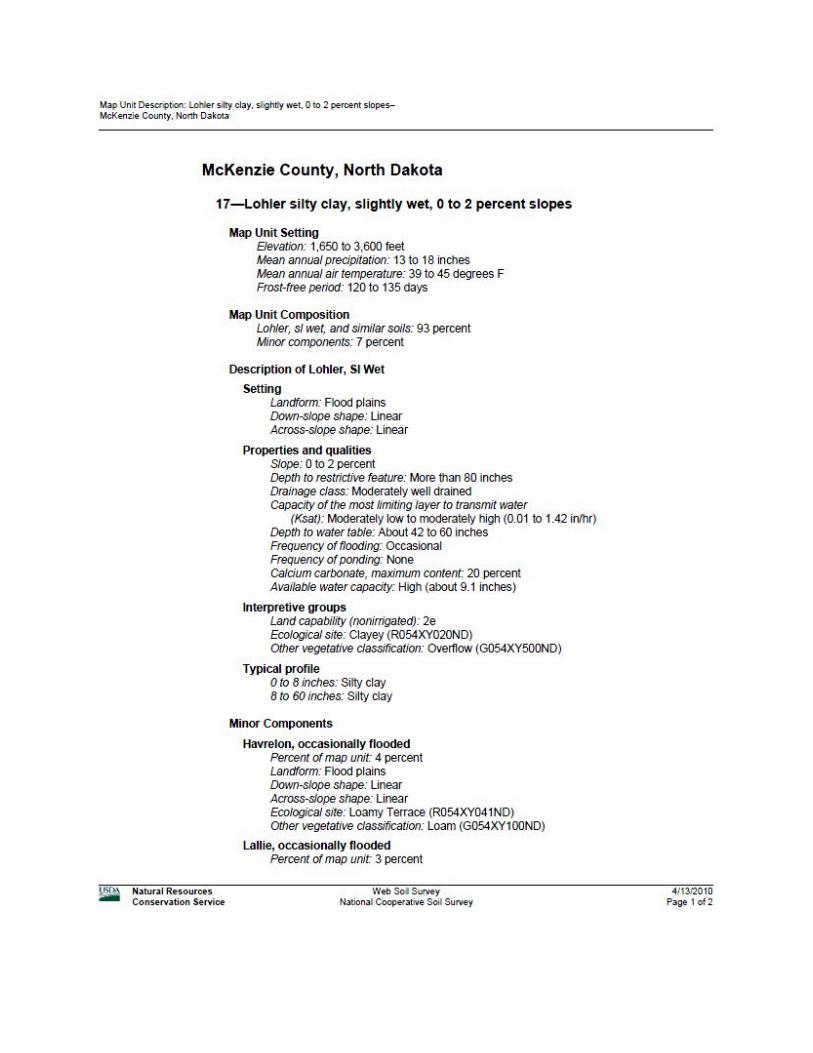
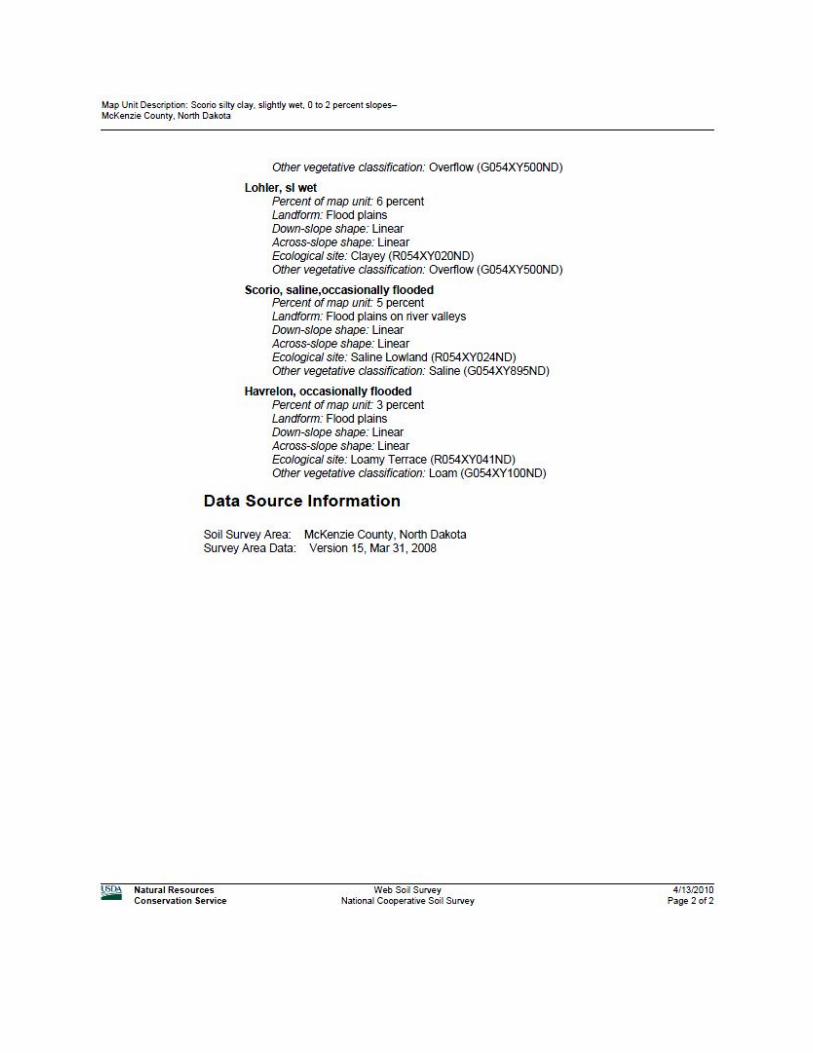
location that was found 1.5 miles southwest of the site may be considered a source pending
field investigation and lab work on the soil. The NRCS classifies the soil as the Seroco‐Lohler
complex and on the soil map its symbol is 10D. Appendix B has the location and info on this soil
and Appendix F has the volumetric calculations.
13
E.2. Construction Cost Estimates and Work Schedule
The R.S. Means construction costing book was used to formulate the estimates for the
cost of the levee and the work schedule. Using the design criteria selected above and the
Means book an estimate of $1.67 million was derived, see Appendix G for a breakdown on the
costs.
This estimate includes all of the site work from stripping the ground to seeding
vegetation onto the finished levee and borrow areas. Built into this estimate is a 25% increase
for inflation (1997 costing values were used) and other contingencies. Other factors that may
influence the estimate are further soil testing and engineering analysis/planning.
The work schedule was determined using the Means book and the calculations for the
various parameters of the levee and borrow areas. A start date of May 1, 2011 gives a
completion date of August 19, 2011. Appendix G contains more information on the work
schedule.

Appendix A
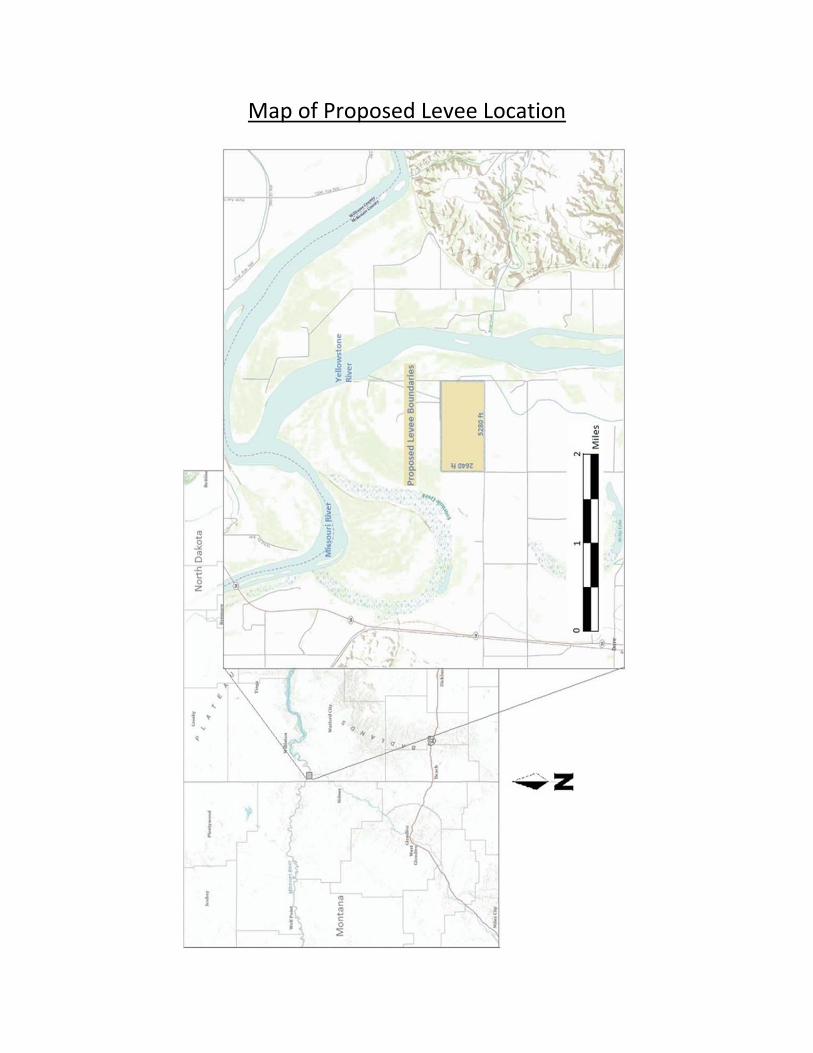
Map of Proposed Levee Location

Map of Bore Hole (B‐1) Location
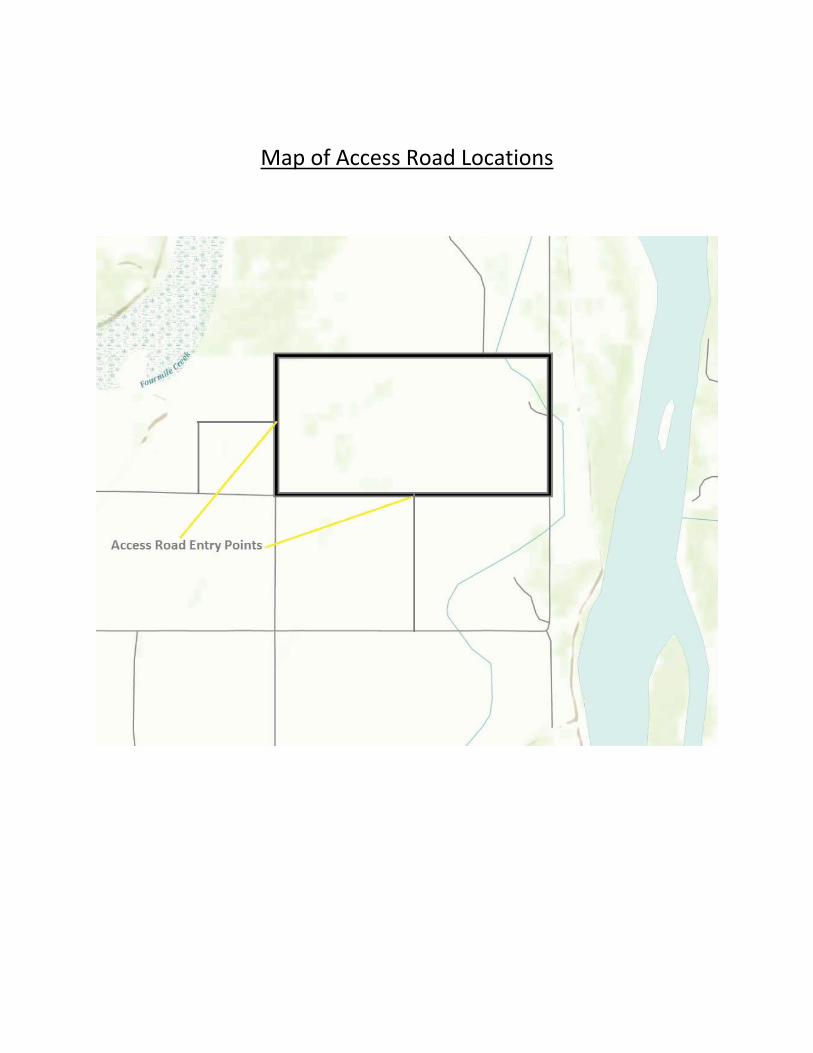
Map of Access Road Locations
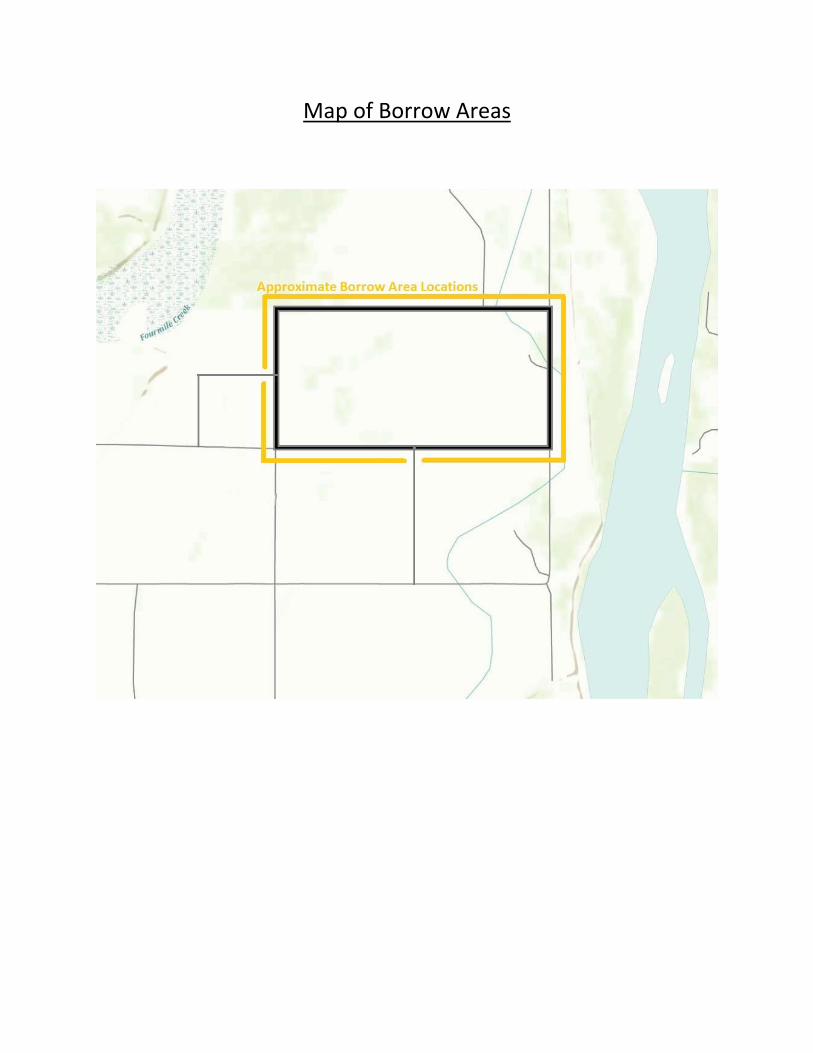
Map of Borrow Areas

Appendix B

Area of Interest selection for NRCS Web Soil Survey near the proposed site.
Area of Interest Unified Soil Classification according to NRCS Web Soil Survey.


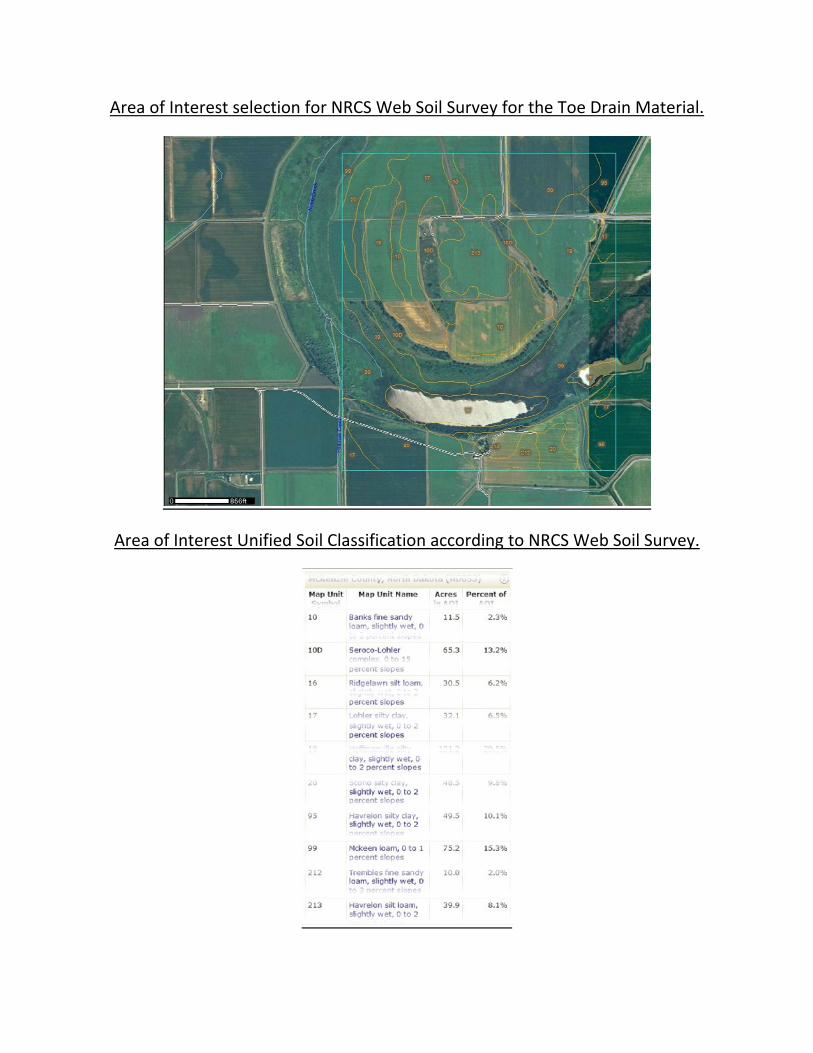
Area of Interest selection for NRCS Web Soil Survey for the Toe Drain Material.
Area of Interest Unified Soil Classification according to NRCS Web Soil Survey.


Appendix C
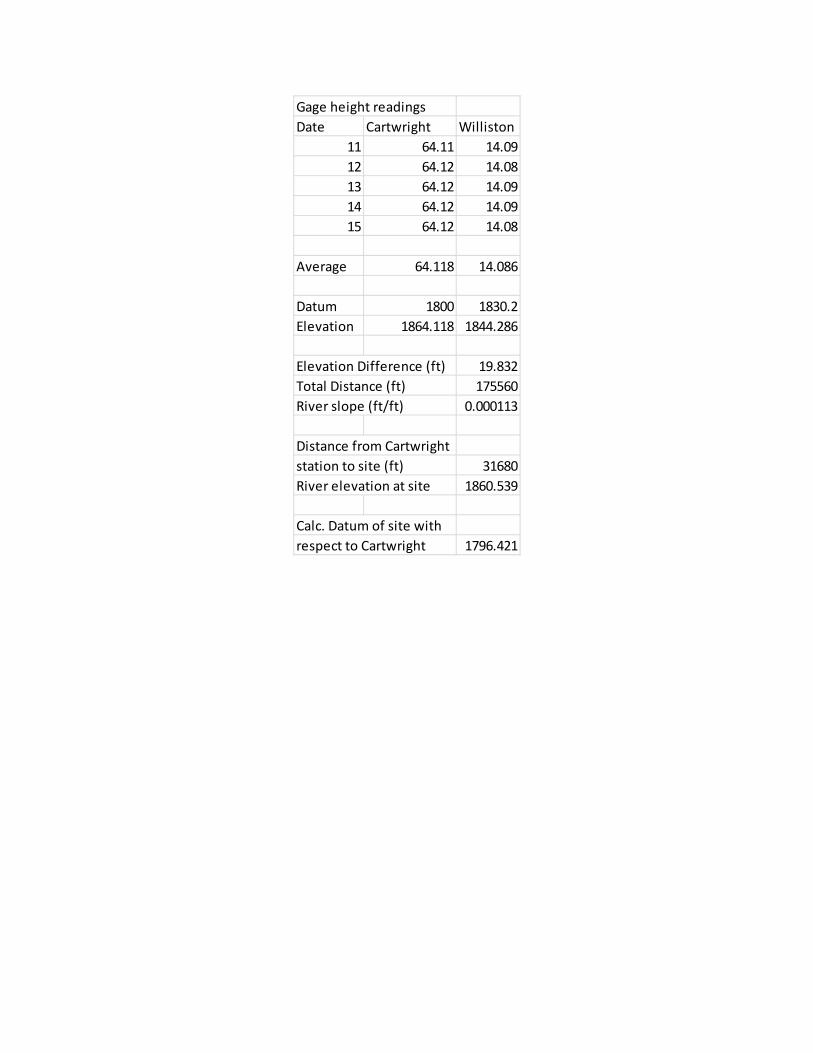
Gage height readings
Date Cartwright Williston
11 64.11 14.09
12 64.12 14.08
13 64.12 14.09
14 64.12 14.09
15 64.12 14.08
Average 64.118 14.086
Datum 1800 1830.2
Elevation 1864.118 1844.286
Elevation Difference (ft) 19.832
Total Distance (ft) 175560
River slope (ft/ft) 0.000113
Distance from Cartwright
station to site (ft) 31680
River elevation at site 1860.539
Calc. Datum of site with
respect to Cartwright 1796.421

Appendix D


Seive and Hydrometer Analysis
Sample# 1
Seive Analysis mass bowl {g)
mass soil {g)
130.5
75.0
Seive II Mass Retained {g)
16 0.08
30 0.22
50 1.05
100 2.94
200 5 .83
mass past 11200 (g) 63
mass above 11200 {g) 10.1
% retained on 11200 13.5
% finer than 11200 86.5
Cumulat ive Mass
Re tained % Passing
0.08 9'9 .89
0.30 9'9.60
1.35 98.20
4.29 9'4.28 10.12 S:6.51
Seive and Hydrometer Analysis
Sample# 2
Seive Analysis mass bowl (g)
mass soil (g)
106.S
75 .0
Se ive II Mass Reta ined (g)
16
30
so 100
200
mass past 11200 (g)
mass above 11200 (g) % reta ined on 11200
% finer than 11200
0.04
0.17
0.83
1.02
1.62
69 .77
3.6 4.8
95.2
Cumulative Mass
Retained (g) % Passing
0.04 99.95
0.21 99.72
1.04 98.61
2.06 97.25
3.68 95.09
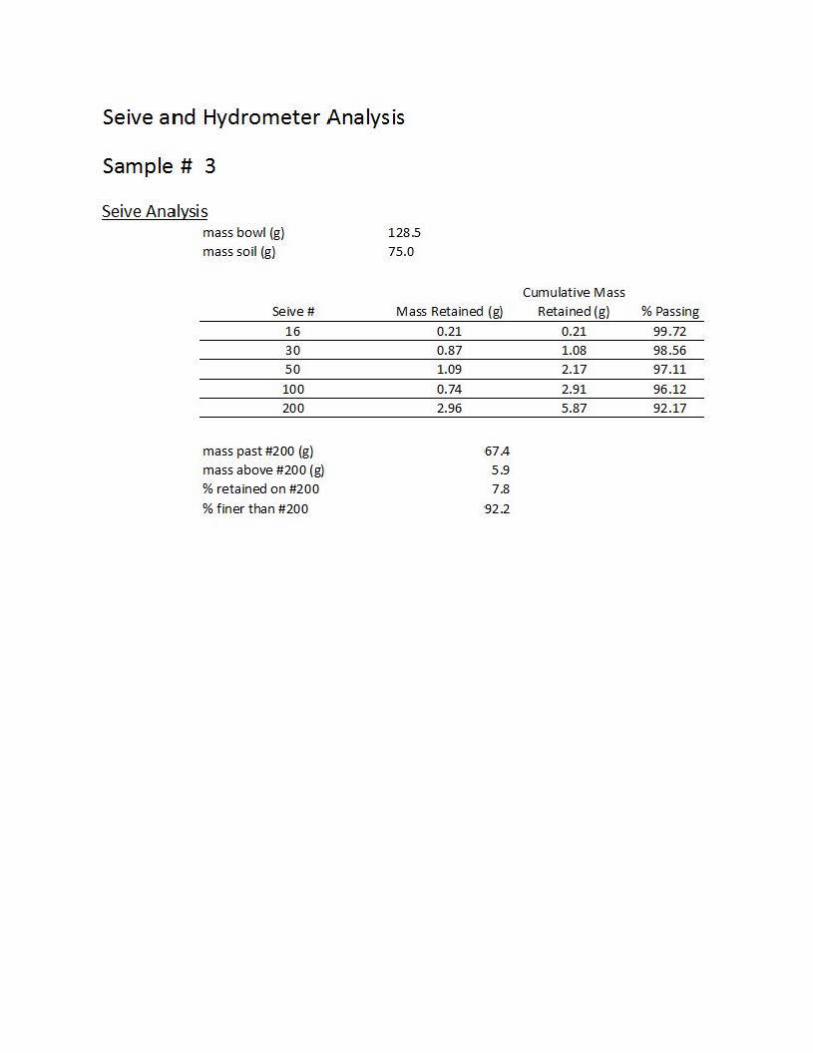
Seive and Hydrometer Analysis
Sample# 3
Seive Analysis mass bowl (g)
mass soil (g) 128.5
75.0
Seive II Mass Reta ined (g) 16
30
50
100
200
mass past 11200 (g)
mass above 11200 (g) % reta ined on 11200
% finer than 11200
0.21
0.87
1.09
0.74
2.96
·67A
5 .9
7.8
92.2
Cumulative Mass
Retained (g) % Pass ing
0.21 99 .72
1.08 98.56
2.17 97.11
2.91 96.12
5.87 92.17
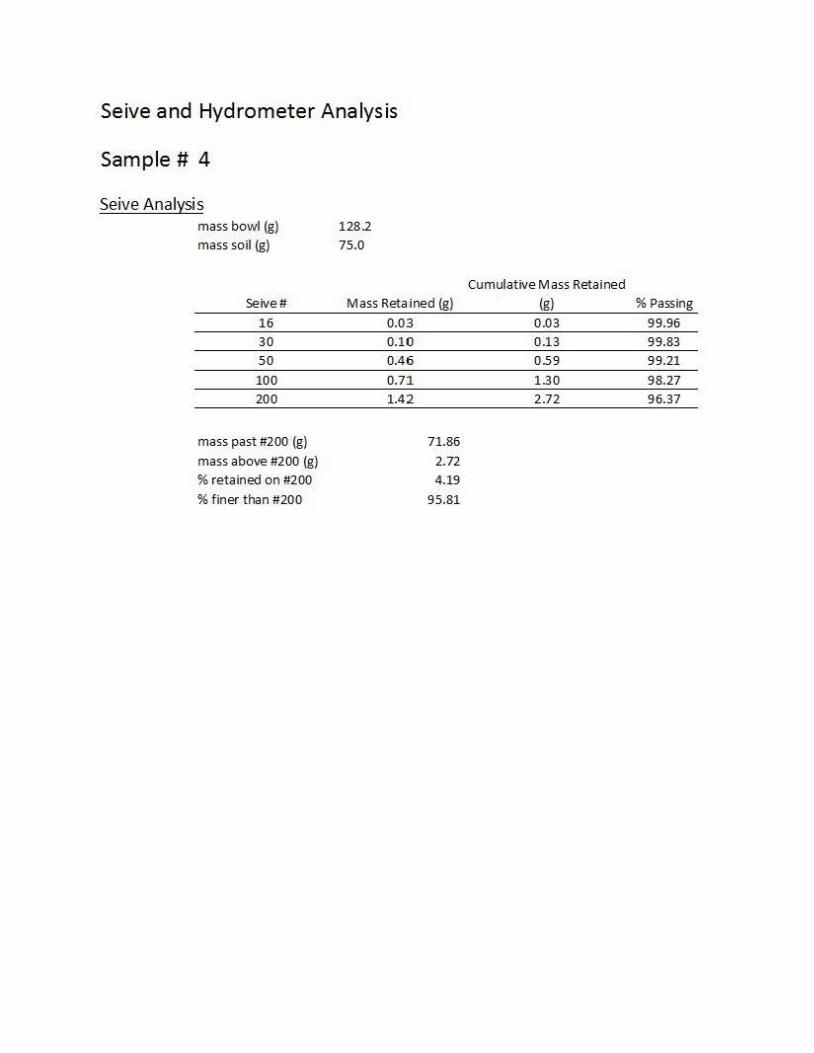
Seive and Hydrometer Ana lys is
Sample# 4
Seive Analysis mass bowl {g) 128.2 mass so il {g) 75.0
Seivell Mass Retained (g)
16 30 so 100 200
mass past 11200 {g)
mass above 11200 (g) % retained on 11200 % finer than 11200
0.03 0.10 0.46
0.71 1.42
71.86
2.72 4.19
95.81
Cumulative Mass Retained {g) % Passing
0.03 99.96 0.13 99.83 0.59 99.21
1.30 98.27 2.72 96.37
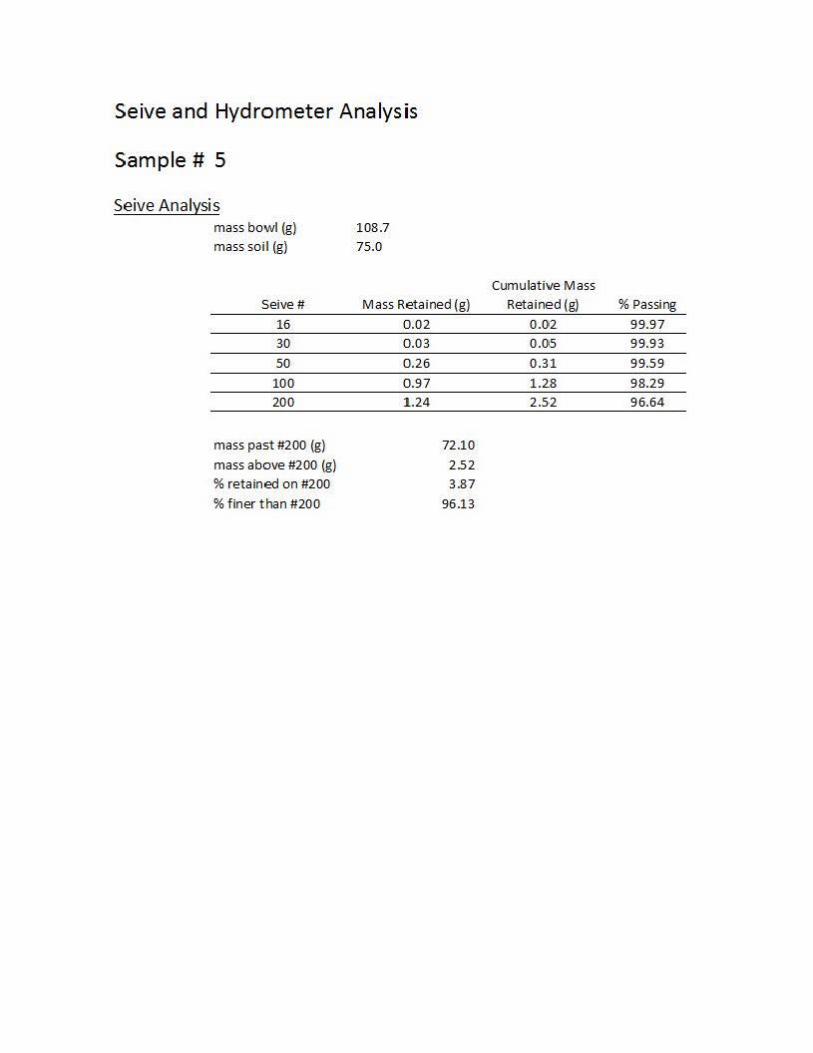
Seive and Hydrometer Ana lys is
Sample# 5
Seive Analysis mass bowl (g) mass so il (g)
108.7
75.0
Seive II Mass Re ta ined (g)
16
30
so 100
200
mass past 11200 (g)
mass above 11200 (g) % retained on 11200 % finer than 11200
0.02
0.03
0.26
0.97
1 .24
72.10
2.52 3.87
96.13
Cumulative Mass Retained (g) % Passing
0.02 99.97
0.05 99.93
0.31 99.59
1.28 98.29
2.52 96.64
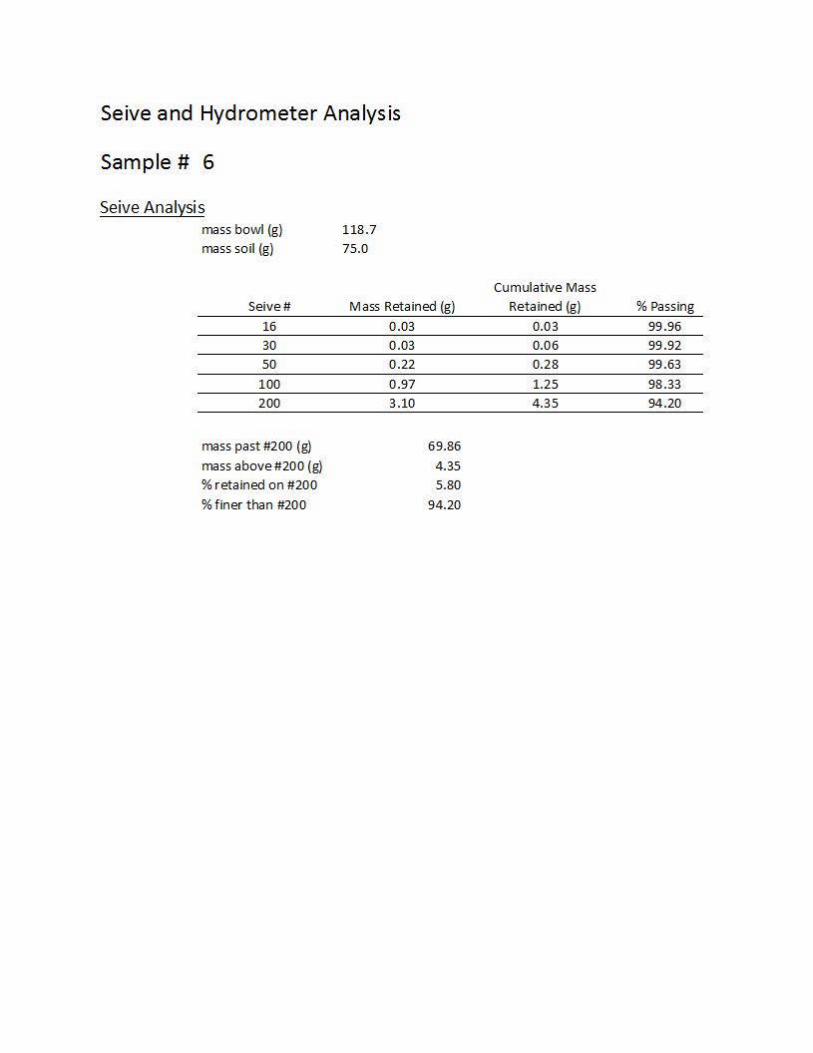
Seive and Hydrometer Analysis
Sample# 6
Seive Analysis mass bowl (g) 118.7
mass so il {g) 75.0
Seive# Mass Reta ined {g) 16
30
so 100
200
mass past #200 {g) mass above #200 (g) % retained on #200
% finer than #200
0.03
0.03
0.22
0.97
3.10
69.86
4.35
5.80
94.20
Cumulative Mass
Retained {g)
0.03
0.06
0.28
1.25
4.35
% Pass ing
99 .96
99.92
99.63
98.33
94.20
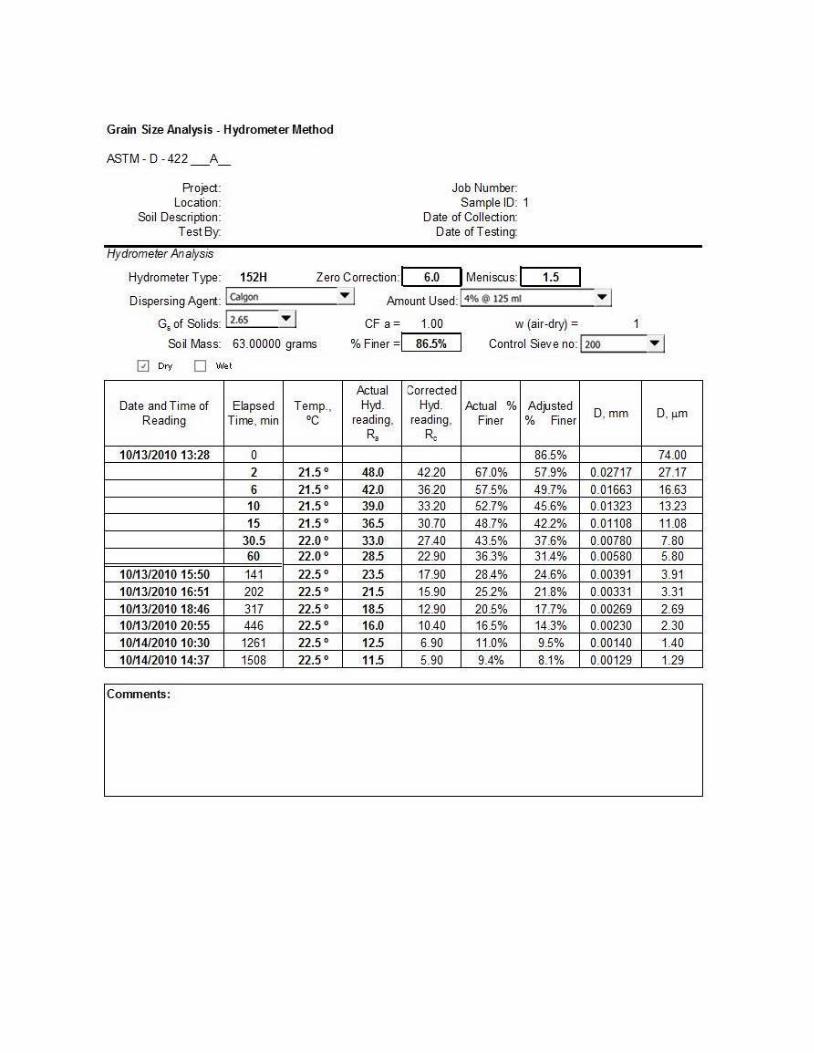
Grain Size Analysis. Hydrometer Method
ASTM-D-422_ A_
Project: Location:
Soil Description: Test By:
Hydrometer Anatjsis
Job Number: Sample ID: 1
Date of Collection: Date ofT esting:
Hydrometer Type: 152H Zero Correction:! 6.0 ! Meniscus:! 1.5
Dispersing Agent:!~ (algon-------..,.- ,1 Amount Used :1 4~@ 125 ml • I G. of Solids: 12·65 • J CF a = 1.00 w (air-dry) =
Soil Mass: 63.00000 grams
0 Dry D Wet
% Finer=! 86.5% Control Sieve no:l=200=======·=J
Actual Corrected Date and Time of Elapsed Temp., Hyd . Hyd . Actual % Ad)Jsted D, mm D, µm Reading Time. min oc reading, reading, Finer % Finer
R. Re 10/13/2010 13:28 0 86.5% 74.00
2 21.5 ° 48.0 4220 67.0% 57.9% 0.02717 27.17 6 21.5 ° 42.0 3620 57.5% 49.7% 0.01663 16.63
10 21.5 ° 39.0 3320 52.7% 45.6% 0.01323 1323 15 21.5 ° 36.5 30.70 48.7% 422% 0.01108 11.08
30.5 22.0 ° 33.0 27.40 43.5% 37.6% 0.00780 7.80 60 22.0 ° 28.5 22.90 36.3% 31.4% 0.00580 5.80
10/13/2010 15:50 141 22.5° 23.5 17.90 28.4% 24.6% 0.00391 3.91 10/13/2010 16:51 202 22.5 ° 21.5 15.90 252% 21 .8% 0.00331 3.31 10/13/2010 18:46 317 22.5 ° 18.5 12.90 20.5% 17.7% 0.00269 2.69 10/13/2010 20:55 446 22.5° 16.0 10.40 16.5% 14.3% 0.00230 2.30 10/14/2010 10:30 1261 22.5 ° 12.5 6.90 11.0% 9.5% 0.00140 1.40 10/14/2010 14:37 1508 22.5 ° 11.5 5.90 9.4% 8.1% 0.00129 1.29
Comments:
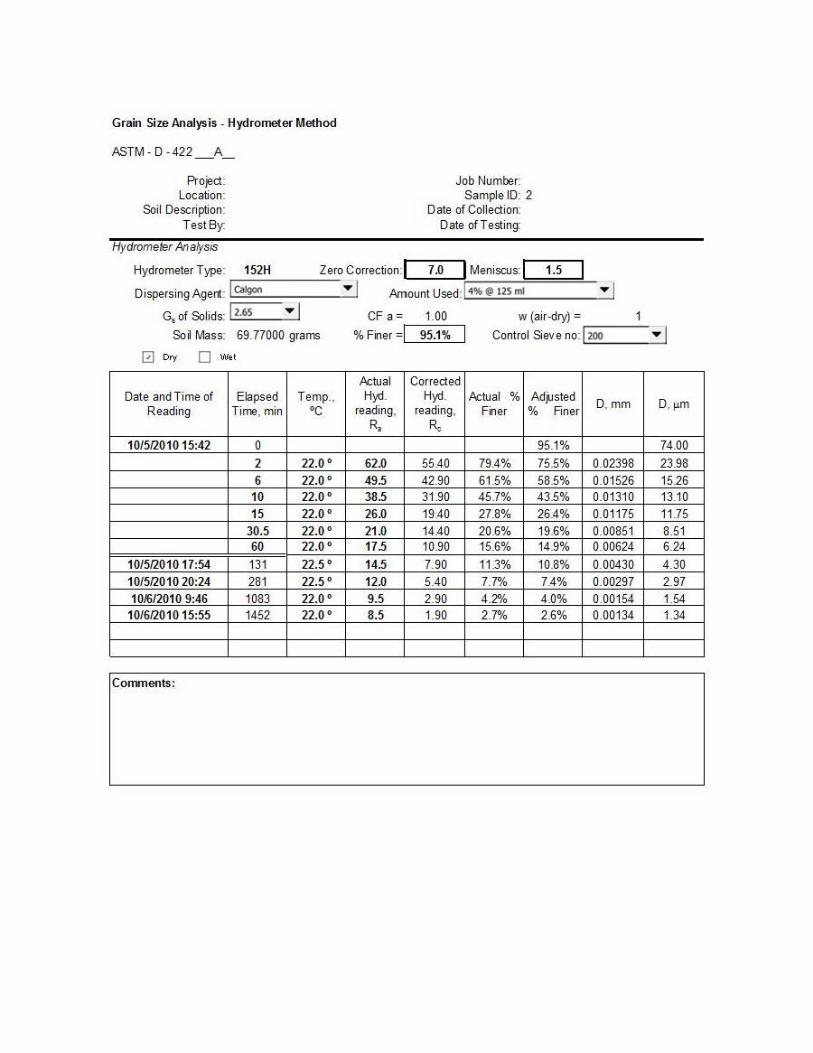
Grain Size Analysis . Hydrometer Method
ASTM - D -422 _ A_
Project : Location:
Soil Description: Test By
Hydrometer Analysis
Job Number: Sample ID: 2
Date of Collection: Date ofT esting:
Hydrometer Type: 152H Zero Correction:! 7 .0 ! Meniscus:! 1.5
Dispersing Agent : r! caigon-------. 1 Amount Used:i._ 4 .... %;...;@;...;;.;;12.;;..S __ mi _____ •_,!
G. of Solids: ! 2.6s • J CF a = 1.00 w (air-dry) =
Soil Mass: 69. 77000 grams % Finer =I 95.1% Control Sieve no: ,...j 200----. J
0 D,y O Wet
Actual Corrected Date and Time of Elapsed Temp., Hyd . Hyd . Actual % Ad;.,sted D, mm D, µm Reading Time. min •c reading, reading, Finer % Finer
Ra Ro 10/5/201015:42 0 95.1% 74.00
2 22.0° 62.0 55.40 79.4% 75.5% 0.02398 23.98 6 22.0° 49.5 42.90 61 .5% 58.5% 0.01526 1526
10 22.0 ° 38.5 31.90 45.7% 43.5% 0.01310 13.10 15 22.0° 26.0 19.40 27.8% 26.4% 0.01175 11.75
30.5 22.0° 21.0 14.40 20.6% 19.6% 0.00851 8.51 60 22.0° 17.5 10.90 15.6% 14.9% 0.00624 6.24
10/5/201017:54 131 22.5° 14.5 7.90 11.3% 10.8% 0.00430 4.30 10/5/2010 20:24 281 22.5° 12.0 5.40 7.7% 7.4% 0.00297 2.97 10/6/2010 9:46 1083 22.0 ° 9.5 2.90 4.2% 4.0% 0.00154 1.54
10/6/201015:55 1452 22.0° 8.5 1.90 2.7% 2.6% 0.00134 1.34
Comments:
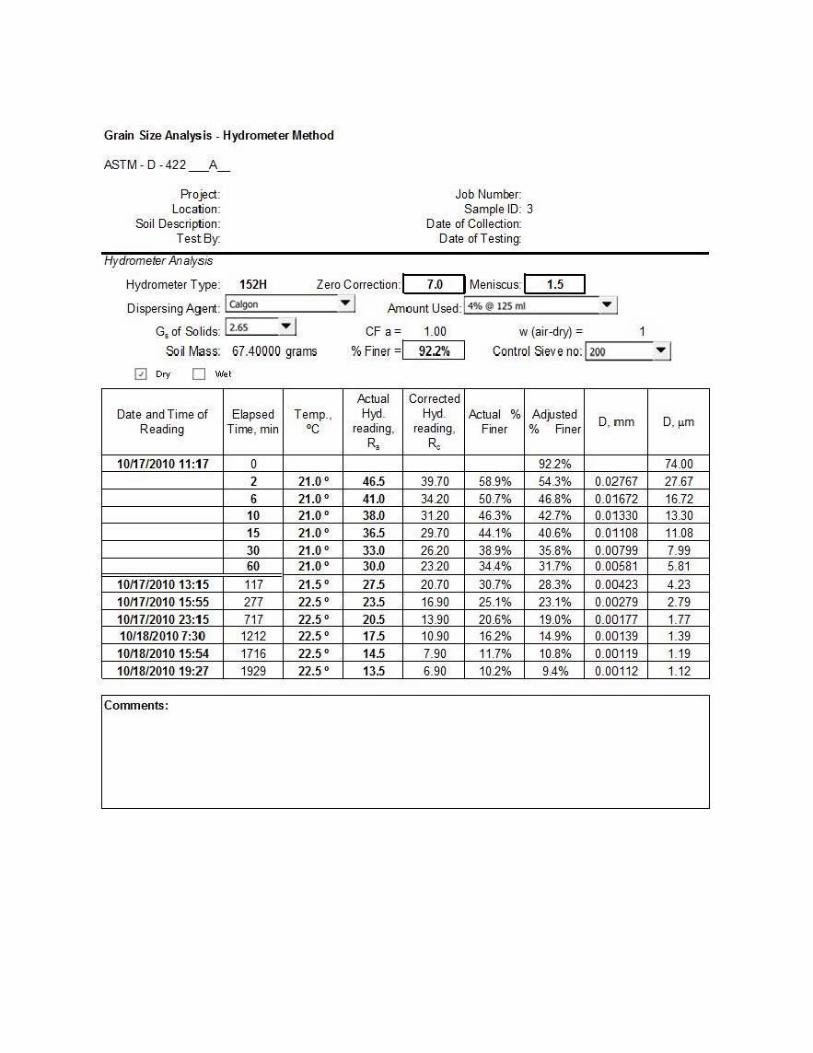
Grain Size Analysis - Hydrometer Method
ASTM- D -422 _ A_
Project: Location:
Soil Description: Test By:
Hydrometer Analys is
Job Number: Sample ID: 3
Date of Collection: Date ofT esting:
Hydrometer Type: 152H Zero Correction:! 7 .0 ! Meniscus:!
Dispersing Agent: r-1 Qlgon------.... , Amount Used:._! 4-'%-'@""'1;;;;25;..m_1 _____ .... ..,!
1.5
G. of So lids: J 2.65 "" ] CF a= 1.00 w (air-dry) = 1
Soil Mass: 67.40000 grams % Finer =r-1 _9_2_2_%~ Control Sieve no:j,... 200----.... - I 0 Dry O Wet
Actual Corrected Date and Time of Elapsed Temp., Hyd. Hyd. Actual % Ad;.tsted D, mm D, µm
Reading Time. min oc reading, reading, Finer % Finer R, R.
10/17/2010 11:17 0 922% 74.00 2 21.0 ° 46.5 39.70 58.9% 54.3% 0.02767 27.67 6 21.0 ° 41.0 3420 50.7% 46.8% 0.01672 16.72
10 21.0 ° 38.0 3120 46.3% 42.7% 0.01330 13.30 15 21.0 ° 36.5 29.70 44.1% 40.6% 0.01108 11.08 30 21.0 ° 33.0 2620 38.9% 35.8% 0.00799 7.99 60 21.0 ° 30.0 2320 34.4% 31.7% 0.00581 5.81
10/17/2010 13:15 117 21.5 ° 27.5 20.70 30.7% 28.3% 0.00423 4.23 10/17/2010 15:55 277 22.5 ° 23.5 16.90 25.1% 23.1% 0.00279 2.79 10/17/2010 23:15 717 22.5 ° 20.5 13.90 20.6% 19.0% 0.00177 1.77 10/18/2010 7:30 1212 22.5 ° 17.5 10.90 162% 14.9% 0.00139 1.39 10/18/2010 15:54 1716 22.5 ° 14.5 7.90 11.7% 10.8% 0.00119 1.19 10/18/2010 19:27 1929 22.5° 13.5 6.90 102% 9.4% 0.00112 1.12
Comments:

Grain Size Analysis - Hydrometer Method
ASTM - D -422 _ A_
Project : Location:
Soil Description : Test By:
Hydrometer Anao/sis
Job Number: Sample ID: 4
Date of Collection: Date ofT esting:
Hydrometer Type: 152H Zero Correction:! 7 .0 ! Meniscus:! 1.5
Dispersing Agent : ~, Ca- lgon-------,..- 1 Amount Used: ... 14-"%-'@'-1"'25'-m'-1 _____ •_,! G. of Solids: i 2·65 • I CF a = 1.00 w (air-dry) =
So ii Mass: 71.86000 grams
0 Dry D Wet
% Finer =I 96A% Control Sieve no:1=2=00======·=1
Actual Corrected Date and Time of Elapsed Temp., Hyd . Hyd . Actual % Adj.,sted D, mm D, µm Reading Time, min •c reading, reading, Finer % Finer
Ra Ro 10/20/2010 17:56 0 96.4% 74.00
15 23.5 ° 63.0 56.70 78.9% 76.0% 0.00869 8.69 30 23.5° 60.5 5420 75.4% 72.7% 0.00614 6.14 45 23.5 ° 585 5220 72.6% 70.0% 0.00502 5.02 60 23.5 ° 57.0 50.70 70.6% 68.0% 0.00438 4.38 159 23.5° 47.0 40.70 56.6% 54.6% 0.00302 3.02 259 23.5 ° 38.5 3220 44.8% 432% 0.00255 2.55
10/21/2010 10:56 1020 23.5 ° 10.5 4.20 5.8% 5.6% 0.00156 1.56
Comments:
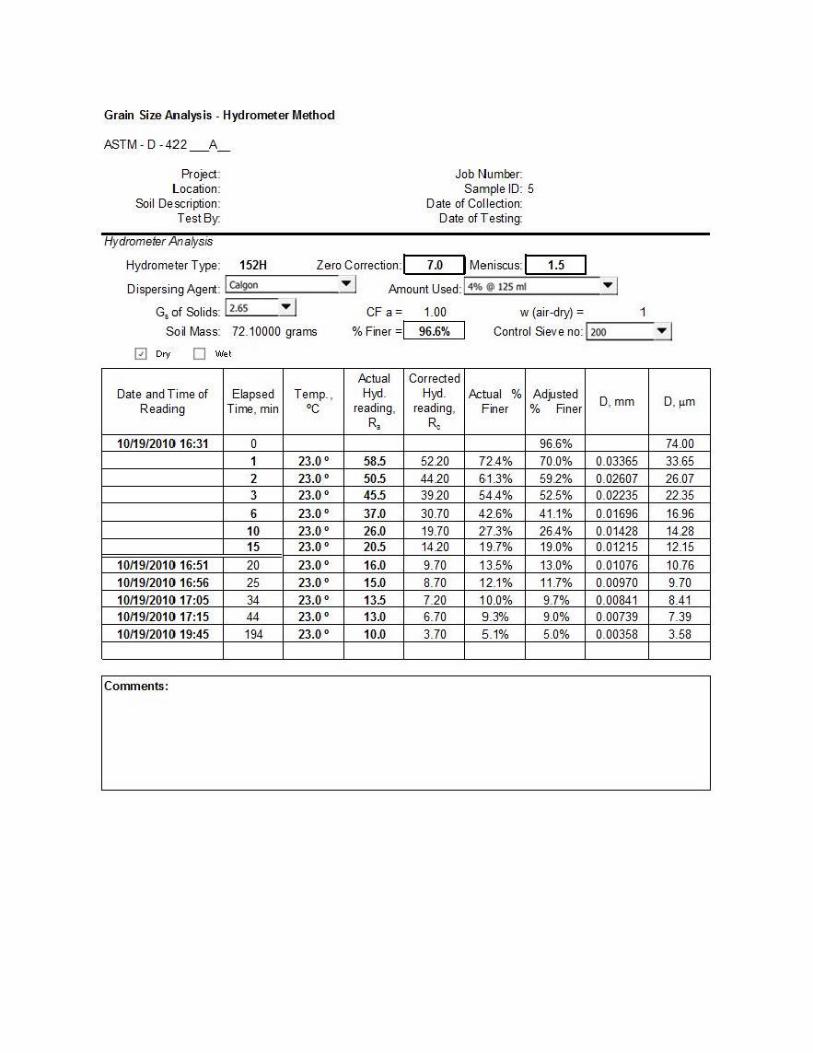
Grain Size Analysis. Hydrometer Method
ASTM- D -422_ A_
Project : Location:
Soil Description: Test By:
Hydrometer Anaf)tsis
Job Number: Sample ID: 5
Date of Collection: Date of Testing:
Hydrometer Type: 152H Zero Correction:! 7 .0 ! Meniscus:! 1.5
Dispersing Agent :!~ (:algoo-------..,.-1 Amount Used:._! 4_% __ @ __ 1_25_m_1 _____ • ... I G. of Solids: ! 2.6s • I CF a = 1.00 w (air-dry) = '1
Soil Mass: 72.10000 grams % Finer=! 96.6% Control Sieve no: !~2-00---,.. I 0 Dry O Wet
Actual Corrected Date and Time of Elapsed Temp., Hyd . Hyd . Actual % Adj.,sted D, mm D, µm Reading Time. min oc reading, reading, Finer % Finer
R, Ro 10/19/2010 16:31 0 96.6% 74.00
1 23.0 ° 58.5 5220 72.4% 70.0% 0.03365 33.65 2 23.0 ° 50.5 4420 &1.3% 592% 0.02607 26.07 3 23.0° 45.5 3920 54.4% 52.5% 0.02235 22.35 6 23.0 ° 37.0 30.70 42.6% 41.1% 0.01696 16.96
10 23.0 ° 26.0 19.70 27.3% 26.4% 0.01428 1428 15 23.0 ° 20.5 1420 19.7% 19.0% 0.01215 12.15
10/19/2010 16:51 20 23.0 ° 16.0 9.70 13.5% 13.0% 0.01076 10.76 10/19/2010 16:56 25 23.0 ° 15.0 8.70 12.1% 11.7% 0.00970 9.70 10/19/2010 17:05 34 23.0 ° 13.5 7.20 10.0% 9.7% 0.00841 8.41 10/19/2010 17:15 44 23.0 ° 13.0 6.70 9.3% 9.0% 0.00739 7.39 10/19/2010 19:45 194 23.0 ° 10.0 3.70 5.1% 5.0% 0.00358 3.58
Comments:

Grain Size Analysis . Hydrometer Method
ASTM- D -422 _ A_
Project : Location:
Soil Description: Test By:
Hydrometer Analjtsis
Job Number: Sample ID: 6
Date of Collection: Date ofT esting:
Hyd'rometer Type: 152H Zero Correction:! 7 .0 ! Meniscus:! 1.5
Dispersing Agent : r! calgoo--------.,. , Amount Used:,_! 4_%;..@;..;.;12;.;.5...;m_, _____ •_,!
G. of Solids: 12·65 • I CF a= 1.00 w (air-dry) = Soil Mass: 69.86000 grams % Finer =I 94.2% Control Sieve no:Jr200---- .... -I
0 Dry O Wet
ktual Corrected Date and Time of Elapsed Temp., Hyd . Hyd. k tual % Adj.,sted D, mm D, µm Reading Time, min •c reading, reading, Finer % Finer
R, Ro 10/19/2010 16:09 0 94.2.% 74.00
:2 23.0° 46.5 40.20 57.5% 542% 0.02705 27.05 4 23.0 ° 28.0 21.70 31.1% 29.3,% 0.02228 2228 <6 23.0 ° 13.5 7.20 10.3% 9.7% 0.02002 20.02 ,8 23.0 ° 10.5 4.20 6.0% 5.7% 0.01765 17.65 10 23.0 ° 9.5 3.20 4.6% 4.3% 0.01589 15.89 15
Comments:
CRAIN SIZE DISTRIBUTION GRAPH · AGGREGATE GRADATION CH ART
1 PIIOJICI Senior Design
2 DAI£ 10/14/2010
SIEVE AHAL YSIS • US STAHDAAO SIEVE SIZES
~ SIZ( (tfclJff/ r ~ SllVl 1111,18(R r H"lllllOMC1U -\'SIS
) 2 1 112 ... e 16 )0 50 80 .. o ? Vl 1112 "' lit • 10 20 ,o 00 100 200
100 0 - -to ...._ 10
80 1,
20
' 'NI ' )0
i " II " ; 00
'Iii. ,o a . .. 50 ll .. 'I
~ so
'" ~ ....... .. .., oo II .. ~ .. .. JO
"" 70
I.. 20
' 80
""' 10 ""'
to
0 100
I I I I I I I 11 I I I II I 100 >O 20 10 • l 1 OS 02 0.1 oos 0,02 001 o.oos 0 .002 0.001
()RAIN SIZC IN MILUMCTCRS
ClCCAVATION NUMBER s.o.wl(- u Pl Pl Cu Cc sot. DESCIIPTIOlt111MARKS CIM5IJICAIION (I/SCSI Cl),,ll),,j co,.,'"°".°"'
8-1 S-1 >- nc.- 1'9grrll1J.N1 • PlOlltO IY /9onlfv,/ I ' tl*Cl((l) ev ,s,,,,,,..,,
DO FORM 1207, DEC 1999 PRCVIOUS EOITION IS 08SOlETI.
GRAIN SIZE DISTRIBUTION GRAPH · AGGREGATE GRADATION CHART
I PROJlCT Senior Design Z. DAIE 10/14/2010
SIEVE ANAl.YSIS • US STANOAltO SIEVE SIZES
.---Silt (hcllff!I .. ~ SIEVI NUMBCR ;:. -CRANAI.YSIS
J l I Ill t/1 • " )0 >O IO 140
2 VJ 1112 ,.. 1/t • 10 lO 00 60 100 200 100 0
to ......
10 ~
IO ~
20 \..
' 10 )0
i ' a
; 60
' 00 ;
t .. I >O ..
~ >O
~ 00 60 ~ .. .. .. :,0
I
' 70
'II 20 .. IO
"' 10 r- --- IO
0
I I I I I I 11 I I I I I I 100
100 >O 20 ,o 5 z I 0~ oz 0. 1 o.os 002 o.o, o= oooz 0001
GRAlH SIU 1H MIU.-TERS
IXCAVAl'IOH H~~ SAMPlI NUMBCR u Pl Pl Cu tO..r~ , D .. SOI. D£SCIIIP110N.1l1MA11Jt5 ClASSR:A TIOII (\ISCS) tl),,/l),o)
8-1 S-2 J ICCHNICIAH ,_,,,,, 4. PlOI IUl IY ISloNtu•J 15 CHECIC!ll 8Y - -
DD FORM 1207, DEC 1999 PRCVIOUS CllfflON IS 08SOUTC.

CRAIN SIZ_E DISTRIBUTION GRAPH· AGGREGATE GRADATION CHART
I PIIOJICf Senior Design Z. DAIE 10/18/2010
SICvt ANAlVSIS • U$ STANOARO Sl£\IC SIZES
.-Sll[(hc- ... ~ SICVC-.R ~
tffl)QOM£1U AHAL YSIS
• 2 1 1n 114 • .. JO so 00 140 z ,n ,v2 ,,,
:l.'I • 10 20 ,o eo 100 200 100 0
go .. '
10
00 ' 20
10 )0
¥ l a ' ;a eo 40 ~
~ t .. 1, 50 ..
n so - ~ 40 ' eo ii .. .. .. .. IIO "' ... ..... 20
' 00
10 '" 00
0
I I I I I I I I I I I I I I 100
100 "° 20 10 s 2 I OS o.z 0.1 0 -~ 002 0.01 0- 0002 o.oo•
GIWN SIZC 1H MR.UMCTERS
EXCAVAl'IOfl N-R SAMF\J. NUi.a:R ll Pt Pl Ou Cc ~ CCSC111'110fi.11CMAIIKS CIASSlrlCAflOH (USCSJ ll),olO..I 40-,i~.o"'
B-1 5-3 >. UCHNICWI 15iolv,,.,. 4 PtOIIEDBY /SIINl<HI S atlCIUD IY ,-..,,.
DO FORM 1207. DEC 1999 PREV10VS EOITION IS 06SOlET[
GRAIN SIZE DISTRIBUTION GRAPH· AGGREGATE GRADATION CHART
1 PIIOJCCr
Senior Design 'l OATI 10/21/2010
SIEVE AHAlYSIS • US STANOIIRO SIEVC SIZES
.-Sill /~ . ~ SICYC NUlaJt ~
H'll)q()M(f[II AHAl YSIS
l 2 1 112 114 • ,. lO IO IO uo 2112 ,uz ... Sit • 10 IO 40 60 100 200
100 0 ~- ... IO -. 10
,.__ IO IO
70 lO , i a ;a 60
' 40 2
= IO 5 . I '° l ti
40 \ '° ¥ ' :: ' lO 10
20
' IO
10 I
IO I
0
I I I I I I I I 11 I II I 100
100 IO 20 10 s l I OS o.z 0.1 a.as 0.02 001 0.00,, 0.002 0.001
GIWN Sil( IN r.w.lJMETERS
LXCAVAllON NUMllCR SAMU NUMIICII ll Pl Pl Cu Cc SOil O(S(Rllf10N!IIIMAIIKS CIASS,-ICA 1lOII (\ISCSI
'°"'°"' to,,.Z/tOoo • D'4
B-1 S-4 l IECINCIAN /9CN/UVf 4 PlOIILD II'/ /SloNfu,/ r ~ CHllRO II'/ /SlotvlA,,t
00 FORM 1207, DEC 1999 PMV10US EOITION IS 06SOLCTC.

Appendix E
Hydraulic Conductivity Ca lculations
Sample 12.o 12.o 12.o lo 11 n 1 0.0015 0.017 0.03 0.00105 20.000 0.261
2 0.0041 0.0135 0.016 0.0023 3.902 0.378 3 0.00115 0.0225 0.031 0.0005 26.957 0.257
4 0.0017 0.029 0.0034 0.00135 2.000 0.431 5 0.009 0.02 0.0261 0.0073 2.900 0.404
6 0.0205 0.0255 0.0308 0.019 1.502 0.448
Alyamani & Sen Method K = 1300*[10 + .025(d.,,-d10) )2
Sample m/day cm/sec !n1.!Q 1 2.6863E-03 3.1092E-06 -12.68115
2 8.3541E-03
3 1.3892E-03
9.6691E-06 -11.54658
1.6079E-06 -13.34058 Geometric Avg. K (cm/ sec) =
1.55 752E-05 4 5.3704E-03 6.2157E-06
5 7.4595E-02 8.6337E-05
6 4.7550E-01 5.5034E-04
sum ln(K) =
Hazen Method
Sample cm/sec ln(K) 1 2.47500E-06 -12.9092702
2 1.84910E-05 -10.8982264 3 1A5475E-06 -13.4406765
4 3.17900E-06 -12.6589439 5 8.91000E-05 -9.32575122
6 4.62275E-04 -7.67935061
sum ln (K) = -66.9122188
-11.98843
-9.357257 -7.504971
-66.41897
K= c*(d10)2 c = l.1
Geom etric Avg. K (cm/ sec)= 1.4346E-05
g
0.353
0.608 0.345
0.756 0.677
0.811
b-5!-
.,_
o -(30.~. 0.00)
c 1~ ; ·- · " · i'c:io.~. -o.so>
"1 -~,,,. ----, - ---., ,r '\.U.'l'tT"'\UQ.Y""-"Y"'T'' ,, "'\HTOV'(T""-T'\i'"lr ,r,v'IIINbOU.\F""lV',fl ,, 'T"Y"'"'''' 1r,,,,....,.v,,.,c,u, ,,,.,,r,T"I.Y"'"IT"llYV?G.Y~oa., ,1Y<.:T"'I.T,,,.....r,,v"l.1 ,.,,T,11srouv~ ~(30.7'9, ·5.00}
51-..,....,.._ ~ . . ~.~. ~ .. ~.~. ~ .. ~.~- ~ .. ~.~~- ~. ~ .. ~.~. ~ . . ~.~. ~ .. ~.~-~ .. ~.~-~. ~ .. ~.~. ~ .. ~.~. ~ .. ~.~- ~ . . ~.~. ~ .. ~.~-~. ~ .. ~.~. ~ .. ~.~~-~- ~ .. ~.~- ~ .. ~.~.~. ~ .. ~.~. ~ . . ~.~. ~ .. ~.~- ~ .. ~.~- ~ .. ~.~-~. ~ . . ~,~. ~ .. ~.~. ~ . . ~.~- ~ .. ~.~- ~ .. ~.~-~. ~ .. ~.~- ~ .. ~.~- ~ .. ~.~.~ . . ~.~-~. ~ . . ~.~- ~ .. ~.~- ~ .. ~.~- ~ .. ~.~- ~
.5 -2.5 0 2.5 5 7.5 10 12.5 15 17.5 20 22.5 25 27.5 30 32.5

'!!~I
;~
51-I
"l ~
"'.)- 1
Pressure Head
I "' -2. 50 -2. 00 -1.50 -1. 00 11---i - 0 . 50 o.oo 0 . 50 1. 00 1.50
I L-...J 2 . 00 2 . 50 3 . 00 3 . 50 4 . 00 4 . 50 5 . 00 5 . 50 6 . 00 6 . 50 7 . 00 7 . 50
···· ·1·· ·· ···· ·1···· -7.5 .5 ... , .. . , ...... .. , .... , ... .
4 5 0 2 5 • . I'' ' ' I'
5 •• ,. •• 1 •
75 ~
10 '' ' I'' ' ' I '
12 5 ...............
15 , • • • I ••• I '' !'''' I ,,, I '''' I '
175 20 22 5 .-.--,.---.-
25 ' I ' ''' I' •• , •••• • .••• • •·•• 1 · ··· , • • ••
275 30 32 5

~-
g_
.,_
o-
")-
g_
~ ' • ' ' I ' • • ' d I • ' ' ' 5 • • • ' I ' 10 ~ I ' ' ' ' 20
~
( 30.79, 0.00)
;. .. ~ ~'.!..""'- ~ ~" '"~ .!:...'j,(30,79, -0 .50)
l,(30.79, ·5.00)
~ I • ' ' ' 30 ' ' ' • I ' ' ' • 31!


Appendix F

Volume Borrow Material (per unit foot of levee)
V’ = Area of levee – area of toe drain
V’ = (36.3*12.1)+(12.1*12)‐(1.64*41.95)
V = 515.63 ft2*ft
Total Levee Length
L = Perimeter – Flood Walls
L = (5280*2)+(2640*2)‐(40*2)
L = 15,760 ft
Total Volume of Earthen material for levee
V = Volume per unit foot * levee length
V = (515.63 + 68.8) * 15760
V = 9.2106 x 106 ft3
V = 3.4113 X 10⁵ yd3
Volume of Toe Drain
V = Volume per unit foot (toe drain) * levee length
V = 68.8 * 15760
V = 1.0843 X 106 ft3
V = 4.0159 X 10⁴ yd3
Volume of Borrow Areas
V = (Total Levee Volume – Toe Drain Volume)*125%
V = (9.2106 x 10⁶ ‐ 1.0843 X 106)*125%
V = 1.0158 X 107 ft3
V = 3.7622 X 10⁵ yd3
Levee Area
A = 84.6 * 15760

A = 1.3333 X 106 ft2
Borrow Area
A = 180 * [15760 + (84.6 * 4)]
A = 2.8976 X 106 ft2
Total Area
A = 1.3333 X 10⁶ + 2.8976 X 10⁶
A = 4.2309 X 106 ft2
Total Volume to be stripped before construction, top 12” of topsoil will be stripped and stockpiled from
the base of the levee and the borrow areas.
V = 1 * 4.2309 X 106
V = 4.2309 X 106 ft3
V = 1.567 X 10⁵ yd3
Area of levee to be seeded
A = [38.264 * 2 + 12] * 15760
A = 1.4 X 106 ft2
Area of borrow pit to be seeded
A = (30.414 *2 + 120) * 16098
A = 2.911 X 106 ft2
Total area to be seeded
A = 1.4 X 10⁶ + 2.911 X 10⁶
A = 4.311 X 106 ft2

Appendix G

Construction Cost Estimate
Operation Daily Output Unit Total $ per unit costs
# of units Cost
Stripping topsoil and stockpiling with 200 H.P. dozer 2300 C.Y. $0.61 156700 $95,587.00
Lawn Bed Preparation, 50' topsoil haul, 12" deep, 200 H.P. dozer 2660 C.Y. $0.52 160000 $83,200.00
Seeding Grass, Slope Mix, Hydro or air seeding with mulch and fertilizer 80 M.S.F $49.50 4311 $213,394.50
Equipment Number Cost per week
Crew Cost Per Week
# of weeks
Borrow Pit/Levee Construction
Loading Tractor, 6 C.Y bucket 10 $2,900.00 $4,430.80 8 $586,464.00
Tandem Roller, 8 ton 5 $800.00 $229.10 8 $41,164.00
Dozer 75 H.P. 5 $1,000.00 $1,424.50 8 $96,980.00
Toe Drain Borrow Pit/Levee Construction
Loading Tractor, 6 C.Y bucket 1 $2,900.00 $4,430.80 2 $14,661.60
Dump Truck, 35 ton 11 $3,770.00 $5,020.00 2 $193,380.00
Dozer 75 H.P. 2 $1,000.00 $1,424.50 2 $9,698.00
$1,334,529.10
Assuming Inflation and Contingency cost of 25% gives a total estimate of $1,668,161.38

Construction Equipment Calculations
Borrow Pit/Levee Construction
Need to move 3.7622 X 10⁵ yd3.
Use common‐sized payloader tractor with a bucket size of 6 yd3 to excavate the soil
from the borrow pit and haul to the levee where dozers will level it out and tandem
rollers will compact it.
Assume 120 yd3 can be moved per hour per tractor.
Each tractor will move 960 yd3 per day and 4800 yd3 per week.
This results in the need of 10 tractors for a work time of 8 weeks.
Toe Drain/Toe Drain Construction/Hauling from borrow area
Need to move 4.0159 X 10⁴ yd3.
The toe drain construction is also going to use a 6 yd3 tractor to load dump trucks that
will haul the material approximately 2 miles to the levee. The trucks will dump the drain
material and dozers will level it out. The round trip time was estimated to be 30
minutes.
The R.S. Means books states that the 6 yd3 tractor can load trucks at a rate of 510 yd3
per hour, which is 4080 yd3 per day and 20,400 yd3 per week. This results in the need of
only one tractor for a work time of 2 weeks.
To haul the amount of soil that the tractor can load 11 trucks with a load capacity of 35
tons will be needed for the two work weeks. A 35 ton dump truck can hold 24 yd3 with
the assumed density of approximately 1.5 tons per yd3.
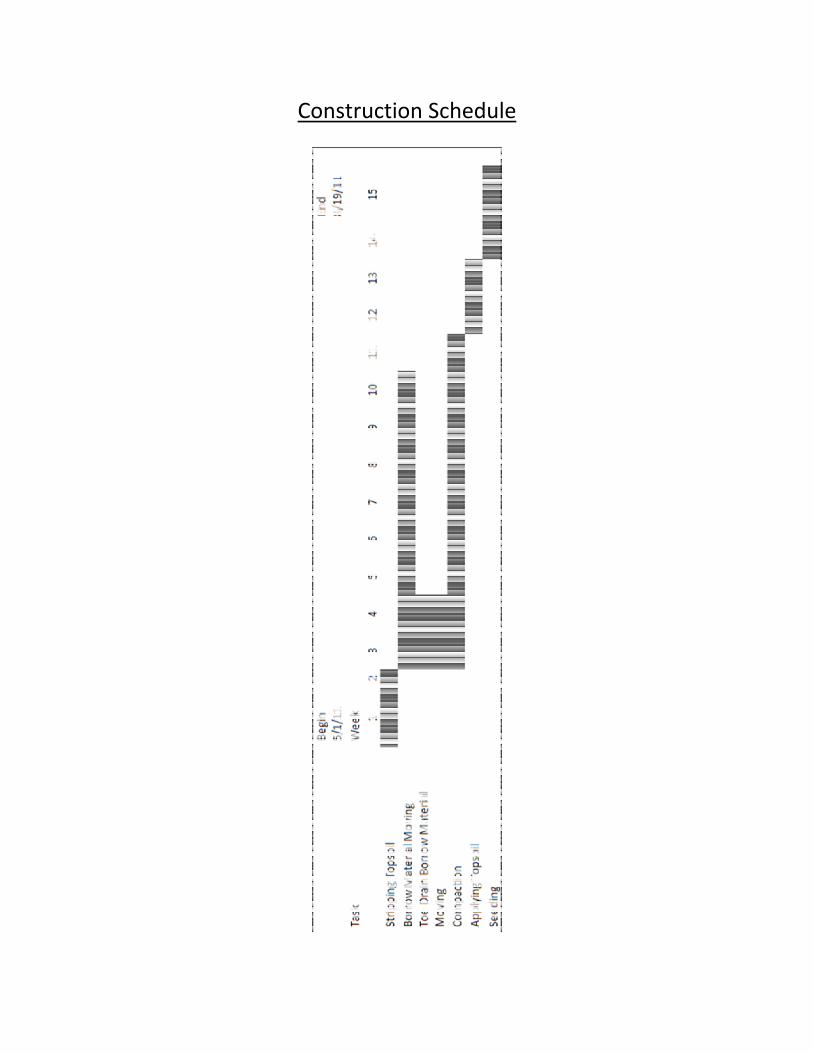
Construction Schedule

Appendix I

View of bore hole (B‐1) looking West.
View of bore hole (B‐1) looking South.
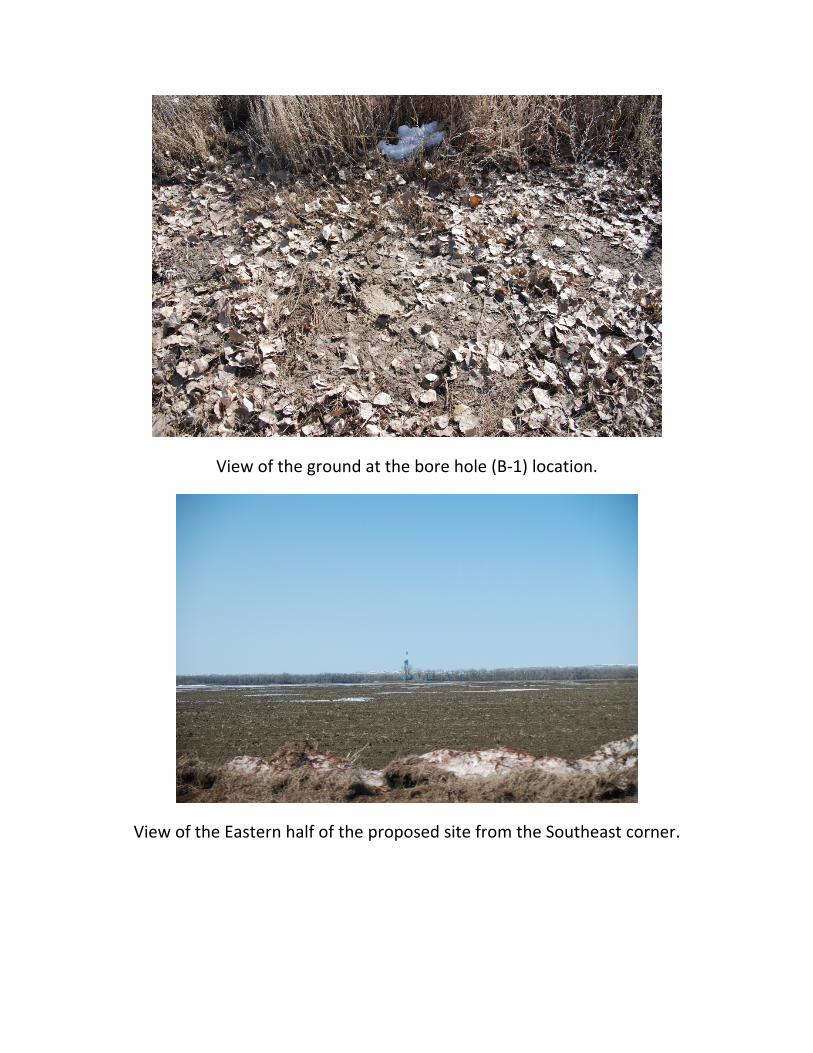
View of the ground at the bore hole (B‐1) location.
View of the Eastern half of the proposed site from the Southeast corner.
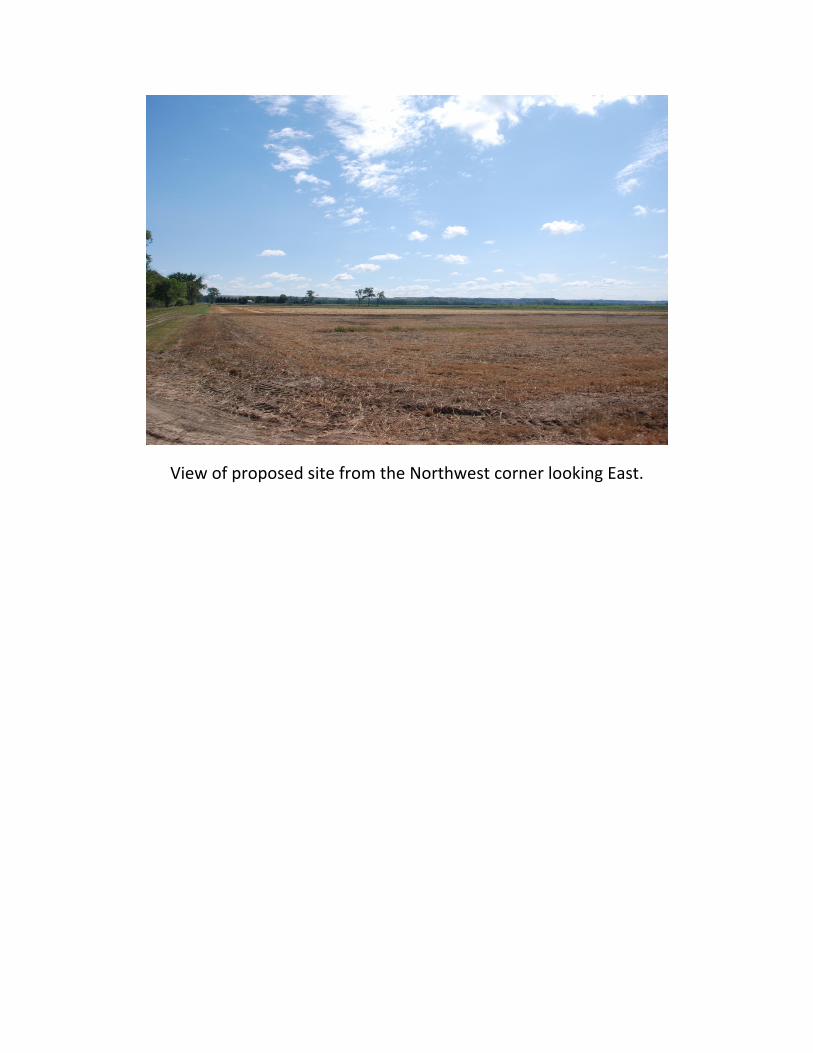
View of proposed site from the Northwest corner looking East.

References
Carrier, W. D. (2003). Goodbye, hazen; hello, kozeny‐carman. Journal of Geotechnical
and Geoenvironmental Engineering, , 1054.
Das, B. M. (2006). Principles of geotechnical engineering (6th ed.). Stamford, CT 06902:
Cengage Learning.
Laboratory Soils Testing, Engineering ManualU.S.C. (1970).
Fetter, C. W. (2001). Applied hydrogeology (4th ed.). Upper Saddle River, NJ 07458:
Prentice Hall.
Fox, R. W., McDonald, A. T., & Pritchard, P. J. (2004). Introduction to fluid mechanics (6th
ed.) John Wiley & Sons.
Odong, J. (2007). Evaluation of empirical formulae for determination of hydraulic
conductivity based on grain‐size analysis. The Journal of American Science, 2010(1)
R.S. Means. (1997). In Page J. R. (Ed.), Site work & landscape cost data (16th ed.).
Kingston, MA 02364: R.S. Means Company.
Rahn, P. H. (1996). Engineering geology an environmental approach (2nd ed.). Upper
Saddle River, NJ 07458: Prentice Hall.
Rocscience. Slide 6.0

Sam Boggs, J. (2006). Principles of sedimentology and stratigraphy (4th ed.). Upper
Saddle River, NJ 07458: Pearson Prentice Hall.
Design and Construction of Levees, Engineering ManualU.S.C. (2000).
U.S. Department of Agriculture. Web soil survey., 2010, from
http://websoilsurvey.nrcs.usda.gov/app/WebSoilSurvey.aspx
U.S. Geological Survey. National water information system: Web interface., 2010, from
http://nwis.waterdata.usgs.gov/nwis