Embed Size (px)
Citation preview
LEUSD Mobility TrackingBest Practice
Shannon Wells, Ph.D.

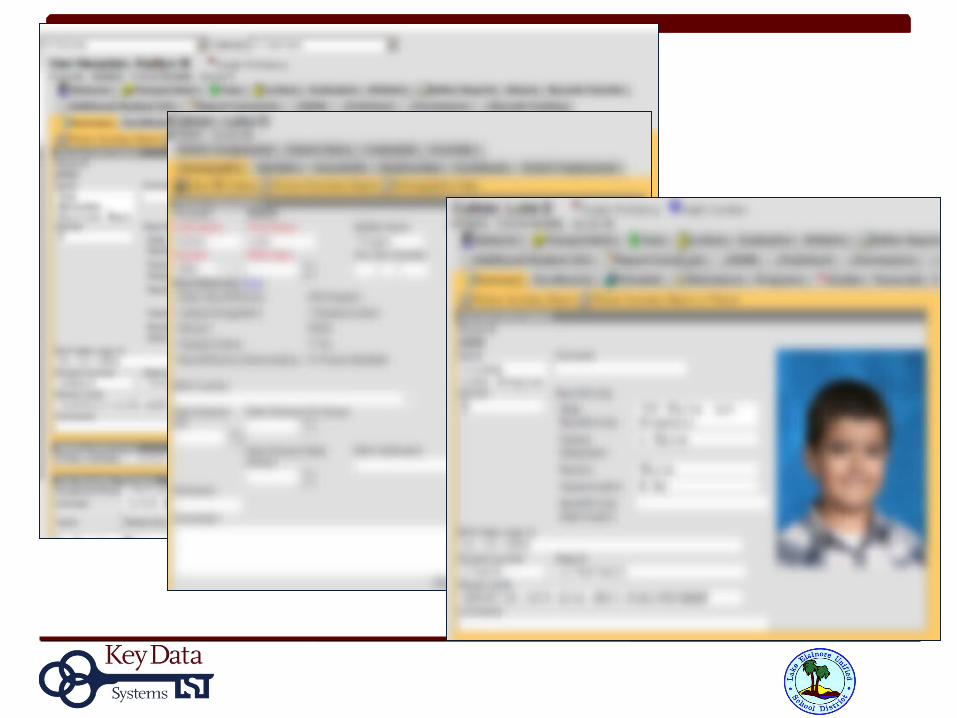
General Data Issues that Impact Accountability
• Student Information System errors– Some Examples affecting accountability:
• English Learners marked as speaking English only• R-FEP students Prof/Adv in Language Arts after only one year • Students receiving special ed. services without a disability code• Missing dates for students exiting special ed. services• Wrong or missing race/ethnic codes• Parent ed. Levels• Full student schedules• GATE• Incorrect student mobility information

Inaccurate Data Not Just in LEUSD Student Information System
American Indian in a Riverside County SIS (not LEUSD)
Parents reported “white” for race/ethnicity on Registration Packet

General Pitfalls with Student Data• Pre-ID extracted months before STAR
– LEUSD Practice• Extracted in January• Demographic corrections tracked and made through end of testing
• Reliance on student information systems (canned pre-id extracts)– LEUSD Practice
• Customized extracts developed by technical personnel, following direction of accountability office
• Frequent/common data errors– LEUSD Practice
• Data with common errors affecting accountability measures are collected separately from the student information system
• Used for Pre-ID, rather than using data in SIS
**STAR testing in late April/early May**

LEUSD Student Data
• Work with Key Data Systems to merge external data, identify errors, correct data, submit pre-ID– Expertise in student data, testing, and accountability rules
• Continue collecting/verifying student data after pre-ID submitted
• Review each individual student’s demographic record being submitted to state
• Utilize extended data corrections window to update/correct data through the last allowed date– Last day of testing in May
WHAT IS MOBILITY AND HOW CAN WE KNOW WHETHER IT IS ACCURATE?
7
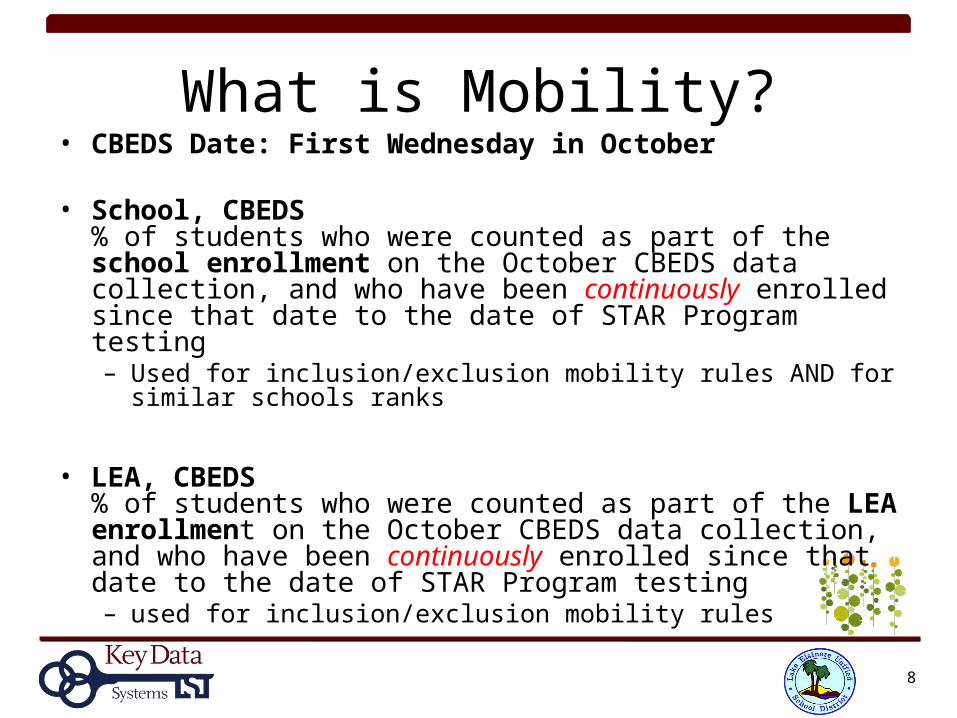
What is Mobility?• CBEDS Date: First Wednesday in October
• School, CBEDS% of students who were counted as part of the school enrollment on the October CBEDS data collection, and who have been continuously enrolled since that date to the date of STAR Program testing– Used for inclusion/exclusion mobility rules AND for similar schools
ranks
• LEA, CBEDS% of students who were counted as part of the LEA enrollment on the October CBEDS data collection, and who have been continuously enrolled since that date to the date of STAR Program testing– used for inclusion/exclusion mobility rules
8

Why Do Scores From Mobile Students Not Count for API and AYP?
• If a student is enrolled from CBEDS until the first day of testing, California considers him/her to have been enrolled in a school for a “full academic year.” The same criterion is used for LEAs.
• Federal and state accountability only use results from students in which a school/district had the opportunity to provide a continuous education for the school year.
9
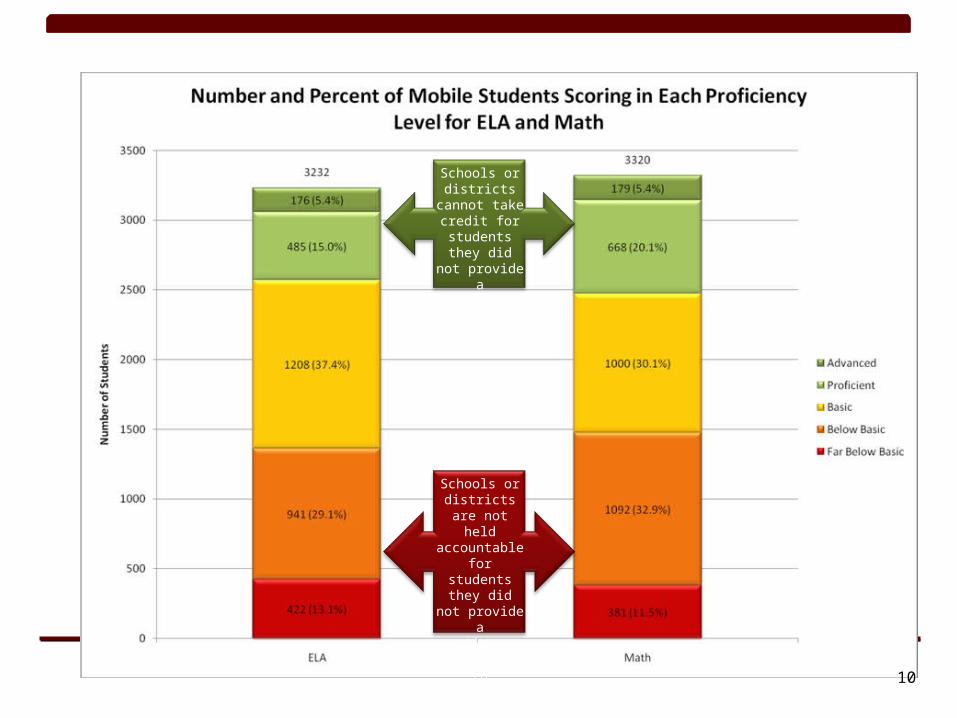
10
Schools or districts cannot take credit for students they
did not provide a continuous education to
Schools or districts are not
held accountable for students they
did not provide a continuous education to
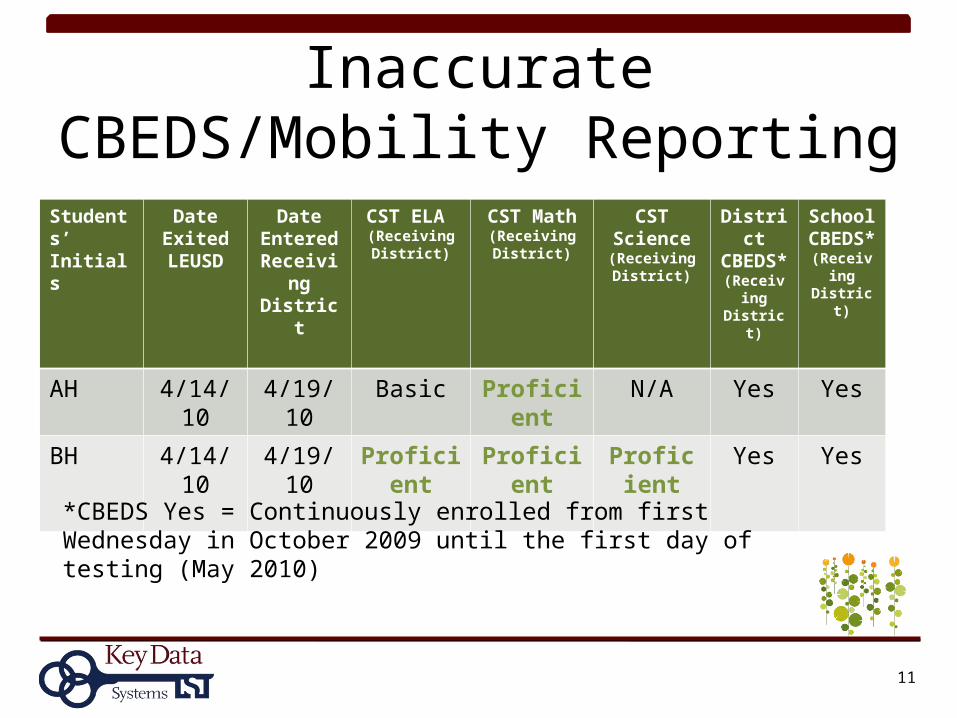
Inaccurate CBEDS/Mobility Reporting
11
Students’ Initials
Date Exited LEUSD
Date Entered
Receiving District
CST ELA (Receiving
District)
CST Math (Receiving
District)
CST Science (Receiving
District)
District CBEDS* (Receiving
District)
School CBEDS*(Receiving
District)
AH 4/14/10 4/19/10 Basic Proficient N/A Yes Yes
BH 4/14/10 4/19/10 Proficient Proficient Proficient Yes Yes
*CBEDS Yes = Continuously enrolled from first Wednesday in October 2009 until the first day of testing (May 2010)

12

Reported CBEDS Yes (Continuously Enrolled)
2009 2010 2011 % NSLPAlvord Unified 91 92 88 72Banning Unified 90 91 92 82Beaumont Unified 92 93 95 60Coachella Valley Unified 92 93 93 90Corona-Norco Unified 95 96 96 43Desert Sands Unified 95 95 96 62Hemet Unified 93 93 92 73Jurupa Unified 88 91 93 76Lake Elsinore Unified 86 80 79 54Menifee Union Elementary 92 93 94 43Moreno Valley Unified 90 91 91 80Murrieta Valley Unified 94 94 95 26Nuview Union 93 94 96 71Palm Springs Unified 95 95 95 82Palo Verde Unified 95 95 95 67Perris Elementary 87 89 91 87Perris Union High 91 91 92 67Riverside County Office of Education 35 35 32 46Riverside Unified 95 95 96 60Romoland Elementary 90 90 89 72San Jacinto Unified 89 88 89 74Temecula Valley Unified 94 95 96 18Val Verde Unified 89 89 89 80
Three Year Reported Mobility Rates and 2011 Percent of Low Income Students
13

14

15
Census Geography
Through its many surveys, the Census Bureau reports data for a wide variety of geographic types, ranging from the entire United States down to a Census Block. The geographic types that a survey reports on will depend upon the survey's purpose, and how the data were collected.

16
American Community Survey (ACS)“The American Community Survey (ACS) is an annual national survey collected monthly which provides communities with reliable and timely demographic, housing, social, and economic data every year.Annual data on Migration is used to determine the extent of residential mobility of the population for the U.S., states, metropolitan areas, and more specific geographical areas for the given survey year. Data are available from 2000 to the present.” Survey results show the percent of people that live in the same house as they did the prior year. This is similar to school districts’ measures of mobility.
http://factfinder.census.gov/servlet/ADPGeoSearchByListServlet?ds_name=ACS_2009_5YR_G00_&_lang=en&_ts=335276417580

17
Sources: Census Residential Mobility (Same House One Year) (http://factfinder.census.gov/servlet/ADPGeoSearchByListServlet?ds_name=ACS_2009_5YR_G00_&_lang=en&_ts=335276417580)
2011 District Mobility (http://data1.cde.ca.gov/dataquest/)

18
District Mobility Tracking CBEDS Yes (Non-Mobile)
Census Mobility from American Community Survey
(Non-Mobile)
2010 2011Residential
MobilityMargin of Error +/-
Difference Between
2011 District Reported
and Census Mobility
Does the District
Mobility Match Census
Mobility?Alvord Unified 92 88 79.3 2.20 8.70 NOBanning Unified 91 92 80.2 2.80 11.80 NOBeaumont Unified 93 95 80.5 2.50 14.50 NOCoachella Valley Unified 93 93 84.6 2.10 8.40 NOCorona-Norco Unified 96 96 83.1 1.10 12.90 NODesert Sands Unified 95 96 81.7 1.30 14.30 NOHemet Unified 93 92 77.6 1.60 14.40 NOJurupa Unified 91 93 84.8 2.10 8.20 NOLake Elsinore Unified 80 79 80.8 1.90 1.80 YESMenifee Union Elementary 93 94 80.2 2.20 13.80 NOMoreno Valley Unified 91 91 87.0 1.10 4.00 NOMurrieta Valley Unified 94 95 81.9 1.60 13.10 NONuview Union 94 96 88.8 4.40 7.20 NOPalm Springs Unified 95 95 82.2 1.50 12.80 NOPalo Verde Unified 95 95 74.7 3.30 20.30 NOPerris Elementary 89 91 81.2 3.10 9.80 NOPerris Union High 91 92 81.1 1.50 10.90 NORiverside Unified 95 96 81.0 1.20 15.00 NORomoland Elementary 90 89 80.9 4.30 8.10 NOSan Jacinto Unified 88 89 78.1 3.50 10.90 NOTemecula Valley Unified 95 96 82.4 1.40 13.60 NOVal Verde Unified 89 89 83.5 2.10 5.50 NO
LEUSD Mobility Range = 77.1 to 80.979 – 1.9 = 77.1; 79 + 1.9 = 80.9
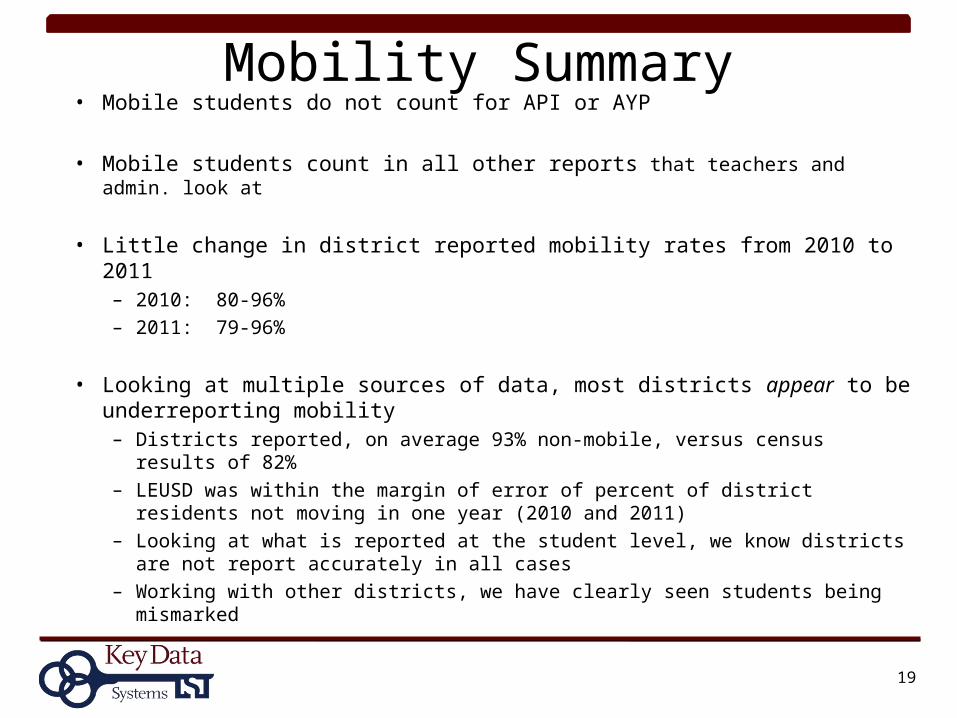
Mobility Summary• Mobile students do not count for API or AYP
• Mobile students count in all other reports that teachers and admin. look at
• Little change in district reported mobility rates from 2010 to 2011– 2010: 80-96%– 2011: 79-96%
• Looking at multiple sources of data, most districts appear to be underreporting mobility– Districts reported, on average 93% non-mobile, versus census results of 82%– LEUSD was within the margin of error of percent of district residents not
moving in one year (2010 and 2011)– Looking at what is reported at the student level, we know districts are not
report accurately in all cases– Working with other districts, we have clearly seen students being mismarked
19

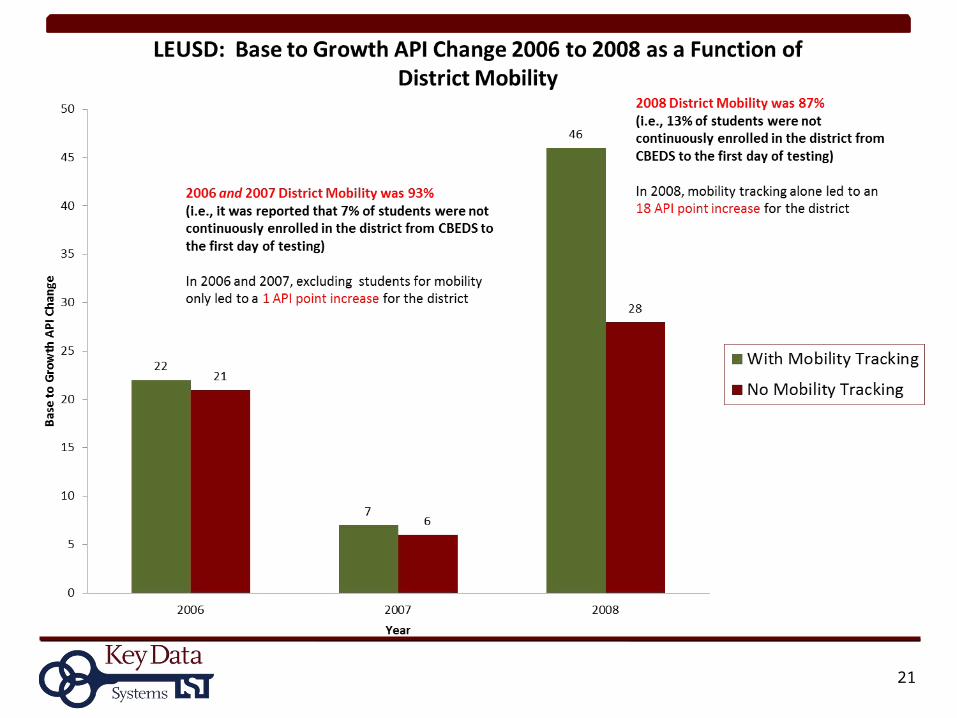
2006 TO 2008IMPACT OF DISTRICT MOBILITY
API and AYP
20
21

22

23

LEUSD MOBILITY TRACKING AND DATA REPORTING
24
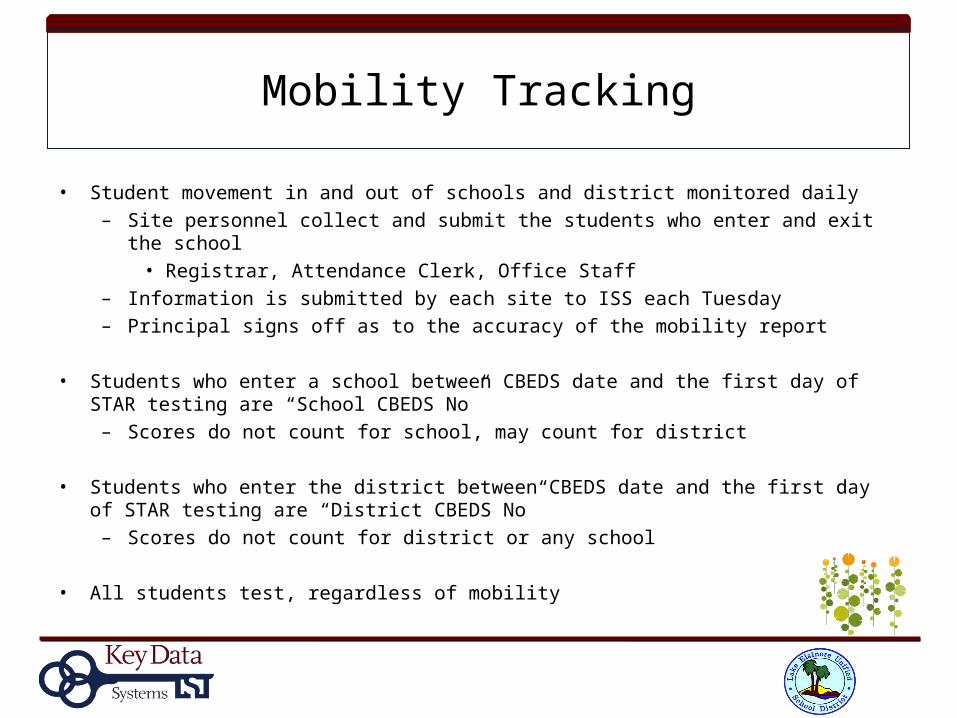
Mobility Tracking
• Student movement in and out of schools and district monitored daily– Site personnel collect and submit the students who enter and exit the school
• Registrar, Attendance Clerk, Office Staff– Information is submitted by each site to ISS each Tuesday– Principal signs off as to the accuracy of the mobility report
• Students who enter a school between CBEDS date and the first day of STAR testing are “School CBEDS No”
– Scores do not count for school, may count for district
• Students who enter the district between CBEDS date and the first day of STAR testing are “District CBEDS No”
– Scores do not count for district or any school
• All students test, regardless of mobility


LEUSD Instructional Model
• Know targets and understand accountability systems
• Know details of all students (Ongoing String Data)– Subgroup inclusion – Previous achievement– Strengths and Weaknesses– Evaluate student progress on a continual basis
• Teach standards – not textbooks – from first day of instruction– Teach all assessed standards – all standards are “key, essential” standards
• Freedom to teach -- Not tied to any specific materials– Teachers have flexibility/expectation to create creative, relevant lessons that allow their specific
students to understand the content standards– Focus on results, not process