Embed Size (px)
Citation preview

LETTERdoi:10.1038/nature14599
Energetic coupling between plastids andmitochondria drives CO2 assimilation in diatomsBenjamin Bailleul1,2,3,4, Nicolas Berne1, Omer Murik4, Dimitris Petroutsos5, Judit Prihoda4, Atsuko Tanaka4, Valeria Villanova6,Richard Bligny5, Serena Flori5, Denis Falconet5, Anja Krieger-Liszkay7, Stefano Santabarbara8, Fabrice Rappaport3, Pierre Joliot3,Leila Tirichine4, Paul G. Falkowski2, Pierre Cardol1, Chris Bowler4 & Giovanni Finazzi5
Diatoms are one of the most ecologically successful classes of photo-synthetic marine eukaryotes in the contemporary oceans. Overthe past 30 million years, they have helped to moderate Earth’sclimate by absorbing carbon dioxide from the atmosphere, seques-tering it via the biological carbon pump and ultimately buryingorganic carbon in the lithosphere1. The proportion of planetaryprimary production by diatoms in the modern oceans is roughlyequivalent to that of terrestrial rainforests2. In photosynthesis, theefficient conversion of carbon dioxide into organic matter requiresa tight control of the ATP/NADPH ratio which, in other photosyn-thetic organisms, relies principally on a range of plastid-localizedATP generating processes3–6. Here we show that diatoms regulateATP/NADPH through extensive energetic exchanges between plas-tids and mitochondria. This interaction comprises the re-routing ofreducing power generated in the plastid towards mitochondria andthe import of mitochondrial ATP into the plastid, and is mandatoryfor optimized carbon fixation and growth. We propose that theprocess may have contributed to the ecological success of diatomsin the ocean.
In oxygenic photosynthesis, light drives a linear electron flow fromwater to NADPH by the two photosystems (PS I and PS II), and thegeneration of an electrochemical proton gradient (or proton motiveforce, PMF) across the thylakoid membranes, which fuels ATP syn-thesis by an ATP synthase. Although the ratio of ATP/NADPH gen-erated by linear electron flow is not entirely resolved7,8, it is consideredto be insufficient to fuel CO2 import into the plastid and assimilationby the Calvin cycle8,9. Therefore, to make up the shortfall, additionalATP must be produced by alternative pathways that do not generateNADPH. In Viridiplantae (including green algae and higherplants) these alternative electron pathways have been found in thechloroplast and mostly comprise cyclic electron flow (CEF) aroundPS I (ref. 3) and/or the water-to-water cycles10; that is, flows of elec-trons resulting from the oxidation of water at PS II that are re-routed toan oxidase activity. This last group of oxidases include the Mehlerreaction at the PS I acceptor side4,11,12, the activity of the plastoquinoneterminal oxidase downstream of PS II (ref. 5) and the oxygenase activ-ity of ribulose 1,5-bisphosphate carboxylase–oxygenase (Rubisco)(photorespiration6). Although genes encoding most components forthese processes appear to be present in diatoms13–15, it is currentlyunknown what mechanisms are used to balance the ATP/NADPHratio. We therefore investigated this question using the model speciesPhaeodactylum tricornutum.
The PMF generated across thylakoid membranes comprises an elec-tric field (DY) and a proton gradient (DpH). The DY can be probed
in vivo by measuring the electro-chromic shift (ECS), that is the Starkeffect, a modification of the absorption spectrum of specific pigmentscaused by changes in the transmembrane electric field in the plastid16.An ECS signal is present in P. tricornutum (Fig. 1a), and an analysis ofthe ECS signal relaxation after light exposure (Extended Data Fig. 1)reveals that it comprises two components displaying different spectra(Fig. 1a). One follows a linear dependence on the amplitude of DYwhereas the other follows a quadratic relationship (Fig. 1b). The exist-ence of a ‘quadratic ECS’ is predicted by theory16 but has only beenobserved so far in mutants of green algae with altered pigmentcomposition17. The peculiar existence of two different ECS probes inwild-type P. tricornutum cells allows an absolute quantification of theelectric field, providing a valuable tool to analyse the PMF in a livingcell (see Methods).
We plotted the amplitude of the quadratic versus linear ECS signalsduring the relaxation of a light-induced PMF and obtained a parabolicfunction (Fig. 1c, d and Extended Data Fig. 2). However, the ECSsignals did not reach the minimum of the parabola in the dark, butrather remained positive. This indicates that a PMF is maintainedacross the thylakoid membrane of diatoms in the dark (DYd,Fig. 1c). The field DYd can not only be dissipated by addition of anuncoupler (carbonyl cyanide-4-(trifluoromethoxy)phenylhydrazone(FCCP)), but also by blocking mitochondrial electron transport byanaerobiosis or addition of antimycin A (AA) plus salicylhydroxamicacid (SHAM). The combination of these two inhibitors blocks both thecyanide-sensitive (complex III) and the cyanide-insensitive (alterna-tive oxidase, AOX) respiratory pathways (Fig. 1d). These results sug-gest that the residual PMF in the dark is generated in plastids by thechloroplast ATPase by hydrolysis of ATP derived from mitochondria(Fig. 1e)18. Furthermore, the extent of DYd observed in P. tricornutumis larger than that previously reported in green algae19, suggesting thatthe ATP exchange could be more efficient in diatoms.
To evaluate what mechanism regulates ATP/NADPH in the light inP. tricornutum, we first used the linear ECS to probe the CEF capacity(see Methods). CEF turned out to represent only a very low fractionof the maximum electron flow capacity (Fig. 2a and Extended DataFig. 3a, c) and was insensitive to changes in the photosynthetic flux(Fig. 2a). Thus, it appears very unlikely that CEF could regulate ATP/NADPH fluxes. Next we explored the water-to-water cycle usingmembrane-inlet mass spectrometry on cells incubated with 18O2. O2
consumption increased with light, being ,2.5-fold higher at saturatinglight intensities than in the dark (Extended Data Fig. 3b, d). We alsofound that the light-stimulated O2 consumption was blocked by3-(3,4-dichlorophenyl)-1,1-dimethyl-urea (DCMU), which inhibits
1Genetique et Physiologie des Microalgues, Departement des Sciences de la vie and PhytoSYSTEMS, Universite de Liege, B-4000 Liege, Belgium. 2Environmental Biophysics and Molecular EcologyProgram, Departments of Marine and Coastal Sciences and of Earth and Planetary Sciences, Rutgers University, New Brunswick, New Jersey 08901, USA. 3Institut de Biologie Physico-Chimique (IBPC),UMR 7141, Centre National de la Recherche Scientifique (CNRS), Universite Pierre et Marie Curie, 13 Rue Pierre et Marie Curie, F-75005 Paris, France. 4Ecole Normale Superieure, PSL Research University,Institut de Biologie de l’Ecole Normale Superieure (IBENS), CNRS UMR 8197, INSERM U1024, 46 rue d’Ulm, F-75005 Paris, France. 5Laboratoire de Physiologie Cellulaire et Vegetale, UMR 5168, CentreNational de la Recherche Scientifique (CNRS), Commissariat a l’Energie Atomique et aux Energies Alternatives (CEA), Universite Grenoble Alpes, Institut National Recherche Agronomique (INRA), Institut deRecherche en Sciences et Technologies pour le Vivant (iRTSV), CEA Grenoble, F-38054 Grenoble cedex 9, France. 6Fermentalg SA, F-33500 Libourne, France. 7Institute for Integrative Biology of the Cell(I2BC), Commissariat a l’Energie Atomique et aux Energies Alternatives (CEA), Centre National de la Recherche Scientifique (CNRS), Universite Paris-Sud, Institut de Biologie et de Technologie de Saclay,F-91191 Gif-sur-Yvette cedex, France. 8Istituto di Biofisica, Consiglio Nazionale delle Ricerche, Via Celoria 26, I-20133 Milan, Italy.
G2015 Macmillan Publishers Limited. All rights reserved
3 6 6 | N A T U R E | V O L 5 2 4 | 2 0 A U G U S T 2 0 1 5

O2 production by PS II (Extended Data Fig. 3b, d), indicating that thisprocess is fed by electrons generated by PS II. O2 consumptionincreased linearly with O2 production, in agreement with earlier find-ings in another diatom species20, indicating that a constant proportion(,10%) of the electron flow from photosynthesis is re-routed to anO2-consuming pathway, regardless of light intensity (Fig. 2b).
To test whether the O2-consuming pathway occurs in the plastid orrelies on mitochondrial activity, we used increasing concentrations ofinhibitors to titrate respiration and tested possible consequences onphotosynthesis. We reasoned that if respiration consumes reducingequivalents generated in the plastid to generate additional ATP, anymitochondrial dysfunction should negatively impact photosynthesis.
ba
c d
e
ATP
b6f PS IPS II
H+III IV
AOX
SHAM AA
NADH
ATP
H+
H+
H+
H+ H+
H+
H+
H+
H+
H+ H+
H+
H+
ATP ase
ATP ase
Krebs cycle
1.0
0.5
0
–0.5
–1.0
40
30
20
10
0
–10
EC
Sq
uad
ratic
40
30
20
10
0
–10
EC
Sq
uad
ratic
EC
S (r.
u.)
460 480
λ (nm)
500 520 540 560 580 600
Experimental
Linear
Quadratic
ControlFCCP
Anaerobiosis
AA + SHAM
ECSlinear
(charge separation per PS)
ECSlinear
(charge separation per PS)Δψd
–5 0 5 10 15 20–5 0 5 10 15 20
Δψ
I
+
–
+
–
–
– –––
++ + +
! " +
––
Δψ
Quadratic
Linear
EC
S (r.
u.)
EC
S (r.
u.)
Figure 1 | ECS measures the PMF inP. tricornutum. a, Deconvolution of theexperimental ECS spectrum (black) into linear(blue) and quadratic (red) spectral components(see Methods); r.u., relative units. b, Schematicrepresentation of polar (blue) and polarizable (red)pigments, and their associated linear (blue) andquadratic (red) ECS responses to the electric field.Black: thylakoid lipid bilayer. Green ‘1’ and ‘2’symbols: DY. Red arrows: pigment polarizationinduced by DY. c, d, Relationship betweenquadratic and linear ECS in control (c) and in cellstreated with uncoupler (8mM FCCP, blacksquares), anaerobiosis (red circles) and respiratoryinhibitors (AA, 5mM, and SHAM, 1 mM; bluecircles) (d). Green arrow: extent of the dark electricfield (DYd). Representative of five (c) and three(d) independent biological samples. e, Schematicrepresentation of the energetic interactionsbetween plastid (left) and mitochondria (right) inthe dark. Red arrows: respiratory electron flows.Green dashed line: putative ATP/ADP exchangepathway between the organelles. ATPase, ATPase/synthase; b6f, cytochrome b6f; I/III/IV, respiratorycomplexes I, III and IV.
NADPH NADH
d
a b c
ATP
Calvin cycle
Krebs cycle
AOX
SHAM AA
ATP
H+H+
H+
H+
H+ H+
H+
H+
ATP ase
ATP ase
H+H+
H+
H+
H+ H+
b6f PS IPS II
III IVI
0 50 100 150 200 250 300 3500
10
20
30
40
50
0 0.5 1.0 1.5 2.0 2.50.1
0.2
0.3
0.4
0 20 40 60 80 10070
80
90
100
Dark respiration (%)
ET
RP
S II (
%)
E0 (pmol O
2 min–1 per cell)
U0 (p
mo
l O
2 m
in–1 p
er
cell)
TEF (electrons s–1 per PS )
CE
F (ele
ctr
ons s
–1 p
er
PS
I)
Figure 2 | Energetic interactions betweenmitochondria and plastid in P. tricornutum.a, Relationship between CEF capacity and totalelectron flow (TEF, mean 6 s.d. from data inExtended Data Fig. 3a, c). b, Relationship betweenoxygen uptake (U0) and gross photosynthesis(E0) as measured by membrane-inlet massspectrometry (mean 6 s.e.m. from data inExtended Data Fig. 3b, d). c, Dependency ofphotosynthetic activity (ETRPS II) on respirationrates (as the percentage of control, mean 6 s.d.from data in Extended Data Fig. 4). Closed circles:SHAM 1 AA; open circles: SHAM 1 myxothiazoltreatments (see Methods). d, Schematicrepresentation of possible plastid–mitochondriametabolic interactions in the light. Continuous anddashed blue arrows: photosynthetic linear andcyclic flows, respectively. Yellow arrow: exchangeof reducing equivalents. For other symbols, see textand Fig. 1e.
LETTER RESEARCH
G2015 Macmillan Publishers Limited. All rights reserved
2 0 A U G U S T 2 0 1 5 | V O L 5 2 4 | N A T U R E | 3 6 7

We found that this was indeed the case, as photosynthetic electrontransfer rate (ETRPS II) linearly followed changes in respiration (Fig. 2cand Extended Data Fig. 4). We conclude that a partial re-routing of thephotosynthetic flow towards mitochondrial respiration rather thanCEF optimizes photosynthesis in diatoms, providing commensurateATP per NADPH at all irradiances (Fig. 2d).
Photosynthetic activity displayed increasing sensitivity to AOXinhibition with light, suggesting that cyanide-insensitive respirationbecomes prominent in high light (Fig. 3a). This prompted us to gen-erate AOX knockdown cell lines of P. tricornutum. Two independentclones were selected on the basis of reduced AOX protein accumula-tion (Fig. 3b) and decreased activity (measured as the SHAM-sensitive,AA-insensitive component of respiration; Extended Data Fig. 5a). TheAOX contribution, representing ,50% of dark respiration in wild-type cells (Extended Data Fig. 4e), was decreased two-fold in the twoknockdown lines (Extended Data Fig. 5a). Confocal microscopy con-firmed the mitochondrial localization of the targeted gene product(Extended Data Fig. 6a). The reduced AOX activity in the knockdownlines paralleled a diminished PMF in the dark (DYd, Extended Data
Fig. 5b), despite the fact that overall dark respiration was slightlyhigher (Extended Data Fig. 5a). This effect was strongly enhancedby addition of AA (Extended Data Fig. 5b). The decreased AOX activ-ity also correlated with a decreased photosynthetic capacity, especiallyunder high light intensities (similar to SHAM-treated wild-type cells;Fig. 3a), and a diminished growth rate (Fig. 3c), which was exacerbatedfurther by inhibiting complex III using AA (Extended Data Fig. 5c).The growth and photosynthetic phenotypes were not due to changes inthe accumulation of the photosynthetic complexes, for which wedetected comparable levels of representative proteins in all cell lines(Fig. 3b). The only exception was a small decrease in the cytochromeb6f content in the knockdown cell lines, which nonetheless did notdecrease its overall catalytic turnover (Extended Data Fig. 7).
Our working model presented in Fig. 2d predicts that disruptionof the plastid–mitochondria interaction in the knockdown cell linesshould lead to the accumulation of NADPH and a decreased cellularcontent of ATP in the light. Indeed, in vivo assessments of the poolsof NADPH and ATP in wild-type and knockdown cell lines con-firmed an increase in the NADPH/NADP1 ratio with light intensity
b d
e
a
c
WT kd-c5 kd-c9
AOX
AtpB
Cyt c
CP43
D1
PsaB
PsaC
RbcL
Cyt f
0 50 100 150 200 250
0
10
20
30
WT
Irradiance (μmol quanta m–2 s–1)Irradiance (μmol quanta m–2 s–1)
AA+SHAM AA SHAMkd-c5 kd-c9
kd-c5kd-c9
WT
kd-c5kd-c9
WT kd-c5 kd-c9
1.5
1.0
0.5
0
Gro
wth
rate
(d
–1)
ΔET
R/E
TR
(%
of
WT
co
ntr
ol)
0 100 200 300 4000
0.2
0.4
0.6
0.8
1.0
0
0.2
0.4
0.6
0.8
1.0
NA
DP
H (r.u.)
AT
P (r.u.)
Dark Light Light + AA
Figure 3 | Phenotypic traits of AOX knockdownlines of P. tricornutum. a, Relative sensitivityof photosynthesis (ETRPS II) to addition ofrespiratory inhibitors: AA (magenta), SHAM (darkyellow) and AA 1 SHAM (black) (n 5 3 6 S.D),or to knockdown of AOX (n 5 5 6 s.d.). Blueand red: kd-c5 and kd-c9, respectively. b, Westernblot analysis of photosynthetic and respiratorycomplexes. c, Growth rates of the wild-type andAOX lines (n 5 7 6 s.d.). d, In vivo lightdependency of NADPH redox state in wild-typeand AOX lines. Data are normalized to themaximum value in the light. e, In vivo 31P-NMRevaluation of the NTP content in wild-type andAOX knockdown lines, in the dark or in low light,with or without AA (data normalized to thedark values). d, e, Three independent biologicalsamples.
Thalassiosira weissflogii Thalassiosira pseudonana Fragilaria pinnata Ditylum brightwellii a
b
1
0
1
0
1
0
1
0
–1
EC
S (r.
u.)
460 480
λ (nm)
500 520 540 560 580 600 460 480
λ (nm)
500 520 540 560 580 600 460 480
λ (nm)
500 520 540 560 580 600 460 480
λ (nm)
500 520 540 560 580 600
ECSlinear
(ΔI/I × 104)
EC
Sq
uad
ratic (ΔI
/I ×
10
4)
ECSlinear
(ΔI/I × 104) ECSlinear
(ΔI/I × 104) ECSlinear
(ΔI/I × 104)
Δψd
Δψd
Δψd
Δψd
30
20
10
0
30
20
10
0
30
20
10
0
16
12
4
8
0
0 5 10 15 20 0 5 10 15 20 25 0 2 4 6 8 0 2 4 6 810
Figure 4 | ATP transfer from mitochondria to plastid in representativediatoms. a, Spectra of the linear (blue) and quadratic (red) ECS probes in fourdiatoms. Blue and red vertical dashed lines represent the wavelengths used forlinear and quadratic ECS, respectively. Spectra are normalized to 1 at the
maximum value of the linear ECS. b, Relationship between the quadratic andthe linear ECS in control conditions (open symbols) and in AA 1 SHAMconditions (filled symbols). DYd is represented as a horizontal arrow. Data arerepresentative of three independent biological samples.
RESEARCH LETTER
G2015 Macmillan Publishers Limited. All rights reserved
3 6 8 | N A T U R E | V O L 5 2 4 | 2 0 A U G U S T 2 0 1 5

(Fig. 3d and Extended Data Fig. 8a), accompanied by a net decreaseof cellular ATP levels (Fig. 3e and Extended Data Fig. 8b), both ofwhich were more drastic in AOX knockdown cells than wild-typecells. These observations confirm that mitochondrial respiration isdirectly involved in the adjustment of the ATP to NADPH ratio inthe plastid.
We then examined the generality of our findings in other diatomspecies. The similar ECS features (linear and quadratic components) inThalassiosira pseudonana, Thalassiosira weissflogii, Fragilaria pinnataand Ditylum brightwellii (Fig. 4a) were used to confirm the presence of aPMF in the plastids in the dark at the expense of hydrolysis of ATPsupplied by the mitochondria in all cases (Fig. 4b). Moreover, a neg-ligible contribution of CEF (Extended Data Fig. 9) and a significantinvolvement of mitochondrial respiration to photosynthesis (ExtendedData Fig. 10) were found in all these species. The involvement of mito-chondrial respiration in the optimization of photosynthesis thereforeappears to be a general and conserved feature in diatoms.
We conclude that ATP generation sets the rate of photosyntheticcarbon assimilation in diatoms, as suggested in other photosyntheticorganisms8, but that in contrast with the Viridiplantae, optimizationof diatom photosynthesis does not rely on plastid-localized processes.Instead, constitutive energetic interactions between diatom mito-chondria and plastids ensure the sharing of reducing equivalentsand ATP to fuel CO2 assimilation in the light (Fig. 2d). While theprocess we have uncovered has some similarities to the export ofreducing equivalents from the plastids towards mitochondria inplants and green algae, the fundamental difference is that in plantsand green algae the process serves as a valve to dissipate excess ofreducing power21, and can only participate in the regulation of theATP/NADPH ratio when the chloroplast capacity to make extra ATPis genetically disrupted22–24. We propose that the presence of trans-porters such as the malate shuttle21, which are encoded in diatomgenomes13, as well as the very tight physical interactions observed indiatoms between plastids and mitochondria (Extended Data Fig. 6b),may make these energetic interactions possible between the twoorganelles. Because diatom plastids are surrounded by four mem-branes rather than two as in Viridiplantae13, it will be of interest toelucidate the configuration of such transporters, as well as the ration-ale for the diminished CEF efficiency in diatoms. More generally, thecoupling of respiratory and photosynthetic activities in diatomsshould be explored in the context of resource utilization in the oceanand as a means to boost the production of useful metabolites forbiotechnology.
Online Content Methods, along with any additional Extended Data display itemsandSourceData, are available in the online version of the paper; references uniqueto these sections appear only in the online paper.
Received 16 January; accepted 28 May 2015.
Published online 13 July; corrected online 19 August 2015 (see full-text
HTML version for details).
1. Falkowski, P. G. The evolution of modern eukaryotic phytoplankton. Science 305,354–360 (2004).
2. Field, C. B., Behrenfeld, M. J., Randerson, J. T. & Falkowski, P. G. Primary productionof the biosphere: integrating terrestrial and oceanic components. Science 281,237–240 (1998).
3. Shikanai, T. Cyclic electron transport around photosystem I: genetic approaches.Annu. Rev. Plant Biol. 58, 199–217 (2007).
4. Asada, K. The water–water cycle as alternative photon and electron sinks. Phil.Trans. R. Soc. Lond. B 355, 1419–1431 (2000).
5. Cardol, P. et al. An original adaptation of photosynthesis in the marine green algaOstreococcus. Proc. Natl Acad. Sci. USA 105, 7881–7886 (2008).
6. Ort,D.R.&Baker,N.R.Aphotoprotective roleofO2 asanalternative electronsink inphotosynthesis? Curr. Opin. Plant Biol. 5, 193–198 (2002).
7. Petersen, J., Forster, K., Turina, P. & Graber, P. Comparison of the H1/ATP ratios ofthe H1-ATP synthases from yeast and from chloroplast. Proc. Natl Acad. Sci. USA109, 11150–11155 (2012).
8. Allen, J. F. Photosynthesis of ATP-electrons, proton pumps, rotors, and poise. Cell110, 273–276 (2002).
9. Lucker, B. & Kramer, D. M. Regulation of cyclic electron flow in Chlamydomonasreinhardtii under fluctuating carbon availability. Photosynth. Res. 117, 449–459(2013).
10. Allen, J. F. Oxygen reduction and optimum production of ATP in photosynthesis.Nature 256, 599–600 (1975).
11. Radmer, R. J. & Kok, B. Photoreduction of O2 primes and replaces CO2assimilation. Plant Physiol. 58, 336–340 (1976).
12. Badger, M. R. Photosynthetic oxygen exchange. Annu. Rev. Plant Physiol. 36, 27–53(1985).
13. Prihoda, J. et al. Chloroplast-mitochondria cross-talk in diatoms. J. Exp. Bot. 63,1543–1557 (2012).
14. Bowler, C. et al. The Phaeodactylum genome reveals the evolutionary history ofdiatom genomes. Nature 456, 239–244 (2008).
15. Grouneva, I., Rokka, A. & Aro, E.-M. The thylakoid membrane proteome of twomarine diatoms outlines both diatom-specific and species-specific features of thephotosynthetic machinery. J. Proteome Res. 10, 5338–5353 (2011).
16. Witt, H. T. Energy conversion in the functional membrane of photosynthesis.Analysis by light pulse and electric pulse methods. The central role of the electricfield. Biochim. Biophys. Acta 505, 355–427 (1979).
17. Joliot,P.&Joliot, A.Characterizationof linear andquadratic electrochromicprobesinChlorella sorokiniana andChlamydomonas reinhardtii. Biochim. Biophys. Acta 975,355–360 (1989).
18. Diner, B. & Joliot, P. Effect of the transmembrane electric field on thephotochemical and quenching properties of photosystem II in vivo. Biochim.Biophys. Acta 423, 479–498 (1976).
19. Finazzi, G. & Rappaport, F. In vivo characterization of the electrochemical protongradient generated in darkness in green algae and its kinetics effects oncytochrome b6f turnover. Biochemistry 37, 9999–10005 (1998).
20. Waring, J., Klenell, M., Bechtold, U., Underwood, G. J. C.& Baker, N.R. Light-inducedresponses of oxygen photo-reduction, reactive oxygen species production andscavenging in two diatom species. J. Phycol. 46, 1206–1217 (2010).
21. Kinoshita, H. et al. The chloroplastic 2-oxoglutarate/malate transporter has dualfunction as the malate valve and in carbon/nitrogen metabolism. Plant J. 65,15–26 (2011).
22. Lemaire, C., Wollman, F. A. & Bennoun, P. Restoration of phototrophic growth in amutant of Chlamydomonas reinhardtii in which the chloroplast atpB gene of theATP synthase has a deletion: an example of mitochondria-dependentphotosynthesis. Proc. Natl Acad. Sci. USA 85, 1344–1348 (1988).
23. Cardol, P. et al. Impaired respiration discloses the physiological significance ofstate transitions in Chlamydomonas. Proc. Natl Acad. Sci. USA 106, 15979–15984(2009).
24. Dang, K. V. et al. Combined increases in mitochondrial cooperation and oxygenphotoreduction compensate for deficiency in cyclic electron flow inChlamydomonas reinhardtii. Plant Cell 26, 3036–3050 (2014).
Acknowledgements This work was supported by grants from Agence Nationale de laRecherche (ANR-12-BIME-0005, DiaDomOil to C.B., D.P. and G.F.;ANR-8NT09567009, Phytadapt to B.B., G.F. and C.B.; ANR-11-LABX- 0011-01,Dynamo to F.R. and P.J.; ANR-11-IDEX-0001-02, PSL Research University andANR-10-LABX-54, MEMOLIFE to C.B.), the Region Rhone-Alpes (Cible project) to G.F.,the Marie Curie Initial Training Network Accliphot (FP7-PEPOPLE-2012-ITN; 316427)to G.F., D.P., S.F. and V.V., an ERC Advanced Award (Diatomite) and the EU MicroB3project to C.B., the CNRS Defi (ENRS 2013) to G.F. and L.T., and the CEA Bioenergiesprogram to G.F and D.P. P.C., N.B. and B.B acknowledge financial support from theBelgian Fonds de la Recherche Scientifique F.R.S.-F.N.R.S. (F.R.F.C. 2.4597.11, CDRJ.0032.15 and Incentive Grant for Scientific Research F.4520). B.B. also acknowledgesa post-doctoral fellowship from Rutgers University and J.P. was funded from the COSIITN project to C.B. Thanks are due to J.-L. Putaux and C. Lancelon-Pin for help withelectron microscopy, to L. Moyet for technical support for the in vivo NMR analysis, toA. E. Allen for the AOX antibody, and to A. Falciatore and F. Barneche for critical readingthe manuscript.
Author Contributions B.B., L.T., C.B. and G.F. designed the study. B.B., N.B., O.M., D.P.,J.P., A.T., V.V., R.B., S.F., D.F., A.K-L, F.R., P.J., L.T., P.C. and G.F. performed experiments.B.B., N.B., O.M., D.P., R.B., A.K.-L., S.S., F.R., P.J., L.T., P.F., P.C., C.B. and G.F. analysed thedata. B.B., C.B. and G.F. wrote the manuscript, and all authors revised and approved it.
Author Information Reprints and permissions information is available atwww.nature.com/reprints. The authors declare no competing financial interests.Readers are welcome to comment on the online version of the paper. Correspondenceand requests for materials should be addressed to B.B. ([email protected]), C.B.([email protected]) or G.F. ([email protected]).
LETTER RESEARCH
G2015 Macmillan Publishers Limited. All rights reserved
2 0 A U G U S T 2 0 1 5 | V O L 5 2 4 | N A T U R E | 3 6 9

METHODSNo statistical methods were used to predetermine sample size. The experimentswere not randomized. The investigators were not blinded to allocation duringexperiments and outcome assessment.Growth conditions. Wild-type and AOX transformant lines of P. tricornutumPt1 8.6 (CCMP 2561) were grown in artificial sea water (ASW25). T. pseudonana(CCMP 1335), T. weissflogii (CCMP 1336), F. pinnata (CCAP 1029/2) andD. brightwellii (CCMP 359) were grown in F/2 medium, supplementedwith silicate26. All strains were grown at 19 6 1 uC in semi-continuous batchculture (with moderate shaking for P. tricornutum, T. pseudonana andT. weissflogii). The photoperiod was 12 h light/12 h dark, and light irradiancewas 70mmol quanta m22 s21. Cell concentration was determined daily with aZ2 Coulter Counter analyser (Beckman Coulter) to ensure all the experimentswere performed with cells in exponential phase. For biophysical measurements,cells were concentrated by centrifugation and resuspended in their growth med-ium (supplemented with 10% w/v Ficoll to prevent cell sedimentation) and keptin the dark at least 30 min before measurements.Inhibitors. DCMU, 2,5-dibromo-3-methyl-6-isopropyl-p-benzoquinone (DBMIB),FCCP, AA, myxothiazol and SHAM (Sigma-Aldrich) were dissolved in ethanol,whereas hydroxylamine, glucose, glucose oxidase and catalase (Sigma-Aldrich)were dissolved in deionized water. FCCP was used at a very low concentration(8 mM, Fig. 1d) to allow the disruption of the dark PMF without preventing thelight-induced generation of PMF needed to quantify DYd. AA and myxothiazolwere used at 5mM, unless otherwise stated. DCMU was used at a concentration of15 mM. In every measurement involving hydroxylamine or SHAM, the lowestinhibitor concentration to induce a full inhibition of PS II activity or maximuminhibition of respiration, respectively, was used. The range of concentrationsused was 30–100mM and 0.5–1 mM for hydroxylamine and SHAM, respec-tively. Anaerobic conditions were obtained through incubation with catalase(1,000 U ml21), glucose (10 mM) and glucose oxidase (20,000 U ml21). AA hasbeen previously described as an inhibitor of cyclic electron flow, affecting theNDH-independent pathway27. This potential effect was ruled out in diatomsbecause no change in cyclic electron flow was noticed upon addition of AA.Consistent with the fact that genes encoding some members of the NDH complexare absent in diatom genomes, this indicates that AA does not affect the NDH-independent CEF pathway in diatoms. AA and myxothiazol were preferred topotassium cyanide to block the cyanide sensitive pathway of respiration becausepotassium cyanide also affects Rubisco activity28, ascorbate peroxidase29 and Cu/Zn superoxide dismutase30.Deconvolution of linear and quadratic ECS components. To deconvolute thelinear and quadratic contributions to the ECS signals, cells were left for an hour inthe cuvette to reach complete anaerobiosis. In these conditions, the ATP synthaseactivity is slowed down31, and long-living ECS signals are no longer contaminatedwith other light-induced absorption changes (principally associated with c-typecytochromes). Light stimulation of cells was achieved with a series of six lasersingle-turnover (duration ,7 ns) saturating flashes, provided by a laser dye (LDS698) pumped by a frequency doubled Nd-YAG laser (Quantel). We consideredthat the relaxation of the electric field generated by the light stimulus is describedby the exponential function DY 5DY0 exp(2t/t), where t is time, DY0 is theinitial electric field generated by the light, and t is the electric-field decay lifetime.The linear and quadratic components of the ECS are theoretically proportionalto DY and DY2, respectively. Therefore, the DI/I spectro-temporal matrices(from 460 to 600 nm) can be described by a sum of two exponentials:y(l,t)~A(l) exp ({t=t)zB(l) exp (({2t=t))zC(l). The kinetics of ECSrelaxation were fitted by a global routine, which considers the lifetime t as a global(wavelength-independent) variable, and the amplitudes of linear and quadraticcomponents (A and B, respectively) as local (wavelength-dependent) variables. Anon-decaying component (C) was also included in the fit to account for a smallfraction of residual signal at long delay times. The plot of the A and B amplitudes asa function of the wavelength provides the decay associated spectra of the linear andquadratic contributions to the ECS signal, respectively, which are shown in Fig. 1a.The fit was performed with homemade software, which used the MINUIT pack-age, developed and distributed by CERN (Geneva, Switzerland) and implementedin FORTRAN77. It minimizes the reduced sum of squared residues between themodel function and the experimental data, employing a two-step protocol invol-ving an initial search that utilizes the Simplex method (Nelder–Mead algorithm)and a refined search using the Levenberg–Marquardt algorithm as described in ref.32. The quality of the fit description was judged on the basis of reduced sum ofsquared residues statistics, visual inspection of the fit residuals, residuals autocor-relation and stability of the solutions upon random perturbation of the best-fit.The deconvolution was performed on two independent biological samples, givingsimilar results.
Measurements of c-type cytochromes and linear and quadratic ECS.Absorption difference signals were measured at different wavelengths with aJoliot-type spectrophotometer (JTS-10, Biologic), equipped with a white probingLED and the appropriate interference filters (3–8 nm bandwidth). For DYd
measurements, the PMF was increased using an ,10 ms pulse of saturating(4,500mmol quanta m22 s21) red light (see Extended Data Fig. 3 for represent-ative ECS kinetics). For P. tricornutum, ECS signals were evaluated using threewavelengths, to eliminate contribution from c-type cytochromes (see ExtendedData Fig. 2). The latter was calculated as cyt c 5 [554] 2 0.4[520] 2 0.4[566],where [554], [520] and [566] are the absorption difference signals at 554 nm, 520nm and 566 nm, respectively. The very similar relaxation of c-type cytochromes inaerobic and anaerobic conditions, despite very different ECS relaxations(Extended Data Fig. 2b), demonstrates the validity of the cyt c deconvolutionprocedure. Then, ecslin and ecsquad (ECS signals before correction for DYd)were estimated from the following relationships: ecslin 5 [520] 2 0.25cyt c andecsquad 5 [566] 1 0.15cyt c. For the other diatoms, appropriate wavelengths werechosen for calculating ecslin and ecsquad (red and blue lines in Fig. 4) to minimizethe cytochrome c contributions. The relationships between ecsquad and ecslin werefitted with the parabolic equation ecsquad 1 aDYd
2 5 a(ecslin 1DYd)2, whereDYd is the electrical component of the PMF in the dark and a is constant for allthe conditions in a diatom species (see Extended Data Fig. 2c). The ecslin andecsquad values represent ECS changes relative to dark values. Therefore, we cor-rected them for the dark electric field. This leads to ECSlin 5 ecslin 1DYd, andECSquad 5 ecsquad 1 aDYd
2, namely absolute values of the ECS signals. This sim-ply corresponds to a shift of the x- and y-axes to allow the minimum of theparabola to coincide with the origin of the axes (see Extended Data Fig. 2d),and gives ECSquad 5 aECSlin
2. This leads to the evaluation of DYd as the minimalECSlin value of the experimental data. In Fig. 1c, d, and Extended Data Fig. 2c, d,ECS data were normalized to the ecslin increase upon a saturating laser flash (thatis, one charge separation per photosystem, see ref. 33). This allows the estimationof DYd in P. tricornutum as approximately five charge separations by PS, namely,100 mV (ref. 12) (Fig. 1c). The presence of linear and quadratic ECS componentsallows measurement of the absolute value of DY in the dark (DYd). Indeed theamplitude of the linear ECS response (ecslin) observed upon a light stimulusincreasing DY is constant, namely independent of the value of the field pre-existing the illumination (DYd). Conversely, the amplitude of the quadraticECS response (ecsquad) is a function of the value of DYd. Therefore, plotting theamplitude of the ecsquad versus ecslin allows quantification of the absolute value ofthe electric field in the dark (DYd).
Cyt b6f turnover was measured through the slow phase (phase b31) of the linearECS, which reflects b6f-catalysed charge transfer across the membranes, andthrough the reduction rate of the c-type cytochromes (c6/f), using the three-wave-lengths deconvolution procedure described above. Measurements were performedafter a saturating laser flash.Measurements of photosynthetic flows. For calculation of the TEF (the sum oflinear and cyclic electron flows) and CEF capacities, we measured the photoche-mical rates in the absence and presence, respectively, of DCMU. In brief, understeady-state illumination conditions, the ECS signal results from concomitanttransmembrane potential generation by PS II, the cytochrome b6f complex andPS I, and from transmembrane potential dissipation by the plastid ATP synthase.When light is switched off, PS activities stop immediately, while ATP synthase andcytochrome b6f complex activities remain (transiently) unchanged. Therefore, thedifference between the slopes of the linear ECS signal (ECSlin) measured in thelight and after the light is switched off (SD 2 SL) is proportional to the rate of PS Iand PS II photochemistry (that is, to the rate of ‘total’ electron flow, Extended DataFig. 3a). Because the linear ECS has been normalized to the amplitude of the linearECS signal induced by a saturating laser flash34 (see above), the difference of slopesevaluates the number of charge separations per photosystem and per second. Therate of CEF can be evaluated using the same approach under conditions where PSII activity is inhibited by DCMU, and dividing this slope by the linear ECS signalinduced by a saturating laser flash in the presence of PS II inhibitors (one chargeseparation per PS I (ref. 34)). This was done using saturating concentrations ofDCMU, which block PS II oxidation, and of hydroxylamine, to avoid chargerecombination within PS II.Fluorescence-based measurements. Fluorescence-based photosynthetic para-meters were measured with a fluorescence imaging setup described in ref. 35.Photosynthetic electron transfer rate ETRPS II and NPQ were calculated, respect-ively, as I(Fm9 2 F)/Fm9 and (Fm 2 Fm9)/Fm9, where F and Fm9 are the steady-stateand maximum fluorescence intensities in light-acclimated cells (respectively),Fm is the maximal fluorescence intensity in dark-adapted cells, and I isthe light irradiance in mmol quanta m22 s21 (refs 36, 37). In Fig. 2c andExtended Data Fig. 4a, d, the light irradiance is 30mmol quanta m22 s21. Thelight saturation curves of ETRPS II were fitted with the exponential rise function
RESEARCH LETTER
G2015 Macmillan Publishers Limited. All rights reserved

P 5 Pmax(1 2 exp(E/Ek)), where Pmax is the maximal photosynthetic electrontransport rate and Ek is the optimal light. DETR/ETR (Fig. 3a) was calculated as(ETRref 2 ETR) 3 100/ETRref, the reference being the value measured in wild-typecells in untreated conditions.Membrane-inlet mass spectrometry measurements. Samples were introducedin a 3 ml thermostated cuvette, which was connected to a Quadrupole MassSpectrometer (QMS 200, Pfeiffer Vacuum Prisma) by a stainless steel vacuumtube (0.125 inches) passing through a water trap filled with ethanol and dry ice.The sample was separated from the tube via a gas-permeable inlet system (poly-tetrafluoroethylene (PTFE) membrane). 18O2 was added as a bubble to the algalsuspension, and the bubble was removed before the experiment. The measure-ments of the partial pressures of 16O2 (p16O2, m/z 5 32), 18O2 (p18O2, m/z 5 36)and argon (m/z 5 40) were performed after the cuvette was sealed. A blue light-emitting diode (LED) source was connected to the cuvette, and the light irradiancewas manually adjustable in the 0 to ,800mmol quanta m22 s21 range. The tem-perature was kept at 19 6 1 uC in the cuvette during the experiment.
To calculate gross O2 production (E0) and uptake (U0), respectively productionand consumption by the cells, we adapted the equations from ref. 38:
U0~(D½18O��Dtzk½18O�)((½18O�z½16O�)
�½18O�)
E0~(D½16O��Dtzk½16O�)zU0((½18O�z½16O�)
�½16O�)
where k is the rate constant of O2 decrease measured in the absence of algae. Wenormalized O2 to Argon (a biologically inert gas with very similar solubilityproperties), which decreases the sensitivity of O2 measurements to fluctuationsby ,80% (ref. 39). The gas concentrations were calibrated by measuring the air-equilibrated O2 concentration (stirring deionized water in the open cuvette for atleast 5 h) and background O2 (bubbling with N2).Respiration rates. Respiration rates were measured as O2 exchange rates using aClark-type oxygen electrode at 19 uC (Hansatech Instruments). AOX capacity wasmeasured as SHAM-sensitive respiration in conditions where the cyanide-sens-itive pathway was inhibited beforehand (AA, 5mM).ATP/NADPH in vivo measurements. NADP1/NADPH redox changes werefollowed in living cells using a Dual-PAM (Walz). NADPH fluorescence wasmeasured at 460 nm, upon excitation in the near ultraviolet. Chlorophyll a con-centration was ,5mg ml21. ATP content was measured using an in vivo 31P-AMX400 NMR spectrometer equipped with a 25-mm multinuclear probe tuned at 161.9MHz, and a homemade lighting system, as described in ref. 40. The relative ATPcontent was estimated in vivo from the surface of a-, b- and c-phosphorus res-onance peaks corresponding to the three phosphates of NTPs, which dominate theNMR spectra with inorganic phosphate and polyphosphates41.Western blots and immunolocalization. Protein samples (5–10mg) were loadedon 13% SDS–polyacrylamide gel electrophoresis (PAGE) gels and blotted to nitro-cellulose. Primary AOX antibody was custom designed (Sdix, 1:4,000 dilution). Allother antisera used were obtained from Agrisera (http://www.agrisera.com/en/info/catalog.html). The blots were developed with ECL detection reagent andimages of the blots were obtained using a CCD (charge-coupled device) imager(Chemidock MP Imaging, Bio-Rad). The results presented in Fig. 3b are repres-entative of a total of five western blots on independent biological samples.Immunolocalization of AOX was generally done as described in ref. 34. Briefly,cells were fixed with 2% formaldehyde in culture media for 20 min, washed threetimes with marine phosphate buffer (mPBS, see ref. 42) and permeabilized by 1%Triton X-100 in mPBS for 10 min. The cells were washed again, blocked for 30 minin 1% BSA in mPBS, and incubated overnight at room temperature (25 uC) withanti-AOX antibody from rabbit (custom design, Sdix, 1:200 dilution in mPBS).The cells were then rinsed with mPBS and incubated with donkey Alexa 488-conjugated anti-rabbit IgG antibody (Life Technologies, at 1:100 dilution inmPBS) for 2 h at room temperature. Cells were then stained with 0.5mg ml21
DAPI (49,69-diamidino-2-phenylindole, Life Technologies) for 10 min andmounted with Vectashield (Vector Laboratories) after a rinse. Finally the cellswere observed using a Leica SP5 confocal microscope (Leica Microsystems).Electron microscopy. For transmission electron microscopy, P. tricornutumcells were fixed in 0.1 M cacodylate buffer (Sigma-Aldrich), pH 7.4, containing2.5% glutaraldehyde (TAAB), 2% formaldehyde (Polysciences) for 1 h at roomtemperature and then prepared according to a modified protocol from T. J.Deerinck et al. (http://ncmir.ucsd.edu/sbfsem-protocol.pdf). After the dehyd-ration steps, the cells were infiltrated with ethanol/Epon resin mixture (2/3–1/3
for 1 h and 1/3–2/3 for 1 h) and finally embedded in Epon in a 60 uC oven for 48 hor longer. Ultrathin sections (60 nm) were prepared with a diamond knife on anUC6 Leica ultramicrotome and collected on 200mM mesh nickel grids beforeexamining on a JEOL 1200 EX electron microscope.AOX knockdown lines. Partial coding sequence of AOX (identity Phatr2_bd1075) was amplified using primers AOXcFwd (TGCTCCGGAGGACAATGAATTCGC) and AOXcRev (TGGTCTAGACGTCGCGATGTTC), cut byEcoRI/XbaI (Fermentas) and cloned into an EcoRI/XbaI-digested antisense con-struct43, under control of the FcpB promoter. The AOX antisense constructwas introduced into wild-type P. tricornutum cells using the standard micropar-ticle bombardment procedure with a PDS-1000/He Particle Delivery System(Bio-Rad)43,44. After 2 days, cells were transferred to F/2-supplemented–filteredseawater plates containing 100mg ml21 phleomycin, a selective antibiotic for theSh ble gene (InvivoGen, 09K30-MM). Putative antisense lines were verified for thepresence of the transformed DNA by PCR screening using the primers ShbleFwd(ACCAGTGCCGTTCCGGTG) and ShbleRev (TCGGTCAGTCCTGCTCCTC),and the most strongly silenced lines were chosen on the basis of reduction of AOXprotein levels as measured by SDS–PAGE western blot with an anti-AOX antibody(see section on western blots and immunolocalization).
25. Vartanian, M., Descles, J., Quinet, M., Douady, S. & Lopez, P. J. Plasticity androbustness of pattern formation in the model diatom Phaeodactylum tricornutum.New Phytol. 182, 429–442 (2009).
26. Guillard,R.R. L. inCulture of Marine InvertebrateAnimals (eds Smith W. L. & ChanleyM. H.) 26–60 (Plenum, 1975).
27. Joet, T., Cournac, L.,Horvath, E.M., Medgyesy,P.&Peltier,G. Increasedsensitivityofphotosynthesis to antimycin A induced by inactivation of the chloroplast ndhBgene. Evidence for a participation of the NADH-dehydrogenase complex to cyclicelectron flow around photosystem I. Plant Physiol. 125, 1919–1929 (2001).
28. Wishnick, M. & Lane, M. D. Inhibition of ribulose diphosphate carboxylase bycyanide. Inactive ternary complex of enzyme, ribulose diphosphate, and cyanide.J. Biol. Chem. 244, 55–59 (1969).
29. Nakano, Y. & Asada, K. Purification of ascorbate peroxidase in spinachchloroplasts; its inactivation in ascorbate-depleted medium and reactivation bymonodehydroascorbate radical. Plant Cell Physiol. 28, 131–140 (1987).
30. Asada,K., Takahashi, M.A.&Nagate, M.Assay and inhibitors of spinach superoxidedismutase. Agric. Biol. Chem. 38, 471–473 (1974).
31. Joliot, P. & Delosme, R. Flash induced 529 nm absorption change in green algae.Biochim. Biophys. Acta 357, 267–284 (1974).
32. Santabarbara, S., Redding, K. E. & Rappaport, F. Temperature dependence of thereduction of p-7001 by tightly bound plastocyanin in vivo. Biochemistry 48,10457–10466 (2009).
33. Melis, A. Kinetic analysis of P-700 photoconversion: effect of secondary electrondonation and plastocyanin inhibition. Arch. Biochem. Biophys. 217, 536–545(1982).
34. Bailleul, B., Cardol, P., Breyton, C. & Finazzi, G. Electrochromism: a useful probe tostudy algal photosynthesis. Photosynth. Res. 106, 179–189 (2010).
35. Johnson, X. et al. A new setup for in vivo fluorescence imaging of photosyntheticactivity. Photosynth. Res. 102, 85–93 (2009).
36. Genty,B., Briantais, J.M.&Baker,N.R.Therelationshipbetween thequantumyieldof photosynthetic electron transport and quenching of chlorophyll fluorescence.Biochim. Biophys. Acta 990, 87–92 (1989).
37. Bilger, W. & Bjorkman, O. Role of the xanthophyll cycle in photoprotectionelucidated by measurements of light-induced absorbance changes, fluorescenceand photosynthesis in leaves of Hedera canariensis. Photosynth. Res. 25, 173–186(1990).
38. Peltier, G. & Thibault, P. O2 uptake in the light in Chlamydomonas. Plant Physiol. 79,225–230 (1985).
39. Kana,T.M.et al.Amembrane inletmassspectrometer for rapidandhigh-precisiondetermination of N2, O2, and Ar in environmental water samples. Anal. Chem. 66,4166–4170 (1994).
40. Rivasseau, C. et al. Accumulation of 2-C-methyl-D-erythritol 2,4-cyclodiphosphatein illuminated plant leaves at supraoptimal temperatures reveals a bottleneck ofthe prokaryotic methylerythritol 4-phosphate pathway of isoprenoid biosynthesis.Plant Cell Environ. 32, 82–92 (2009).
41. Bligny, R. & Douce, R. NMR and plant metabolism. Curr. Opin. Plant Biol. 4,191–196 (2001).
42. Van de Meene, A. M. L. & Pickett-Heaps, J. D. Valve morphogenesis in the centricdiatom Rhizosolenia setigera (Bacillariophyceae, Centrales) and its taxonomicimplications. Eur. J. Phycol. 39, 93–104 (2004).
43. De Riso, V. et al. Gene silencing in the marine diatom Phaeodactylum tricornutum.Nucleic Acids Res. 37, e96 (2009).
44. Falciatore, A., Casotti, R., Leblanc, C., Abrescia, C. & Bowler, C. Transformation ofnonselectable reporter genes in marine diatoms. Mar. Biotechnol. (NY) 1, 239–251(1999).
LETTER RESEARCH
G2015 Macmillan Publishers Limited. All rights reserved

Extended Data Figure 1 | Deconvolution of the quadratic and linear ECSin P. tricornutum. a, Absorption difference (DI/I) kinetics followed atdifferent wavelengths in P. tricornutum, after a series of six saturating laserflashes, in anaerobic conditions. Solid lines correspond to the global fit of theexperimental data with a sum of two exponential decays, with time constantst and 2t, respectively, as expected for linear and quadratic dependencies
(see Methods). b, DI/I spectra are shown at different times during ECSrelaxation. All spectra were normalized to 1 at 520 nm for better comparison.The observation that the blue and green parts of the spectrum are homotheticduring relaxation, while changes are seen in the red most part of it, reflectsthe presence of the two ECS components, having different relaxation kinetics.
RESEARCH LETTER
G2015 Macmillan Publishers Limited. All rights reserved

Extended Data Figure 2 | Separation of c-type cytochrome signals fromlinear and quadratic ECS signals in P. tricornutum. a, Kinetics of DI/Ichanges at 520, 554 and 566 nm during an ,10 ms pulse of saturating red light(4,500mmol quanta m22 s21) and the subsequent dark relaxation (top: controlconditions; bottom: AA 1 SHAM). b, Kinetics of ecslin, ecsquad changes andc-type cytochrome redox state, from kinetics in a, after deconvolution asexplained in Methods. c, d, Relationship between the quadratic and the linear
ECS, before (ecslin, ecsquad, c) and after (ECSlin, ECSquad, d) correction forthe dark electric field (see Methods). Dark yellow and magenta symbolscorrespond to control and AA 1 SHAM conditions, respectively. The greenarrow indicates the value of DYd in control conditions. Data are representativeof five independent biological samples. The black boxes in a and b indicateperiods of darkness.
LETTER RESEARCH
G2015 Macmillan Publishers Limited. All rights reserved

Extended Data Figure 3 | Cyclic electron flow and water-to-water cycles inP. tricornutum. a, Representative traces of changes in ECSlin (normalized asexplained in Methods, namely expressed in charge separation per PS) toevaluate linear and cyclic electron flow. Cells were illuminated with 1,870mmolquanta m22 s21 of red light, in absence (filled circles) and presence (opencircles) of DCMU and then transferred to the dark; r.u., relative units.b, Representative traces of the 16O2 and 18O2 concentrations at the offset of a280mmol quanta m22 s21 blue light; a.u., arbitrary units. In a and b, lightand dark periods are represented by white and black boxes, respectively.
c, Photochemical rate corresponding to total electron flow (TEF, dark symbols,data from four independent biological samples) and CEF (red symbols,n 5 8 6 s.d.) at different irradiances. TEF and CEF were estimated from theinitial slope of the ECS decay, as (SD 2 SL control) and (SD 2 SL DCMU),respectively (see Methods). d, Light-dependencies of oxygen uptake (U0,half-filled symbols) and gross photosynthesis (E0, open symbols) in controlconditions (dark) and in the presence of DCMU (red). Data from twoindependent biological samples (squares and circles).
RESEARCH LETTER
G2015 Macmillan Publishers Limited. All rights reserved

Extended Data Figure 4 | DYd and photosynthesis under respiratoryinhibition in P. tricornutum. a–c, Dependency of the ETRPS II (a), DYd
(b) and dark respiration (c) upon inhibition of the cyanide-sensitive respiratorypathway with different concentrations of antimycin A, in the presence ofsaturating SHAM (1 mM). Data from two independent biological samples.Experimental data were fitted with a mono-exponential decay function.
d, e, ETRPS II (d), DYd and dark respiration (e), expressed as percentage ofcontrol, in the presence of saturating AA (5mM), SHAM (1 mM) orAA 1 SHAM (four independent experiments 6 s.d.). f, Relationship betweenDYd and mitochondrial respiration in samples treated with increasingconcentrations of AA in the presence of 1 mM SHAM (mean value 6 s.e.m.from b and c).
LETTER RESEARCH
G2015 Macmillan Publishers Limited. All rights reserved

Extended Data Figure 5 | Dark respiration, PMF and growth in AOXknockdown lines of P. tricornutum. a, Respiratory activity of wild-type andAOX knockdown lines. Total respiration rate (red bars) and the contribution ofthe AOX capacity (white bars, see Methods) were normalized to wild-typevalues (n 5 5 6 s.d.). b, ECS-based measurements of DYd in wild-type(n 5 3 6 s.d.) and AOX knockdown lines (n 5 2 6 s.e.m.), in control
conditions (green), in the presence of AA (dark green) and in the presence ofAA 1 SHAM (white). c, Growth curves of wild-type and AOX knockdownlines in the presence/absence of AA (2mM). Three independent growth curvesare shown for each strain/condition. AA was added every day and cells weregrown in continuous light to prevent them from dying in the dark becauseof lack of respiration.
RESEARCH LETTER
G2015 Macmillan Publishers Limited. All rights reserved

Extended Data Figure 6 | Subcellular localization of AOX in P. tricornutumand plastid–mitochondria interaction in P. tricornutum wild-type cells.a, Subcellular localization of AOX. Cells were treated with an anti-AOXantibody and then with a secondary Alexa Fluor 488 antibody (see Methods).Positions of plastid and nuclei are indicated by chlorophyll a autofluorescence(red) and DAPI staining (blue), respectively. The pattern of AOX
localization is highly similar to that observed with the mitochondria-specificmito-tracker probe (data not shown). Images are representative of 60 cellsfrom three independent biological samples. b, Electron micrographs of theplastid–mitochondria juxtaposition in P. tricornutum. Arrows indicate possiblephysical contacts between the plastid and mitochondrial membranes. Image isrepresentative of 51 images from seven independent biological samples.
LETTER RESEARCH
G2015 Macmillan Publishers Limited. All rights reserved

Extended Data Figure 7 | Cytochrome b6f turnover in P. tricornutumwild-type and AOX knockdown lines. a, Schematic representation of theelectron-flow reaction steps in the cytochrome b6f complex, which can beevaluated by spectroscopic measurements. b, Slow phase of ECSlin indicatingcytochrome b6 activity (top) and time-resolved redox changes of cytochromesc6/f (bottom) in wild-type and AOX knockdown lines (kd-c5 and kd-c9).P. tricornutum cells were exposed to saturating single-turnover laser flashes
given 10 s apart. Data were normalized to the amplitude of the fast phase of theECSlin signal. Cytochrome c and ECSlin were deconvoluted as explained inMethods. Three independent biological samples are shown in red, blue andgreen colours. Cell concentration was 2 3 107 cells per millilitre. Note that boththe slow phase of the ECSlin and the reduction of cytochromes c6/f werecompletely abolished by the plastoquinone competitive inhibitor DBMIB(10mM; black arrow).
RESEARCH LETTER
G2015 Macmillan Publishers Limited. All rights reserved
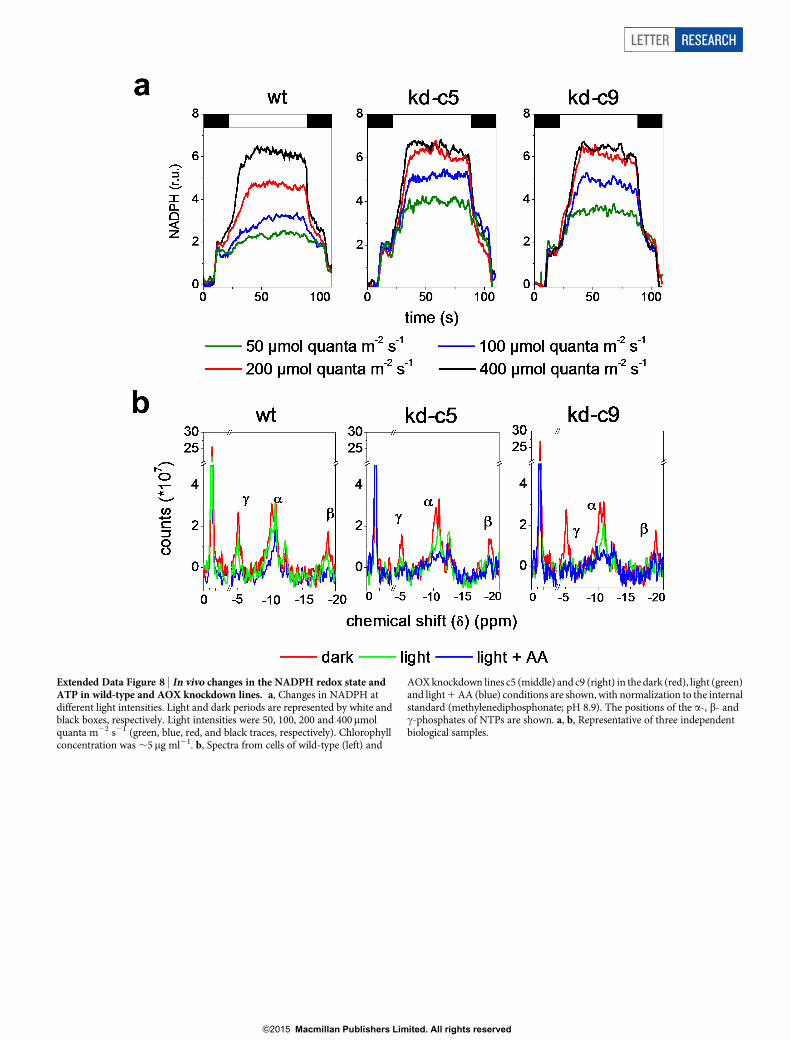
Extended Data Figure 8 | In vivo changes in the NADPH redox state andATP in wild-type and AOX knockdown lines. a, Changes in NADPH atdifferent light intensities. Light and dark periods are represented by white andblack boxes, respectively. Light intensities were 50, 100, 200 and 400mmolquanta m22 s21 (green, blue, red, and black traces, respectively). Chlorophyllconcentration was ,5mg ml21. b, Spectra from cells of wild-type (left) and
AOX knockdown lines c5 (middle) and c9 (right) in the dark (red), light (green)and light 1 AA (blue) conditions are shown, with normalization to the internalstandard (methylenediphosphonate; pH 8.9). The positions of the a-, b- andc-phosphates of NTPs are shown. a, b, Representative of three independentbiological samples.
LETTER RESEARCH
G2015 Macmillan Publishers Limited. All rights reserved

Extended Data Figure 9 | Cyclic electron flow in representative diatoms.a, Total electron flow (filled symbols) was measured at different lightirradiances, as illustrated in Extended Data Fig. 3, in T. weissflogii (black, n 5 3independent biological samples), T. pseudonana (blue, n 5 2) and F. pinnata
(red, n 5 4). Cyclic electron flow capacity was also measured for every species(open circles, five independent biological samples 6 s.d.). b, CEF capacity wasplotted against TEF. CEF and TEF are presented as mean values 6 s.d. froma. The green line corresponds to CEF 5 5% of the maximal total electron flow.
RESEARCH LETTER
G2015 Macmillan Publishers Limited. All rights reserved

Extended Data Figure 10 | DYd and photosynthesis under conditions ofrespiratory inhibition in representative diatoms. Dark respiration (a–d),DYd (e–h) and ETRPS II (i–l) in untreated cells and after treatment withinhibitors of respiration antimycin A, and/or SHAM at saturatingconcentrations. a, e, i, T. weissflogii (black). b, f, j, T. pseudonana (blue).
c, g, k, F. pinnata (red). d, h, l, D. brightwellii (green). The data represent themean value 6 s.d. of three (l), four (d), five (f, h, k), six (a, c, e, j), seven (b, i) oreight (g) independent experiments. All data were normalized to the controlvalue.
LETTER RESEARCH
G2015 Macmillan Publishers Limited. All rights reserved