Embed Size (px)
Citation preview
NASA / TM--2 002-211692
Lessons Learned From CM-2
Modal Testing and Analysis
Mark E. McNelis, Thomas W. Goodnight, and Kelly S. CarneyGlenn Research Center, Cleveland, Ohio
Kim D. Otten
Analex Corporation, Brook Park, Ohio
June 2002
https://ntrs.nasa.gov/search.jsp?R=20020062759 2018-07-14T18:56:32+00:00Z
NASA / TM---2002-211692
Lessons Learned From CM-2
Modal Testing and Analysis
Mark E. McNelis, Thomas W. Goodnight, and Kelly S. CarneyGlenn Research Center, Cleveland, Ohio
Kim D. Otten
Analex Corporation, Brook Park, Ohio
Prepared for the
Ninth International Congress on Sound and Vibration
cosponsored by the NASA Kennedy Space Center, the International Institute
of Acoustics and Vibration, and the University of Central FloridaOrlando, Florida, July 8-11, 2002
National Aeronautics and
Space Administration
Glenn Research Center
June 2002

NASA Center for Aerospace Information7121 Standard Drive
Hanover, MD 21076
Available from
National Technical Information Service
5285 Port Royal Road
Springfield, VA 22100
Available electronically at h_" Z Zgltrs.grc.nasa.gov/GLTRS
LESSONS LEARNED FROM
CM-2 MODAL TESTING AND ANALYSIS
Mark E. McNelis, Thomas W. Goodnight, and Kelly S. Carney
National Aeronautics and Space AdministrationGlenn Research Center
Cleveland, Ohio 44135, USA
Kim D. Otten
Analex Corporation
Brook Park, Ohio 44142, USA
Abstract
The Combustion Module-2 (CM-2) is a space experiment that launches on Shuttle mission STS-
107 in the SPACEHAB Double Research Module. The CM-2 flight hardware is installed into
SPACEHAB single and double racks. The CM-2 flight hardware was vibration tested in the
launch configuration to characterize the structure's modal response. Cross-orthogonalitybetween test and analysis mode shapes Were used to assess model correlation. Lessons learned
for pre-test planning and model verification are discussed.
INTRODUCTION
The Combustion Module-2 (CM-2) is a combustion science experiment consisting of eightpackages installed into SPACEHAB single and double racks. CM-2 is manifest for Shuttle
mission STS-107 in the SPACEHAB Double Research Module. The CM-2 hardware is a
reflight of CM-1 hardware, which was originally designed and environmentally qualified for
Spacelab for Shuttle missions STS-83 (April 4, 1997) and STS-94 (July 1, 1997).
Modal testing and model correlation analysis was conducted on the modified double rack
flight hardware (center post removed) for the purpose of finite element model verification.
Verified rack models are analytically installed into the SPACEHAB Double Research Module for
an integrated Shuttle coupled loads analysis.
TEST AND ANALYSIS OBJECTIVES
The objective of the CM-2 modal testing was to characterize the primary modes in each axis for
the test configuration. The objective of the CM-2 model correlation was to establish
correspondence between test and analysis primary mode shapes. The cross-orthogonality
correlation goal is greater than 0.9 for diagonal terms, and less than 0.1 for off-diagonal terms of
the matrix. The fundamental frequency correlation goal in each axis is + 5 percent, and + 10percent for higher order frequencies.
NASA/TM_2002-211692 1
Base shake modal testing was implemented using a 35,000 pound force verticalelectrodynamicshaker, and a 28,000 pound force horizontal electrodynamicshaker and 96channelsof digital dataacquisitionat the NASA Glenn ResearchCenter'sStructuralDynamicsLaboratory. This approachwas innovativein that it combinedenvironmentalandmodal testing(Reference1).
The test configuration incorporateda rigid fixture attached to the doublerack, andsupportedby the shakerwith a 72 inch expanderhead. The double rack test configuration isshownin Figure 1. Thedoublerackhasdimensions-80inchesheight,41 inch width and29 inchdepth. The L-shapedfixture weighed1,360poundsandwasconstructedfrom 6 inch x 6 inch x½ inch box beams. The emptyfixture fundamentalfrequencieswere 120Hz (Z-axis), 142Hz(Y-axis), and 158Hz (X-axis). Thetestconfigureddoublerackweighed2,480poundsincludingthe double rack, five packagesand the test fixture. Four control accelerometersand five loadcells (three-axisstrain gaugetype) locatedat the rack to fixture interface were usedfor testcontrol andlimit response(Figure2). Racktestexcitationincludedsinusoidal(excitation level:_/8,_A,½, g's-peak,frequencyrange:5-400Hz) andrandomvibration (excitationlevel: ¼ flightexcitationwith anoverall of 0.75Grms,frequencyrange-20-2,000Hz). Sinusoidaltestingwasconductedat severallow level excitationsto assesslinearityof the structure. The rack structurerespondedas a strain softeningsystem. Testcontrol wasexcellentwith respectto the randomvibration excitation. Frequencyresponsefunctions (FRFs)were computedbasedon the H2 -Gyy/Gxymethod (emphasizingresonant response)using a reference triaxial accelerometermountedon the shakertable. Due to laboratoryconstraints(dataacquisitionandaccelerometeravailability), 82responseaccelerometerswereusedfor modaltesting.
Pre-test modal analysis was performed using a three-tiered approach to defineaccelerometerlocations: 1) kinetic energy,2) systematizedGuyanreduction (Reference2), and3) engineeringjudgment. Thecriterionfor selectionof targetmodesis basedoneffectivemodalmass(> 10%). Pre-testtargetmodesof thetest configurationwere 31.4Hz (X-axis), 36.1Hz(Y-axis), 52.1 Hz and 53.4 Hz (Z-axis). The two closely spacedZ-axis modescould not bedifferentiateddue to spatialunder samplingusing the 82 channelresponseaccelerometerset.The lessonlearnedfrom this is to perform modal assurancecriterion and cross-orthogonalitychecksbetweenthe high fidelity finite elementmodel (197,994degreesof freedom) and thereducedfidelity finite elementmodel (82 translationdegreesof freedom)for theprimarymodes.Spatialundersamplingcouldhavebeenavoidedby havingadditionalaccelerometerlocationstobettercharacterizethemodeshape.
TEST AND ANALYSIS RESULTS
Testing was conducted from October 20-25, 1999 at the NASA Glenn Research Center
Structural Dynamics Laboratory. The primary test modes measured were at 24.3 Hz (X-axis),
28.7 Hz (Y-axis), 35.9 Hz and 41.2 Hz (Z-axis). High quality frequency response functions were
obtained from testing. Modal parameter estimation was computed using the polyreference curve
fitting technique. There was test configuration interaction between the rack, fixture, shaker, head
NASA/TM_2002-211692 2
expanderand armatureobservedat 150 Hz, 269 Hz and 400 Hz. Theseinteractionsdid notcompromisethemodaltestasthefrequencyrangeof interestwasfrom 0-75 Hz.
Post-testmodel correlationwasperformedto improvethe finite elementmodelpredictionof the rack test modeshapes. Model improvementsincluded correlatingthe empty fixture bymodifying thestiffnesspropertyof thefixture beamsections(modifyingYoung's Modulus). Thenext stepin thecorrelationprocesswasto analyticallyinstall the doublerackwith the correlatedfixture. Correlationof the analyticalmodel with the primary testmodeswasaccomplishedbyaddingtranslationspringsat therackto fixture interface. Thesespringsrepresentedthestiffnessprovided by the interfaceload cells. A total of 45 iterationswere performedto correlatethemodel. Some model updating was performed to better constrain a front panel packageconnection. A comparisonof the correlatedmodel and test configuration frequency,modalassurancecriteria, and cross-orthogonalityis summarizedin Table 1. Satisfactorycorrelationwas obtained between analysisand test frequencies,with a maximum difference of 4.2%occurring for the primary Z-axis mode. Spatialunder samplingof the two Z-axis modesisevident basedon the low values for the modal assurancecriterion and cross-orthogonalitycalculations.
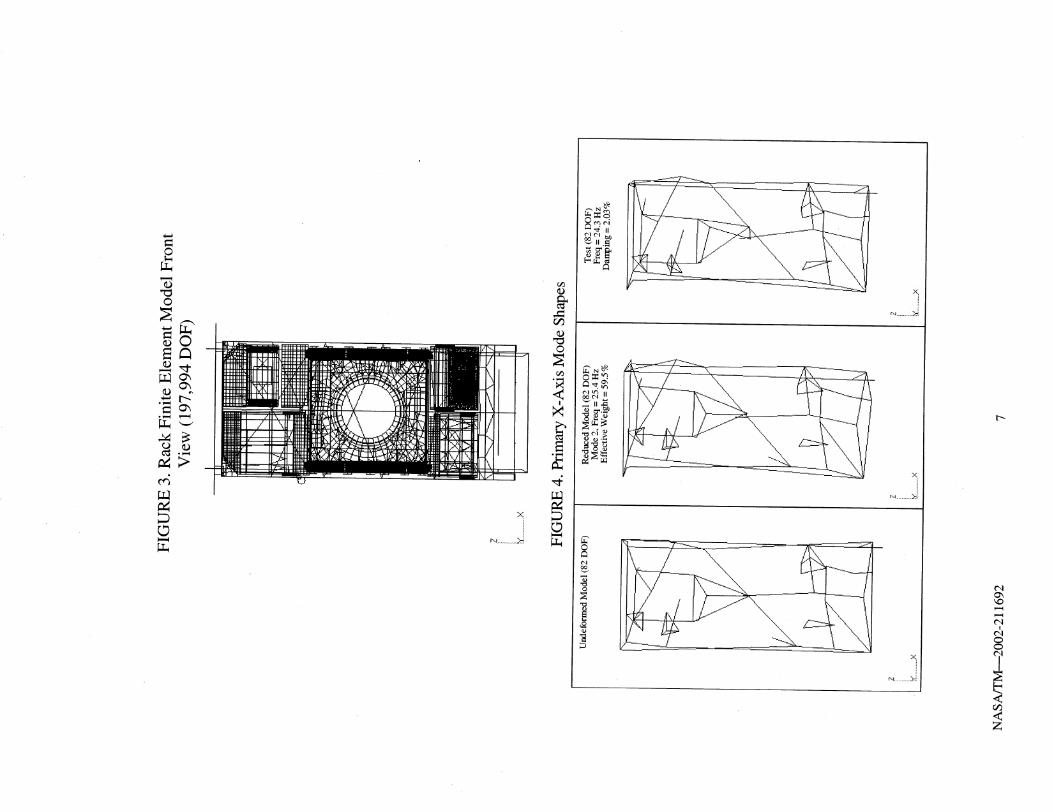
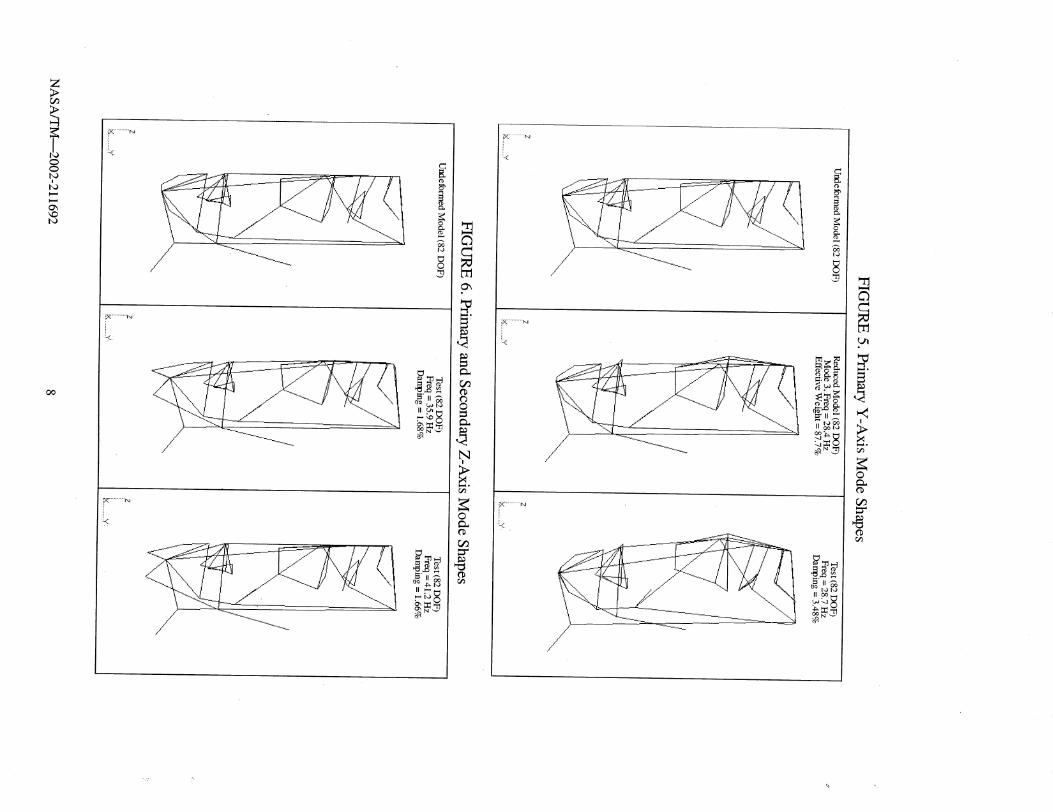
Figure 3 illustratesthe front view of the full (197,774DOF) finite elementmodel. Acomparisonof analysisand testbasedmodeshapesareshownin Figures4, 5, and6. Figures4and 5 illustrate the primary bendingmode shapein the X and Y-axesrespectively. Figure 6illustratestheprimary (combinedY-axis torsionandZ-axis bendingmode)andsecondaryZ-axismodeshapes.
Themodalassurancecriterionandcross-orthogonalityarecomputedbasedonReference3.Modal AssuranceCriterion (MAC) valuesrangefrom 0 (nocorrelationbetweenshapes)to 1 (fullcorrelation).
MACij - ((_tT)i (,a)j) 2 / ((_tT,t)i (_aT0a)j
Cross-Orthogonality is a mass weighted orthogonality.
are 0.9 or greater on the diagonal terms of the matrix.Acceptable cross-orthogonality values
ORTHOij - (_T)i Maa (*a)j
Where:_)a represents the analytical mode shape partitioned to the test degrees of freedom
(_t represents the test mode shapes
M_ represents the analytical mass matrix portioned to the test degrees of freedom
Tables 2 and 3 illustrates the MAC and mass weighted orthogonality comparison for the
high fidelity model (197,994 degrees of freedom) and the reduced model (test degrees of
freedom). The high fidelity model is partitioned to the test locations (82 degrees of freedom).
The high cross-coupling orthogona!ity for the Z-axis modes (off-diagonal orthogonality value of
0.21) indicates it is difficult to discern the difference between the two mode shapes.
NASA/TM_2002-211692 3
Tables4 and5 illustratesthe MAC andcross-orthogonalitycomparisonbetweenanalysisandtest. The analysisresultsarebasedon thehigh fidelity analysismodelpartitionedto thetestdegreesof freedom(reducedmodel). Basedon acomparisonof thesetables,it is evidentthatthecross-orthogonalityyield a highervaluethantheMAC for theprimarymodes. SincetheMAC isnormalizedto thehighestamplituderesponse,the effectof a largeamplitudelocal responsecanmask the global response. Becausethe cross-orthogonalitycalculation is massweighted, iteliminatesthe effectsof local modal response.This highlights the importanceof using cross-orthogonalitycriteriafor modelcorrelation.
CONCLUSIONS
The CM-2 Double Rack combined environmental and modal testing was an economical way to
facilitate verification testing in the NASA Structural Dynamic's Laboratory. The base shake
modal testing approach was taken due to low project funding, and is not a traditional modal test.Lessons learned from the model correlation effort include:
a. The importance of characterizing the degree of nonlinearity of the structure by
performing sinusoidal sweep testing at several excitation levels. Based on the degree ofnonlinearity, the level of difficulty for model correlation can be established.
b. In order to best characterize the primary test mode shapes and avoid spatial under
sampling, it is essential to compute cross-orthogonality between the high fidelity finite
element model and the reduced analysis model (test degrees of freedom), prior to testing.
c. Computation of cross-orthogonality between test and analysis is a more important
criterion for evaluating model correlation than the modal assurance criterion. The cross-
orthogonality check reduces the effects of local modal response by weighting the resultswith the mass matrix.
REFERENCES
1. "CM-2 Environmental/Modal Testing of SPACEHAB Racks," by Mark E. McNelis and
Thomas W. Goodnight, NASA Glenn Research Center, Michael A. Farkas, The Boeing
Company, proceedings from the 7th International Congress on Sound and Vibration, July 4-7,2000, Garmisch-Partenkirchen, Germany.
2. "Cassini Spacecraft Modal Survey Test Report," by Ken S. Smith and Chia-Yen Peng, JPL
Document D-13300, January 22, 1996, California Institute of Technology, Pasadena,California, USA.
3. "Cross-Orthogonality Calculations for Pre-Test Planning and Model Verification," by Ken
B lakely and Ted Rose, proceedings of the 1993 MSC World User's Conference, The
MacNeal Schwendler Corporation, Los Angeles, California, USA.
NASA/TM_2002-211692 4
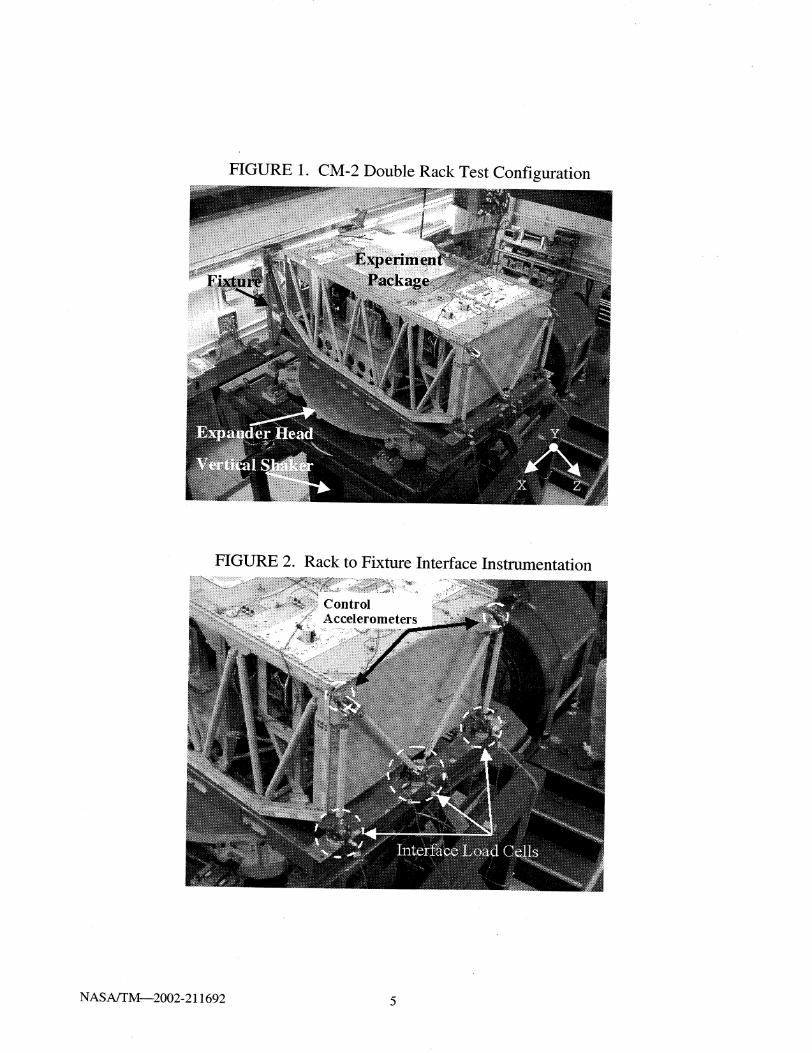
FIGURE 1. CM-2 Double Rack Test Configuration
FIGURE 2. Rack to Fixture Interface Instrumentation':"'.'._:i:: "
NASA/TM_2002-211692 5
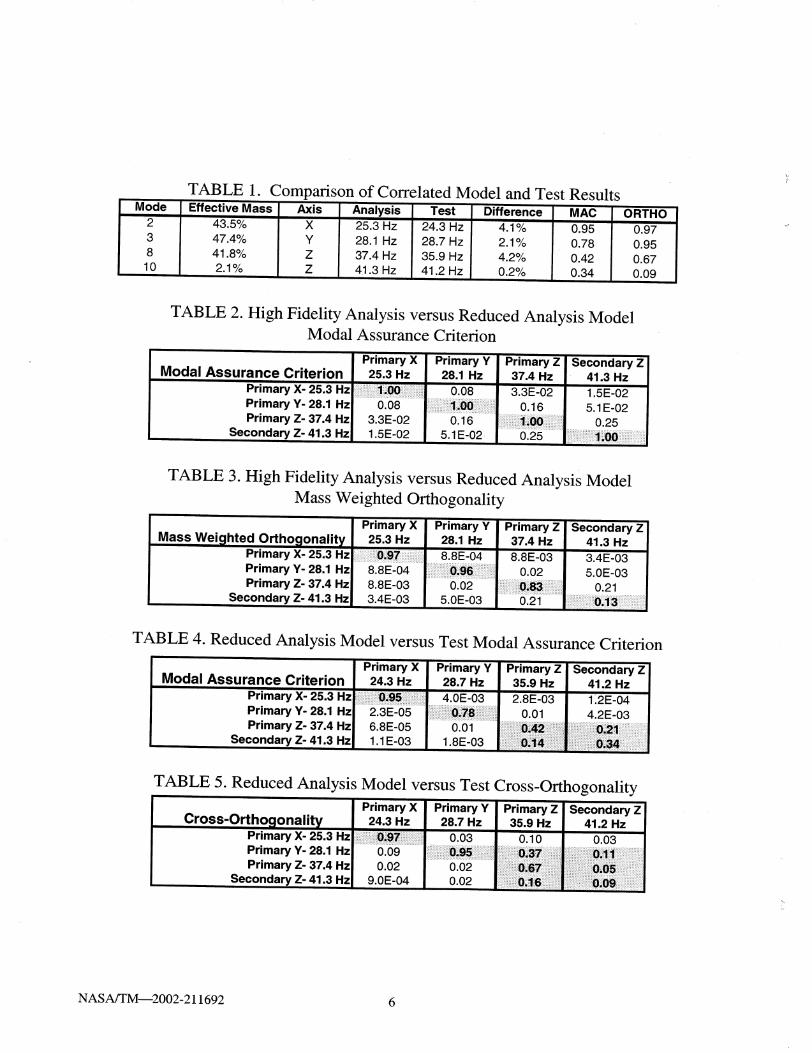
TABLE 1. Comparison of Correlated Model and Test Results
0.93 I 0.97 I0.78 I 0.93 I
0 "42 I 0.67 Ilo I 2.1o/o I z I 41.3 Hz I 41.2 Hz J 0.2% ] 0.34 J 0.09 I
TABLE 2. High Fidelity Analysis versus Reduced Analysis ModelModal Assurance Criterion
Primary X Primary YModal Assurance Criterion 25.3 Hz 28.1 Hz
Prihtary X- 25.3 Hz i', i;ii!i;il_00 0.08
Primary Y-28.1 Hz ...................0.0_ ..............................................._ !00 ..............ii......Primary Z- 37.4 Hz 3.3E-02 0.16
Secondary Z- 41.3 Hz 1.5E-02 5.1E-02
PrimaryZ Secondary Z37.4 Hz 41.3 Hz
3.3E-02 1.5E-02
0.16 5.1E-02
i i_ 0.25....................._.25 .........................i...... ]_
TABLE 3. High Fidelity Analysis versus Reduced Analysis Model
Mass Weighted Orthogonality
Primary X Primary Y
Mass Weighted Ortho_lonality 25.3 Hz 28.1 Hz
Primary X- 25.3 Hzl i iiiii0_ig_ !iiii;iii 8.8E-04Primary Y- 28.1 Hz ..................81:8E_:04:.................i...................Q!96 .......................Primary Z- 37.4 Hz 8.8E-03 0.02
Secondary Z-41.3 Hz 3.4E-03 5.0E-03
Primary Z Secondary Z I37.4 Hz 41.3 Hz
8.8E-03 3.4E-03
0.02 5.0E-030i83 0.21
..........................o:.:2i...................................0_13...... !
TABLE 4. Reduced Analysis Model versus Test Modal Assurance Criterion
Primary X Primary YModal Assurance Criterion 24.3 Hz 28.7 Hz
Primary X- 25.3 Hz i!i!!iiii!0_95ii',ii!iii!;iii 4.0E-03
Primary Y- 28.1 Hz ................:2:.:3E:-0:_..................i Oi_Si "Primary Z- 37.4 Hz 6.8E-05 ......................0:i:():_i......................
Secondary Z- 41.3 Hz 1.1E-03 1.8E-03
Primary Z Secondary Z35.9 Hz 41.2 Hz
2.8E-03 1.2E-04
0.01 4.2E-03
i ii.i!j_i_i_..... ......iiil'........i..i_i_ .........1
TABLE 5. Reduced Analysis Model versus Test Cross-Orthogonality
Primary X Primary YCross-Orthogonality 24.3 Hz 28.7 Hz
Prirhary X- 25.3 Hz .i.i.i.iiiii!!iiiiii:i:i:iO!97iiiiiiiiii:i:i:i:i0.03Primary Y- 28.1 Hz 0.09 ! 0_95Primary Z-37.4 Hz 0.02 .............................O.02 ......................
Secondary Z-41.3 Hz 9.0E-04 0.02
Primary Z Secondary Z I35.9 Hz 41-:_ Hz i0.10 0.03
NASA/TM_2002-211692 6
©
0
X
r---
z
Y°
j, )<... ,,,......._ -- .-"/ ......----;:L.__../1"\2:7<
7.
IJ
©

Form Approved
_ "_ i"_ OMB No. 0704-0188u 'nTormation is estimated to average 1 hour per response, including the time for reviewing instructions, searching existing data sources,
gathering and maintaining the data needed, and completing and reviewing the collection of information. Send comments regarding this burden estimate or any other aspect of this
collection of information, including suggestions for reducing this burden, to Washington Headquarters Services, Directorate for Information Operations and Reports, 1215 Jefferson
Davis Highway, Suite 1204, Arlington, VA 22202-4302, and to the Office of Management and Budget, Paperwork Reduction Project (0704-0188), Washington, DC 20503.
1. AGENCY USE ONLY (Leave blank) 2. REPORT DATE 3. REPORT TYPE AND DATES COVERED
Jun_ 2______.._.....___ Technical Memorandum
4. TITLE AND SUBTITLE 5. FUNDING NUMBERS
Lessons Learned From CM-2 Modal Testing and Analysis
6. AUTHOR(S) WU-400-31-3A-00
Mark E. McNelis, Thomas W. Goodnight, Kelly S. Carney, and Kim D. Otten
7. PERFORMING ORGANIZATION NAME(S) AND ADDRESS(ES)
National Aeronautics and Space Administration
John H. Glenn Research Center at Lewis Field
Cleveland, Ohio 44135-3191
8. PERFORMING ORGANIZATIONREPORT NUMBER
E-13422
9. SPONSORING/MONITORING AGENCY NAME(S) AND ADDRESS(ES)
National Aeronautics and Space Administration
Washington, DC 20546-0001
10. SPONSORING/MONITORINGAGENCY REPORT NUMBER
NASA TM--2002-211692
11. SUPPLEMENTARY NOTES
Prepared for the Ninth International Congress on Sound and Vibration cosponsored by the NASA Kennedy Space Center,
the International Institute of Acoustics and Vibration, and the University of Central Florida, Orlando, Florida, July 8-11,
2002. Mark E. McNelis, Thomas W. Goodnight, and Kelly S. Carney, I_ASA Glenn Research Center; Kim D. Otten,
Analex Corporation, Brook Park, Ohio 44142. Responsible person, Mark E. McNelis, organization code 7735,216-433-8395.
12a. I
DISTRIBUTION/AVAILABILITY STATEMENT 12b. DISTRIBUTION CODE
Unclassified - Unlimited
Subject Category: 18 Distribution: Nonstandard ]
Available electronically at http://gltrs.grc.nasa.gov/GLTRS ]This publication is available from the NASA Center for AeroSpace Information 301-621-0390.
13. ABSTRACT (Maximum 200 words)
The Combustion Module-2 (CM-2) is a space experiment that launches on Shuttle mission STS-107 in the SPACEHAB
Double Research Module. The CM-2 flight hardware is installed into SPACEHAB single and double racks. The CM-2
flight hardware was vibration tested in the launch configuration to characterize the structure's modal response. Cross-
orthogonality between test and analysis mode shapes were used to assess model correlation. Lessons learned for pre-testplanning and model verification are discussed.
14. SUBJECT TERMS
Modal response; Random vibration; Shakers
17. SECURITY CLASSIFICATIONOF REPORT
Unclassified
NSN 7540-01-280-5500
15. NUMBER OF PAGES
]416. PRICE CODE
ION 20. LIMITATION OF ABSTRAC_
I I
Standard Form 298 (Rev. 2-89)Prescribedby ANSI Std. Z39-18298-102