Embed Size (px)
Citation preview
Copyright © by Holt, Rinehart and Winston. 39 Holt MathematicsAll rights reserved.
Name Date Class
Practice CEquations, Tables, and Graphs3-5
LESSON
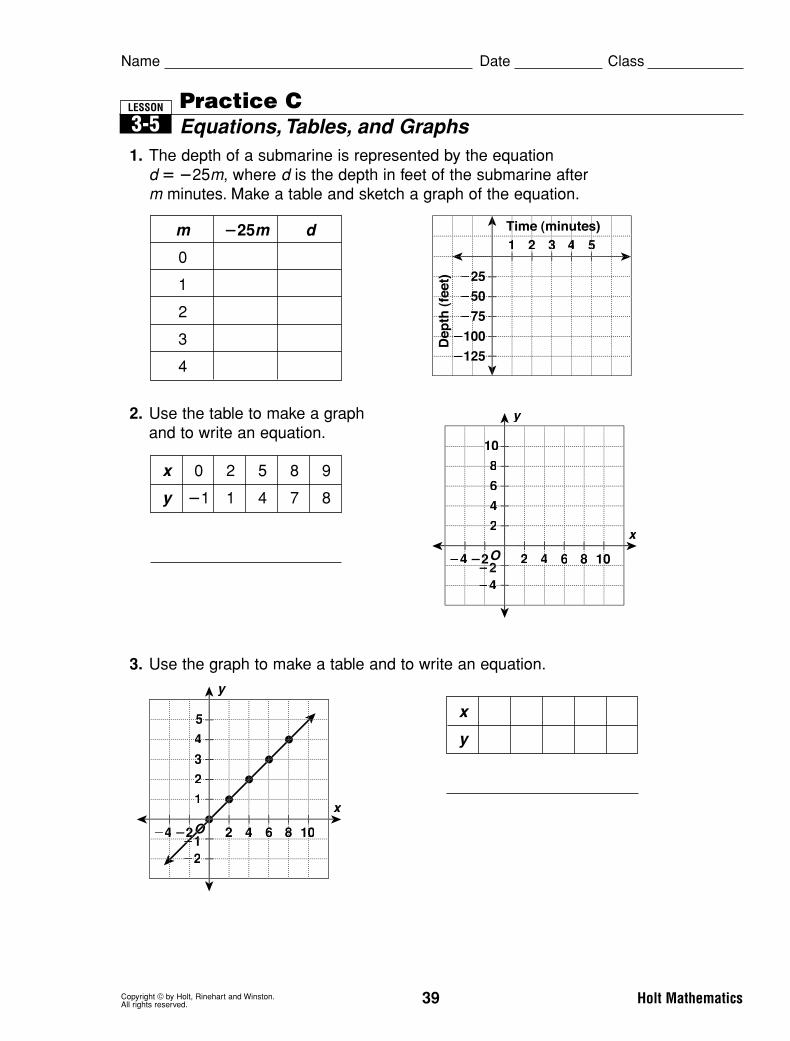
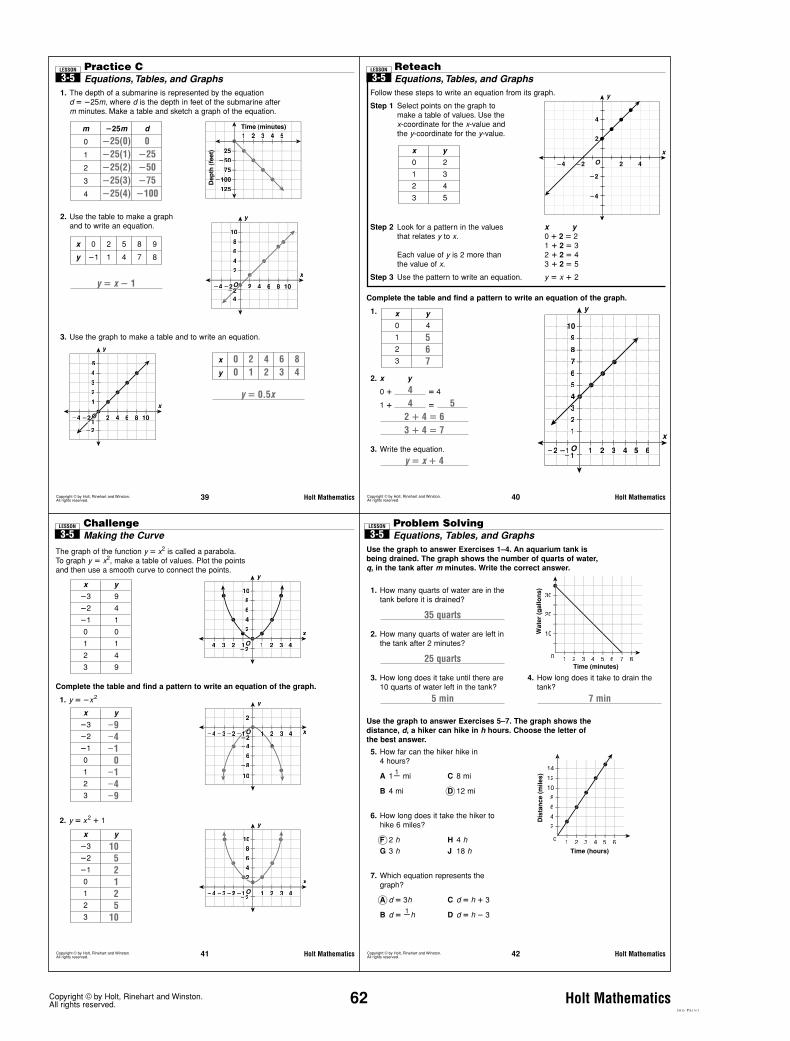
1. The depth of a submarine is represented by the equation d � �25m, where d is the depth in feet of the submarine after m minutes. Make a table and sketch a graph of the equation.
2. Use the table to make a graph and to write an equation.
3. Use the graph to make a table and to write an equation.
m �25m d
0
1
2
3
4
55
��50550
��25225
��1252125
��1000100
��75775
442211 33
x
100
44
55
11
22
33
884422 66
�����22��
�44
y
��
x 0 2 5 8 9
y �1 1 4 7 8
x
100
88
101101
22
44
66
884422 66
�����44��
�44
y
x
y
Copyright © by Holt, Rinehart and Winston. 62 Holt MathematicsAll rights reserved.
Copyright © by Holt, Rinehart and Winston. 39 Holt MathematicsAll rights reserved.
Practice CEquations, Tables, and Graphs3-5
LESSON
1. The depth of a submarine is represented by the equation d � �25m, where d is the depth in feet of the submarine after m minutes. Make a table and sketch a graph of the equation.
2. Use the table to make a graph and to write an equation.
3. Use the graph to make a table and to write an equation.
y � 0.5x
y � x � 1
m �25m d
0 �25(0) 01 �25(1) �252 �25(2) �503 �25(3) �754 �25(4) �100
55
��50550
��25225
��1252125
��1000100
��75775
442211 33
x
100
44
55
11
22
33
884422 66
�����22��
�44
y
��
x 0 2 5 8 9
y �1 1 4 7 8
x
100
88
101101
22
44
66
884422 66
�����44��
�44
y
x 0 2 4 6 8y 0 1 2 3 4
Follow these steps to write an equation from its graph.
Step 1 Select points on the graph to make a table of values. Use the x-coordinate for the x-value and the y-coordinate for the y-value.
Step 2 Look for a pattern in the values x ythat relates y to x. 0 � 2 � 2
1 � 2 � 3Each value of y is 2 more than 2 � 2 � 4the value of x. 3 � 2 � 5
Step 3 Use the pattern to write an equation. y � x � 2
Complete the table and find a pattern to write an equation of the graph.
1.
2. x y
0 � � 4
1 � �
3. Write the equation.
y � x � 4
3 � 4 � 72 � 4 � 6
544
Copyright © by Holt, Rinehart and Winston. 40 Holt MathematicsAll rights reserved.
ReteachEquations, Tables, and Graphs3-5
LESSON
x
O 4
4
2
2�2
�2
�4
�4
y
x y
0 2
1 3
2 4
3 5
x y
0 4
1 52 63 7
x
6655
44
55
66
11
22
33
442211 3311��11
�22
y
77
88
99
101101
3
Copyright © by Holt, Rinehart and Winston. 41 Holt MathematicsAll rights reserved.
The graph of the function y � x2 is called a parabola. To graph y � x2, make a table of values. Plot the points and then use a smooth curve to connect the points.
Complete the table and find a pattern to write an equation of the graph.
1. y � �x2
2. y � x2 � 1
ChallengeMaking the Curve3-5
LESSON
x
44
88101101
44
66
22
2211 33�22�33 �11��22
�44
yx y
�3 9
�2 4
�1 1
0 0
1 1
2 4
3 9
x y
�3 �9�2 �4�1 �10 01 �12 �43 �9
x44
22
�����44
�����66�����88
2211 33�22�33 �11
�101101
�44
y
x y
�3 10�2 5�1 20 11 22 53 10
x
44
88101101
44
66
22
2211 33�22�33 �11��22
�44
y
Problem SolvingEquations, Tables, and Graphs3-5
LESSON
Copyright © by Holt, Rinehart and Winston. 42 Holt MathematicsAll rights reserved.
Use the graph to answer Exercises 1–4. An aquarium tank isbeing drained. The graph shows the number of quarts of water,q, in the tank after m minutes. Write the correct answer.
1. How many quarts of water are in thetank before it is drained?
2. How many quarts of water are left inthe tank after 2 minutes?
3. How long does it take until there are10 quarts of water left in the tank?
4. How long does it take to drain thetank?
7 min5 min
25 quarts
35 quarts
3
20
10
21
30
Time (minutes)
Wat
er (
gal
lon
s)
4 5 6 7 80
Use the graph to answer Exercises 5–7. The graph shows thedistance, d, a hiker can hike in h hours. Choose the letter of the best answer.
5. How far can the hiker hike in 4 hours?
A 1 mi C 8 mi
B 4 mi 12 mi
6. How long does it take the hiker tohike 6 miles?
2 h H 4 h
G 3 h J 18 h
7. Which equation represents thegraph?
d � 3h C d � h � 3
B d � h D d � h � 31�
�A
�F
�D
1�
65
8
10
12
2
4
6
4210 3
14
Time (hours)
Dis
tan
ce (
mile
s)
3 R D P R I N T


![Calculus, Second Edition (New York: Holt, Rinehart and ...Source: Lipman Bers and Frank Karal, Calculus, Second Edition (New York: Holt, Rinehart and Winston, [1969] 1976). ... 0607](https://img.pdfslide.us/doc/110x75/60baae559ee9ae20f7432a81/calculus-second-edition-new-york-holt-rinehart-and-source-lipman-bers-and.jpg)