Embed Size (px)
Citation preview
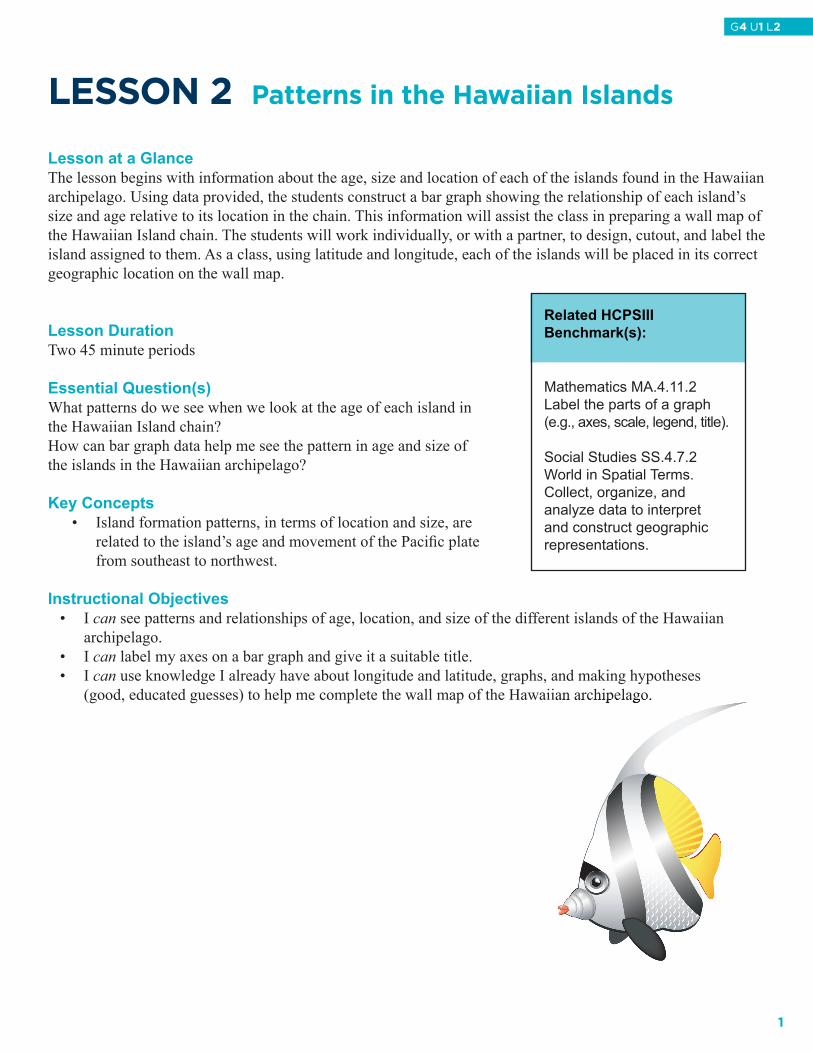
LeSSON 2 Patterns in the Hawaiian Islands
Lesson at a Glance The lesson begins with information about the age, size and location of each of the islands found in the Hawaiian archipelago. Using data provided, the students construct a bar graph showing the relationship of each island’s size and age relative to its location in the chain. This information will assist the class in preparing a wall map of the Hawaiian Island chain. The students will work individually, or with a partner, to design, cutout, and label the island assigned to them. As a class, using latitude and longitude, each of the islands will be placed in its correct geographic location on the wall map.
Lesson DurationTwo 45 minute periods
Essential Question(s)What patterns do we see when we look at the age of each island inthe Hawaiian Island chain?How can bar graph data help me see the pattern in age and size ofthe islands in the Hawaiian archipelago?
Key Concepts• Island formation patterns, in terms of location and size, are related to the island’s age and movement of the Pacifi c plate from southeast to northwest.
Instructional Objectives• I can see patterns and relationships of age, location, and size of the different islands of the Hawaiian
archipelago. • I can label my axes on a bar graph and give it a suitable title. • I can use knowledge I already have about longitude and latitude, graphs, and making hypotheses
(good, educated guesses) to help me complete the wall map of the Hawaiian archipelago.(good, educated guesses) to help me complete the wall map of the Hawaiian archipelago.
Related HCPSIIIBenchmark(s):
Mathematics MA.4.11.2Label the parts of a graph (e.g., axes, scale, legend, title).
Social Studies SS.4.7.2World in Spatial Terms.Collect, organize, andanalyze data to interpret and construct geographicrepresentations.
1
G4 U1 L2

Assessment Tools
Benchmark Rubric:Topic Data Collection and Representation
Benchmark MA.4.11.2 Label the parts of a graph (e.g., axes, scale, legend, title)
RubricAdvanced Proficient Partially Proficient NoviceEffectively label the parts of a graph
Sufficiently label the parts of a graph
Label the parts of a graph, with a few omissions or errors
Label the parts of a graph, with significant omissions or errors
Topic World In Spatial Terms
Benchmark SS.4.7.2 Collect, organize, and analyze data to interpret and construct geographic representations
RubricAdvanced Proficient Partially Proficient NoviceCollect, organize, and analyze data to interpret and construct geographic representations, with accuracy
Collect, organize, and analyze data to interpret and construct geographic representations, with no significant errors
Collect, organize, and analyze data to interpret and construct geographic representations, with a few significant errors
Collect, organize, and analyze data to interpret and construct geographic representations, with many significant errors
Assessment/Evidence Pieces
Lesson• IslandsBarGraphstudent worksheet
Unit• The Island Formations portfolio maybe used to monitor student progress throughout the unit.
Materials Needed Teacher Class Group Student
• Overhead transparency copy of the Student Reading Island Age, Size, and Location
• Overhead transparency copy of the Student Worksheet Islands Bar Graph
• Overhead projector
• None • None • Construction paper• Crayons or colored markers• Scissors
Instructional Resources Student Reading: Island Age, Size, and LocationStudent Worksheet: IslandsBarGraphTeacher Answer Key:IslandsBarGraphStudent Worksheet: Island Cutouts
Hawaiian Island Chain Wall Map (due to file size it is a separate PDF)
2
G4 U1 L2

Student Vocabulary Wordsabsolute location: the exact location on the planet where something resides, or the latitude and longitude of a place.archipelago: a group of islands in an expanse of water, with many scattered islands.atoll: a ring-shaped coral reef or string of closely spaced small coral islands that enclose or nearly enclose a shallow lagoon.fringing reefs: a reef that runs parallel to and is in close proximity or is directly adjacent to the shoreline.guyot: a submerged seamount that at one time was above or in close proximity to the sea surface.hotspot: generally localized plumes of magma that originate in the Earth’s mantle and move outward through the crust; magma movement may result in volcanic eruptions.high islands: islands that are composed of volcanic rock whose landmass is above the sea surface.low islands: islands that are composed of coral and/or sand whose landmass is above the sea surface.lines of latitude: numerical system of imaginary circles on Earth’s surface that lie parallel to the Equator and are used to describe position north and south of the Equator; measured in increasing degrees north and south away from the Equator.lines of longitude: numerical system of imaginary half circles on Earth’s surface that lie perpendicular to the Equator and end at the poles, used to describe position east and west, measured in degrees with 0° at the Prime Meridian.plate tectonics: geologic theory that combines the concepts of seafl oor spreading and continental drift to explain the large-scale movement of the Earth’s crustal plates.relative location: the location of a place in relation to another place (Kauai is WNW of Oahu).
Lesson Plan
Teacher Preparation• Review the Science Background provided in the Unit Overview.• Review and make copies of Student Reading Island Age, Size, and Location and the Student
Worksheet IslandsBarGraph, one per student. • Make a copy of the Island Cutouts Student Worksheet, so that one cutout of each island can be
added to the wall map of the archipelago. There are 18 islands to be distributed amongst students. In addition, there are 17 pages that make up the rest of the graphics needed to complete the bulletin board. There is a direction page provided with this lesson plan that explains where these materials can be found and how to assemble them.
• Make sure the blank wall map is prepared as described in Lesson 1.
I. Patterns in the IslandsA. Have students get out their Island Formations science portfolio and refer to the map entitled Map of the
Main Hawaiian Islands. Ask students: What do you notice about their sizes as you move from east to west? What patterns do you see? If, based on their observations and prior knowledge, students fail to respond, explain that the islands become smaller as you move northwest from the Big Island.
B. Pass out the Student Reading Island Ages, Sizes, and Locations. Have students look at the map of the main Hawaiian Islands as you discuss the features of the Student Reading. Discuss with students the sizes in square miles of each island. Talk about which island is the oldest in the chain based on the data presented.
C. Distribute the Student Worksheet IslandsBarGraph. Explain to the class that they must create a title for their bar graph so that when people look at it they know what information they will gather from it. Have the class give a few suggestions of appropriate titles. Have the students explain where the axes are on their bar graph and what they are labeled. Read the directions at the top of the worksheet with the class and remind them they must use the information from the Student Reading to complete the graph.
3
G4 U1 L2

D. Display a copy of the Student Worksheet IslandsBarGraph on the overhead projector as you model one example of how students will make a bar graph using the information on island age and size. Once students have fi nished their bar graphs ask for a volunteer to come up and complete the bar graph on the overhead projector for the remaining islands.
E. Discuss the bar graph data. Ask students if they see any islands that were formed around the same time. (Answer: Maui, La_na‘i, Moloka‘i and Kaho‘olawe) Have students compare the sizes of these four islands looking at the bar graph. What do they notice or what can they hypothesize about age and size of these islands?
F. After the lesson is complete the bar graphs are to be placed in their learning portfolio or science notebook.
II. Creating the Hawaiian Archipelago on Our Classroom WallA. There are 18 islands to assign. Depending on class size, some students may have to partner up.
Distribute one of the Island Cutouts to each student, or group of students. B. Direct students to cut out and color their assigned island. The next step is to have students label their
island with its name, the type of island (high island, pinnacle, atoll or island with fringing reef), and list the island coordinates (latitude and longitude). The coordinates for each island are located on the previous Student Reading Island Age, Size and Location. (NOTE: For the smaller islands, students can write the island name and coordinates directly onto the wall map or a small sheet of paper that can be affi xed with their island cutout.)
C. Have students place their island on the wall map one island at a time. Students must place their island on the wall map grid using longitude and latitude coordinates. Assist students as they come up to place their islands to ensure that they are as close as possible to the actual island locations. After they have it in the correct location have the student tell the rest of the class the name of their island and its type.
D. By the end of this lesson, you should have an excellent wall map of the Hawaiian archipelago that can be used as a reference tool in future lessons.
III. Student Refl ection A. Write the following assessment questions on the board:
1) What hypothesis can you make about the island chain from studying your graph and the wall map?2) Why do you think some of the islands become smaller when you move northwest?
B. Have students write their responses on a separate sheet of paper, and ask them to fi le their responses in their Island Formations portfolio.
C. Students should have their labeled maps from Lesson 1, their bar graphs from this lesson, the reference maps, and their refl ections in their learning portfolio or science notebooks as evidence of meeting the benchmarks at this point.
Extended ActivitiesChallenge students to come up with a different graphical representation of the data.Challenge students to come up with a different graphical representation of the data.
4
G4 U1 L2

LeSSON 2 Island Age, Size, and Location Islands in the Hawaiian Archipelago
NAMEOF
ISLAND
LOCATION(Longitude and
Latitude)
AGE(Millions of
Years)
SIZE(Square
Miles of total landmass)
Distance from Kure Atoll (km)
Island of Hawai’i 19º3’ N 155º3’ W 0.4 4038 2544
Maui 21ºN 156º7’ W 1.3 727 2349Lāna’i 20º5’ N 156º 6’ W 1.3 141 2394Kaho’olaw’e 20º6’ N 156º6’ W 1.0 45 2393Moloka’i 21º1’ N 157º W 1.9 100 2265O’ahu 21º3’ N 157º6’ W 3.7 597 2254Kaua’i 22º N 159º3’W 5.1 553 2027Ni’ihau 21º5’ N 160º1’ W 4.9 70 1979Nihoa 23º N 161º6’ W 7.2 27 1790Necker 23º3’ N 164º4’ W 10.3 .00007 1508French Frigate Shoals 23º9’ N 166º3’ W 13 .1 1321
Gardner Pinnacles 25ºN 167º6’ W 12.3 .00772 1141
Maro Reef 25º25’ N 170º4’ W .00154 1102Laysan 25º8’ N 171º7’ W 19.9 1.6 762Lisianski 26º1’ N 174º W 23 .61776 461Pearl and Hermes Atoll 27º5’ N 175º5’ W 22 .13899 312
Midway Atoll 28º1’ N 177º2’ W 27.7 2.4 100Kure Atoll 28º4’ N 178º3’ W 30 .30116 0
5
G4 U1 L2
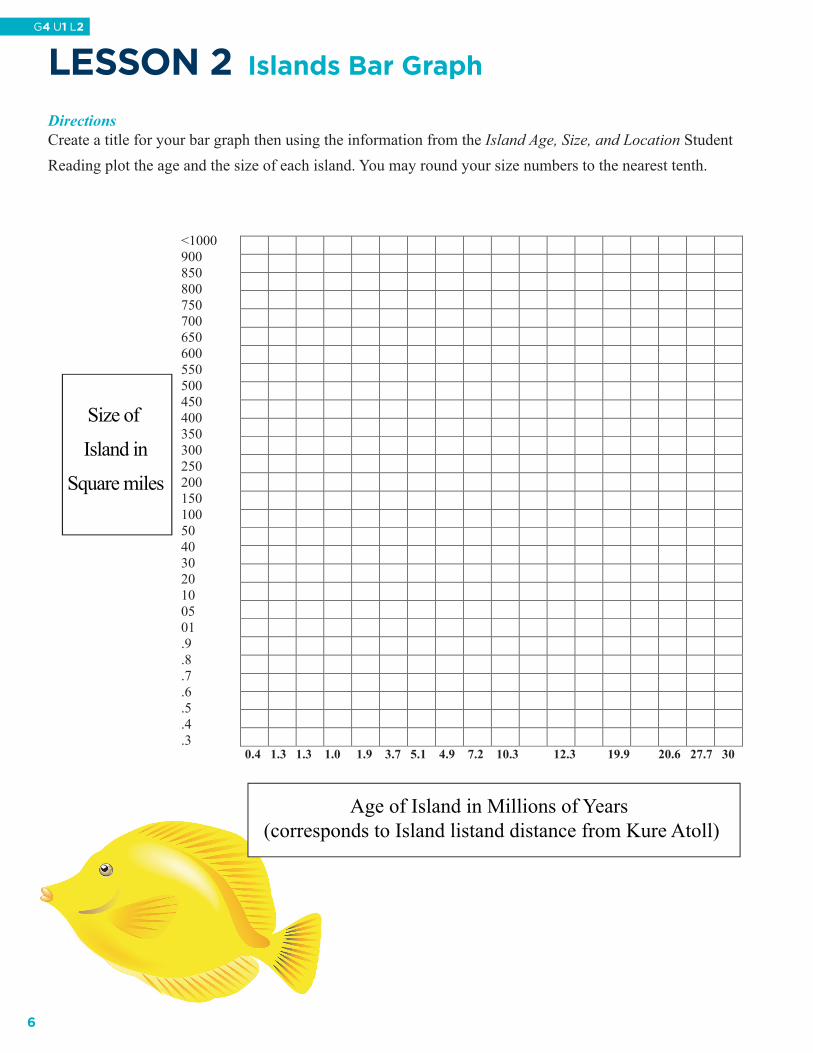
LeSSON 2 Islands Bar Graph
DirectionsCreate a title for your bar graph then using the information from the Island Age, Size, and Location Student Reading plot the age and the size of each island. You may round your size numbers to the nearest tenth.
0.4 1.3 1.3 1.0 1.9 3.7 5.1 4.9 7.2 10.3 12.3 19.9 20.6 27.7 30
<100090085080075070065060055050045040035030025020015010050403020100501.9.8.7.6.5.4.3
Size of
Island in
Square miles
Age of Island in Millions of Years (corresponds to Island listand distance from Kure Atoll)
6
G4 U1 L2

LeSSON 2 Islands Bar Graph Teacher Answer Key
0.4 1.3 1.3 1.0 1.9 3.7 5.1 4.9 7.2 10.3 12.3 19.9 20.6 27.7 30
<100090085080075070065060055050045040035030025020015010050403020100501.9.8.7.6.5.4.3
Size of
Island in
Square miles
Age of Island in Millions of Years (corresponds to Island listand distance from Kure Atoll)
7
G4 U1 L2

LeSSON 2 Island Cutouts
DirectionsFor this wall mount or bulletin board you will need the “Island Cutouts” and the “Hawaiian Island Chain Map.” Due to the file size of the map it has been saved along with the other materials for this unit as a PDF entitled “G4 U1 Lesson 2 Hawaiian Island Chain Wall Map.pdf.” When assembled, it should look like this:
NOTE:The file for the map shown above is 60”x 55”, and once printed out, requires assembling. Select ‘Tile’ under print settings to print the file on multiple pages. (17 pages total)
See the PDF bookmark entitled “Island Cutouts” for the 18 island pieces, that match the squares on the map.Each separate island needs to be cut to the box border.
NOTE: Answer Key below begins with
�rst box at the top left of the map and goes
clockwise around the page.
Kure Atoll- Atoll
Midway Islands- Atoll
Pearl & Hermes Atoll- Atoll
French Frigate Shoals- Atoll
Ni’hoa Island- High Island
Ni’ihau Island- High Island
Kaua’i Island- High Island
O’ahu Island- High Island
Maui Island- High Island
Big Island of Hawai‘i- High Island
Kaho‘olawe Island- High Island
Lana‘i Island- High Island
Moloka‘i Island- High Island
Necker Island-Pinnacle
Gardner Pinnacles-Pinnacle
Maro Reef- Atoll
Laysan Island- Island w/fringing reef
Lisianski Island- Island w/fringing reef
Lesson 1 - Map of Archipelago
8
G4 U1 L2