Embed Size (px)
Citation preview
Leonie Haimson, Class Size Matters
Nov. 20, 2014
HOW DOE’S C4E PLAN DOES NOTHING TO ADDRESS CLASS SIZE OR OVERCROWDING IN
D3 AND CITYWIDE
Reducing class size #1 priority of parents in D3 and citywideData Source: 2014 NYC School Survey Results
Small
er c
lass
size
Mor
e pr
epar
ation
for s
tate
test
s
Mor
e ha
nds-
on le
arnin
g
Strong
er e
nrich
men
t pro
gram
s
Mor
e ef
fect
ive te
achin
g
Strong
er a
rts p
rogr
ams
Mor
e ef
fect
ive s
choo
l lead
ersh
ip
Mor
e rig
orou
s cu
rricu
lum
Bette
r com
mun
icatio
n with
par
ents
Less
pre
para
tion
for s
tate
test
s0%
5%
10%
15%
20%
25%
30%
23%
17%15%
12%
9% 8%
5% 4% 4%2%
24%
16%13% 13%
6%9% 9%
6% 6%4%
Top parent responses for school improvement in District 3 compared to Citywide results
CitywideD3
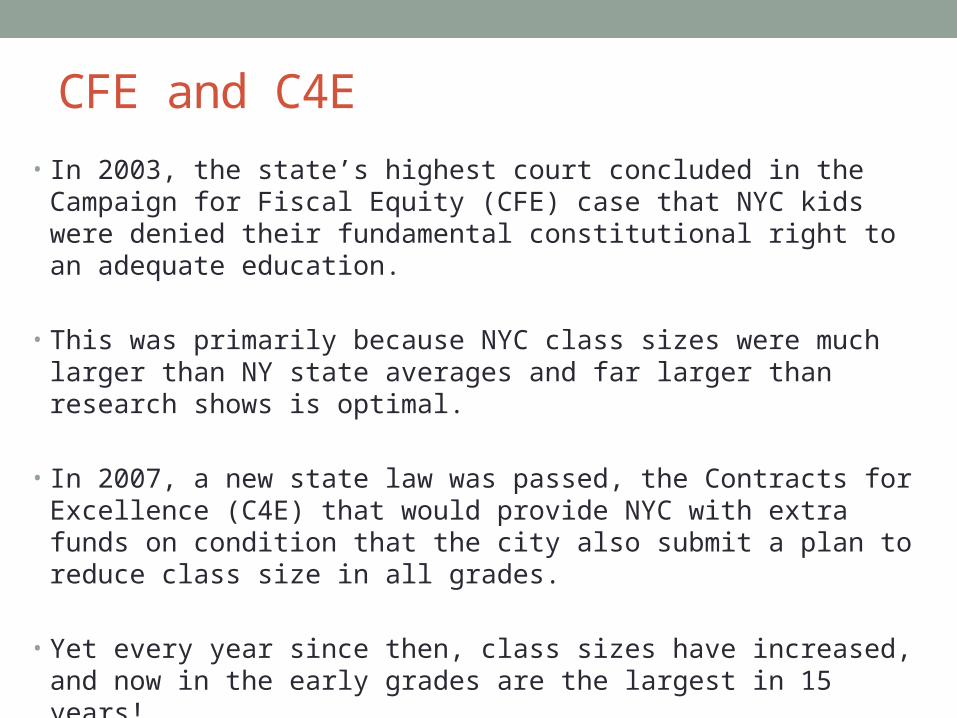
CFE and C4E • In 2003, the state’s highest court concluded in the Campaign for Fiscal
Equity (CFE) case that NYC kids were denied their fundamental constitutional right to an adequate education.
• This was primarily because NYC class sizes were much larger than NY state averages and far larger than research shows is optimal.
• In 2007, a new state law was passed, the Contracts for Excellence (C4E) that would provide NYC with extra funds on condition that the city also submit a plan to reduce class size in all grades.
• Yet every year since then, class sizes have increased, and now in the early grades are the largest in 15 years!
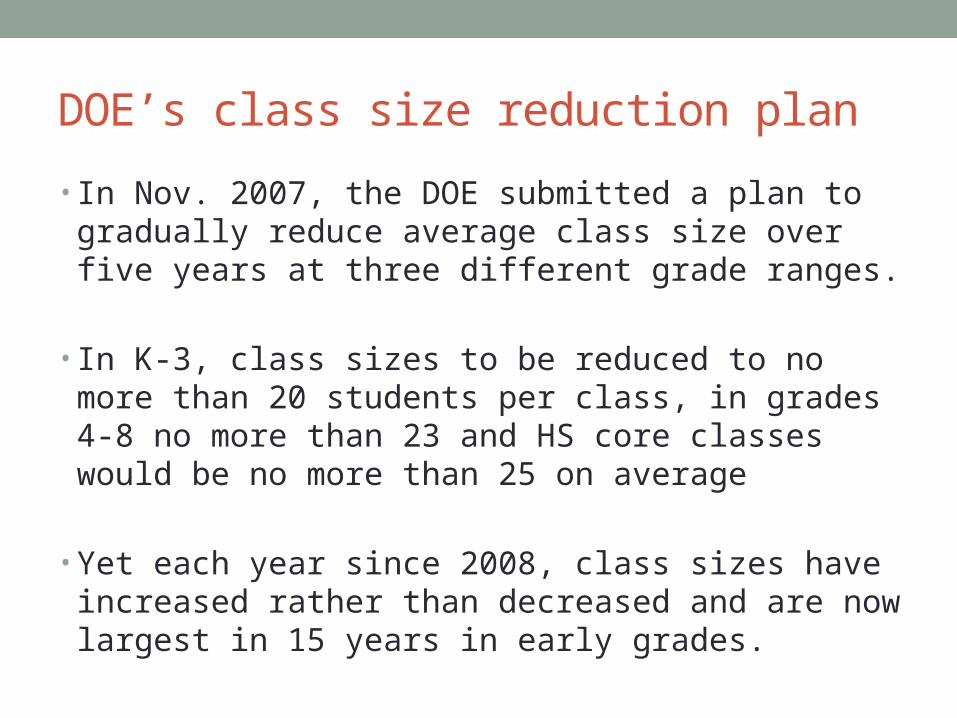
DOE’s class size reduction plan • In Nov. 2007, the DOE submitted a plan to gradually
reduce average class size over five years at three different grade ranges.
• In K-3, class sizes to be reduced to no more than 20 students per class, in grades 4-8 no more than 23 and HS core classes would be no more than 25 on average
• Yet each year since 2008, class sizes have increased rather than decreased and are now largest in 15 years in early grades.
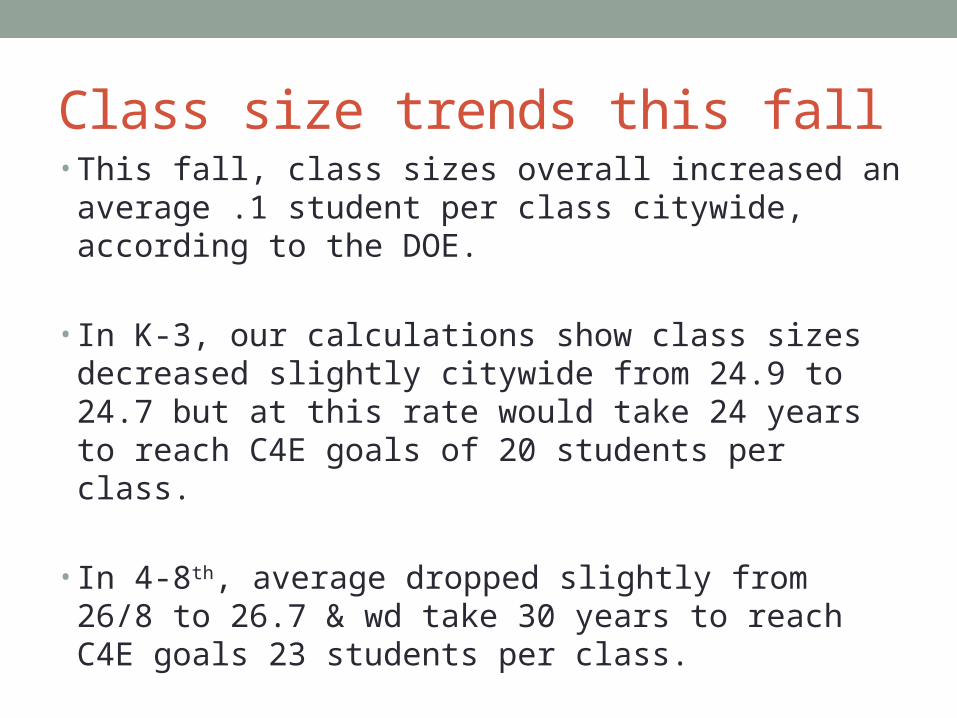
Class size trends this fall• This fall, class sizes overall increased an average .1
student per class citywide, according to the DOE.
• In K-3, our calculations show class sizes decreased slightly citywide from 24.9 to 24.7 but at this rate would take 24 years to reach C4E goals of 20 students per class.
• In 4-8th, average dropped slightly from 26/8 to 26.7 & wd take 30 years to reach C4E goals 23 students per class.
• In HS, average increased from 26.7 to 26.8 students per class.
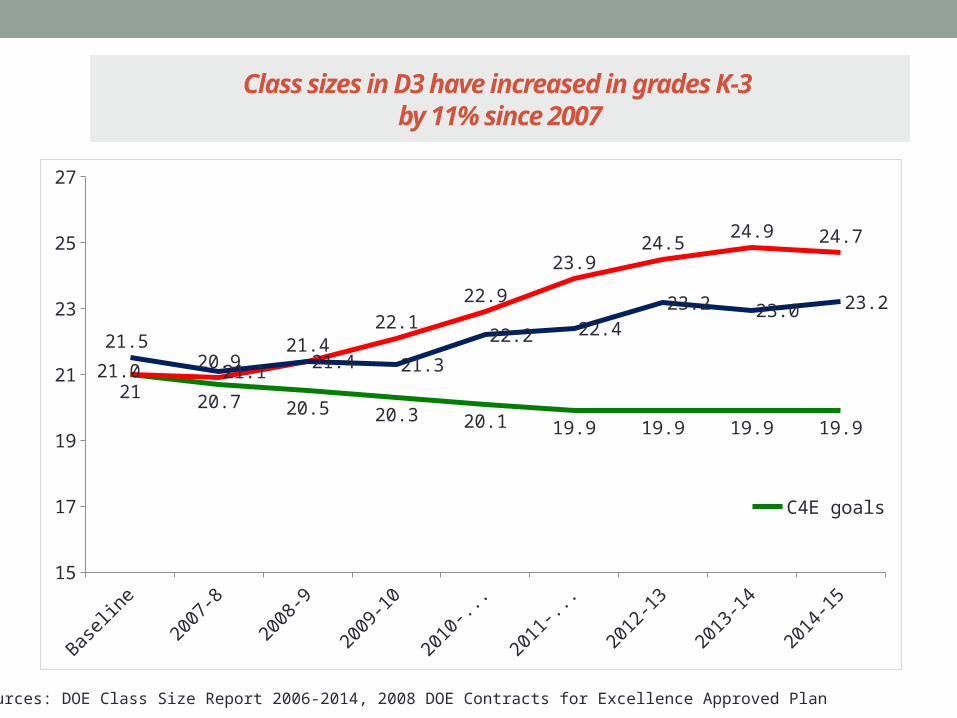
Class sizes in D3 have increased in grades K-3 by 11% since 2007
Data sources: DOE Class Size Report 2006-2014, 2008 DOE Contracts for Excellence Approved Plan
Baseline 2007-8 2008-9 2009-10 2010-2011
2011-2012
2012-13 2013-14 2014-1515
17
19
21
23
25
27
21 20.7 20.5 20.3 20.1 19.9 19.9 19.9 19.9
21.0 20.921.4
22.1
22.9
23.924.5
24.9 24.7
21.5
21.1 21.4 21.3
22.2 22.423.2 23.0 23.2
C4E goalsCitywide actualD3
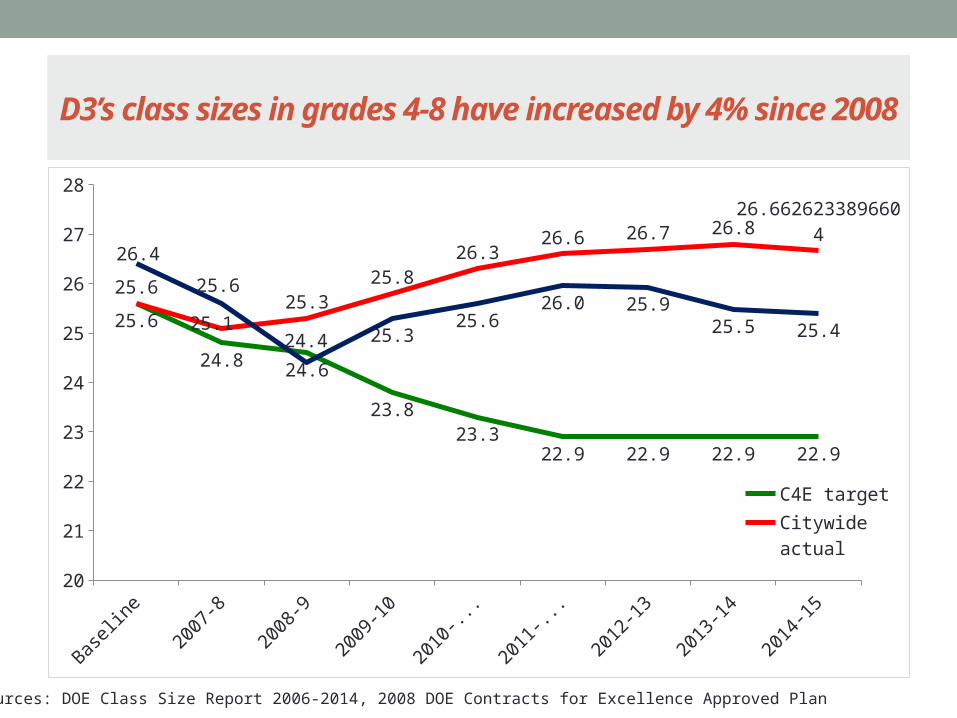
D3’s class sizes in grades 4-8 have increased by 4% since 2008
Baseline 2007-8 2008-9 2009-10 2010-2011
2011-2012
2012-13 2013-14 2014-1520
21
22
23
24
25
26
27
28
25.6
24.8 24.6
23.823.3
22.9 22.9 22.9 22.9
25.6
25.125.3
25.826.3
26.6 26.7 26.826.662623389660426.4
25.6
24.4 25.325.6
26.0 25.925.5 25.4
C4E target
Citywide actual
D3
Data sources: DOE Class Size Report 2006-2014, 2008 DOE Contracts for Excellence Approved Plan
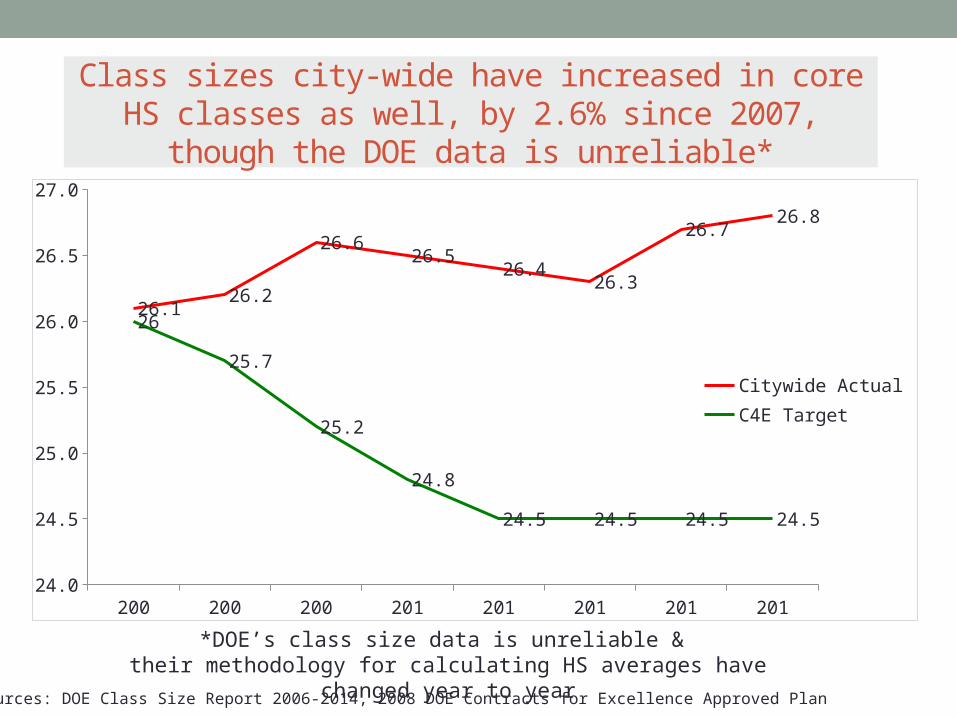
Class sizes city-wide have increased in core HS classes as well, by 2.6% since 2007, though the DOE data is unreliable*
*DOE’s class size data is unreliable & their methodology for calculating HS averages have changed year to year
Data sources: DOE Class Size Report 2006-2014, 2008 DOE Contracts for Excellence Approved Plan
2007-08 2008-09 2009-10 2010-11 2011-12 2012-13 2013-14 2014-1524.0
24.5
25.0
25.5
26.0
26.5
27.0
26.126.2
26.626.5
26.426.3
26.726.8
26
25.7
25.2
24.8
24.5 24.5 24.5 24.5
Citywide ActualC4E Target

Why? Because DOE has cut back school budgets by 14% since 2007
• In the state C4E law, says these funds must “supplement not supplant” city funds.
• This means that the DOE could not cut back its own funding to schools when the state increased its funding. But this is what happened, starting the first year of C4E.
• This year, in its C4E plan, for the first time DOE admits allowing supplanting – but also claims that the State Education Dept. has given its permission for this to occur.
• “Expenditures made using C4E funds must ‘supplement, not supplant”’ funding provided by the school district; however, SED has provided guidance explaining that certain expenditures may be paid for with C4E funds even though these programs or expenditures were originally or have been typically paid for by the district or by other grants.”
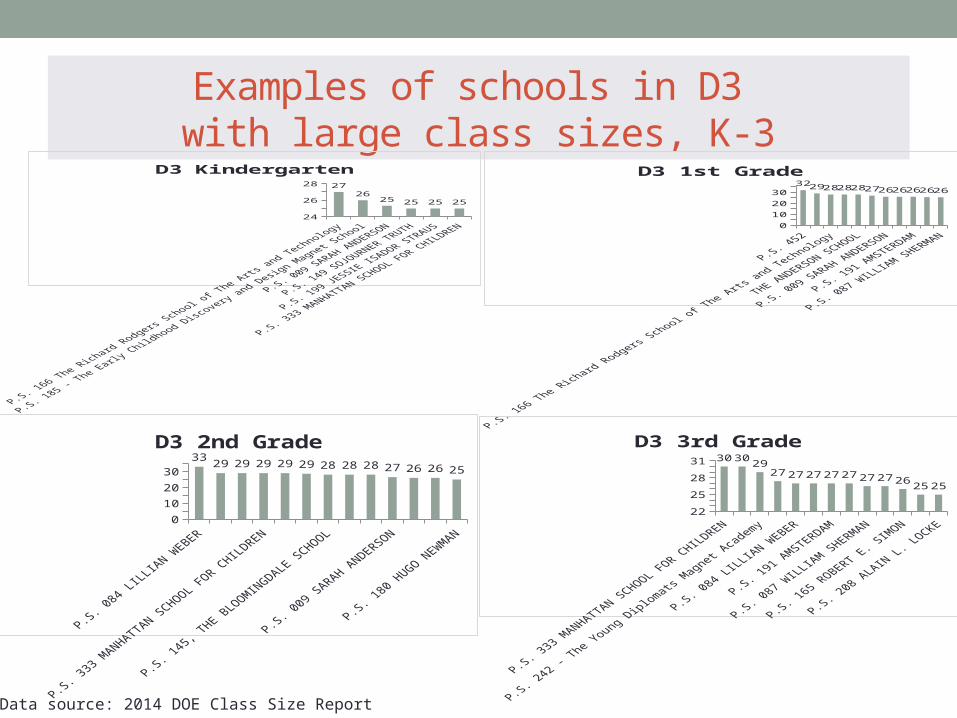
Examples of schools in D3 with large class sizes, K-3
Data source: 2014 DOE Class Size Report
2425262728 27
2625 25 25 25
D3 Kindergarten
0
10
20
3032 29 28 28 28 27 26 26 26 26 26
D3 1st Grade
0
10
20
3033
29 29 29 29 29 28 28 28 27 26 26 25
D3 2nd Grade
2224262830
30 3029
27 27 27 27 27 27 27 2625 25
D3 3rd Grade
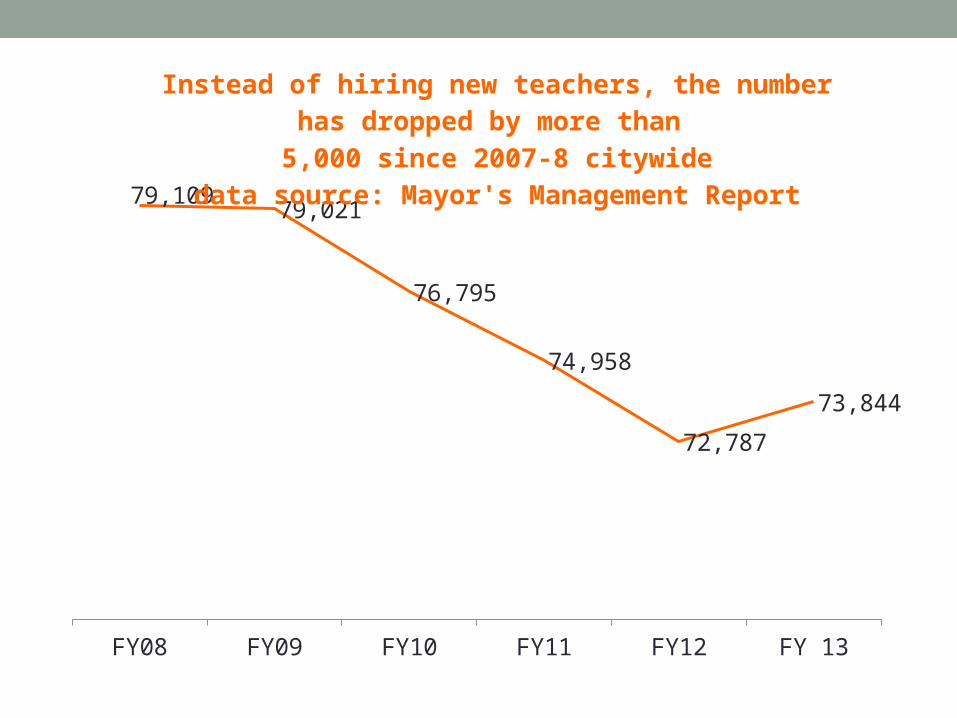
FY08 FY09 FY10 FY11 FY12 FY 13
79,10979,021
76,795
74,958
72,787
73,844
Instead of hiring new teachers, the number has dropped by more than
5,000 since 2007-8 citywidedata source: Mayor's Management Report

Other ways city has encouraged class size increases
• In 2010, the DOE eliminated the early grade class size reduction funding for K-3, despite promising to keep it as part of its C4E plan.
• In 2011, the DOE refused to comply with a side agreement with the UFT to cap class sizes at 28 in grades 1-3, leading to sharp increases in these grades to 30 or more.
• Co-locations have made overcrowding worse, and taken space that instead could have been used to reduce class size.
• When principals try to lower class size, particularly in middle or high schools, DOE often sends them more students.

More ways DOE has worked to increase class size in its C4E plan
• DOE refuses to allocate any funds specifically towards class size reduction in its targeted or citywide C4E allocations.
• DOE allows principals to use C4E funds to “Minimize growth of class size,” which is not class size reduction.
• DOE has never aligned its capital plan or the school utilization formula to smaller classes, contrary to the C4E law.
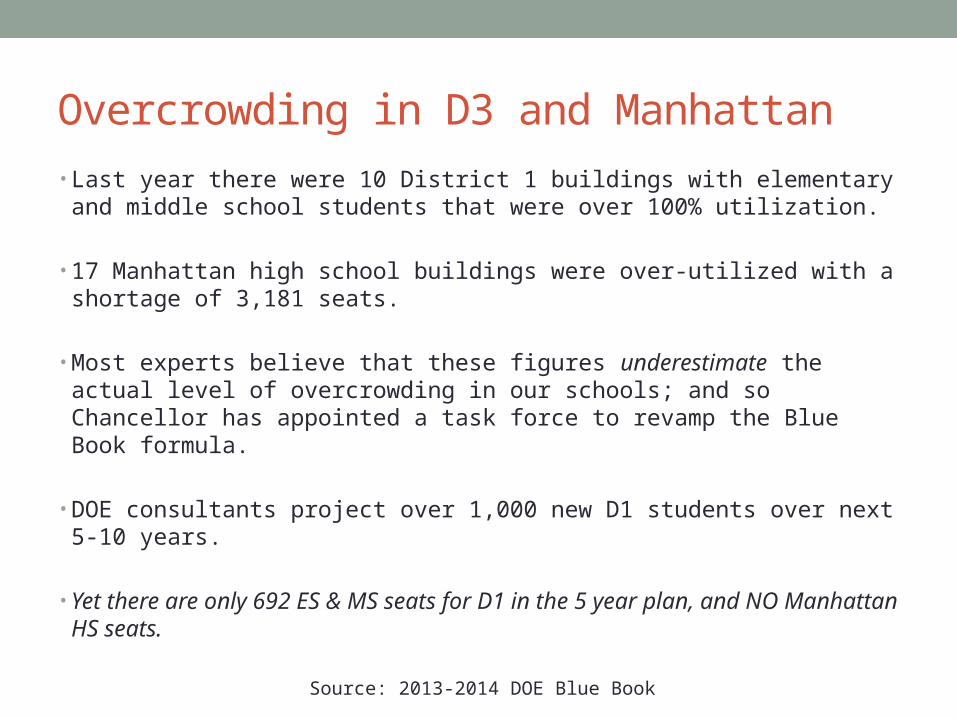
Overcrowding in D3 and Manhattan
• Last year there were 10 District 1 buildings with elementary and middle school students that were over 100% utilization.
• 17 Manhattan high school buildings were over-utilized with a shortage of 3,181 seats.
• Most experts believe that these figures underestimate the actual level of overcrowding in our schools; and so Chancellor has appointed a task force to revamp the Blue Book formula.
• DOE consultants project over 1,000 new D1 students over next 5-10 years.
• Yet there are only 692 ES & MS seats for D1 in the 5 year plan, and NO Manhattan HS seats.
Source: 2013-2014 DOE Blue Book
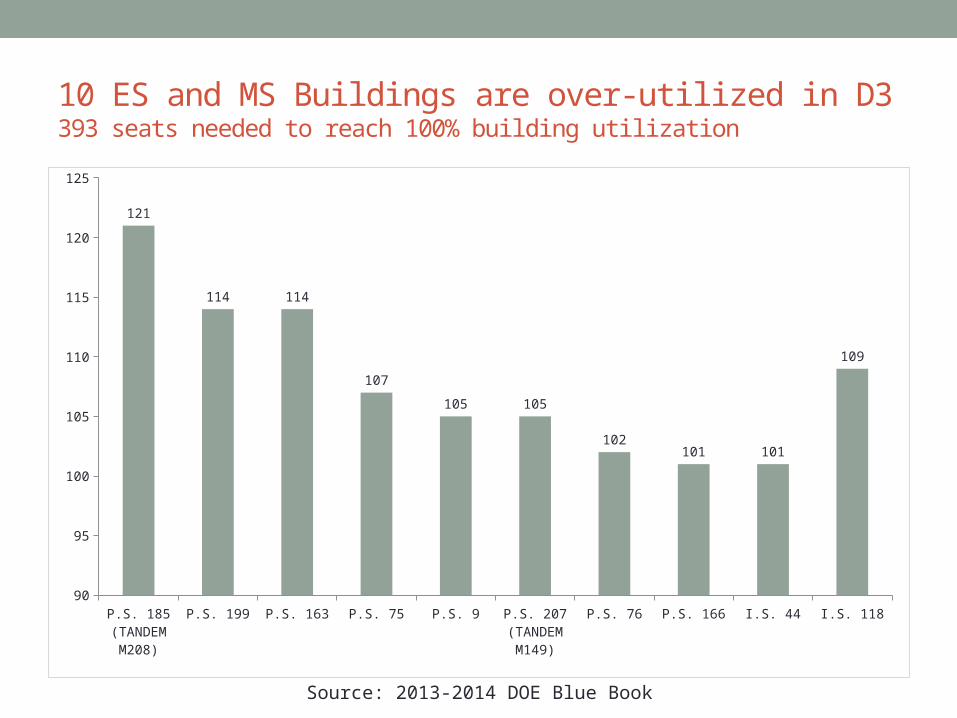
10 ES and MS Buildings are over-utilized in D3393 seats needed to reach 100% building utilization
Source: 2013-2014 DOE Blue Book
P.S. 185 (TANDEM
M208)
P.S. 199 P.S. 163 P.S. 75 P.S. 9 P.S. 207 (TANDEM
M149)
P.S. 76 P.S. 166 I.S. 44 I.S. 11890
95
100
105
110
115
120
125
121
114 114
107
105 105
102101 101
109

17 Manhattan High School Buildings are over-utilized3,181 HS seats needed to reach 100% building utilization
Source: 2013-2014 DOE Blue Book
BEACON HS
HEALTH P
ROFESSIONS H
S
THE HERIT
AGE SCHOOL
FIORELL
O LAGUARDIA
HS
J. K
. ONASSIS
HS F
OR INT C
AREERS
PARK EAST H
S
MIL
LENNIU
M H
S
STUYVESANT HS (N
EW)
HS FOR E
NVIRONM
ENTAL STUDIE
S
OLD M
ANHATTAN VOC/T
ECH HS
N.E.S
.T (O
LD J
22)
GREGORIO L
UPERON PREP. S
CHOOL
HS FOR E
CONOMIC
S & F
INANCE
THE COM
MUNIT
Y HEALT
H ACADEM
Y OF T
HE HEIG
HTS
G. WASHIN
GTON HS E
DUC. CAM
PUS
MANHTN C
T FOR M
ATH & S
CI. HS
HS FOR M
ATH, SCI &
ENGIN
EERING
0%
20%
40%
60%
80%
100%
120%
140%
160%
180%
156%
140% 137%130% 128% 124% 120% 118%
112% 111% 107% 106% 104% 103% 102% 101% 101%
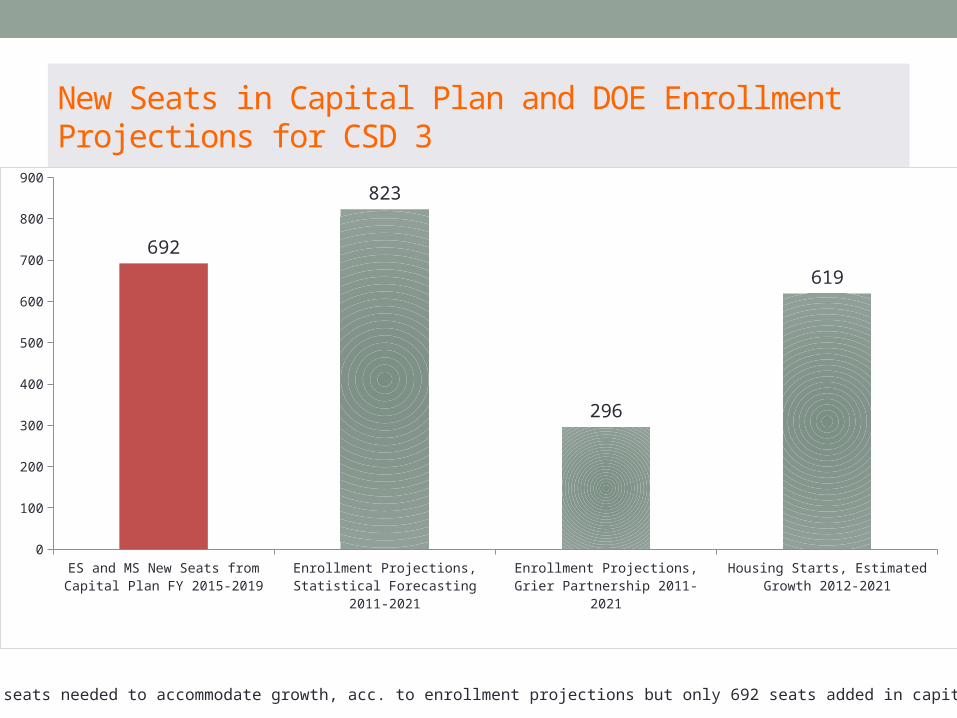
New Seats in Capital Plan and DOE Enrollment Projections for CSD 3
~915 to 1,442 seats needed to accommodate growth, acc. to enrollment projections but only 692 seats added in capital plan.
ES and
MS N
ew S
eats
from
Cap
ital P
lan F
Y 201
5-20
19
Enroll
men
t Pro
jectio
ns, S
tatis
tical
Forec
astin
g 20
11-2
021
Enroll
men
t Pro
jectio
ns, G
rier P
artn
ersh
ip 20
11-2
021
Housin
g Sta
rts, E
stim
ated
Gro
wth 2
012-
2021
0
100
200
300
400
500
600
700
800
900
692
823
296
619
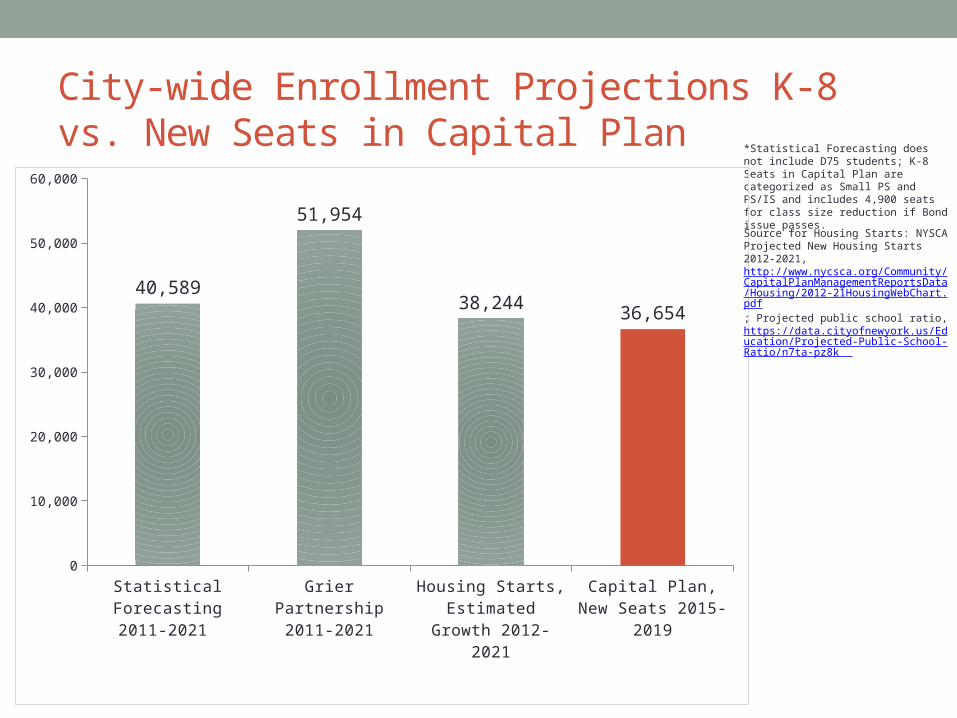
City-wide Enrollment Projections K-8 vs. New Seats in Capital Plan *Statistical Forecasting does not include
D75 students; K-8 Seats in Capital Plan are categorized as Small PS and PS/IS and includes 4,900 seats for class size reduction if Bond issue passes.
Statis
tical
For
ecas
ting
2011
-202
1
Grier P
artn
ersh
ip 2
011-
2021
Housin
g Sta
rts, E
stim
ated
Gro
wth 2
012-
2021
Capita
l Pla
n, N
ew S
eats
2015
-201
90
10,000
20,000
30,000
40,000
50,000
60,000
40,589
51,954
38,244 36,654
Source for Housing Starts: NYSCA Projected New Housing Starts 2012-2021, http://www.nycsca.org/Community/CapitalPlanManagementReportsData/Housing/2012-21HousingWebChart.pdf; Projected public school ratio, https://data.cityofnewyork.us/Education/Projected-Public-School-Ratio/n7ta-pz8k
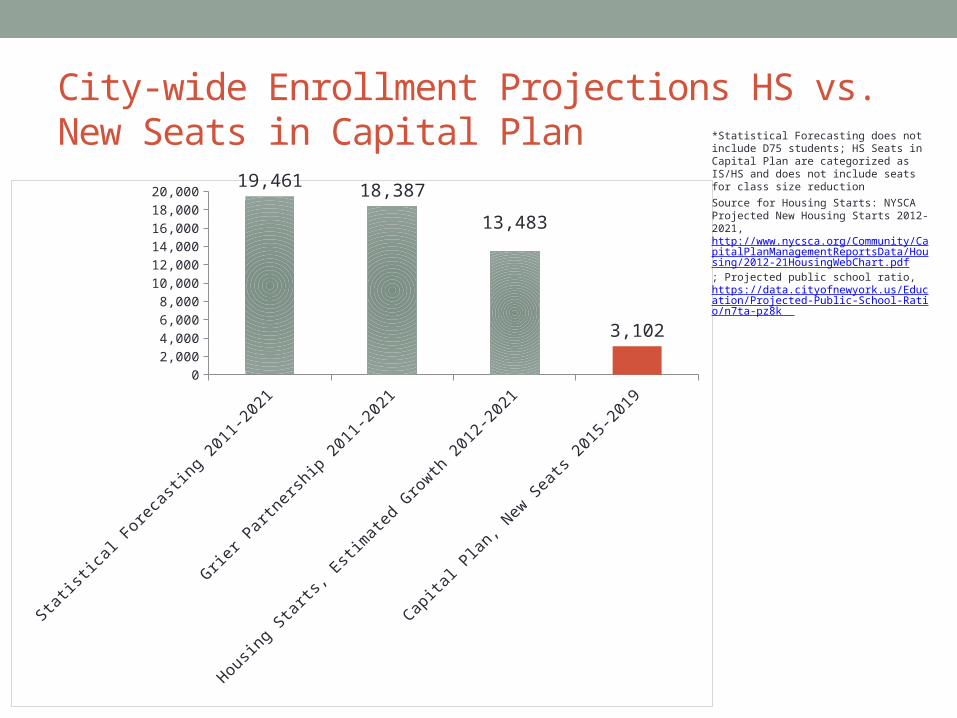
City-wide Enrollment Projections HS vs. New Seats in Capital Plan
0
2,000
4,000
6,000
8,000
10,000
12,000
14,000
16,000
18,000
20,000 19,46118,387
13,483
3,102
*Statistical Forecasting does not include D75 students; HS Seats in Capital Plan are categorized as IS/HS and does not include seats for class size reduction
Source for Housing Starts: NYSCA Projected New Housing Starts 2012-2021, http://www.nycsca.org/Community/CapitalPlanManagementReportsData/Housing/2012-21HousingWebChart.pdf; Projected public school ratio, https://data.cityofnewyork.us/Education/Projected-Public-School-Ratio/n7ta-pz8k

Bill de Blasio promised to reduce class size while running for Mayor
• During his campaign, Mayor de Blasio promised if elected to abide by the city’s original class size plan approved by the state in 2007.
• The Mayor needs to deliver on his promise and provide what NYC parents want and their children need.
• He also needs to expand the capital plan to alleviate school overcrowding, end ALL co-locations, and build more schools!
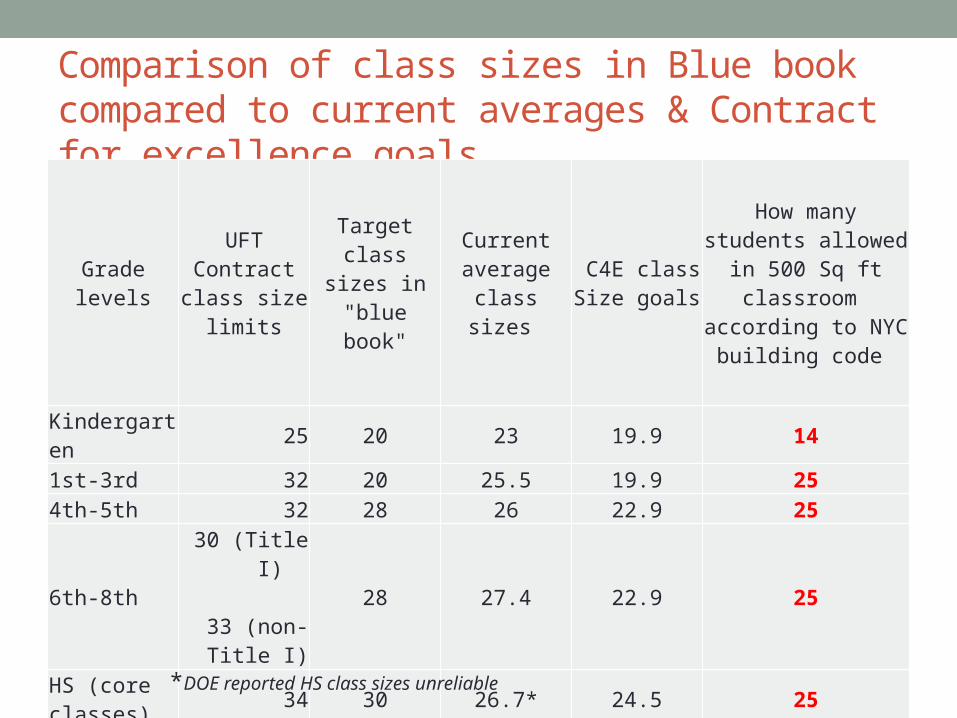
Comparison of class sizes in Blue book compared to current averages & Contract for excellence goals
Grade levelsUFT Contract
class size limits
Target class sizes in "blue
book"
Current average
class sizes
C4E class Size goals
How many students allowed in 500 Sq ft
classroom according to NYC building code
Kindergarten 25 20 23 19.9 14
1st-3rd 32 20 25.5 19.9 254th-5th 32 28 26 22.9 25
6th-8th
30 (Title I)
33 (non-Title I)
28 27.4 22.9 25
HS (core classes) 34 30 26.7* 24.5 25
*DOE reported HS class sizes unreliable
How can you help?• Sign up for the Class Size Matters newsletter.
• Meet with your City Councilmembers (Speaker Melissa Mark-Viverito, Helen Rosenthal,, and Inez Dickens) to urge them to expand the capital plan and end all future co-locations.
• Be pro-active about fighting for your children to receive their constitutional right to a sound basic education, by lowering class size.
• Questions, please email us at [email protected]