Embed Size (px)
Citation preview
· .. . ·f
·"' .
. ·. ~· ·~
:~ '
1-~ .J .. :·:: r
....
-'i ·t .: ·i ' ' . . . . ·. ~ . ·" ... 1 ~: "i l !
! •.i 1', . \\. . ·. - . .. ' . ...
• . .!. 't ·. ·. . .f.' .•
LEHIGH UNIVERSITY
The Strength of Axially Loaded Steel Tubular Columns
FRITZ ENGINEERING LABORATORY LH!~RAR't
IMPROVED THEORETICAL ANALYSIS
OF A SHORT BIAXIALLY
LOADED TuBu~LAR COL~fi~
by
D. A. Ross
W. F. Chen
..3. Fritz Engineering Laboratory Report No. f93. 2A

The Strength of Axially Loaded Steel Tubular Columns
IMPROVED THEORETICAL ANALYSIS OF A SHORT BIAXIALLY LOADED TUBULAR COLUMN
By
D. A. Ross
W. F. Chen
This work is being carried out as part of an investigation sponsored by the American Petroleum Institute.
·Department of Civil Engineering Fritz Engineering Laboratory
Lehigh University Bethlehem, Pennsylvania
June 1975
Fritz Engineering Laboratory Re-port No. 293. 2A
393.2A -i
ABSTRACT
A theoretical analysis of a fabricated steel tubular column
subject to combined axial load and biaxial bending moment is currently
underway. Before a long column can be analyzed, it is necessary to
derive the moment-axial load-curvature relationships for such a column.
Fritz Lab Report No. 393.2 presents a "first try" at the derivation of
these relationships, and this report presents an improved derivation.
In particular, allowance has been made for relieving of
circumferential residual stresses due to applied longitudinal loads
on an elemental area, i.e., a "Poisson's ratio effect" has been
included. Thus, an elemental area of cross-section has a reserve loading
carrying capacity, despite the fact that the Tresca yield criterion
adopted might indicate that the material has yielded. An approximation
to the theory of plasticity has been utilized to allow continued use
of the basic formulae presented in Fritz Lab Report No. 393.2.

' '
393.2A
TABLE OF CONTENTS
1. INTRODUCTION
2. THEORETICAL ANALYSIS
2.1 Method of Analysis
2.2 Preliminary Conditions and Assumptions
2.3 Inclusion of Residual Stresses
2.4 Two-Dimensional Stress Interaction
3. RESULTS AND DISCUSSION
3.1 Initial Comparisons
3.2 Inclusion of Residual Stresses
4. CONCLUSIONS
5 • ACKNOWLEDGMENTS
6 • REFERENCES
7. NOMENCLATURE
FIGURES
-ii
1
3
3
5
7
9
12
12
13
14
15
15
16
18
393.2A -1
1. INTRODUCTION
Fabricated steel tubular columns are frequently used·as
supporting members for off-shore oil-drilling structures. In such
circumstances they may be subjected to .axial load as well as biaxial
bending loads.
Classically these columns are formed from flat steel plate
which is rolled into a cylindrical shape by a cold-rolling, fully-plastic
bending procedure. Because of manufacturing limitations such cylindri-
cal formations are usually about ten feet long. The rolling of the plate
brings together two opposite edges of the plate and this joint is
then welded to form a longitudinal seam in a cylindrical "can". A
number of such "cans" are welded together end-to-end to form the re-
quired column. Both longitudinal and circumferential welds (between the
cans) are full-penetration, multi-pass welds.
It can readily be seen that this process of manufacture
results in the inclusion of significant residual .stresses in the com-
pleted column. Not only are those stresses of significant magnitude,
but they are of a highly complex nature, and in at least two directions
on a particular element of material within the column wall.
This report presents the results of the first stage of the
theoretical investigation contemplated. It is based on a computer model
of a tubular cross-section subjected to axial load and biaxial bending
moment, and it has as its object the production of realistic moment-
axial load-curvature (m-_p':'~) _curves for such a cross-section. The . . ... . .
analysis of a short (unit length) column does not allow examination of
'.
393.2A
the effects of long-column out-of-straightness of th~ effect of the
circumferential welds between cylindrical column "cans". However, the
short column analysis does permit an investigation of the effect of
residual stresses induced during plate rolling and also an examination
of the welds along the longitudinal column seams.
-2
In the F.L. report 393.2 a theoretical analysis was presented
which was a "first attempt" to produce m-p-~ curves. With the help of
the project committee, the program developed has been modified to
produce more realistic curves. The derivation of these is discussed
herein.

393.2A -3
2. THEORETICAL ANALYSIS
2.1 Method of Analysis
Santathadaporn and Chen (1) developed a computer program for
analysis of a short biaxially-loaded H-column, using the tangent stiff-
ness method. A similar method was evolved for the tubular column
although extensive modifications were necessary to permit the inclusion
of two-dimensional residual stresses. For completeness, the basic
equations are presented below.
For a biaxially loaded column the appropriate generalized
stresses for use in analysis are bending moments M and M and axial X y
force P, where the x- and y- axes are perpendicular and in a plane
perpendicular to ~he longitudinal axis of the column. The corresponding
set of generalized strains are bending curvatures ~ and i and axial X y
strain e . The following vectors of force and deformation are thus defined: 0
(f} =
[x}
-M X
M y
-P
t y
e 0
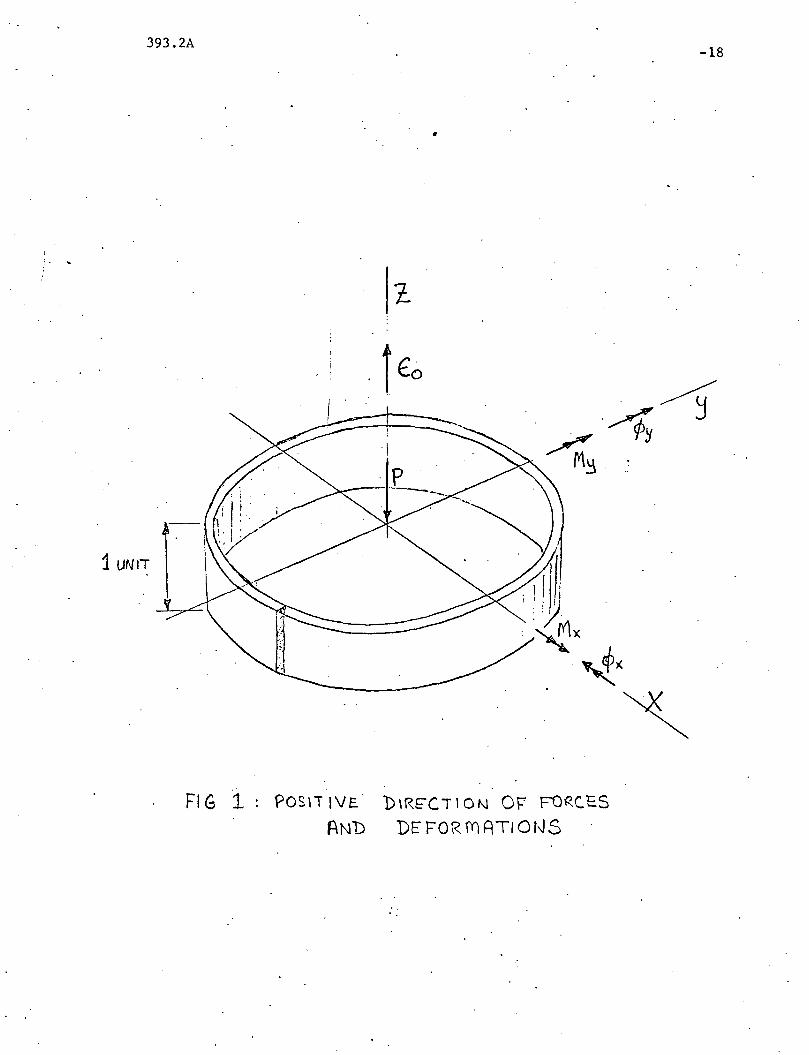
The generalized stresses and strains are shown in Fig. 1 in positive
(1)
(2)
directions. The orientation of axes X and Y are defined by the position
of the longitudinal weld, marke~ arbitrarily in Fig. 1. The object of
the analysis is to derive the deformation history of the cross-section
given its loading history.

. \
393.2A -4
Since plastic behaviDr depends on the previous load history
of the structure, it is possible only to establish the relationship
between the infinitesimal generalized stress increments (f} and the .
corresponding infinitesimal generalized strain increments [X}.
Santathadaporn and Chen (1) showed that the following relation~ . . ship between [f} and [X} may be derived for a particular column cross-
section:
-M Qll X
M = Q21 y
Q31
. or f f} =
In Eq. (3) Q .. is defined as 1J
Ql2 Ql3
Q22 Q23
Q32 Q33
(Q] [x}
Q22 = J E x2 dA
Q33 "" s E dA
Ql2 = Q21 = s E xy dA
Ql3 = Q31 ·= - J E y dA
Q23 "" Q32 = - s E X dA
where
~ X
~ y
e 0
-:
E = Young's modulus of elasticity for the material
A = area of cross-section
· x,y = co~rdinates of elemental areas, dA~ or the cross-section,
measured from the shear center of the section.
(3)
(4)
(5)
393.2A -5
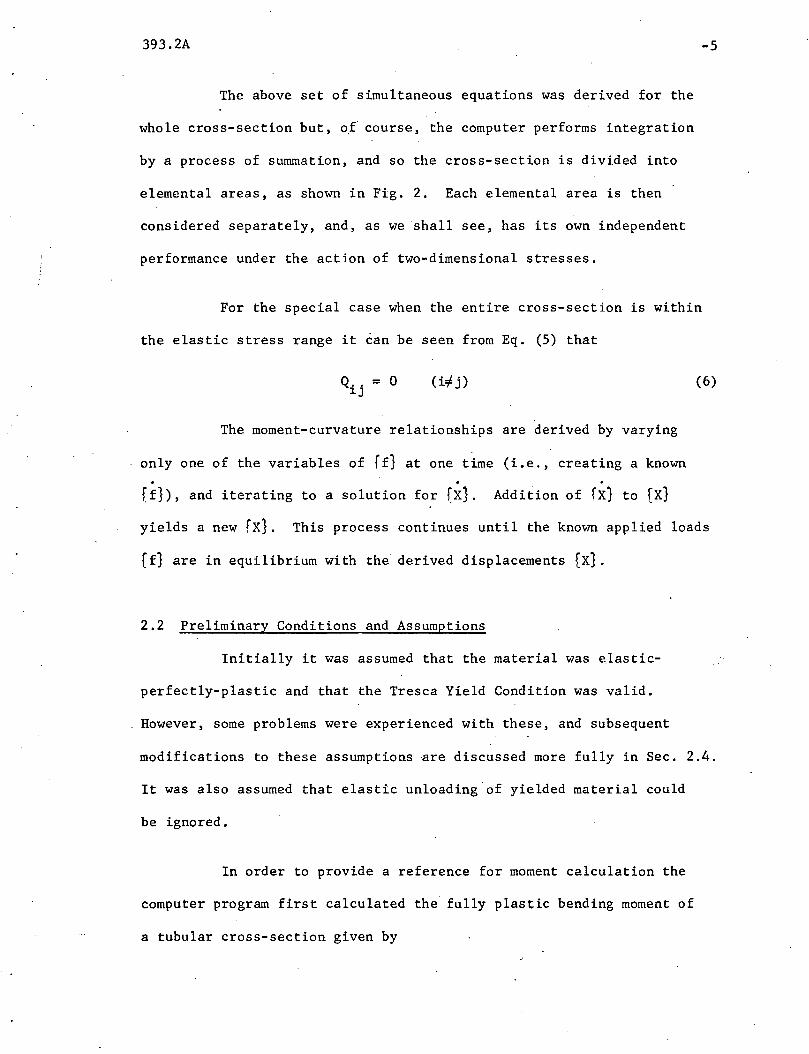
The above set of simultaneous equations was derived for the
whole cross-section but, of course, the computer performs integration
by a process of summation, and so the cross-section is divided into
elemental areas, as shown in Fig. 2. Each elemental area is then
considered separately, and, as we shall see, has its own independent
performance under the action of two-dimensional stresses.
For the special case when the entire cross-section is within
the elastic stress range it can be seen from Eq. (5) that
( i:# j) (6)
The moment-curvature relationships are derived by varying
only one of the variables of ff} at one time (i.e., creating a known 0 0 0
(f}), and iterating to a solution for (X}. Addition of fx} to [X}
yields a new fx}. This process continues until the known applied loads
(f} are in equilibrium with the derived displacements (X}.
2.2 Preliminary Conditions and Assumptions
Initially it was assumed that the material was elastic-
perfectly-plastic and that the Tresca Yield Condition was valid.
However, some problems were experienced with these, and subsequent
modifications to these assumptions are discussed more fully in Sec. 2.4.
It was also assumed that elastic unloading of yielded material could
be ignored.
In order to provide a reference for moment calculation the
computer program first calculated the fully plastic bending moment of
a tubular cross-section given by

393.2A
where
M = Z cr p p y
Z = plastic section modulus p
For a thin-walled tube, Z is given by p
where
t = wall thickness of the cross-section, and
D = outside diameter of cross-section. 0
-6
(7)
(8)
Similarly, a reference for curvature calculation is required, and this
was taken to be the curvature at first yield of a cross-section under
uniaxial bending, given by
where
i = x, y axis
t. = 1Y 2
D 0
For applied axial loads the reference load was taken to be
p = cr • A max y
and the corresponding reference axial strain is taken as the strain
at this load; i.e.,
e y
(J .,......:t..
E
(9)
(10)
(11)
In the introduction it was mentioned that the consideration
of a short tubular column did not enable consideration to be made of

393.2A
column out-of-straightness, i.e., a perfectly straight column is con
sidered, of uniform section.al properties. Furthermore, for this
analysis a constant column cross-section, both in shape and area, has
been assumed. The "short column" assumption is known to have signi
ficant effect on the moment-axial load-curvature (m-p-~) curves pro
duced, but it is not possible at this stage to explicitly gauge the
effect of the other two assumptions.
2.3 Inclusion of Residual Stresses
The problem of the inclusion of the residual stresses in
-7
the analysis is vital, as it is this factor which renders the problem
non-trivial. Furthermore, the effect of the interaction of the
"locked-in" rolling stresses and the residual stresses induced by longi
tudinal welding is largely unknown.
At date of writing, however, the exact magnitude and distri
bution of residual stresses in a prototype column is unknown. Exp·eri
ments are currently being conducted in order to determine these more
accurately, but the program deve~oped includes the best available
estiniates of these stresses, and provision has been made for more
accurate predictions to be included when these become available. The
current estimates are based partly "on expected behavior, and from these
predictions are made about the nature of prototype column behavior.
The circumferential (or through-the-thickness) residual stress
distribution assumed is a product of classical theory of plastic beha
vior. When a flat plate is rolled to form a cylindrical can it is
assumed that fully-plastic deformation is induced in the material,
393.2A -8
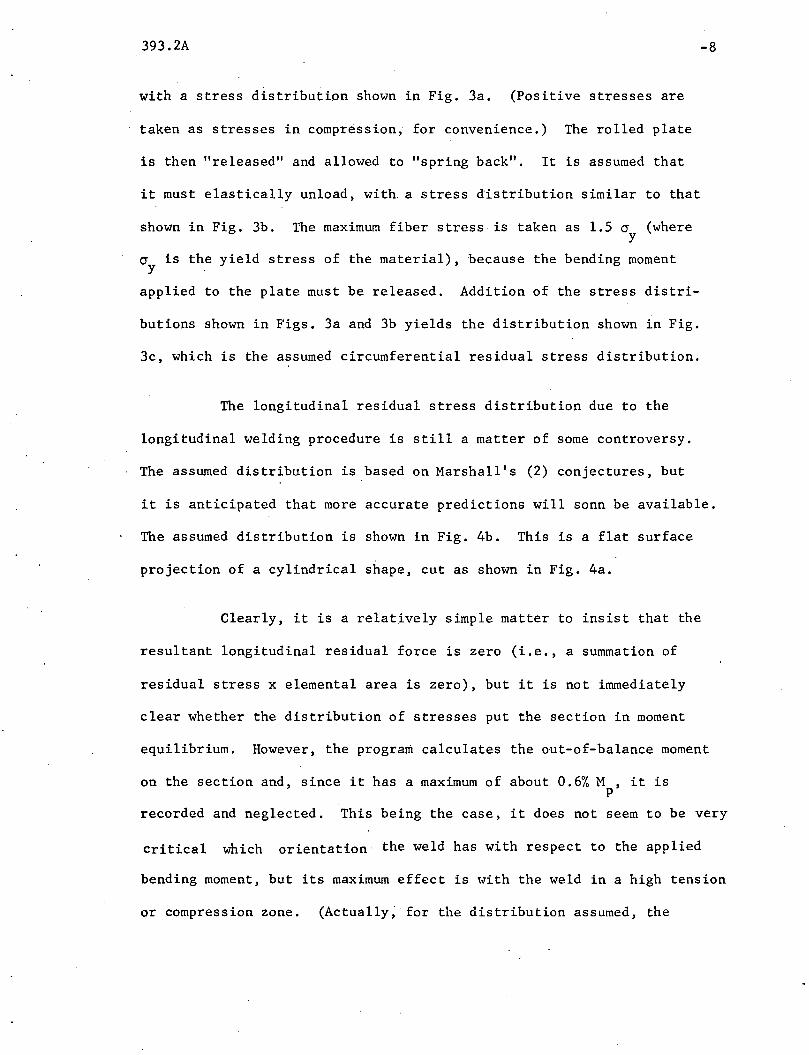
with a stress distribution shown in Fig. 3a. (Positive stresses are
taken as stresses in compression, for convenience.) The rolled plate
is then "released" and allowed to "spring back". It is assumed that
it must elastically unload, with a stress distribution similar to that
shown in Fig. 3b. The maximum fiber stress is taken as 1.5 cr (where y
cry is the yield stress of the material), because the bending moment
applied to the plate must be released. Addition of the stress distri-
butions shown in Figs. 3a and 3b yields the distribution shown in Fig.
3c, which is the assumed circumferential residual stress distribution.
The longitudinal residual stress distribution due to the
longitudinal welding procedure is still a matter of some controversy.
The assumed distribution is based on Marshall's (2) conjectures, but
it is anticipated that more accurate predictions will sonn be available.
The assumed distribution is shown in Fig. 4b. This is a flat surface
projection of a cylindrical shape, cut as shown in Fig. 4a.
Clearly, it is a relatively simple matter to insist that the
resultant longitudinal residual force is zero (i.e., a summation of
residual stress x elemental area is zero), but it is not immediately
clear whether the distribution of stresses put the section in moment
equilibrium. However, the program calculates the out-of-balance moment
on the section and, since it has a maximum of about 0.6% M , it is p
recorded and neglected. This being the case, it does not seem to be very
critical which orientation the weld has with respect to the applied
bending moment, but its maximum effect is with the weld in a high tension
or compression zone. (Actually~ for the distribution assumed, the

393.2A -9
compression area near the weld controls performance, and so a reduction
in ultimate moment occurs when the weld is put in compression.)
2.4 Two-Dimensional Stress Interaction
With the inclusion of residual stresses in two directions
it became necessary to adopt a two-dimensional material yielding
criterion, and for this purpose the.Tresca yield criterion (see Fig. 6)
was adopted. An alternative method would have been to use von Mises'
yield criterion, but since the maximum difference between the two
criteria is 8%, the choice of yield criterion is not considered to be
critical.
Another important facet of the analysis is that elemental
stresses in two directions (i.e., longitudinally and circumferentially)
are linked by a Poisson's ratio effect. As the longitudinal stresses
are applied (whether by applicati~n of axial load or of bending moment)
the circumferential stresses will be effected, i.e., an increase in
compression longitudinal stress produces a circumferential stress
(approximately equal to longitudinal stress multiplied by Poisson's
ratio) which increases circumferential compression stress and decreases
circumferential tension stress. This interaction causes problems in
the analysis when either the longi~udinal stress is.tensile and the
circumferential stress is compressive or vice versa, because·in chese
regions the Tresca yield surfaces are at 45° to the principal stress
axes. Not only will this interaction affect the stress state at which
the element yields, but it will obviously affect the subsequent loading
history of each particular element.
393.2A -10
In the ~lastic range of material behavior the elastic Poisson's
ratio (0.25 for steel) was assumed to be adequate. However, in the in
elastic range of structural behavior, the case is somewhat different.
When both circumferential and longitudinal stresses are either in tension
or compression, then the Tresca yield condition indicates that the
limiting stress is the yield stress, beyond which the element can assume
no more load, but merely deforms plastically. However, in the tension
compression areas of the Tresca yield diagram,a yielded element has
not necessarily reached its maximum load carrying capacity. It was
assumed that the element stress condition was such that, as the elemental
stress state changed, the element still remained in a yielded condition,
but merely shifted its position on the sloping lines of the Tresca yield
diagram. For this to be so a Poisson's Ratio of 0.5 is necessary, and
the limiting longitudinal stress is, eventually, the yield stress of
the material.
So far we have examined the assumptions by which the increase
in load-carrying capacity (if any) of a yielded element is assessed.
However, we have not yet determined how this will affect the section
curvature. Once an element has reached its yield stress it is assumed
to present no further resistance to section curvature--a product of the
elastic-perfectly-plastic material behavior assumption (i.e., material
strain hardening effects are ignored). However, an element which has
yielded in either of the tension-compression zones of the Tresca yield
diagram does still have some resistance to increased section curvature,
although this resistance is somewhat reduced from its resistance while
still in the elastic range of material behavior. -

393.2A -11
A rigid theory of plasticity solution requires the strain
vector for a yielded elemen·t to be perpendicular to the yield surface
assumed. However, a solution of this type is complicated, and does not
become readily accommodated in the expressions of Eq. (5). A pre-·
examination of Eqs. (5) shows that those expression were derived for
essentially uniaxial stress applied to an element. For this condition,
the appropriate value of E is readily assumed to a high degree of
accuracy. The value of E is usually accepted as being the normal elastic
modulus of elasticity until the applied stress equals the yield stress,
and thereafter E is taken as zero.
In order to find a relatively simple, yet reasonably accurate
solution to this impasse, it was decided to adopt a changing value of
E to accommodate a yielded element which still has a reserve load-
carrying capacity. As discussed above, an element has an elastic
modulus, E, which can be assumed constant until the element yields at
a longitudinal stress, cr • We also know that at the yield stress; cr , a y
the effective E value is zero. These two conditions were linked with a
straight line as shown in Fig. 6, to provide a reasonable estimate of
decr~asing elemental resistance to increased applied longitudinal loading
in the tension-compression regions of the Tresca. Yield diagram. While
this approach does not have the rigour of the theory of plastici.ty, it
was assumed to be a reasonable "first-try" as an acceptable solution.
393.2A -12
3. RESULTS AND DISCUSSION
3.1 Initial Comparisons
The results and discussion presented herein are based on the
computer program developed on the foregoing theory. In all cases the
assumed properties of the specimen are:
D = outside diameter of tube = 22.0 inches 0
t = wall thickness = 5/16 inches, and
cr = material yield stress = 36.0 ksi. y
Since the results are non-dimensionalized, the section pro-
perties will not affect the graphs produced. These properties were,
however, chosen because they are the specified properties of specimens
to be tested in a subsequent experimental program.
Initially the moment-curvature relation was derived for a
tubular cross-section with no residual stresses included. It was then
compared to the results obtained by use of various analytical expressions,
for example those of Ellis (3). Although results. obtained showed
reasonable aggrement between the two methods used, enough to check the
viability of the method, it was not possible to state that the analytical
expressions were more accurate than the computer solution--in fact the
reverse is probable.
· It has also been empirically determined that the shape factor
of the moment-curvature curve of a perfect thin-walled tube (i.e., the
ratio of plastic moment to first yield.moment for a member with moment
applied in only one direction· and no applied axial load) is about 1.27.
This was the figure derived from this theoretical analysis.

393.2A -13
3.2 Inclusion of Residual Stresses
With inclusion of· residual stresses in two directions, and
the stress relieving considered on an elemental basis (as discussed
in Sec. 2) a modified m-p-~ curve is expected on a tubular section:
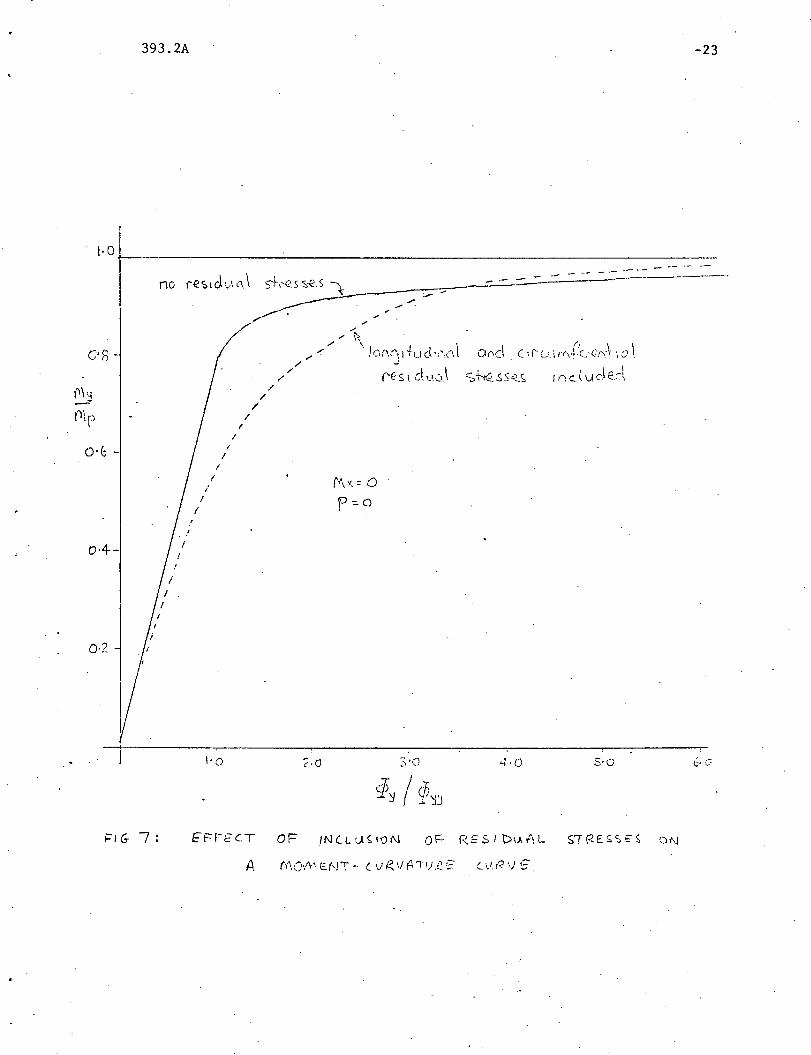
Figure 7 shows a comparison of an m-p-~ curve for a perfect tubular
section and that of the same section with consideration given to both
longitudinal and circumferential residual stresses. The curves com-
pared are for the case when no axial load is present and only uniaxial
moment is applied. The curve with residual stresses included is
asymptotic to 1.006 M because, in this orientation, the out-of-balance p
moment due to the assumed longitudinal residual stress (see Fig. 4)
is -0.006 M . As expected, the stress relieving phenomena result in p
the same ultimate section moment being reached for the two cases, but
that a greater rotation of the section with residual stresses included,
particularly in the critical area of applied moment = 0.2 to 0.9 M . p
Two other m-p-~ curves for a column section with residual
stresses included are presented herein. Figure 8 shows the affect of
biaxial bending moment being applied to the section. As expected, the
inclusion of such an effect reduces the ultimate moment capacity of the
section. The same conclusion is also possible from Fig. 9 which show·s
the effect of inclusion of axial load on the column.m-p-t curve.
The above results, as shown in Figs. 7 through 9 correspond
closely with empirical observations by column manufacturers.

393.2A -14
4. CONCLUSIONS
A computer program for analysis of short tubular columns
under axial load and biaxial bending has been developed, as the first
stage of a theoretical and experimental res.earch investigation. In
particular, the computer program allows derivation of the moment
curvature relations of such columns, in i step-wise iterative procedure
using the tangent stiffness method. The program attempted to explain
mathematically observed phenomena in the behavior of fabricated tubular
columns. The residual stresses involved by plate rolling and longi
tudinal seam welding of column components introduced complex two
dimensional stress states into the analysis. An engineering approxi
mation to allow consideration of elasto-plastic material behavior has
enabled production of modified moment-curvature relations which appear
to adequately explain observed phenomena.
It is considered that the analysis reported herein is a
necessary prelude to any long-column biaxial bending analysis of a
tubular column. It is anticipated that such a long-column analysis
will be undertaken, allowing consideration of the effects of column
out-of-straightness.

393.2A -15
5. ACKNOWLEDGMENTS
This work was undertaken in the Fritz Engineering Laboratory
of Lehigh University. Dr. D. A. VanHorn is Chairman of the Department
of Civil Engineering, and Dr. L. S. Beedle is Director of Fritz
Engineering Laboratory. Dr. W. F. Chen is the Project Director, and
the research is part of a project on "The Strength of Axially Loaded
Steel Tubular Columns", being sponsored by the American Petroleum
Institute. Mr. L. A. Boston. is Chairman of the Task Committee.
. 6. REFERENCES
1. Santathadaporn, S. arid Chen, W. F., "Tangent Stiffness Method for Biaxial Bending," Journal of the Structural Division, ASCE, Vol. 98, No. ST3, Prpc. Paper 8637, January 1972, pp. 153-163.
2. Marshall, P. W., "Stability Problema in Off-Shore Structures," presentation at the Annual Technical Meeting of the Column Research Council, St. Louis, March 25, 1970.
3. Ellis, J. S., "Plastic Behavior of Compression Members," Journal of the Mechanics and Physics of Solids, 1958, Vol. 6, pp. 282-300, Pergamon Press, London.

393.2A -16
A
dA
D 0
E
f
f
M
M p
M X
M y
p
p max
Q •• l.J
R
t
X
X
z p
~. l.Y
e 0
e y
7. NOMENCLATURE
= cross-sectional area
= elemental cross-sectional area
= outside diameter of cross-section
= Young's modulus of elasticity
= generalized stress vector
= generalized stress increment vector
= applied bending moment
= fully plastic uniaxial bending moment (see Eq. 7)
= applied bending moment about the x-axis (see Fig. 1)
= applied bend1.ng moment about the y-axis (see Fig. 1)
= axial force
= axial force when section completely yielded (see Eq. 10)
= see Eq. 4
= mean radius of cross-section
= wall thickness of cross-section
= generalized strain vector
= generalized strain increment vector
= plastic section modulus (see Eq. 7)
= curvature about i axis (x or y) at first yield of the cross-section under uniaxial bending
= rotation about the x-axis (see Fig. 1)
= rotation about the y-axis (see Fig. 1)
= axial strain
= axial strain at yield
393.2A -17
(J = stress
(J = first yielding stress a
(J = yield stress y
393.2A -18
•
i€" . 0
FIG 1: POS\iiVE. 'DIRE'CTlON OF FOR.C.E.S
AN"D DEFORMATIOI~S

393.2A
y -· .... -· . ·-.
j'·
MM 'DIVISIONS I'
THROUGH T'r\E" · TI-ll C l<.N E S S .
' -19
(-f:f11, J R Ai) I (i L.
t) IV I S \ 0 t~ S
X
FIG -:2.. : TU 6 VL RR. CROSS- SEC. Tl ON DIV ll)ED INTO
FIN JTE EL.Efi,ENTS

I
II ,I. I
393.2A
(a) PULLY -PLASTIC.
?LATE BE Nbl N G lb) Elf\ S T I C..
UNl OA.Dif'-IG
FIG 3·', C!'RCUf\t\TE~E.NTUlL 'RESIDUAL
STRESS DISTRll3UTION·
-20

393.2A
>r,;~~ .. --- ,, - . --- --.._________ _ _,.. ~
i;i~---- -CUT HERE i'l 1:' 1,1 'II J,
·~
~ lt - -- - ... ·-·- -- l --~---~--------- --1 '
(o) F"flljR.\CAIED TU13 ULA T< Sf'CTI 01\1
-WELD
T I
1T'
(b_) nr-\T PRo~-E(.!i c?•"-1 OF vJELD -INVt__JCED
D! s T R \ B I)T l 0 f'j
Fl G 4: LoNe' 1 '-"' o 1 N AL D 1. s T R l B J.. T : {) ('.)
-21

393.2A
FIG ·b:
' Qrl' I..,.'J ""l ,· ,_· 1 . I!.. v I-_, ,,, i ··-
!
--0
1 yOuNC:. 's MODULL.( S
Oq)
f,rst ~re.l.d '':3 ~+r-e.ss
E t: FE c. TtVE
C.r i<. GUn: FE ~:::r-JT: AL
. LON(, !TUDit-.itclL
STRESS
-22
393.2A -23
1·0~--------------~~---------------------------------------------
0·4-
I I
I /
/
I I
, ,
-- - -- -- ·--·------ ·--
1 nc.l udEd.
/
--4----------~----------~------------------~----~----------.-~--------~ l l·o 2·0 4·0 S·O
~I G- 7: E"f:"FEC.T OF INCLt.HIQN

' .
o·s-
(\\ :J
1"~\:l
O·b-.
0·4--
393.2A -24
I ! I
/·!) ?.·0 "3·0 . 4-·0
F1G 8: fl'IOf·it NT CLtfZ,/ri .. WR0 cv_Rvss FoR 1Stf1X.IAL
S E? CT! 01\J 13 21\J '1:> I r'-J ~· ·\

393.2A -25
!·D ----------
({\ ·~ ---
---~.
'., '\
O·S
, . 0·4-
0 ·2.-i.
! I
/ I
1·0 2·0
; . .,
rfl- p- p C.uRvES FOK. f1X1f1L. LOA"D f•Nb UNIAY'AL-
BENbiNG