Embed Size (px)
Citation preview

•
..
i
Experimental and Analytical Investigation of the
Indentation of Tubular Members
by
Joseph A. Padula
A Thesis
Presented to the Graduate Committee
of Lehigh University
in Candidacy for the Degree of
Master of Science
In
Civil Engineering
Lehigh University
1987
.. -··~


,... ..
.. Acknowledgments
This thesis is the product of research conducted at Fritz Engineering
Laboratory, within the Department of Civil Engineering at Lehigh University in
Bethlehem, Pennsylvania. Dr. Irwin J. Kugelman is the Chairman of the
Department of Civil Engineering. The research was part of a project, Residual
Strength of Offshore Structures after Damage, which was sponsored by the
Minerals Management Service of the U.S. Department of the Interior and the
American Iron and Steel Institute under the DOl/ AISI Cooperative Research
Program. The author is grateful for this support and for the advice and
guidance given by the members of the project Task Force; C.E. Smith and
A.C. Kuentz, the respective representatives of the sponsoring institutions, and
R.H. Wildt (Chairman of the Task Force) of Bethlehem Steel Corporation,
C. Capanoglu of Earl and Wright, C.D. Miller of CBI Industries, Inc.,
J. de Oliveira of Conoco, Inc., and J.B. Gregory of the Minerals Management
Service of the U.S. Department of the Interior.
An expression of gratitude is extended to Dr. Alexis Ostapenko for his
untiring effort in supervising the research and . for his encouragement and
guidance in the author's academic endeavor.
Thanks are due to the technical staff of Fritz Engineering Laboratory,
especially to Charles F. Hittinger, Robert R. Dales, and Russell C. Longenbach
for their help in conducting the experimental work and to Richard N. Sopko for
the photographic work. The assistance of Jyh-Min Liaw in conducting the tests
Is also appreciated.
Special thanks are also due to members of the Lehigh University
Computing Center staff, in particular, Stephen 0. Lidie and Sandra L. Johnson
lll

"
for their assistance with the computational work and patience in tutoring the
author in the use of a new operating system. The efforts of Dean Krause in
keeping the hardware on line under the strain of the analysis are appreciated.
The author is also grateful to Monica A. Newman who made special efforts to
facilitate his work.
Lastly, the author wishes to express his sincerest gratitude to E. Hunnisett
and E.L. Edwards for their support and encouragement over the last years.
IV
..
..
Abstract
1. Introduction
1.1 Scope 1.2 Previous Work
Table of Contents
1.3 Present Investigation 1.3.1 Experimental Work 1.3.2 Analytical Work
2. Experimental Work
2.1 Description of Test Specimens 2.1.1 Fabrication and Modification of Test Specimens
1
2
3 3 5 5 6
7
7 7
2.1.2 Dimensions and Material Properties 8 2.2 Indentation of the Test Specimens 8
2.2.1 General Considerations 9 2.2.2 Arrangement and Procedure for Indentation of Specimens 9 2.2.3 Results of Indentation 12
2.2.3.1 Dent Geometry 12 2.2.3.2 Energy Dissipation 12
3. Finite Element Analysis 13
3.1 Introduction 3.2 Modeling
3.2.1 Contact Problem 3.2.2 Discretization of the Tube
3.3 Boundary Conditions 3.4 Computational Parameters
3.4.1 Formulation of Equations 3.4.2 Solution of Equations 3.4.3 Development of Analytical Procedure
3.5 Results of Analysis 3.6 Discussion 3. 7 Computational Cost
4. Effect of Residual Stresses
4.1 Residual Stresses in a Circular Ring 4.2 Effect of Residual Stresses in a Circular Ring 4.3 Limited Range of Effect
4.3.1 Plastification and Residual Stresses Due to Indentation 4.3.2 Assumed and Observed Deformations
5. Summary, Conclusions and Recommendations
5.1 Introduction and Scope 5.2 Experimental Work 5.3 Analytical Work 5.4 Conclusions 5.5 Recommendations for Future Work
v
13 14 15 17 19 20 20 22 22 24 24 25
27
27 29 30 30 32
34
34 34 35 35 37

..
•
Tables
Figures
References
Appendix A. Experimental Work by Others
A.l Scope A.2 Description of Test Specimens A.3 Indentation of Specimens
Appendix B. Nomenclature
Vita
VI
38
41
65
67
67 67 68
69 70

List of Figures ..
Figure 1: Set-up for Indentation of Specimen Pl 42 Figure 2: Indentation of Specimen P2 42 Figure 3: Schematic Representation of Ideal Dent Geometry 43 Figure 4: Schematic Representation of Test Set-up for Indentation 44 Figure 5: Experimental Load vs. Dent Depth Curve for Specimen 45
PI Figure 6: Experimental Load vs. Dent Depth Curve for Specimen 46
P2 Figure 7: Energy Absorption vs. Dent Depth for Specimens Pl and 47
P2 Figure 8: Finite Element Model for Tube Indentation 48 Figure 9: Typical Stress-Strain Relationship for Stiffening Truss 49
Element Figure 10: Geometry to Determine E
5 49
Figure 11: Dimensions for Discretization of Model 2 50 Figure 12: Dimensions for Discretization of Model 4 51 Figure 13: Dimensions for Discretization of Model 8 52 Figure 14: Discretization of Tube - Model 2 53 Figure 15: Discretization of Tube - Model 4 54 Figure 16: Discretization of Tube - Model 8 55 Figure 17: Load vs. Dent Depth, Speicmen Pl - Model 2 56 Figure 18: Load vs. Dent Depth, Speicmen Pl - Model 4 57 Figure 19: Load vs. Dent Depth, Speicmen P2 - Model 4 58 Figure 20: Load vs. Dent Depth, Speicmen IIICI - Model 4 59 Figure 21: Load vs. Dent Depth, Speicmen IBII - Model 8 60 Figure 22: Load vs. Dent Depth, Speicmen IIAII - Model 8 61 Figure 23: Residual Stresses Through Thickness Due to Cold-Rolling 62 Figure 24: Stress Distribution after Flattening 62 Figure 25: Assumed Deformation of a Ring (From Reference [15]) 63 Figure 26: Deformation of a Ring from Idealized Dent Geometry 63 Figure 27: Test Setup for Indentation (From Reference [12]) 64
•
• Vll

Table 1: Table 2: Table 3:
•
List of Tables
Specimen Data Computational Cost Details of Analytical Models
Vlll
39 39 40

'
•
Abstract
The "damage design" approach to offshore structure design requires
consideration of accidental damage and its effect on the structural integrity.
For this reason, an experimental and analytical investigation of the indentation
behavior of tubular members was conducted.
The experimental work consisted of the indentation of two large-diameter
fabricated steel specimens. The test specimens were 1.0 m ( 40 in.) and 1.5 m
(60 in.) in diameter with corresponding D/t ratios of 151 and 227. Each
specimen was simply supported at its ends and subjected to a concentrated
lateral loading with a rigid indenter at midlength. Load-deformation response
and the energy absorption as functions of dent depth are presented for each
specimen.
The analytical work included the finite element analysis of the indentation
of the two test specimens and of three additional specimens whose indentation
response was reported in the literature. In contrast to the two fabricated test
specimens, these specimens were manufactured stress relieved tubes. The
correlation of the load vs. dent depth response of these tubes with the
analytical results was much better than that of the fabricated specimens. This
observation prompted an investigation into the effect of residual stresses (due to
cold-rolling during fabrication) on the indentation response.
It was shown that these residual stresses can significantly affect the load
deformation relationship by reducing the amount of energy absorbed for a given
dent depth. Consequently, neglecting their effect can result m an
underestimation of the damage resulting from a given "design collision" .
1

•
Chapter 1
Introduction
In the design of offshore platforms, it IS necessary to consider the
possibility of structural damage resulting from accidental impacts during
construction or operation, a ship/platform collision, ice hazards, or severe cases
of overloading. Of these, ship/platform collisions occur fairly frequently and are
probably the single most common type of offshore accident resulting m
structural damage. [5] Although it may be impractical to design structures to
resist a collision with a large vessel such as a tanker while sustaining only
moderate damage, the design process must include consideration of the more
probable collisions with supply vessels or other ship traffic. Limiting the extent
of the accidental damage in such an event so that the integrity of the structure
is not significantly compromised or that it can be maintained until repairs can
be effected should be an objective of any design. This requires that the
designer be able to estimate the extent of damage that may be expected as well
as the residual strength of the structure after damage.
Requiring that the structural integrity of a platform be maintained in the
event of an accidental collision necessitates that the structure have sufficient
capacity to sustain elastic and plastic deformations thereby providing a
mechanism for absorption of energy. Even though elastic deformations and/or
vibrations may dissipate most of the energy from minor ship/platform collisions
or accidental impacts, plastic deformations will develop at least at the point of
contact. [5]
2

•
•
1.1 Scope
To determine the effect of damage, it is first necessary to have some, at
least approximate, knowledge of the type and extent of damage that can be
reasonably expected as a result of a collision. In framed structures constructed
of steel tubular members, the result of a collision usually takes the form of
localized dents and/or overall deflection of a member(s). The interaction of
these two deformation modes is complex and depends upon the geometry of the
member, the end restraint interaction by the frame, and the type of event
producing the damage. From knowledge of the member/structure response the
energy absorption capacity can be determined providing a means to estimate the
extent of damage given a "design collision" with a known mass and velocity.
Therefore, determination of the load deformation response and energy
absorption capacity of a structure is prerequisite to prudent design. For these
reasons, the current research has been focused on the determination of the
indentation behavior of tubular steel members.
1. 2 Previous Work
A number of researchers have investigated the indentation of tubular
members as it relates to accidental damage Ill offshore
structures. [12, 11, 10, 14, 15] Lateral loading of tubular members and the
resulting deformation mechanisms have been the focus of much of the research
effort. The approaches to the problem range from simplified analytical models
and the use of numerical techniques such as the finite element method to the
formation of an experimental database. For example, the basis for Taby's work
on the residual strength of damaged tubular members has involved extensive
experimental work including the indentation of tubular members. [13] On the
3

..
other hand, Wierzbicki and Suh have presented a purely theoretical analysis of
the denting of tubular members under combined bending and axial loading. [15]
Their work involved the application of a method previously applied to the
axisymmetric buckling of tubes. [16] Soares and Soreide have presented a
simplified analysis of tubular members whose primary mode of deformation 1s
overall beam deflection and correlated the results with finite element
analyses. [ 11] An excellent review of the state of the art of the collision-
damage and residual strength of offshore structures including a comprehensive
bibliography has been provided by Ellinas. [5]
Since they are usually based on simplifying idealizations, the proposed
analytical solutions must be validated by correlation with experimental results
before they can be used with confidence. These idealizations may range from
the common assumption of rigid-plastic material behavior to a prescribed
deformation geometry for tubes subjected to lateral loading. Due to the
complex interaction of localized denting and overall bending deformations and
the wide range of tube geometries and loadings, such assumptions may affect
the accuracy of the analytical model.
The need for correlation of theoretical results with experimental evidence
also applies to results obtained from numerical techniques such as the finite
element method. Additionally, the task of generating solutions for such a
complex problem involving material and geometric nonlinearities requires
considerable expense in terms of time and computer resources.
Probably the most significant shortcoming of the reported experimental
work so far is the lack of data on tubular members fabricated by cold-rolling
and welding, which is the usual method of fabrication for offshore structures,
4

and consideration of members with large D/t ratios. The work described here
addresses these needs, at least in part.
1.3 Present Investigation
The thrust of the current research effort has been to determine the
response of tubular members under lateral loading assuming the primary mode
of deformation to be localized denting of the tube wall. This investigation
consisted of experimental and analytical phases. The results of the analytical
work were correlated with the experimental work of the current project as well
as with the experimental results reported by Taby and Rashed in Reference [12].
A brief description of the experimental work performed by Taby and Rashed is
given in Appendix A.
1.3.1 Experimental Work
The experimental phase of the project involved the testing of two large
diameter, fabricated tubular test specimens. Each specimen was subjected to a
lateral load at midlength to produce a localized indentation. The specimens
were simply supported at the ends during indentation and the load was applied
through a rigid indenter. The displacements at several locations were measured
and recorded thus providing the necessary data to establish the load vs. dent
depth and the energy dissipation relationships. The experimental work was also
a prelude to further experimentation (axial load testing) on the residual strength
of damaged tubular members. [9]
5

1.3.2 Analytical Work
The analytical work consisted of the finite element analysis of the
indentation of tubular members and correlation of the results with experimental
data. In order to assess the validity of the finite element analysis over a wide
range of tube geometries and material properties, the analysis and correlation
were made for five specimens for which experimental data were available; two
specimens tested as a part of this program and three additional specimens for
which load vs. dent depth curves were presented in Reference [12]. Correlation
with experimental data also provided useful information for refinement of the
modeling technique.
The effect of residual stresses due to cold-rolling during the fabrication
process on the load vs. dent depth response was also investigated. This was
prompted by a much improved correlation between _the results of the finite
element analysis and the experimental data from the manufactured and stress
relieved test specimens reported in Reference [12] as compared to the correlation
with data from. the fabricated specimens of the experimental phase of this work.
The· investigation demonstrated that residual stresses can have a significant
effect on the indentation response. Specifically, the residual stresses reduce the
stiffness of the response and neglecting their effect can result m an
underestimation of the damage resulting from a given "design collision".
6

Chapter 2
Experimental Work
The experimental work consisted of the indentation of two large-diameter,
fabricated specimens. The load vs. dent depth response of each specimen was
recorded during indentation. Energy absorption as a function of dent depth was
also calculated.
Additional experimental data consisting of the indentation response of three
specimens (Specimens IIICI, IBII, and IIAII) were taken from Reference [I2] for
correlation with the analytical work. A brief description of this experimental
work is given in Appendix A.
2.1 Description of Test Specimens
The specimens were obtained by modifying two test specimens of a
previous project (Specimens T3 and T4 in References [8, 6]). For the current
project, these two specimens were designated PI and P2, respectively.
2.1.1 Fabrication and Modification of Test Specimens
The two test specimens, PI and P2, were fabricated by cold-rolling steel
plate into right circular cylinders in a pyramid three-roller bending machine and
welding the longitudinal seam by an automatic submerged-arc process. Steel
end rings were welded to each end of the specimens to facilitate uniform
distribution of the axial load during testing. Detailed information on the
fabrication and material properties is given in Reference [8].
Previous axial load testing resulted in severe local buckles confined to one
end of each specimen. The limited extent of the deformations made it possible
to modify these specimens for reuse by removing the buckled portions and
7

•
reattaching the end rings.
Reference [9].
The modification process IS further described m
2.1.2 Dimensions and Material Properties
Specimens P1 and P2 had outside diameters of 1.02 m (40.2 in.) and
1.53· m (60 in.), respectively. Both specimens had a wall thickness of 6.73 mm
(0.265 in.). After modification, Specimen P1 was 2.44 m (96 in.) in length and
Specimen P2 2.13 m (84 in.), exclusive of the thickness of the end rings. The
circular steel end rings welded to the ends of the specimens were 22 mm thick
by 127 mm wide (7 /8 in. x 5 in.). All pertinent geometric and material
properties including diameter-to-thickness (D jt ), length-to-radius of gyration
(L/r) and dent depth-to-diameter (d/D) ratios are listed in Table 1.
The specimens were fabricated from ASTM A36 steel plate. In the
previous project the static and dynamic yield stresses of the material were
determined from standard ASTM coupons. [8] The material properties of the
modified specimens were assumed to be the same as those of the original
specimens. Thus, the possible effects of cold-rolling and work hardening during
the original tests were neglected.
2.2 Indentation of the Test Specimens
The indentation of the specimens was accomplished by the application of a
lateral load through a rigid indenter. The load vs. dent depth relationship and
energy absorption as a function of the dent depth were determined for each
speCimen from the data collected during indentation.
8
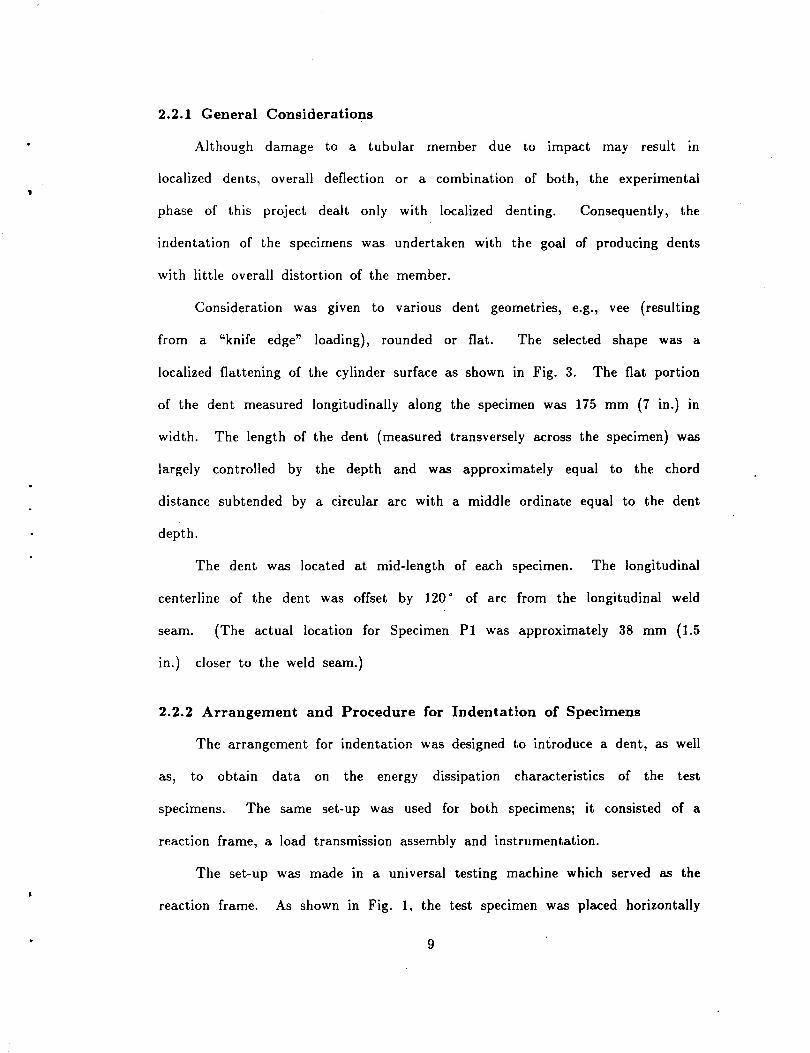
2.2.1 General Considerations
Although damage to a tubular member due to impact may result in
localized dents, overall deflection or a combination of both, the experimental
phase of this project dealt only with localized denting. Consequently, the
indentation of the specimens was undertaken with the goal of producing dents
with little overall distortion of the member.
Consideration was given to various dent geometries, e.g., vee (resulting
from a "knife edge" loading), rounded or flat. The selected shape was a
localized flattening of the cylinder surface as shown in Fig. 3. The flat portion
of the dent measured longitudinally along the specimen was 175 mm (7 in.) in
width. The length of the dent (measured transversely across the specimen) was
largely controlled by the depth and was approximately equal to the chord
distance subtended by a circular arc with a middle ordinate equal to the dent
depth.
The dent was located at mid-length of each specimen. The longitudinal
centerline of the dent was offset by 120 • of arc from the longitudinal weld
seam. (The actual location for Specimen P1 was approximately 38 mm (1.5
in.) closer to the weld seam.)
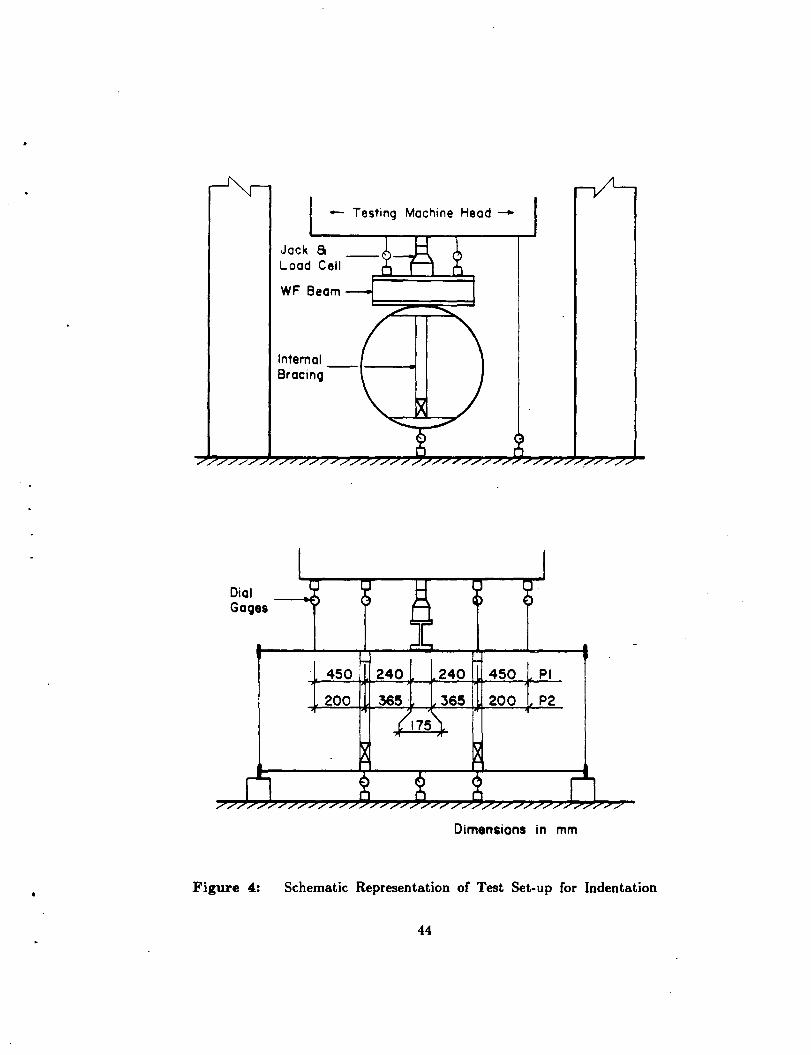
2.2.2 Arrangement and Procedure for Indentation of Specimens
The arrangement for indentation was designed to introduce a dent, as well
as, to obtain data on the energy dissipation characteristics of the test
specimens. The same set-up was used for both specimens; it consisted of a
reaction frame, a load transmission assembly and instrumentation.
The set-up was made in a universal testing machine which served as the
reaction frame. As shown in Fig. 1, the test specimen was placed horizontally
9

on the floor of the testing machine and supported by steel blocks under the end
rmgs. The blocks, in effect, provided simple support at the ends of the
specimen and also gave the necessary clearance to place dial gages underneath
the speCimen.
The load transmission assembly between the machine head and the
specimen consisted of a short section of wide flange beam placed transversely
across the specimen, a manually operated hydraulic jack, and a load cell. The
175 mm (7 in.) wide flange of the beam served as the die for forming the dent.
A view of the indentation of Specimen P2 m progress is shown in Fig. 2. The
test setup is shown schematically in Fig. 4.
transverse bearing members was installed
Internal bracing with struts and
at the edges of the intended
indentation in order to localize the deformation.
The instrumentation for measuring the distortion of the specimens during
indentation consisted of ten mechanical dial gages located as shown in Fig. 4.
Two were placed between the beam and the testing machine head, one on each
side of the jack-load cell assembly. These gages directly measured the extension
of the jack and, thus, the displacement relative to the machine head. Four dial
gages were placed between the top surface of the specimen and the testing
machine head, and three between the testing machine floor and the bottom of
the specimen. One dial gage was used to directly measure the displacement of
the machine head relative to the floor. This was done by connecting a dial
gage mounted on a pedestal on the floor with a light-gage wire to a magnetic
clip on the testing machine head.
The indentation procedure consisted of incremental application of load to
the specimen through the jack-loadcell-beam assembly. At each load increment,
10

•
the load and dial gage readings were recorded. The approximate depth of dent
was indicated by the readings from the dial gages between the machine head
and the beam. Loading continued until the dent exceeded the desired depth by
an amount estimated to be lost due to elastic recovery during unloading. The
set-up and procedure for indentation were similar for both specimens.
Specimen PI required two cycles of loading and unloading because the
elastic recovery was underestimated in the first cycle. The observed elastic
recovery during the first unloading provided a means of more accurately
estimating the final dent depth. The maximum load needed for PI was I68 kN
(37.8 kips).
During loading of Specimen P2, at approximately I60 kN (36 kips), one of
the wooden struts used for internal bracing failed suddenly, and the load
immediately dropped to 116 kN (26 kips). The specimen was then unloaded,
and the wooden struts were replaced with steel members. Loading then
continued to 276 kN (62 kips).
Plots of the load vs. dent depth for each specimen are shown in Figs. 5 4D2tu
and· 6. The load was non-dimensionialized with respect to a factor ( T) , the magnitude of a concentrated load at midspan which would produce a plastic
moment according to simple beam theory. The dent depth is given as a
fraction of the tube diameter.
11

2.2.3 Results of Indentation
The indentation tests produced two specimens with localized dents at
midlength as well as data on the load vs. dent depth response. The energy
dissipation as a function of dent depth was also determined.
2.2.3.1 Dent Geometry
Locally, the depth of dent for Specimen Pl was 19 mm (0. 75 in.), the
depth being measured with respect to the points just outside the dented area.
Subsequent measurements of the specimen geometry with respect to the ends of
the specimen showed that the overall depth of indentation was 28 mm (1.1 in.).
This indicated that the deformation was a combination of a local dent and an
overall deflection of the specimen wall. For Specimen P2, the depth of dent
was 70 mm (2.8 in.) locally and 84 mm (3.3 in.) overall.
Thus, the nature of the dent was also predominantly local with only a
slight overall distortion of the specimen. The dentdepth-to-diameter ratios for
Specimens P1 and P2 were 2. 7% and 5.5%, respectively.
The surfaces of the dented specimens were mapped and contour plots were
made. A complete description of the dent geometry of both specimens including
the surface contour plots is given in Reference [9].
2.2.3.2 Energy Dissipation
The amount of energy dissipated during the indentation process was
determined from the area under the curve plotted from the load vs. dent depth
data. Figure 7 shows the total energy absorbed vs. the dent depth for each
speCimen. The total energy absorbed included both the elastic and plastic
deformations since this would be of interest in considering the mechanics of a
collision.
12

Chapter 3
Finite Element Analysis
In order to investigate the tube indentation problem analytically, finite
element models were developed and solutions were obtained using the 1981
version of the program ADINA. • This program was selected for its capability
regarding material and geometric nonlinearities. The analysis was performed on
a Control Data Corporation Cyber 180 Model 850 computer running the NOS
and NOS/VE operating systems.
The indentations of Specimens P1 and P2 as well as Specimens IBII, IIAII,
IIICI were analyzed with ADINA. Pertinent information on the latter three
specimens which are a representative sampling of the specimens tested by Taby
and Rashed are given in Appendix A and Reference [12]. These five specimens
covered a wide range of tube geometries and material properties for which
results of the analysis could be compared to experimental data. The basic
modeling technique used is similar to that employed by Hypponen and Raiko in
the analysis of a pipe whipping against a rigid support. [7]
3.1 Introduction
The response of a tubular member subjected to indentation is highly
nonlinear due to the large deformations of the tube and plastification of the
material. The analysis is also complicated by the nature of the contact between
the indenter and the tube wall. The contact area increases with the dent depth
and the distribution of the load over the contact surface is continuously
• ADINA Engineering AB, Vasteras, Sweden, and ADINA Engineering Inc., Watertown, Massachusetts
13

c
changing. Because the contact area and the distribution of the load are both
dependent on the response of the tube, the applied load (actually, an induced
nodal point displacement) could not be given as prescribed input for the
computer program. This necessitated the use of a special modeling technique.
The material and geometric nonlinearities due to plastification and large
deformations were within the capabilities of ADINA, and the difficulty was only
in determining computational parameters such as load increments and response
tolerances.
3.2 Modeling
The finite element model consisted of two basic components: an assemblage
of shell elements representing the tube and a set of truss elements designed to
model the contact between a rigid indenter and the tube wall. The shell
elements used the isoparametric shell elements with variable number of nodes
from the ADINA element library. Two node truss elements with nonlinear
stress-strain relationships were used to model the rigid indenter. The internal
bracing used during the indentation of Specimens Pl and P2 was modeled with
a single linear elastic truss element. Due to symmetry of the problem, only one
fourth of the tube was modeled. The tube was sectioned along the longitudinal
and transverse planes of symmetry which passed through the center of the
indentation. An overall view of a typical model is shown in Fig. 8.
14

•
3.2.1 Contact Problem
The problem of modeling the contact of a rigid indenter against a
cylindrical tube was simulated by a series of truss elements with nonlinear
material properties. At one end, the truss elements were connected to the shell
element nodal points in the indentation area of the tube wall. The opposite
ends of all the truss elements were connected to a common node at sufficient
distance from the surface of the tube to consider the line of action of the forces
to be parallel. A prescribed displacement was imposed on this node to produce
the indentation of the tube.
The truss elements used to model the indentation of Specimens PI and P2
were arranged in three rows corresponding to the 175 mm (7 in.) width of the
indenter used. Since the specimens tested by Taby were subjected to a knife
edge loading, the indentation was modeled with a single· row of truss elements
on the centerline of the indentation.
Simulation of the contact was achieved through the definition of the
constitutive relationships for the truss elements. Nonlinear elastic material
property defined by a piecewise-linear stress-strain ( u-f) relationship was selected
from the material models available for truss elements in ADINA. Pairs of u-f
values input into the program defined the stress and tangent modulus as
functions of strain.
A typical stress-strain diagram for a truss element is shown in Fig. 9. To
model the condition of contact (no tension forces may develop between the tube
surface and the indenter), the truss elements were made extremely soft in
tension by defining a very small modulus of elasticity for positive strains.
Modeling of the initial gap between the indenter and the tube was accomplished
15

..
by extending the soft material response into the compressiOn range. At the
point of contact between the indenter and tube wall the modulus of elasticity
was very large. Typically, this range was preceded by a short transition of
moderate stiffness (See Fig. 9.).
The values of £8
, the strain at which the modulus of elasticity increases to
its ultimate value, were determined for each truss element from the geometry as
shown in Fig. 10, where £ = ~. The transition from an essentially zero modulus 8 L
of elasticity to rigid was also determined from the geometry. The value of £ s
calculated for a truss element marked the initiation of the transitional stiffness
for the adjacent truss element. This constitutive relationship allowed the truss
elements to have virtually no stiffness until the deform~d geometry of the model
was consistent with contact at a nodal point by a rigid indenter.
The use of a transition in the stress-strain relationships proved to be
computationally expedient. It was also justified in the simulation of the
physical problem. In a direct comparison of analyses with bilinear and trilinear
stress-strain curves (with and without a transition), the bilinear relationship was
slightly more costly, requiring 4% more CPU time for a 13% increase in the
number of equilibrium iterations performed for the analysis. The greatest
difference in the two runs was in the calculated load vs. dent depth response of
the model. The response using a trilinear stress-strain relationship was
considerably smoother.
The physical justification for usmg the transition in moduli of elasticity
lies in the continuous nature of the actual distributed loading as opposed to the
application of the load at discrete nodal points. The transition simulates a
continuous loading by allowing a more gradual shifting of load from one nodal
16

point to the adjacent node as the dent depth is increased. For this reason, a
quad-linear stress-strain relationship (2 transitions) was used in the analyses
performed with Model 2 (See Sec. 3.4.3).
3.2.2 Discretization of the Tube
Excluding preliminary attempts, three discretizations of the tube were used.
One model was used for the analysis of the test specimens PI and P2 only,
while two other more refined models were used in the· analysis of all five
specimens. The latter two models differed from the first by the type of shell
elements and by the coarseness of the mesh at the indentation. The principal
difference between the two latter discretizations was basically a modification to
accommodate larger dent depths.
In modeling, advantage was taken of the symmetry of the problem
allowing the analysis to be performed on a model consisting of one-fourth of the
actual tube. Planes of symmetry, passed through the center of the indentation
transversely to and along the longitudinal axis of the tube, divided it into
quarter segments. Appropriate boundary conditions were imposed at the cuts
(See Sec. 3.3).
A description of the three models is given m the following paragraphs
indicating the types of shell elements used and the number of nodal points. In
the course of the work, these models were somewhat arbitrarily given the
designations Model 2, 4, and 8 corresponding to a scheme for labeling each of
the computer runs made. Dimensions related to the discretization for each
model and the particular specimens are shown in unfolded views of the meshes
m Figs. 11, I2 and I3.
Model 2, the model first used for the analysis of Specimens PI and P2,
I7
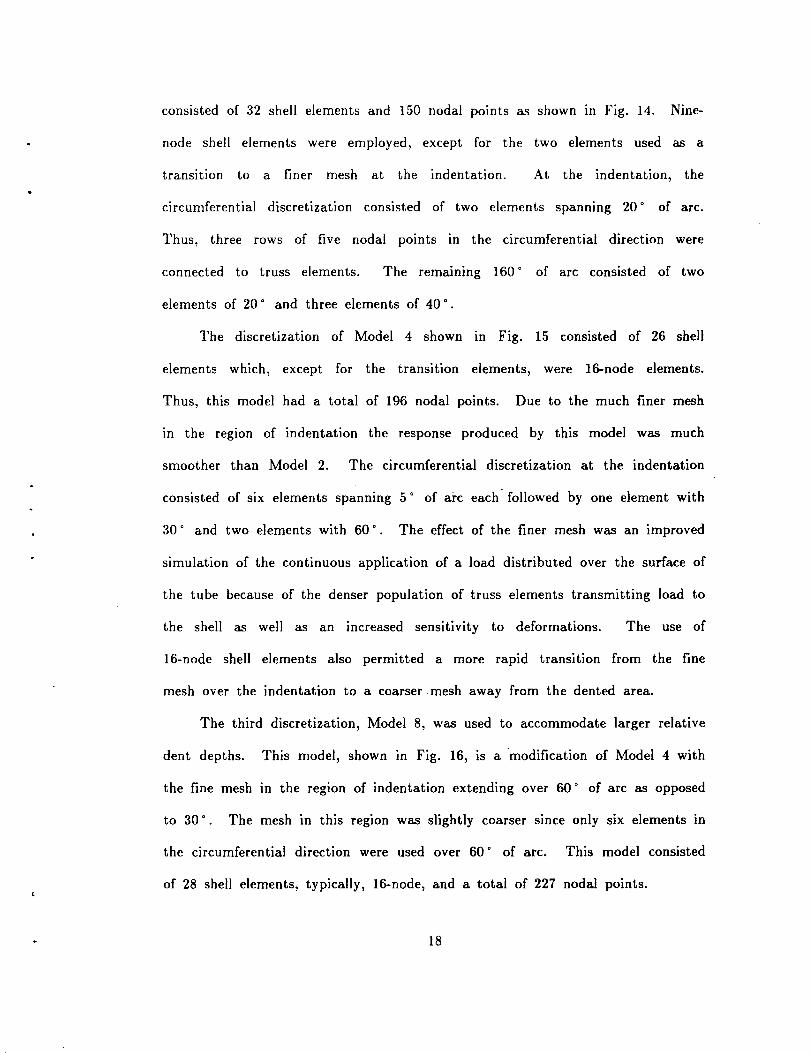
consisted of 32 shell elements and 150 nodal points as shown in Fig. 14. Nine
node shell elements were employed, except for the two elements used as a
transition to a finer mesh at the indentation. At the indentation, the
circumferential discretization consisted of two elements spanning 20 ° of arc.
Thus, three rows of five nodal points in the circumferential direction were
connected to truss elements. The remaining 160 ° of arc consisted of two
elements of 20 o and three elements of 40 o.
The discretization of Model 4 shown m Fig. 15 consisted of 26 shell
elements which, except for the transition elements, were 16-node elements.
Thus, this model had a total of 196 nodal points. Due to the much finer mesh
in the region of indentation the response produced by this model was much
smoother than Model 2. The circumferential discretization at the indentation
consisted of six elements spanmng 5 o of arc each· followed by one element with
30 ° and two elements with 60 o • The effect of the finer mesh was an improved
simulation of the continuous application of a load distributed over the surface of
the tube because of the denser population of truss elements transmitting load to
the shell as well as an increased sensitivity to deformations. The use of
16-node shell elements also permitted a more rapid transition from the fine
mesh over the indentation to a coarser mesh away from the dented area.
The third discretization, Model 8, was used to accommodate larger relative
dent depths. This model, shown in Fig. 16, is a ·modification of Model 4 with
the fine mesh in the region of indentation extending over 60 o of arc as opposed
to 30 o • The mesh in this region was slightly coarser since only six elements in
the circumferential direction were used over 60 o of arc. This model consisted
of 28 shell elements, typically, 16-node, and a total of 227 nodal points.
18

3.3 Boundary Conditions
The boundary conditions imposed on the models were dictated by two
criteria; the enforcement of deformations consistent with the symmetry of the
problem and the imposition of the support conditions of the two different test
arrangements used for the indentation of Specimens P1 and P2 (See Sec. 2.2)
vs. Specimens IIICI, IBII, and IIAII (See Appendix A).
The boundary conditions required to impose the condition of symmetry on
the quarter section model were the same for all five specimens. At the
circumferential cut made by the transverse plane of symmetry at the center of
indentation, the translational degree of freedom in the longitudinal direction and
rotation about a tangent to the circumference were eliminated. Along the two
longitudinal cuts made by the longitudinal plane of symmetry, the translation in
the circumferential direction, as well as, the rotation about the longitudinal axis
were prohibited.
The support condition of the test setup for Specimens P1 and P2 were
modeled by preventing translation m the transverse plane at the end of the
model. This accommodated the effect of the support arrangement as well as of
the end rings attached to these two specimens (See Chap. 2).
The support arrangements for the indentation and the length of the
Specimens IIICI, IBII, and IIAII (See Appendix A), permitted the analytical
models to be shortened for the sake of economy of computation. The length of
the models was made not less than one and a half diameters since the portions
of the tube outside this region would have negligible effect on the indentation.
The actual lengths of the models used for these three specimens are given in
Figs. 12 and 13. All degrees of freedom were allowed at the truncated free end
19

of the model. The cradle support for these specimens was modeled by
prohibiting translation m the radial direction at the nodal points directly
opposite the indentation.
3.4 Computational Parameters
The high degree of nonlinearity of the problem resulting from large
displacements coupled with material nonlinearity and the aforementioned contact
problem presented some computational difficulties. When unresolved, these
difficulties typically manifested themselves in erratic calculated response or
abnormal termination of computation. However, results were obtained after
gaining some experience with the computer program. In particular, some
experimentation was necessary to determine the effect of the various user input
parameters which relate to the formulation and solution of the incremental
equilibrium equations on the calculated response. In general, the load
increments had to be made very small and equilibrium iterations performed at
every load step. The stiffness matrix was also updated at every load step.
Even with these measures taken, the calculated response was not always as
smooth as would be desired.
3.4.1 Formulation of Equations
For the shell elements, total Lagrangian formulation was used (large
displacements and rotations with small strains) together with elasto-plastic
material behavior. The von Mises yield criterion was used for the material
model. [2]
In the formulation of the element matrices, ADINA employs Gauss
numerical integration for which the order of integration (number of integration
20

points) IS controlled by the analyst. The program documentation offers
somewhat nebulous advice on suggested integration orders but seems to favor
higher integration orders for nonlinear analysis. [1, 2] The likely reason is that
lower integration orders can result in an assembled structure stiffness matrix
that is singular or ill-conditioned. [3] However, it has been suggested that in
general "it is best to use as low an order as possible without precipitating a
numerical disaster". [4] The first analyses performed with Model 2 used higher
integration orders and produced load vs. dent-depth responses that were very
much stiffer than the experimental response. The subsequent use of reduced
integration orders with this model resulted in a much improved agreement with
the experimental data. This may be attributed to the fact that the resulting
inaccuracies in the numerical integration may compensate for the inherent
stiffness of the finite element solution. [3]
ADINA allows up to 4 integration points m the in-plane directions of the
shell elements as well as through the thickness. The default values for the Ill
plane directions are 2 and 3 for the 9 and 16 node elements, respectively. [1]
However, higher integration orders of 3 and 4 respectively are suggested. [2]
Although it is suggested that a higher integration order through the thickness
may be more effective for elasto-plastic analysis, no significant difference was
noted in a comparison of 2 and 3 integration points through the thickness. For
the sake of economy of computation, 2 point integration through the thickness
was used thereafter. Tables 2 and 3 show the integration orders used in the
. analysis for the various models. A single integration point was used for the
truss elements.
21

3.4.2 Solution of Equations
The Broyden-Fletcher-Goldfarb-Shanno (BFGS) method, which utilizes an
updated stiffness matrix for the equilibrium iterations, was selected (as opposed
to the modified Newton iteration) to solve the equilibrium equations. Due to
its improved convergence characteristics, this is the recommended method when
significant nonlinearities are expected. [1, 2] The convergence criteria were the
default values in ADINA. Hence, only an energy convergence tolerance was
used.
Although some attempts were made at smoothening the calculated response
by tightening the convergence tolerances, greater success was obtained by
reducing the load increment. This is likely due to the history dependence of
the solution because of the elasto-plastic material model used and the local
unloading of the shell elements as a result of the redistribution of load over the
contact area as the dent depth increased.
3.4.3 Development of Analytical Procedure
The analysis of Specimen Pl was the first to be performed, and the first
runs with a reasonable calculated response and correlation with experimental
data were achieved with Model 2. The first requisite for an analysis with
reasonable correlation to the experimental response with Model 2 was the use of
reduced integration orders for the shell elements (2x2 m the in-plane directions
since 9 node shell elements were used). This resulted m a significant reduction
in the stiffness of the response and provided a much improved agreement with
the experimental response as discussed in Sec. 3.4.1.
In order to more closely model the application of a distributed load over
the relatively coarse mesh of Model 2 in the region of the indentation,
22

quad-linear stress-strain relationships for the truss elements were used. That is,
two transitions between essentially zero and infinite modulus of elasticity were
used causing each truss element to gradually stiffen as the indentation spread
circumferentially from one nodal point to the next. However, determination of
the specific values of stress and strain at the transitions for each truss element
(5 sets) that would result in a reasonably smooth calculated response proved to
be a trial and error process requiring considerable effort from the analyst as
well as significant computational resources.
Initial attempts at analyzing the indentation of Specimen P2 with Model 2
were abandoned as it was realized that the same trial and error process would
have to be repeated. This prompted the development of Model 4 with a much
finer mesh in the dented area allowing the use of a single · transition in the
stress-strain relationships for the truss elements which could be predetermined
from the geometry of the model (See Sec. 3.2.1).
The analysis of Specimen IIICI was also performed with Model 4. For
this analysis it was found that use of higher integration orders ( 4x4 in the in
plane directions) gave slightly better agreement with the experimental data.
However, the difference in the responses calculated with reduced and higher
integration orders was not as significant as with Model 2 due to the finer mesh
of Model 4.
Model 8 was used in the analysis of Specimens IBII and IIAII in order to
accommodate their larger dent depths. Although this model produced results
which correlated well with the experimental response overall, the slightly coarser
mesh of Model 8 is reflected in the lack of smoothness of the calculated
response.
23

3.5 Results of Analysis
The analytical results are presented as comparisons of the calculated and
experimental load vs. dent depth responses. In each case, the response is shown
in non-dimensionalized form, the load being expressed as a fraction of the
magnitude of a concentrated load at midspan which would produce a plastic
moment according to simple beam theory, and the dent depth is given as a
percentage of the diameter. All pertinent information related to the
computation, such as the specimen analyzed, number of load increments,
integration order for the shell elements, and the model used is given in Table 3.
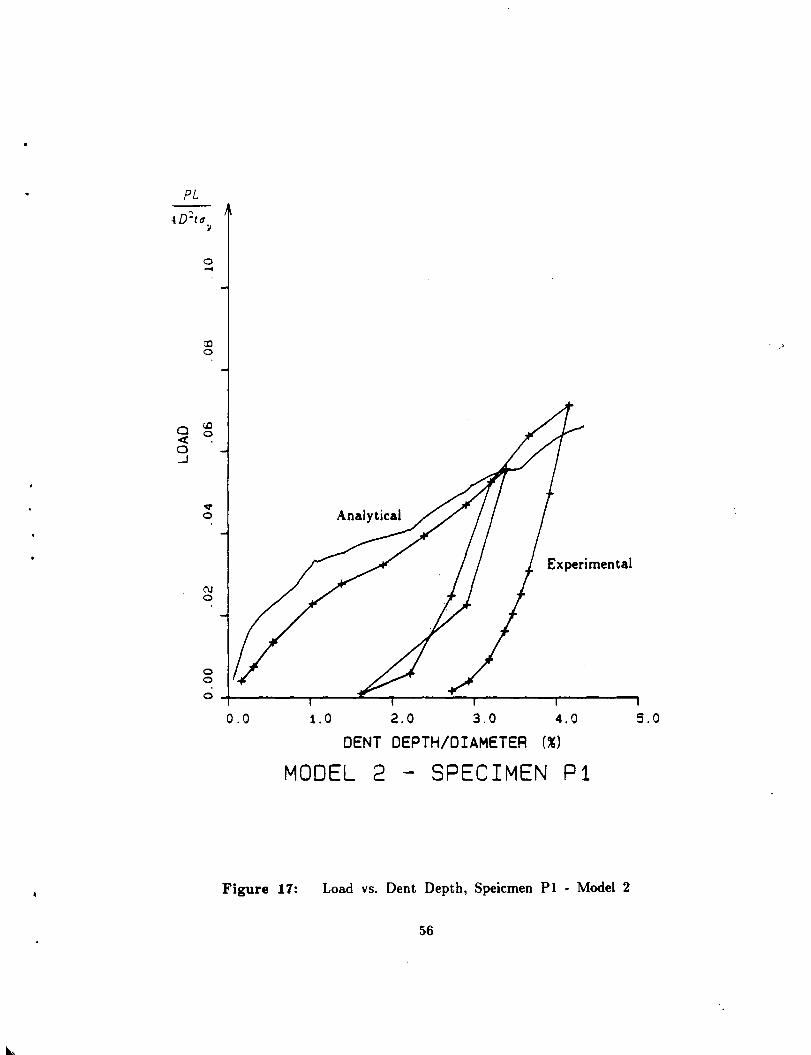
The load vs. dent depth response for Specimen P1 calculated with Model 2
IS shown in Fig. 17 along with the experimental response. The results of the
analysis of Specimens P1 and P2 with Model 4 and their experimental response
are shown in Figs. 19 and 18. The analytical and experimental response of
Specimen IIICI is shown in Fig. 20. Figures 21 and 22 show the responses of
Specimens IBII and IIAII from the analysis with Model 8.
3.6 Discussion
The validity of the finite element analysis was verified by comparison of
the calculated response with the experimental. The correlation with the
experimental data from the two large-diameter, fabricated specimens was not as
good as was obtained for the smaller, manufactured specimens which had been
stress relieved. Specifically, the calculated response was initially much stiffer
than the experimental for the fabricated specimens as shown in Figs. 17, 18,
and 19. An implication is that residual stresses which are not taken into
account in the finite element analysis but are present in the fabricated
specimens have a softening effect on the indentation response. The residual
24

stresses due to cold-rolling were assumed to be significant and an investigation
of their effect was made. The results are discussed in Chap. 4.
The effect of the number of integration points used in the calculation of
the shell element stiffness matrices also seemed to have a significant effect for
the responses calculated with Model 2. However, the effect of integration orders
on the response calculated with Model 4, which has a much finer mesh, was not
nearly as great. This supports the reasoning that the inaccuracy resulting from
reduced integration orders may offset the excessive stiffness inherent in a coarse
mesh as discussed in Sec. 3.4.1.
3. 7 Computational Cost
The computational work was executed on a Control Data Corporation
Cyber 180 Model 850 computer running the NOS and NOS/VE operating
systems. For the most part, the NOS/VE operating system was used because it
was more economical than the NOS operating system. Two benchmark jobs
were run to compare costs under the two operating systems. In each case the
run under the NOS/VE operating system showed a cost savings in CPU time of
better than 40%.
The cost of each analysis in terms of CPU time varied with each of the
three models. It was also sharply dependent on the integration order used with
the shell elements, but otherwise was generally consistent in terms of CPU time
per load step for each model. Computational times listed in Table 2 are
representative values for the runs made with each model.
Cost for each run varied considerably. At the high extreme, CPU time
per load increment for Model 8 with reduced integration orders averaged 57
seconds and over 300 load increments were used in the analysis of a dent depth
25

equal to 10% of the diameter. This required several hours of CPU time for a
single load-deformation relationship. More typically, 150 to 200 load increments
were used with 12 to 36 CPU seconds per increment. The obvious conclusion is
that considerable computational resources are required to conduct such a finite
element analysis.
26

Chapter 4
Effect of Residual Stresses
The much improved correlation between the results of the finite element
analysis (which does not include consideration of residual stresses) and the
experimental data on the manufactured, stress relieved specimens (Specimens
IBII, IIAII, and IIICI) in comparison with the fabricated specimens (Specimens
PI and P2) prompted the investigation into the effects of residual stresses on
the indentation behavior.
To gain an appreciation of the phenomenon, the formation of a circular
rmg from a straight bar was analyzed since the residual stresses that develop
are analogous to the rolling residual stresses in a fabricated tube. The analogy
was extended to the indentation of a tube by considering the flattening of a
segment of the ring. The results showed that the residual stresses in a rmg
had a significant effect on the moment required to flatten a segment of the
rmg.
4.1 Residual Stresses in a Circular Ring
As a first step in determining the effect of residual stress on the
indentation behavior, the magnitude and pattern of residual stresses in a rmg
resulting from cold-bending were determined. This was readily done considering
elastic-perfectly plastic material property and a rectangular cross section. An
equation for the initial curvature, 4>., required to produce a ring with a final I
curvature 4> (equal to the reciprocal of the radius, ~) is given by;
{4.1}
27

where
t = the wall thickness
D the diameter of the nng
t the yield strain of the material y
ci> = the yield curvature = y
2£ y
An explicit solution for <Pi 1s somewhat difficult to obtain. However, it is
possible to make a very good approximation considering that the difference
between the initial and final curvatures is equal to 1.5 times the yield curvature
1.e., 1
cl>.--=1.5<P. ' R y
t This approximation is very good for values of i""" ;::: 2.0
y
due to the asymptotic nature of the moment-curvature relationship for elastic-
perfectly plastic materials. This lower bound for the approximation translates
to Dtc 2:. 2.0, which, for even moderately high str-ength steels, say £Y:::::: 0.0025, is y
D satisfied for - ratios up to 200. With this approximation, which IS valid for
t
the range of !!. ratios and yield strains typically encountered m offshore t
structures, Eq. (4.1) simplifies to
or
<Pi <P 3 -= -+-<P <P 2
y y
1 3 £y
<P.=-+-' R t
(4.2)
(4.3)
which gives the maximum required curvature in terms of the thickness, yield
strain, and the final radius, R. Since the final curvature is equal to ~, and the
3 (
linearly elastic relaxation curvature must be __!!_, the residual stress distribution t
is as shown in Fig. 23. The residual stress at the outer fiber is equal to 1/2
28

the yield stress and is opposite in direction to the stress due to rolling. The Dl
maximum residual stress, uy ( 1 - 3a ) where a = _Y + 3 € occurs at a distance 2t y
of at from the neutral axis.
It should be noted that these residual stresses are not m self equilibrium
(but only slightly so) due to the approximation made for Eq. ( 4.2) or ( 4.3).
4.2 Effect of Residual Stresses in a Circular Ring
With the residual stress distribution for the cold-rolling process known, it
IS possible to determine the moment required to flatten (return to zero
curvature) a segment of the ring by superimposing the stress distribution due to
the change in curvature onto the residual stresses. The elastic moment required
is directly proportional to the change in curvature. The results of this
superposition are shown in Fig. 24.
A comparison of the stresses resulting from flattening a segment of a
circular ring with and without residual stresses indicates a reduction in the
moment in the flattened region when residual stresses are present. The
reduction calculated for a ring having the same radius, thickness, and material
properties as Specimen PI was 21.1% and 22.1% for P2.
Although these calculations are only an approximate attempt to quantify
the effect of residual stresses due to cold-rolling plate into tubular members,
they support the contention that the residual stresses lead to a significant
reduction 10 the load required to produce an indentation and in the energy
dissipated 10 the process.
29

4.3 Limited Range of Effect
The load vs. dent-depth relationships for the two fabricated specimens, Pl
and P2, shown in Figs. 18 and 19 indicate that, in the initial stages of
indentation, the response calculated by ADINA 1s much stiffer than the
experimental response. However, the calculated and experimental curves seem to
roughly parallel each other for some distance beyond this initial range.
The limited extent of the range for which the calculated response 1s stiffer
than the experimental response is a consequence of the local plastification and
unloading that occur during deformation. This plastification and unloading have
a mitigating effect on the residual stresses due to cold-rolling since this process
results in the formation of its own residual stresses. An assumed deformation
model and observed deformations are used to demonstrate that the effect of
residual stresses due to cold-rolling is limited to the initial stages of indentation.
4.3.1 Plastification and Residual Stresses Due to Indentation
A simple model of the deformation of a cross section of a tube subjected
to indentation 1s shown m Fig. 26. The indentation results in local
plastification followed by unloading as the localized area of plastification or
plastic hinge migrates through a given point in the deformation process. As a
result, residual stresses are formed m a manner similar to that resulting from
cold-rolling during fabrication and have a similar effect. However, it appears
from the comparison of the analytical and experimental results that the effect is
not realized until some finite deformation occurs.
Wierzbicki and Suh presented· an analytical method for analyzing the
denting of tubes under combined loading. [15] Their method involves the
analysis of a simplified shell model consisting of a series of rings and
30

longitudinal strips. The deformation assumed for the ring elements is used here
to show that the effect of residual stresses due to cold-rolling is mitigated in
the deformation process. A deformed ring was assumed to be divided into four
segments of constant curvature separated by moving hinges as shown in Fig. 25.
Although this deformation is not consistent with indentation due to lateral
loading, it does approximate observed deformations.
The shape of the deformed ring for a given dent depth, d, is a function of
three parameters, RI, R2, and fJ defined in Fig. 25. From the assumed
geometry and the assumption of inextensibility of the rmg in the circumferential
direction, the following two equations are obtained:
(4.4)
(4.5)
Since one more equation is needed to define the assumed geometry m terms of
the dent depth, the following relationship was suggested:
R2 = (:J n R (4.6)
Wierzbicki and Suh further suggest that n=l and that 00
, the initial value of (}
1r
( undeformed geometry), be set to - resulting in the relationship 2
2(} R (4.7)
With this assumed deformation field, the curvature of the segments adjacent to
the flattened portion of the ring increases since R2 decreases with increasing
dent depth. Plastification ensues as the change in curvature in these segments
mcreases beyond the yield curvature I I
(--->4> ). R2 R Y
As the deformation
mcreases, the hinges adjacent to the flattened segment migrate apart, resulting
31
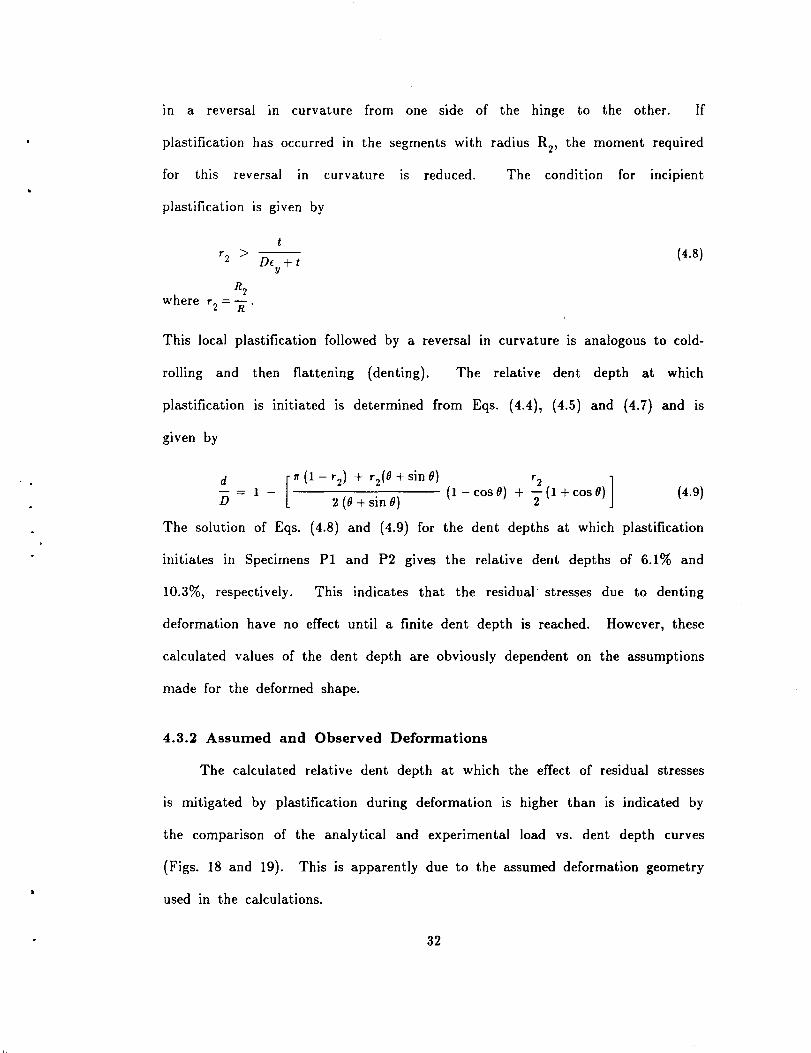
m a reversal in curvature from one side of the hinge to the other. If
plastification has occurred in the segments with radius R2
, the moment required
for this reversal m curvature is reduced. The condition for incipient
plastification is g1 ven by
(4.8)
This local plastification followed by a reversal in curvature is analogous to cold-
rolling and then flattening (denting}. The relative dent depth at which
plastification is initiated is determined from Eqs. ( 4.4}, { 4.5} and ( 4. 7} and is
g1ven by
d [1T(1-r2)+r2(0+sin1J) r2 ]
D - 1 - . (1- cos IJ) + - (1 +cos IJ)
2(1J+sm1J) 2 (4.9)
The solution of Eqs. ( 4.8) and { 4.9) for the dent depths at which plastification
initiates in Specimens P1 and P2 gives the relative dent depths of 6.1% and
10.3%, respectively. This indicates that the residual· stresses due to denting
deformation have no effect until a finite dent depth is reached. However, these
calculated values of the dent depth are obviously dependent on the assumptions
made for the deformed shape.
4.3.2 Assumed and Observed Deformations
The calculated relative dent depth at which the effect of residual stresses
1s mitigated by plastification during deformation is higher than is indicated by
the comparison of the analytical and experimental load vs. dent depth curves
{Figs. 18 and 19}. This is apparently due to the assumed deformation geometry
used in the calculations.
32
Although Wierzbicki and Suh based their assumed deformation on
observation of test specimens and certain analytical considerations, the
deformations observed for Specimens Pl and P2 differed somewhat from this
assumed geometry. The primary difference was m the formation of yield lines
around the flattened section of the tube similar to the idealized dent geometry
shown m Fig. 3. The actual deformation of Pl and P2 resemble the geometry
shown m Fig. 3 rather than the cross sectional geometry of Wierzbicki and
Suh's model shown in Fig. 25. This is likely due to the relatively high D/t
ratios of these two specimens. A deformation model of a ring with migrating
plastic hinges based on the geometry shown in Section A-A of Fig. 3 is shown
in Fig. 26. The two plastic hinges migrate apart as the dent depth and the
length of the flattened segment of the rmg mcrease. The effect of the
formation of a plastic hinge followed by a reversal in curvature (flattening), as
the plastic hinges migrate, is the same as discussed in Sec. 4.3.1.
According to this deformation model, the formation of the migrating
plastic hinges occurs at infinitesimal dent depth. This means that the effect of
residual stresses due to cold rolling would be immediately nullified. Thus, this
model obviously does not reflect the actual deformation process but does provide
a qualitative indication that the dent depths calculated in Sec. 4.3.1 should be
greater than the actual values. Hence, the dent depth at which the effect of
residual stresses becomes insignificant in the deformation process is somewhat
less than calculated from Eqs. (4.8) and (4.9), especially for tubes with large
Djt ratios.
33

Chapter 5
Summary, Conclusions and
Recommendations
5.1 Introduction and Scope
The investigation of the indentation behavior of tubular members reported
here consisted of experimental and analytical phases.
The experimental phase of the project provided data on the indentation
behavior and energy dissipation of two large-diameter fabricated tubular
specimens. The data together with the results of three tests conducted by
others were compared with the results of the analytical work.
The analytical phase of the project consisted of a finite element analysis of
the indentation problem. The program ADINA was used because of its
capability for performing large displacement materially nonlinear analysis. Some
innovative modeling techniques were employed to simulate the contact of a rigid
indenter with the tube wall.
5.2 Experimental Work
An indentation was introduced into two large-diameter, fabricated tubular
specimens by the application of a lateral load through a rigid indenter. The
load vs. deformation response during indentation was used to calculate the
energy absorption as a function of the dent depth for each spec1men. Both
specimens exhibited similar characteristics in this regard.
34

5.3 Analytical Work
The finite element analysis of the indentation of the test speCimens was
performed with the ADINA program which has the capability for material and
geometric nonlinearities. To further assess the validity of the finite element
modeling over a broader range of tube geometries and materials, the analysis
was extended to include the indentation of three additional specimens from
Reference [12]. In contrast to the two test specimens of the current program,
these small-scale specimens were manufactured stress relieved tubes.
The finite element model consisted of an assemblage of shell elements to
model the tube and a set of truss elements to simulate the application of a
lateral load through a rigid indenter. Due to the high degree of nonlinearity
inherent in the problem as a result of large deformations, plastification, and the
nature of the loading, the incremental analysis had to be performed with a large
number of load steps.
The correlation of the analytical and experimental results was significantly
better for the manufactured stress relieved specimens than for the fabricated
specimens. This prompted the investigation of the effect of residual stresses due
to cold-rolling. The results of the investigation confirmed the discrepancies in
the behavior of the fabricated and manufactured specimens.
5.4 Conclusions
The finite element method, specifically, the commercially available general
analysis programs, can be used for predicting the elastic-plastic large-deformation
response of tubular members subjected to concentrated lateral loads.
However, the finite element analysis of a nonlinear system is not always a
well defined or direct process. The modeling of the physical problem may not
35

be straightforward; it may requue innovative techniques or may only be an
approximation due to the limitations of the computer program. Both of these
situations were encountered in the analytical work in modeling the contact with
a rigid indenter. Furthermore, several other factors can affect the results of the
analysis. These can be the types of elements used and the discretization of the
model to variations in the way the governing equations are formed and solved
within the program. To determine the effect of these factors on the results, the
analyst may have no alternative other than to perform further analyses with a
rediscretized mesh or modified computational parameters. Obviously, this can
be an expensive process, in terms of both time and computational resouices.
In view of the above considerations and of the results of this investigation,
acceptance of the analysis should be contingent on an investigation of the
ramifications of the modeling and the assumptions made in the analysis.
Ideally, the analyst should have some empirical evidence with which to correlate
the solution. Specifically, the results of this investigation indicate that the
indentation behavior of full scale fabricated tubular members may vary
significantly from the behavior predicted by a finite element analysis. This is
due, at least in part, to residual stresses in the fabricated members.
Since it has been shown that residual stresses can have a fairly significant
effect on the indentation response, some consideration should also be given to
the application of experimental results obtained from stress relieved specimens to
the behavior of fabricated structures.
36
5.5 Recommendations for Future Work
In order to develop a more complete understanding of the indentation
behavior of tubulars, research is needed to generate a more complete set of
data. Simplified procedures for determining the indentation behavior could then
be developed from this database. Experimental work, particularly full scale
testing is suggested in conjunction with analytical methods. An effort should
also be made to quantify the effects of residual stresses or incorporate them into
the analytical methods.
In light of the results of this investigation it is recommended that results,
whether obtained through numerical methods, simplified analytical treatment, or
experimentation, be correlated with full scale testing. Specifically, more
indentation tests are needed on specimens fabricated by cold-rolling and welding
and thus having residual stresses which are typical for real structures.
37

Tables
38

Table 1: Specimen Data
Spec. F Dimensions Dent Depth ys No. OD t L D/t 1/r d d/D
------------------------------------------------------------------------------------------------------------------(MPa) (m) (mm) (m) (mm) (%)
PI 203.8 1.02 6.73 2.44 I50.7 6.80 28 2.7 P2 203.8 1.53 6.73 2.I3 226.5 3.96 85 5.5
IBII 230 O.I25 2.5I 3.5 49.9 79.I I2.5 IO.O II Ail 35I O.I6I 2.52 3.5 63.6 61.8 I6.I 10.0 IIICI 472 0.250 6.02 3.5 41.6 39.5 I2.6 5.0
------------------------------------------------------------------------------------------------------------------
PI P2
IBII II Ail IIICI
Model
2 2 2 4
4 8
(ksi) (in.) (in.) (in.) (in.) (%)
29.56 40.2 0.265 96.0 I50.7 6.80 I. I 2.7 29.56 60.3 0.265 84.0 226.5 3.96 3.3 5.5
33.4 4.93 0.099 I38 49.9 79.I 0.492 IO.O 50.9 6.3I 0.099 I38 63.6 61.8 0.633 IO.O 68.5 9.86 0.237 I38 41.6 39.5 0.496 5.0
Table 2: Computational Cost
Shell Element Integration Order In-Plane Through Thickness
2 2 3 3 4 3
39
3 2 3 2 2 2
CPU time/Load Step (sec.)
I6 I2 27 36 66 57

Table 3: Details of Analytical Models
Specimen Analytical Shell Element Number of Load Model No. Integration Order Increments
Load vs. Dent Depth Response
------------------------------------------------------------------------------------------------------------------PI 2 2x2x3 144 Fig. 17 PI 4 3x3x2 144 Fig. 18 P2 4 3x3x2 172 Fig. 19
IIICI 4 4x4x2 172 Fig. 20 IBII 8 3x3x2 332 Fig. 21 IIAII 8 3x3x2 302 Fig. 22
40

Figures
41

I
~\~ J
Figure 1: ~ et-up fo r Indentation of Specimen Pl
Figure 2: Indentation of Specimen P2
42

B r
Section A-A
I
1
Section B-8
Figure 3: Schematic Representation of Ideal Dent Geometry
43
Dial Gages
Jock a Load Cell
Internal Bracing
Testing Machine Head -
Dimensions in mm
Figure 4: Schematic Representation of Test Set-up for Indentation
44

PL
0 ....
ID 0
0 CD < 0 0 .J
C\1 0
0 0
0 ~------~----~--r-----~~------~------~ 0.00 1.00 2.00 3.00 4.00 5.00
DENT DEPTH/DIAMETER (%)
SPECIMEN P1
Figure 5: Experimental Load vs. Dent Depth Curve for Specimen PI
45

PL
tn 0
0 (T) < 0 a ~
C\J 0
.... 0
0 0
0 1--------r------~------~--------~----~ 0.00 2.00 4.00 6.00 8.00 10.00
DENT DEPTH/DIAMETER (%)
SPECIMEN P2
Figure 6: Experimental Load vs. Dent Depth Curve for Specimen P2
46

-2:
* z -c UJ en a: 0 en en c(
>-(!) a: UJ z UJ
...J c( .... 0 ....
0 ... )( 0
It) ...
It) . C\1 ...
0 . 0 ...
It)
"
0 . It)
It) . C\1
0
.0 2.0 ... o 6.0 8.0 10.0X10 1
DENT DEPTH (MM)
ENERGY ABSORPTION
Figure 7: Energy Absorption vs. Dent Depth for Specimens PI and P2
47

Figure 8: Finite Element Model for Tube Indentation
48

(f
E
'
Figure 9: Typical Stress-Strain Relationship for Stiffening Truss Element
Figure 10: Geometry to Determine t8 •
49

Longitudinal
I I I
I
l
1f
-D 9
II -D 9
II -D 9
II -D 18
II -D 18
II -D 36 II -D 36
Pl ~1~L __________ 2_4 ________ -?~L~ _____ l2----~~~<--6~~~<~3~1~L_3~~~<~(i_n~.) 610 305 152 76 76 (mm)
Figure 11: Dimensions for Discretization of Model 2
50

24 Pl ... A
610
21 P2 ..j< 533
7.80 mc1 :.1" 198
Figure 12:
Longitudinal
15 ... "1 381
"" 12 ,
305
..jc 4.72
120
7r
-D 6
7r
-D 6
1r -D 12
1r eo-o
72
3 3 3 {in.) >\* 76;-76 q 76~· (mm)
.,. 3 '- 3 .,. 3 .. (in.) "I 76 "1 76"' 76 ~ (nun)
.94~ .94 .94"' (in.) """' 24'" 24 •I" 24 (mm)
Dimensions for Discretization of Model 4
51
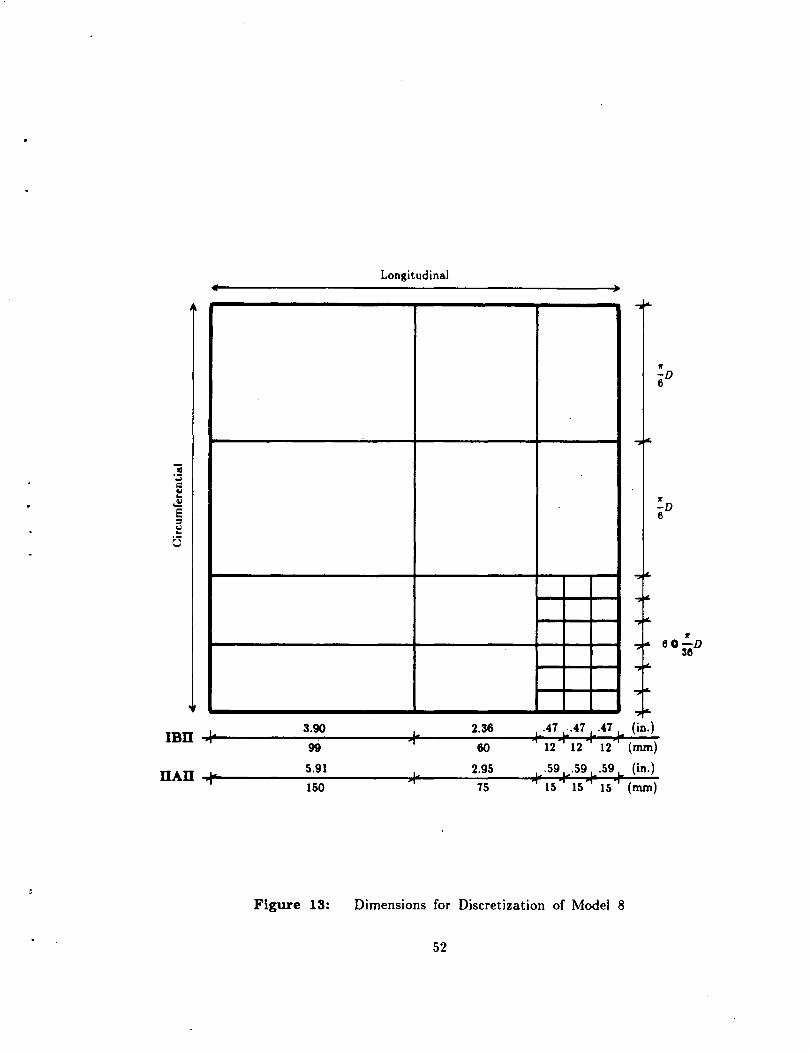
IBn L 3.90
"' 99
nAn ~ 5.91
"1 150
Figure 13:
Longitudinal
L 2.36 .47 .47 ~ .47 I" (in.) ., ~ I.. 1
60 12"' 12 12> (mm)
,j· 2.95 , .59 ._.59 ~,..59 L. (in.)
75 >I 15"' 15"' 15 >r (mm)
Dimensions for Discretization of Model 8
52
lr -D 6
lr -D 6
lr 60-D
36

Figure 14: Discretization of Tube - Model 2
53

Figure 15: Discretization of Tube - Model 4
54

Figure 16: Discretization of Tube - Model 8
55
<Il 0
a !.0 <( 0
0 ..J
ru 0
0 0
Experimental
0 ~-------r--~~-T----~~------~~----~ 0.0 1.0 2.0 3.0 4.0 5.0
DENT DEPTH/DIAMETER (%)
MODEL 2 - SPECIMEN P1
Figure 17: Load vs. Dent Depth, Speicmen Pl - Model 2
56
. ·'

Cl < 0 ~
0 ....
CD 0
c.o 0
~ 0
C\1 0
0 0
Analytical
0 ~------~--~~~----~~------~~----~ 0.0 1.0 2.0 3.0 4.0 5.0
DENT DEPTH/DIAMETER (%)
MODEL 4 - SPECIMEN P1
Figure_ 18: Load vs. Dent Depth, Speicmen Pl - Model 4
57

PL
Cl (1')
< 0 Analytical 0 ..J
ru 0
0 0
Experim~ntal
0 ~-------r-------T------~--------~----~ 0.0 2.0 4.0 6.0 8.0 10.0
DENT DEPTH/DIAMETER (%)
MODEL 4 - SPECIMEN P2
Figure 19: Load vs. Dent Depth, Speicmen P2 - Model 4
58

PL
0 0
0 ID
0 0 < ..0 0 _J
0 "J
0 0
Experimental
0 ~------~------~------~------~~----~ 0.0 2.0 4.0 6.0 8.0 10.0
DENT DEPTH/DIAMETER (%)
MODEL 4 - SPECIMEN IIICI
Figure 20: Load vs. Dent Depth, Speicmen IIICI - Model 4
59

0 0
ru
a o < r"'J
0 .... ..J Analytical
0 .o
Experimental
0 ~--------------~------~------~~----~ 0.0 4.0 8.0 12.0 16.0
DENT DEPTH/DIAMETER (%)
MODEL 8 - SPECIMEN IBII
Figure 21: Load vs. Dent Depth, Speicmen IBII - Model 8
60
20.0

PL
0 'D
a o < ,!J
0 ~
0 1"\/
0 0
Experimental
Analytical
0 ~------~------~------~------~~----~ 0.0 4.0 8.0 12.0 16.0 20.0
DENT DEPTH/DIAMETER (%)
MODEL 8 - SPECIMEN IIAII
Figure 22: Load vs. Dent Depth, Speicmen IIAII - Model 8
61

Figure 23:
t-1 I
-2
-2
-3
-3
(f II rr ( 1- 3a)
!I
=tat +at
Residual Stresses Through Thickness Due to Cold-Rolling
-6
t
3
._
t -2
Figure 24:
........ .......... ._ ~ - -
~ ........ ._
:.........
tat ~ at ~
Stress Distribution after Flattening
62

Figure 25: Assumed Deformation of a Ring (From Reference [15])
-- ......... migrating plastic hinge
Figure 26: Deformation of a Ring from Idealized Dent Geometry
63
0 0 0 0 0 0
0 0 0 0 0 0
0 0 0 0 0 0
0 0 0 0 0 0
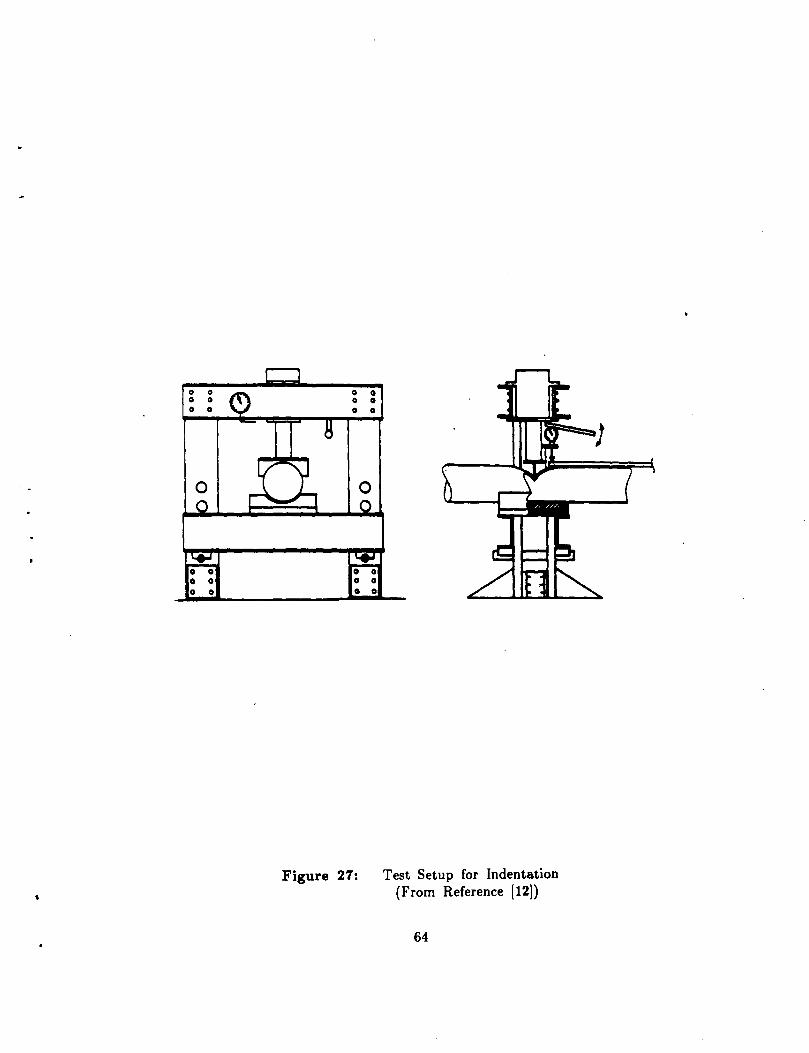
Figure 27: Test Setup for Indentation (From Reference [121)
64

References .
[1] ADINA User's Manual Report AE 81-1 edition, ADINA Engineering, Inc., 71 Elton Ave.,
Watertown, Mass. 02172, 1981.
[2] ADINA System Theory and Modeling Guide Report AE 83-4 edition, ADINA Engineering, Inc., 71 Elton Ave.,
Watertown, Mass. 02172, 1983.
[3] Bathe, K.J. Finite Element Procedures m Engineering Analysis. Prentice-Hall, Inc., 1982.
[4] Cook, R.D. Concepts and Applications of Finite Element Analysis. John Wiley & Sons, New York, 1981.
[5] Ellinas, C.P., and Valsgard, S. Collision and Damage of Offshore Structures: A State-of-the-Art. In Proceedings of the Fourth International Offshore Mechanics and Arctic
Engineering Symposium, Vol. 2, pages 475-495. American Society of Mechanical Engineers, New York, February, 1985.
(Symposium held in Dallas, TX, on February 17-21, 1985).
[6] Grimm, D.F ., and Ostapenko, A. Local Buckling of Steel Tubular Columns. In Proceedings, pages 25-28. Structural Stability Research Council,
Bethlehem, P A, 1982.
[7] Hypponen, P. and Raiko, H. Experiences in Nonlinear Shell Analysis Using Adina. Computers and Structures 17(5-6):649-652, 1983.
[8] Ostapenko, A., and Grimm, D.F. Local Buckling of Cylindrical Tubular Columns Made of A-96 Steel. Fritz Engineering Laboratory Report No. 450.7, Lehigh University,
Bethlehem, P A, February, 1980.
[9] Padula, J.A., and Ostapenko, A. Indentation and Axial Tests of Two Large-Diameter Tubular Columns. Fritz Engineering Laboratory Report No. 508.5, Lehigh University,
Bethlehem, PA, February, 1987.
[10] Sherman, D.R. Tests of Circular Steel Tubes in Bending. Journal of the Structural Division, ASCE 102(ST11, Paper
12568):2181-2195, November, 1976.
65

[11] Soares, C.G., and Soreide, T.H. Plastic Analysis of Laterally Loaded Circular Tubes. Journal of Structural Engineering, ASCE 109{2):451-467, February, 1983.
[12] Taby, J., and Rashed, S.M.H. Experimental Investigation of the Behaviour of Damaged Tubular Members. Technical Report MK/R92, Department of Naval Architecture and Marine
Engineering, The Norwegian Institute of Technology, Trondheim, Norway, 1980.
[13] Taby, J., and Moan, T. Collapse and Residual Strength of Damaged Tubular Members. Behaviour of Offshore Structures. Elsevier Science Publishers B.V., Amsterdam, 1985, pages 395-408.
[14] Thomas, S.G., Reid, S.R., and Johnson, W. Large Deformations of Thin- Walled Circular Tubes under Transverse
Loading-I. International Journal of Mechanical Sciences 18(6):325-333, June, 1976.
[15] Wierzbicki, T., and Suh, M.S. Denting Analysis of Tubes Under Combined Loading. Technical Report MITSG 86-5, MIT Sea Grant College Program,
Massachusetts Institute of Technology, 77 Massachusetts Ave., Cambridge, MA 02139, March, 1986.
NA84AA-D-0046 R/0-19.
[16] Wierzbicki, T., and Bhat, S.U. A Moving Hinge Solution for Axisymmetric Crushing of Tubes. International Journal of Mechanical Sciences 28(3):135-151, 1986.
66

Appendix A
Experimental Work by Others
Experimental data reported by other researchers was used to assess the
validity of the finite element analysis. Specifically, the indentation behavior of
three specimens selected from Reference [12] (Specimens IIICI, IBII, and IIAII)
was analyzed and the results compared to the experimental data. The
experimental work on these three specimens is described here since the details
are relevant to understanding the conclusions drawn from the analytical work.
A.l Scope
The experimental work described in Reference [12] was part of a study to
form the basis of a simplified analytical method for determining the residual
strength of dented tubular columns. This work included indentation and axial
load tests of 24 tubular members. Experimental load vs. dent depth curves
were presented for the 24 specimens as well as a comparison of the theoretical
and experimental axial strengths of the dented specimens.
A.2 Description of Test Specimens
The test specimens were cold-drawn manufactured seamless tubes which
were heat treated to relieve residual stresses from the manufacturing process and
improve ductility.*" The heat treatment consisted of heating to 550 ° C
(1020 oF) for one hour followed by slow cooling.
The specimen geometries were representative of a 1:4 scaling of members
•• Pertinent information, including geometric data and material properties of the three specimens
analyzed, is listed in Table 1.
67

•
commonly found in offshore structures. The D jt ratios of the specimens varied
from 40 to 64 with diameters ranging from 125 to 250 mm (5 to 10 in.). All
specimens had a length of 3500 mm (138 in.). The dent depth of the
specimens ranged from 2% to 20% of the diameter.
A.3 Indentation of Specimens
The method of indentation of the specimens was different from that used
for Specimens P1 and P2. The objective of the indentation process was to
produce specimens without overall bending deformations so that the effect of
indentations could be isolated. To accomplish this, the tubes were supported m
a wooden cradle directly below the indenter as shown in Fig. 27. The denting
force was transmitted to the tube through a "knife edge" (5 mm radius)
indenter. During indentation, the dent depth and the load, provided by a
hydraulic jack, were measured with a dial gage and manometer, respectively.
Although not indicated on the load vs. dent depth curves presented in the
reference, the specimens required multiple load cycles to produce the desired
dent depths.
The type of support and the "knife edge". loading were the principal
considerations in modeling these specimens for the finite element analysis .
68

•
•
•
...
D
d
L
R
t
<I>
(J
(J
Appendix B
Nomenclature
Diameter
Dent depth
Length
Radius
Radii as defined in Fig. 25
R2 Nondimensionalized Radius =
R
Thickness D£
Coefficient y
=- + 3£ 2 t y
Gap Distance between indenter and tube wall
Strain (engineering)
Yield Strain
Curvature
Yield Curvature
Stress
Yield Stress
2£ y
Angle as defined m Fig. 25
69
•
•
•
•
'
Vita
Joseph A. Padula is the son of Helen and Joseph A. Padula and was born
on March 8, 1955 in San Diego, California .
He graduated from Lake Taylor Senior High School in Norfolk, Virginia in
1971. His undergraduate studies were taken at Virginia Polytechnic Institute
and State University, Blacksburg, Virginia and at Old Dominion University in
Norfolk, Virginia. In 1985, he was awarded the Bachelor of Science in Civil
Engineering from Old Dominion University. Graduate studies were undertaken
in the fall of 1985 in the Department of Civil Engineering at Lehigh University
where he has been a teaching and research assistant .
70