Embed Size (px)
Citation preview
Information Note
Policy support to the recycling industry in selected places Research Office
Legislative Council Secretariat
IN12/18-19 1. Introduction 1.1 The global recovery rate of paper waste has improved noticeably from 47% in 2000 to 59% in 2015, and that of plastic waste from 9% in 2000 to 21% in 2017.1 That said, despite government subsidy, global waste recycling is still far from a commercially sustainable business, mainly due to high production cost and low market demand for recycled products. As such, broadly around one-third of these two streams of collected recyclables was then sent to other places (predominantly China) for further processing, making local recycling rates even lower.2 Most recently, the global recycling industry has been facing a severe setback upon imposition of a stringent import requirement of solid waste in China in 2018.3 Reportedly, imports of paper waste and plastic waste to China slumped by 34% and 99% respectively in 2018, resulting in plunging prices of global recyclables, closures of smaller recyclers and waste stockpiles in many cities.4 Although some new measures have been introduced to minimize solid waste and support recyclers, it still takes time to develop a sustainable model on waste recycling. 1.2 In Hong Kong, although 46% of paper waste and 13% of plastic waste were "recovered" in 2017, almost all of them were subsequently exported to the Mainland. Local recyclers have been acting more like "waste collectors
1 Paper waste and plastic waste are two major categories of municipal solid waste ("MSW") in the
world, with a share of 17% and 12% respectively in 2016. More updated recovery rate for paper waste in 2017 is not available yet. See World Bank (2018), International Council of Forest and Paper Associations (2017) and Geyer et al. (2017).
2 World Bank (2018) and International Trade Centre (2019a and 2019b). 3 In 2017, about half of global trade of paper and plastic waste was sent to China for further
processing. Yet the Chinese government banned all imports of solid waste containing more than specified non-target materials with effect from 1 March 2018 to resolve its own pollution problem. This has eliminated a large bulk of existing trade on paper waste and plastic waste from the world.
4 International Trade Centre (2019a and 2019b).
2
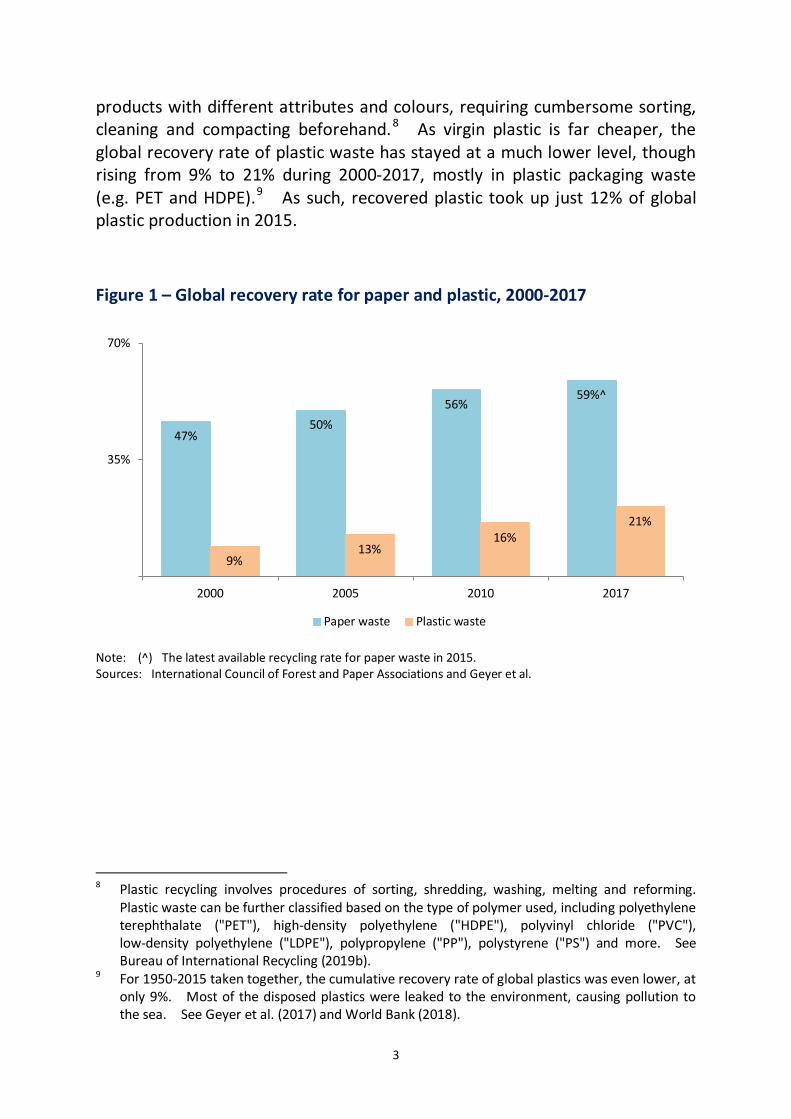
and traders", with just 1% of overall paper waste and plastic waste being locally converted into recycled products. 1.3 At the request of Hon CHU Hoi-dick, the Research Office has studied the specific policy measures introduced in selected places for enhancing business viability of recyclers of paper waste and plastic waste.5 Taiwan and the state of California in the United States ("US") are selected for further study, because (a) they are globally renowned for environmental protection; and (b) both governments have provided support to the local recycling industry for decades. This information note begins with an overview of recent developments in global recycling of the two selected waste streams, along with operational challenges and government response. After an account of recent developments of the recycling industry in Hong Kong, it will discuss the policies for recyclers in the two selected places, along with a comparative table for easy reference (Appendix). 2. Recent global developments of paper and plastic recycling 2.1 In parallel with growing environmental awareness, the recovery rate of overall municipal solid waste ("MSW") in advanced places has increased from 18% in 2000 to 25% in 2016.6 Yet the recovery rate varied significantly across waste streams within MSW, hinging on cost. Taking paper recovery as an illustration, given that the fibre recovered from paper waste is a low-cost and quality substitute to new wood fibre used in paper manufacturing, the global recovery rate of paper waste stood at a higher level, rising from 47% in 2000 to 59% in 2015 (Figure 1).7 Recycled fibre thus accounts for as much as 54% of global fibre demand nowadays. By contrast, plastic recovery is much more costly, because plastic waste comprises a wide range of component
5 As this note focuses on sector-specific policies aiming to enhance business viability of recyclers,
it will not touch upon general waste management policies (e.g. waste charging, mandatory sorting of waste at source, producer responsibility system) which also play a key role in recycling business. Interested readers of these general policies may refer to the two notes published in March and May 2017 respectively. See Legislative Council Secretariat (2017b and 2017c).
6 Organisation for Economic Co-operation and Development (2019a). 7 Paper recycling involves procedures of sorting, baling, shredding, washing, bleaching, pressing
and rolling. In general, paper waste can be recycled for 4-6 times to maintain the strength and quality of fibre by the industry standard. Recovery rate in some countries (e.g. Australia and Japan) could even hit 80% or above. See Bureau of International Recycling (2019a) and International Council of Forest and Paper Associations (2017).
3
products with different attributes and colours, requiring cumbersome sorting, cleaning and compacting beforehand.8 As virgin plastic is far cheaper, the global recovery rate of plastic waste has stayed at a much lower level, though rising from 9% to 21% during 2000-2017, mostly in plastic packaging waste (e.g. PET and HDPE).9 As such, recovered plastic took up just 12% of global plastic production in 2015. Figure 1 – Global recovery rate for paper and plastic, 2000-2017
Note: (^) The latest available recycling rate for paper waste in 2015. Sources: International Council of Forest and Paper Associations and Geyer et al.
8 Plastic recycling involves procedures of sorting, shredding, washing, melting and reforming.
Plastic waste can be further classified based on the type of polymer used, including polyethylene terephthalate ("PET"), high-density polyethylene ("HDPE"), polyvinyl chloride ("PVC"), low-density polyethylene ("LDPE"), polypropylene ("PP"), polystyrene ("PS") and more. See Bureau of International Recycling (2019b).
9 For 1950-2015 taken together, the cumulative recovery rate of global plastics was even lower, at only 9%. Most of the disposed plastics were leaked to the environment, causing pollution to the sea. See Geyer et al. (2017) and World Bank (2018).
47% 50%
56% 59%^
9% 13%
16% 21%
35%
70%
2000 2005 2010 2017
Paper waste Plastic waste
4
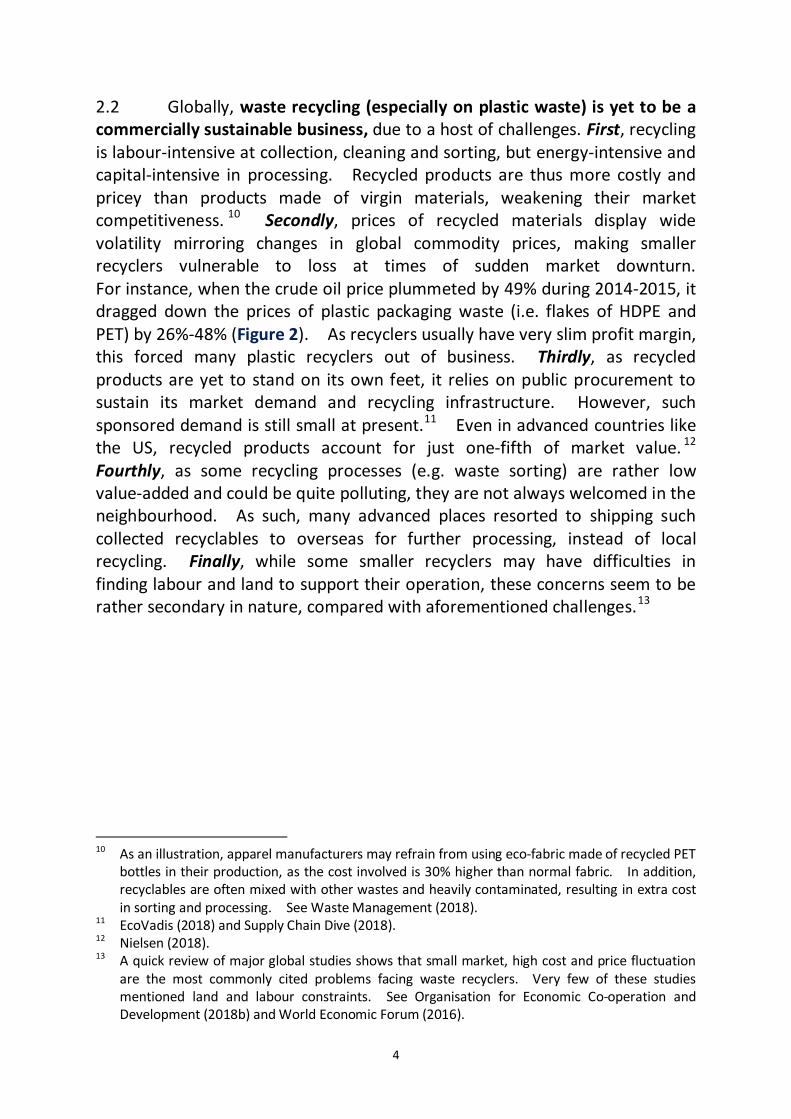
2.2 Globally, waste recycling (especially on plastic waste) is yet to be a commercially sustainable business, due to a host of challenges. First, recycling is labour-intensive at collection, cleaning and sorting, but energy-intensive and capital-intensive in processing. Recycled products are thus more costly and pricey than products made of virgin materials, weakening their market competitiveness. 10 Secondly, prices of recycled materials display wide volatility mirroring changes in global commodity prices, making smaller recyclers vulnerable to loss at times of sudden market downturn. For instance, when the crude oil price plummeted by 49% during 2014-2015, it dragged down the prices of plastic packaging waste (i.e. flakes of HDPE and PET) by 26%-48% (Figure 2). As recyclers usually have very slim profit margin, this forced many plastic recyclers out of business. Thirdly, as recycled products are yet to stand on its own feet, it relies on public procurement to sustain its market demand and recycling infrastructure. However, such sponsored demand is still small at present.11 Even in advanced countries like the US, recycled products account for just one-fifth of market value. 12 Fourthly, as some recycling processes (e.g. waste sorting) are rather low value-added and could be quite polluting, they are not always welcomed in the neighbourhood. As such, many advanced places resorted to shipping such collected recyclables to overseas for further processing, instead of local recycling. Finally, while some smaller recyclers may have difficulties in finding labour and land to support their operation, these concerns seem to be rather secondary in nature, compared with aforementioned challenges.13
10 As an illustration, apparel manufacturers may refrain from using eco-fabric made of recycled PET
bottles in their production, as the cost involved is 30% higher than normal fabric. In addition, recyclables are often mixed with other wastes and heavily contaminated, resulting in extra cost in sorting and processing. See Waste Management (2018).
11 EcoVadis (2018) and Supply Chain Dive (2018). 12 Nielsen (2018). 13 A quick review of major global studies shows that small market, high cost and price fluctuation
are the most commonly cited problems facing waste recyclers. Very few of these studies mentioned land and labour constraints. See Organisation for Economic Co-operation and Development (2018b) and World Economic Forum (2016).
5
Figure 2 – Crude oil price and prices of plastic packaging waste, 2000-2018
Sources: Organization of the Petroleum Exporting Countries and Plastics News.
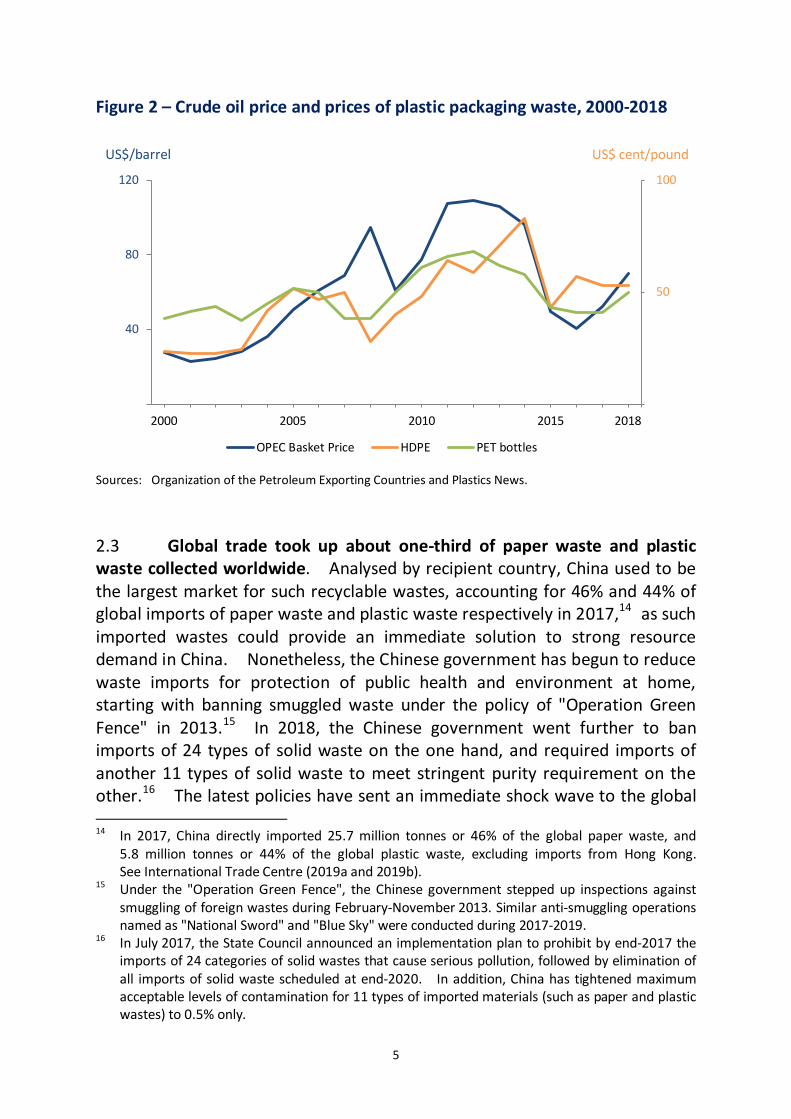
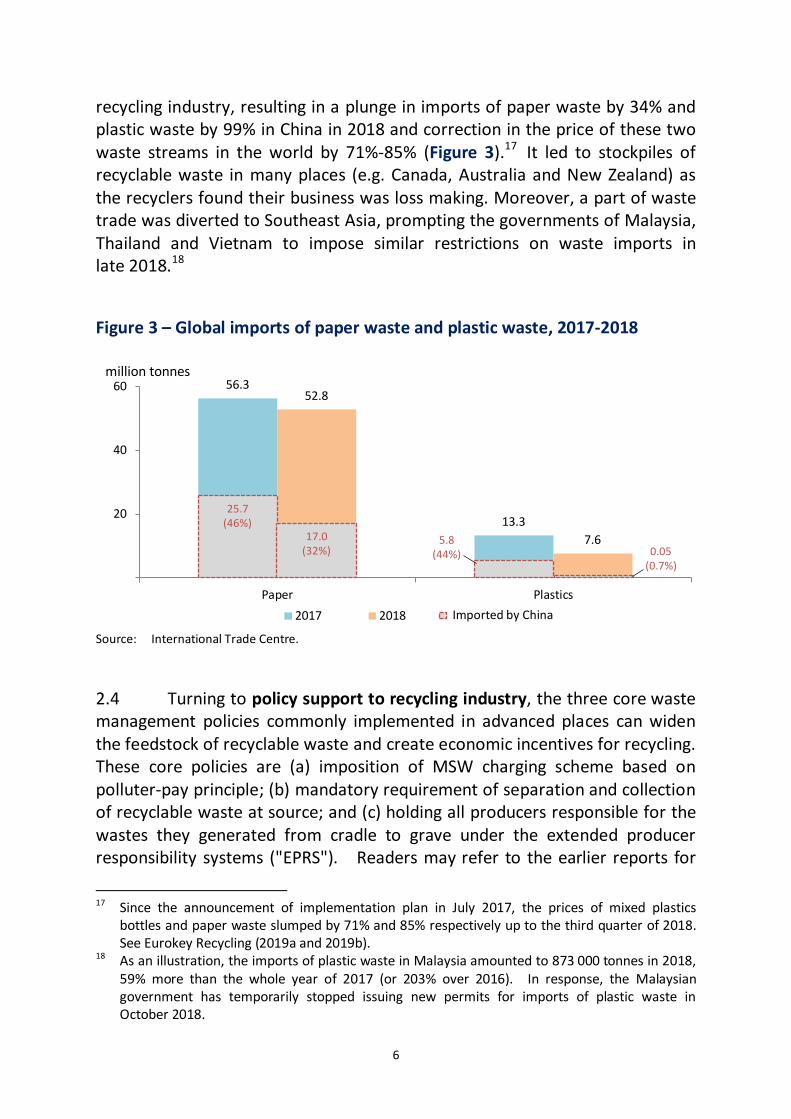
2.3 Global trade took up about one-third of paper waste and plastic waste collected worldwide. Analysed by recipient country, China used to be the largest market for such recyclable wastes, accounting for 46% and 44% of global imports of paper waste and plastic waste respectively in 2017,14 as such imported wastes could provide an immediate solution to strong resource demand in China. Nonetheless, the Chinese government has begun to reduce waste imports for protection of public health and environment at home, starting with banning smuggled waste under the policy of "Operation Green Fence" in 2013.15 In 2018, the Chinese government went further to ban imports of 24 types of solid waste on the one hand, and required imports of another 11 types of solid waste to meet stringent purity requirement on the other.16 The latest policies have sent an immediate shock wave to the global 14 In 2017, China directly imported 25.7 million tonnes or 46% of the global paper waste, and
5.8 million tonnes or 44% of the global plastic waste, excluding imports from Hong Kong. See International Trade Centre (2019a and 2019b).
15 Under the "Operation Green Fence", the Chinese government stepped up inspections against smuggling of foreign wastes during February-November 2013. Similar anti-smuggling operations named as "National Sword" and "Blue Sky" were conducted during 2017-2019.
16 In July 2017, the State Council announced an implementation plan to prohibit by end-2017 the imports of 24 categories of solid wastes that cause serious pollution, followed by elimination of all imports of solid waste scheduled at end-2020. In addition, China has tightened maximum acceptable levels of contamination for 11 types of imported materials (such as paper and plastic wastes) to 0.5% only.
50
100
40
80
120
2000 2005 2010 2015 2018
OPEC Basket Price HDPE PET bottles
US$/barrel US$ cent/pound
6
recycling industry, resulting in a plunge in imports of paper waste by 34% and plastic waste by 99% in China in 2018 and correction in the price of these two waste streams in the world by 71%-85% (Figure 3).17 It led to stockpiles of recyclable waste in many places (e.g. Canada, Australia and New Zealand) as the recyclers found their business was loss making. Moreover, a part of waste trade was diverted to Southeast Asia, prompting the governments of Malaysia, Thailand and Vietnam to impose similar restrictions on waste imports in late 2018.18 Figure 3 – Global imports of paper waste and plastic waste, 2017-2018
Source: International Trade Centre. 2.4 Turning to policy support to recycling industry, the three core waste management policies commonly implemented in advanced places can widen the feedstock of recyclable waste and create economic incentives for recycling. These core policies are (a) imposition of MSW charging scheme based on polluter-pay principle; (b) mandatory requirement of separation and collection of recyclable waste at source; and (c) holding all producers responsible for the wastes they generated from cradle to grave under the extended producer responsibility systems ("EPRS"). Readers may refer to the earlier reports for
17 Since the announcement of implementation plan in July 2017, the prices of mixed plastics
bottles and paper waste slumped by 71% and 85% respectively up to the third quarter of 2018. See Eurokey Recycling (2019a and 2019b).
18 As an illustration, the imports of plastic waste in Malaysia amounted to 873 000 tonnes in 2018, 59% more than the whole year of 2017 (or 203% over 2016). In response, the Malaysian government has temporarily stopped issuing new permits for imports of plastic waste in October 2018.
56.3
13.3
52.8
7.6
20
40
60
Paper Plastics2017 2018 Imported by China
million tonnes
5.8 (44%) 0.05
(0.7%)
25.7 (46%)
17.0 (32%)
7
details of these core policies.19 For those specific measures intending to enhance commercial viability of the recycling industry, they include:
(a) Subsidy on recyclables: Funded by fees collected from producers
under EPRS or by government budget, cash subsidy is granted to the recyclers to improve its profitability, especially so for those waste streams deemed more difficult for collection and recycling. This can provide a revenue buffer for recyclers against fluctuation in prices of recycled products. For instance, subsidy has been offered to offset the recycling costs of 42 packaging and product wastes in South Korea since 2003, resulting in a 62% increase in annual recycling quantity to 1.5 million tonnes during 2002-2012;
(b) Lump-sum grant for upgrading operations: Some governments
provide grants and loans to recyclers through a dedicated fund for acquiring and upgrading recycling facilities. For example, the Singaporean government launched a 3R Fund with a budget of S$8 million (HK$42.7 million) in 2009 to cover up to 80% of the installation costs of recycling facilities or sorting equipment;
(c) Procurement of recyclable products: Green procurement can
enlarge the market for recycled products. For example, the Act on Promoting Green Procurement was enacted in Japan in 2001, requiring state agencies to give priority to recycled products in procurement. According to an United Nation study, about 93% of the surveyed governments have included such public procurement in their policies;20
(d) Land designated for recycling: Some governments have offered
land support to local recyclers, with land lease at discount rate upon meeting certain capital and output requirements. As an illustration, the Singaporean government set up a Sarimbun Recycling Park in 1995 to nurture the local recycling industry. At present, the 13 recycling plants in the Park contribute to 25% of total waste recycled of Singapore; and
(e) More recent policies after the waste ban in China: In face of a
more challenging trade environment in 2018, many governments 19 See footnote (5). 20 United Nations Environment Programme (2017).
8
have adopted measures to minimize waste at source, particularly the plastic waste. For instance, both South Korea and the United Kingdom ("UK") announced that they would phase out certain plastic products in the longer term.21 Yet very few governments announced new recycling initiatives, possibly because they are more costly and indirect. The Japanese government is possibly the rare exception, launching a new financial scheme in March 2018 to provide subsidies of US$15 million (HK$117.6 million) to cover 50% of the cost incurred in building new recycling facilities.
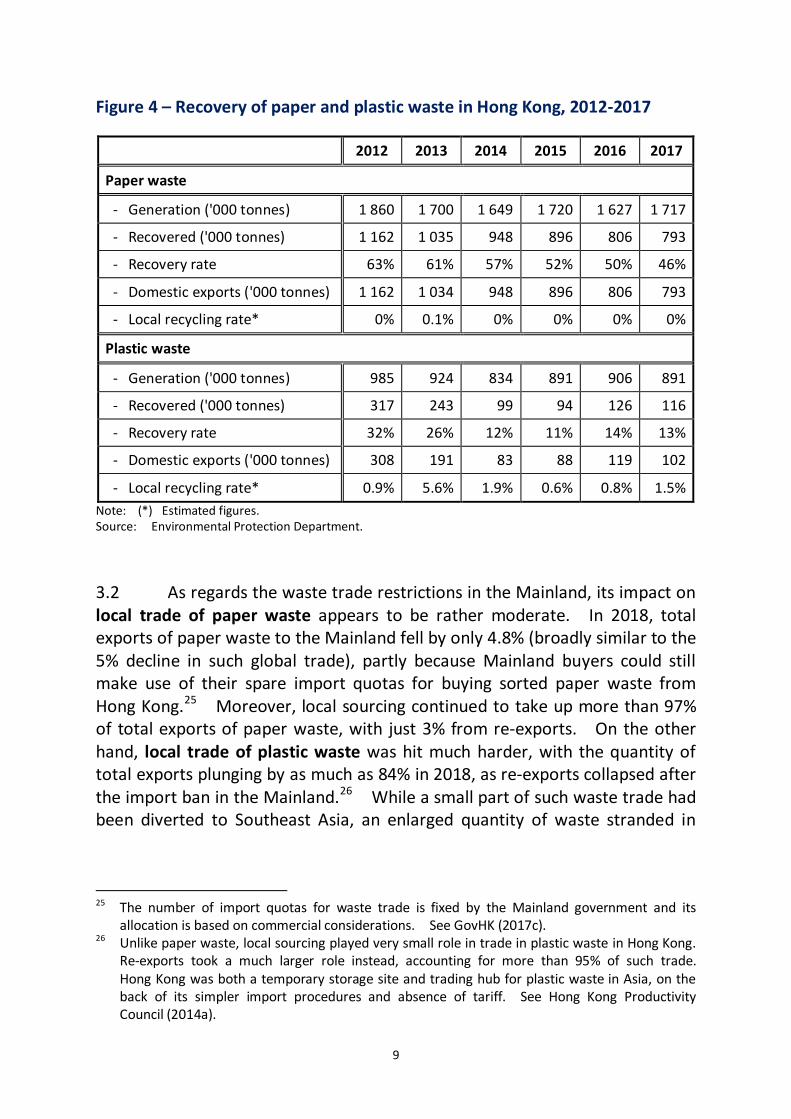
3. Recent developments of paper and plastic recycling in Hong Kong 3.1 According to the Environmental Protection Department ("EPD"), the waste recycling industry is very small in scale in Hong Kong, with some 1 900 firms in 2014.22 Estimated employment was in the region of around 13 000 persons.23 Most of these recyclers are just waste collectors and traders, as almost 100% of paper waste and 88% of plastic waste recovered in Hong Kong were subsequently exported to other places (predominantly the Mainland) for further processing.24 Netting out the trade effect, the local recycling rate of paper waste was virtually nil in 2017, while that for the plastic waste was just 1.5% (Figure 4). 21 In South Korea, the government has announced a series of countermeasures since May 2018 to
reduce generation of plastic waste, such as (a) prohibiting the production of coloured plastic bottles by 2020; (b) phasing out PVC and other products that are hard to be recycled by phases; and (c) banning single-use plastic bags at major supermarkets. Similarly, the UK government also disclosed several policies to achieve target of zero avoidable plastic waste by end-2042 in its 25 Year Environment Plan published in January 2018. They included (a) expanding coverage of existing £0.05 (HK$0.5) charge on plastic bag to all retailers; (b) introducing tax on plastic packaging with less than 30% of recycled content in 2022; and (c) banning distribution and sale of plastic straws, drinks stirrers and cotton buds by late-2020.
22 The updated number of recycling firms was obtained from EPD, based on a survey report conducted in 2015 commissioned by the government for setting up Recycling Fund, taking into account various data sources. In January 2019, there were 302 paper recyclers and 267 plastic recyclers, based on the Hong Kong Collector and Recycler Directory. See Hong Kong Productivity Council (2014b) and Environmental Protection Department (2019a).
23 Estimation based on a range of employment figures provided by EPD. See Hong Kong Productivity Council (2014b).
24 In 2017, Hong Kong exported a total of 794 200 tonnes of paper waste valued at HK$1.34 billion and 1 790 700 tonnes of plastic waste valued at HK$4.41 billion to other places. The Mainland was the largest destination of this waste trade, accounting for 91% and 96% of the respective volume of trade.
9
Figure 4 – Recovery of paper and plastic waste in Hong Kong, 2012-2017
2012 2013 2014 2015 2016 2017
Paper waste
- Generation ('000 tonnes) 1 860 1 700 1 649 1 720 1 627 1 717
- Recovered ('000 tonnes) 1 162 1 035 948 896 806 793
- Recovery rate 63% 61% 57% 52% 50% 46%
- Domestic exports ('000 tonnes) 1 162 1 034 948 896 806 793
- Local recycling rate* 0% 0.1% 0% 0% 0% 0%
Plastic waste
- Generation ('000 tonnes) 985 924 834 891 906 891
- Recovered ('000 tonnes) 317 243 99 94 126 116
- Recovery rate 32% 26% 12% 11% 14% 13%
- Domestic exports ('000 tonnes) 308 191 83 88 119 102
- Local recycling rate* 0.9% 5.6% 1.9% 0.6% 0.8% 1.5% Note: (*) Estimated figures. Source: Environmental Protection Department.
3.2 As regards the waste trade restrictions in the Mainland, its impact on local trade of paper waste appears to be rather moderate. In 2018, total exports of paper waste to the Mainland fell by only 4.8% (broadly similar to the 5% decline in such global trade), partly because Mainland buyers could still make use of their spare import quotas for buying sorted paper waste from Hong Kong.25 Moreover, local sourcing continued to take up more than 97% of total exports of paper waste, with just 3% from re-exports. On the other hand, local trade of plastic waste was hit much harder, with the quantity of total exports plunging by as much as 84% in 2018, as re-exports collapsed after the import ban in the Mainland.26 While a small part of such waste trade had been diverted to Southeast Asia, an enlarged quantity of waste stranded in
25 The number of import quotas for waste trade is fixed by the Mainland government and its
allocation is based on commercial considerations. See GovHK (2017c). 26 Unlike paper waste, local sourcing played very small role in trade in plastic waste in Hong Kong.
Re-exports took a much larger role instead, accounting for more than 95% of such trade. Hong Kong was both a temporary storage site and trading hub for plastic waste in Asia, on the back of its simpler import procedures and absence of tariff. See Hong Kong Productivity Council (2014a).
10
Hong Kong created both challenges and opportunities for the local recycling industry. 27 3.3 Conceivably, local recyclers face more operational constraints, compared with their overseas counterparts. First, local recyclable feedstock is smaller as the core policies of waste management (e.g. MSW charging and EPRS) have not been fully implemented in Hong Kong yet. Secondly, local waste feedstock is highly contaminated without proper sorting and cleaning at source, creating more technical hurdles in recycling. According to a dedicated study on recycling conducted by the Hong Kong Baptist University ("HKBU"), 86% of recyclers processed the collected plastic waste without washing.28 Thirdly, supply of affordable land suitable for recycling business is very limited. For instance, market rent of industrial land for recycling could be as high as HK$235/m2, 10 times above that in EcoPark.29 Fourthly, there is very limited recycling infrastructure in Hong Kong. While there is no paper mill for production of recycled paper after its closure some 10 years ago, existing plastic recycling facilities could process only 12% of the territory-wide recovered plastic waste in 2017. Coupled with volatile prices of recycled products, local recyclers are struggling for survival. Based on the HKBU study, 84% of the surveyed recyclers responded that "high operating cost" was their biggest challenge in 2017. On business profitability, only 14% of the recyclers said that they could make a profit, 37% managed to break even, but the rest of 49% suffered a loss.30 3.4 On policy support to local recyclers, the Government has launched a Recycling Fund valued at HK$1 billion in October 2015 for offering lump-sum funding to recyclers to expand their businesses and enhance productivity.31
27 Before the implementation of waste import ban, the Mainland accounted for 96% of the total
exports of plastic waste in Hong Kong in 2017. However, the corresponding proportion of the Mainland shrank to 17% in 2018, the respective figure to Southeast Asia rose significantly, including Thailand (40%), Malaysia (25%) and Vietnam (11%).
28 香港浸會大學嘉漢林業珠三角環境應用研究中心 (2017). 29 明報 (2018). 30 香港浸會大學嘉漢林業珠三角環境應用研究中心 (2017). 31 To assist the recycling industry to address the Mainland's progressive tightening
requirements on imports of recyclables, the Recycling Fund set aside a total of HK$70 million in September 2017 to help upgrade the recyclers' ability in processing waste plastics and waste paper, while encouraging them to use compactor trucks for more efficient transportation. Furthermore, the Fund also introduced a series of enhancement measures in January 2019, such as providing a maximum of 50% of rental subsidy to encourage recyclers relocating their existing operations to industrial buildings or lands zoned for industrial purpose.
11
After three years, the Fund approved a total of HK$152 million for recycling applications, including 58 projects on paper waste and 35 on plastic waste.32 It also engages in green procurement, spending HK$58 million on recycled paper during 2017-2019 and taking up 79% of the paper procurement budget. As regards land support, while three sites at EcoPark in Tuen Mun were leased to two plastic waste recyclers and one paper recycler during 2017-2018, 17 sites under short-term tenancy and 16 berths in public cargo working areas were assigned to plastic and paper recyclers. 3.5 However, local recyclers generally feel that government support is inadequate. The HKBU study pointed out that about 90% of local recyclers had not applied for the Recycling Fund before, largely due to perception of low success rate. Moreover, the lot size in EcoPark is considered to be both too large and too expensive for small recyclers.33 As regards the suggestion of providing subsidy to certain recyclables, the Government has reiterated that it would not do so because it was "difficult to determine" the level of subsidy on the one hand, and it might encourage more waste on the other.34 4. Policy support to the recycling industry in Taiwan 4.1 Taiwan is widely acclaimed as a pioneer in environment protection In Asia, along with South Korea. The aforementioned three core policies in waste management have been implemented in Taiwan since the early 2000s, providing a reliable supply of recyclables and incentivizing recyclers to install recycling equipment.35 The recovery rate of overall MSW in Taiwan has increased five-folds from 10% in 2000 to 60% in 2017, amongst the highest in the world.
32 As of March 2019, approved projects under the Fund could process 8 800 tonnes of plastic waste
and 2 800 tonnes of paper waste, representing just 1% and 0.2% of the respective streams of recyclable waste in 2017.
33 The area size of each lot in EcoPark ranges from 4 400-19 000 m2, suggesting a monthly rental of HK$41,000-HK$399,000. This is far more than small recyclers can afford.
34 The Government considers that unit subsidy needs to reflect changing market situation and cost variation. Subsidy may also encourage inefficient recyclers to stay in business and encourage waste generation. See Environment Bureau (2017) and Environmental Protection Department (2018b).
35 Legislative Council Secretariat (2017b and 2017c).
12
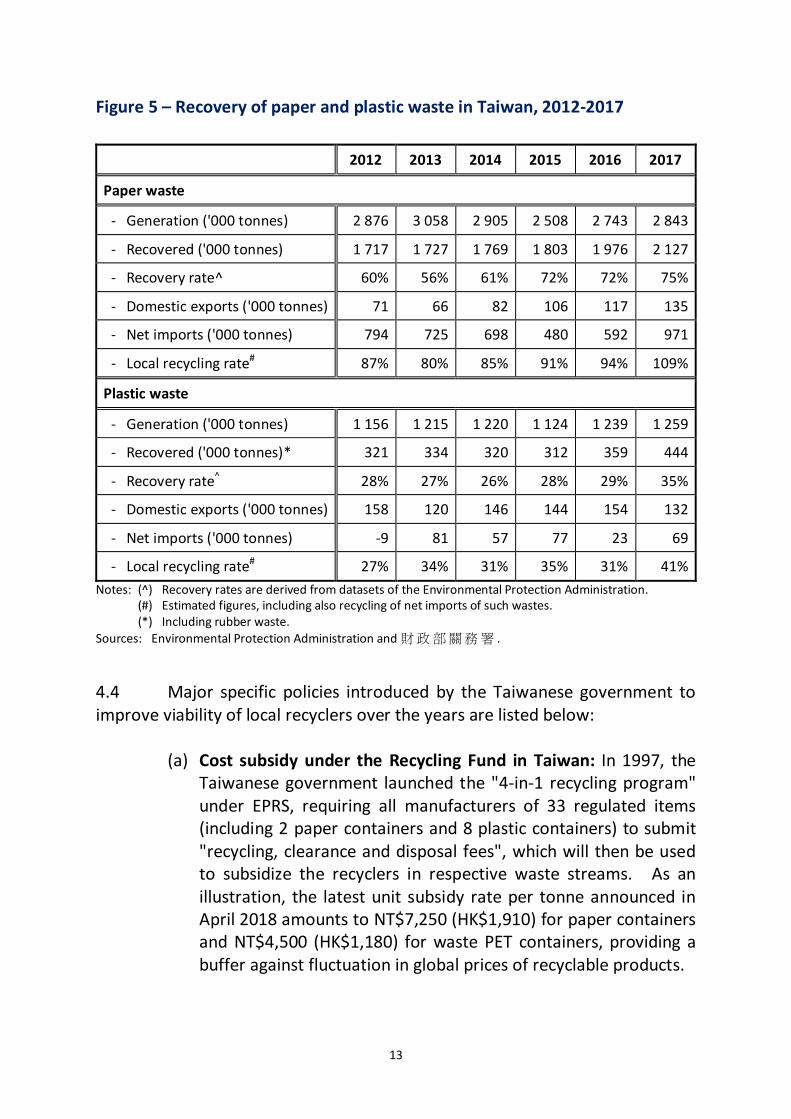
4.2 For the two selected waste streams, the recovery rate for paper waste has picked up from 60% to 75% during 2012-2017, and that for plastic waste from 28% to 35%. More specifically on paper recycling, it relies heavily on market forces, because only two paper containers (i.e. aluminium foil packages and paper containers) are entitled to subsidy granted by the government to 33 recycled products under the Recycling Fund in Taiwan.36 While this subsidy segment took up just 1% of the overall collected paper waste in 2017, the rest 99% were considered to be more viable (e.g. newspaper and cardboard) and could be recovered on the basis of private sector initiatives without subsidy. By contrast, plastic recycling is much more reliant on subsidy, with eight plastic products falling into the subsidy list and accounting for 45% of the collected plastic waste.37 For those paper and plastic recyclables outside the subsidy lists, Taiwanese recyclers are prone to more market risks, similar to recyclers in Hong Kong. 4.3 Taiwan has been a net importer of both waste streams (especially the paper waste) for local recycling in recent years, contrasted against the net exporter status seen in other advanced places. In 2017, Taiwan imported some 971 000 tonnes of paper waste (equivalent to 46% of locally recovered paper waste) on a net basis for local recycling, while the corresponding figures for net imports of plastic waste were 69 000 tonnes and 16% (Figure 5). In other words, spare capacity is available in Taiwan to recycle overseas waste, provided that import prices of such wastes are low enough. As such, adjusted recycling rates of paper waste and plastic waste in Taiwan reached 109% and 41% respectively in 2017, higher than the recovery rates discussed in the above paragraph. As of September 2018, there were some 299 registered recyclers covered by the subsidy under the Recycling Fund in Taiwan, within which 222 were waste collectors and 77 recyclers.38 On top of these larger recyclers, there are also many itinerant waste collectors and scavengers of recyclable materials of smaller scale. Average production value of recyclers in Taiwan was NT$58.6 million (HK$14.5 million) in 2016, registering an average annual growth of 6.5% during 2006-2016.39 36 This will be discussed further in the ensuing paragraphs. 37 These eight plastic products include PET, PVC, PP, PE, PS foam, PS non-foam, other plastics and
biomass plastics. 38 In Taiwan, "waste collectors" need to perform initial treatment duties like collection, sorting,
compacting and transportation, while "recyclers" carry out disassembling works, physical and chemical processing of waste. Only three types of waste practitioners are required to register with the government, including (a) recyclers of the regulated recyclable waste; (b) collectors of waste motor vehicles; and (c) collectors of other regulated recyclable waste operating in an area larger than 1 000 m2.
39 經濟部工業局 (2017) and經濟部推動綠色貿易專案辦公室 (2018).
13
Figure 5 – Recovery of paper and plastic waste in Taiwan, 2012-2017
2012 2013 2014 2015 2016 2017
Paper waste
- Generation ('000 tonnes) 2 876 3 058 2 905 2 508 2 743 2 843
- Recovered ('000 tonnes) 1 717 1 727 1 769 1 803 1 976 2 127
- Recovery rate^ 60% 56% 61% 72% 72% 75%
- Domestic exports ('000 tonnes) 71 66 82 106 117 135
- Net imports ('000 tonnes) 794 725 698 480 592 971
- Local recycling rate# 87% 80% 85% 91% 94% 109%
Plastic waste
- Generation ('000 tonnes) 1 156 1 215 1 220 1 124 1 239 1 259
- Recovered ('000 tonnes)* 321 334 320 312 359 444
- Recovery rate^ 28% 27% 26% 28% 29% 35%
- Domestic exports ('000 tonnes) 158 120 146 144 154 132
- Net imports ('000 tonnes) -9 81 57 77 23 69
- Local recycling rate# 27% 34% 31% 35% 31% 41% Notes: (^) Recovery rates are derived from datasets of the Environmental Protection Administration. (#) Estimated figures, including also recycling of net imports of such wastes. (*) Including rubber waste. Sources: Environmental Protection Administration and財政部關務署 .
4.4 Major specific policies introduced by the Taiwanese government to improve viability of local recyclers over the years are listed below:
(a) Cost subsidy under the Recycling Fund in Taiwan: In 1997, the Taiwanese government launched the "4-in-1 recycling program" under EPRS, requiring all manufacturers of 33 regulated items (including 2 paper containers and 8 plastic containers) to submit "recycling, clearance and disposal fees", which will then be used to subsidize the recyclers in respective waste streams. As an illustration, the latest unit subsidy rate per tonne announced in April 2018 amounts to NT$7,250 (HK$1,910) for paper containers and NT$4,500 (HK$1,180) for waste PET containers, providing a buffer against fluctuation in global prices of recyclable products.
14
Annual recycling subsidy granted to recyclers of containers (including paper waste and plastic waste) averaged at NT$1.98 billion (HK$521 million) during 2006-2018. In 2016, the subsidy from the Recycling Fund in Taiwan averaged at about one-fourth of the production value of the subsidized recyclers, representing an important income source for the eligible recyclers. That said, it is reminded that only about 1% of paper waste and 45% of plastic waste collected fell within the subsidy list in 2017;
(b) Subsidy on investment in research and development: The
Taiwanese government has since 2012 subsidized research on innovative technology, processing of recycled waste and utilization of recycled materials. Annual budget has increased by a total of 150% in seven years to NT$50 million (HK$12.9 million) in 2019, funding altogether 92 projects during 2012-2017. In addition, 85 recyclers formed a cradle-to-cradle alliance to foster green design in products. Taiwan has thus become one of the global leaders in transforming PET materials into textile and clothing;40
(c) Active green procurement: The Taiwanese government has been
an active promoter of green procurement, requiring all departments and city governments to increase the procurement ratio of recycled products in specified projects to 90% by 2011. During 2002-2016, the annual government expenditure on green procurement increased by a total of 174% to NT$7.2 billion (HK$1.8 billion), along with a rise in the green procurement ratio from 60.5% to 96.8%. Following the example set by the government, the private sector in Taiwan also pursued green procurement, with such spending increasing by 31 times to some NT$19 billion (HK$4.7 billion) between 2007-2016; and
(d) Establishing the dedicated and large-scale recycling facilities:
Over the past two decades, the Taiwanese government set up four Environmental Science and Technology Parks ("ESTPs") located in Kaohsiung, Tainan, Taoyuan and Hualien, all with priority given to certain recycling industries and managed by the
40 For example, 16 out of the 32 national soccer teams participating in World Cup 2018 hosted by
Russia wore the recycled jerseys produced by Taiwan.
15
city governments.41 Companies located in ESTPs were granted subsidies equivalent to half of the leasing cost and research budget, and production subsidy up to 10% of total capital investment during 2002-2011. At end-2011, some 110 recycling companies benefited from ESTPs, generating altogether 10.8 million tonnes of recyclables and NT$16.5 billion (HK$4.5 billion) of production value each year.
4.5 Regarding recent restriction of waste trade in the Mainland, it seems to have resulted in a visible displacement of locally recovered waste by overseas imported waste as a feedstock for recycling in Taiwan in 2018, as Taiwanese recyclers find it cheaper to recycle overseas waste than locally collected waste consequential to the slump in the global price of paper and plastic wastes. 42 Reflecting this, net imports of paper waste in Taiwan increased by 22% to 1.2 million tonnes in 2018, and that of plastic waste by 432% to 368 400 tonnes.43 Concurrently, there were reports of stockpiles of locally recovered waste unattended or untreated in Taiwan, indicating that the respective local recovery rate could face downward pressure in 2018. 4.6 In view of the strong public concerns over pollution caused by massive waste imports and its crowding out effect on locally collected waste, the Taiwanese government passed an amendment bill on "Regulations Governing Business Wastes Used as Industrial Materials" in October 2018 to impose more stringent requirement on waste imports.44 First, only firms with licences are allowed to import wastes for industrial use. Secondly, only well-sorted wastes are permitted to be imported (e.g. plastic waste in single texture, non-bleached kraft paper, corrugated paper or cardboard without mixing with other wastes, etc.). Thirdly, recycled materials should be used domestically, rather than being exported as raw materials. On top of that, the Taiwanese government also hired over 4 200 individual recyclable pickers in 2018 on a part-time basis to assist local environmental agencies in sorting
41 For example, recyclers of plastic, metal and textile were accorded priority in Tainan ESTP. 42 For locally collected waste, the Taiwanese recyclers need to buy it from waste collectors at local
price. If locally collected waste is cheaper than imported waste, recyclers would have incentive to recycle the former first, and vice versa.
43 Additional imports of plastic and paper waste mainly came from Japan, the US and the UK. See蘋果日報 (2018).
44 In the past, local firms were free to import paper and plastic wastes as material inputs without the need of government approval. They are now subject to licence requirement under the new amendment bill.
16
and recycling waste, with a policy objective to stabilize the income of recyclers. These pickers could earn around NT$3,000 (HK$813) by working for 25 hours a month, relieving their financial pressure. These new measures seem to be effective in reducing waste imports in Taiwan.45 5. Policy support to recycling industry in California 5.1 Amongst the 50 states in the US, California has long been regarded as the "environmental leader".46 As early as in 1972, California established the "Solid Waste Management Board" to carry out resource recovery programme. 47 More recently in 2011, California enacted the state law namely the Assembly Bill (AB) 341, setting an ambitious state-wide recycling target of 75% by 2020.48 To this end, the state government launched programmes such as mandatory commercial recycling in 2012, requiring businesses and multi-family residences to arrange collection of recyclable wastes on their own. In 2017, some 80% of businesses and 85% of multi-family complexes managed to collect such recyclable wastes.49 5.2 In 2010, the Management Board was transformed into the California Department of Resources Recycling and Recovery ("CalRecycle"), with a dedicated task to reduce MSW disposal and promote recycling in California. However, given that recyclers need not report recycling figures to CalRecycle, there is no comprehensive statistics on state-wise recycling, let alone breakdowns on recovery rates of paper and plastic wastes.50 Based on
45 Imports of paper waste fell by 19% in the fourth quarter of 2018 over a year earlier, while
imported plastic waste moderated from a year-on-year increase of 176% in the first three quarters of 2018 to 9% in the fourth quarter.
46 Vogel (2018). 47 Under the Solid Waste Management and Resource Recovery Act passed in 1972, a management
board on solid waste was formed to oversee waste disposal and recycling in California. The Board was also responsible for the solid waste resources recovery programme within the state.
48 The California Integrated Waste Management Act (AB 939) in 1989 required the government to achieve 25% diversion of solid waste from landfills by 1 January 1995, and 50% diversion by 1 January 2000. Besides, AB 341 in 2011 required the authority to establish a new statewide recycling target of 75% by 2020. See CalRecycle (2015b).
49 In 2017, there were 296 contracted haulers and 457 processors who collected and recovered wastes from residential and commercial sectors in California.
50 Recovery rates for paper waste and plastic waste in California are not available currently, but CalRecycle has scheduled to launch a "Recycle and Disposal Reporting System" in 2019 to mandatorily require recyclers to report on recycling figures. As a broad reference, the overall recovery rates for paper and plastic across the US were 66.6% and 9.1% respectively in 2015.
17
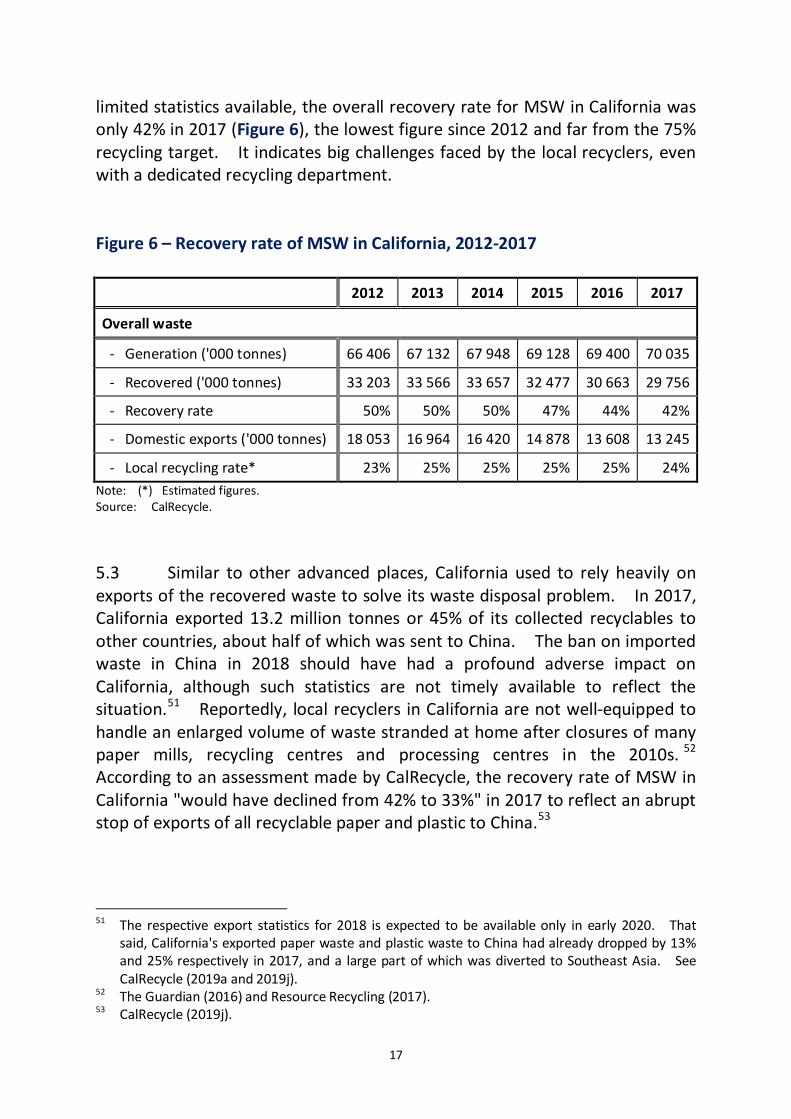
limited statistics available, the overall recovery rate for MSW in California was only 42% in 2017 (Figure 6), the lowest figure since 2012 and far from the 75% recycling target. It indicates big challenges faced by the local recyclers, even with a dedicated recycling department. Figure 6 – Recovery rate of MSW in California, 2012-2017 2012 2013 2014 2015 2016 2017
Overall waste
- Generation ('000 tonnes) 66 406 67 132 67 948 69 128 69 400 70 035
- Recovered ('000 tonnes) 33 203 33 566 33 657 32 477 30 663 29 756
- Recovery rate 50% 50% 50% 47% 44% 42%
- Domestic exports ('000 tonnes) 18 053 16 964 16 420 14 878 13 608 13 245
- Local recycling rate* 23% 25% 25% 25% 25% 24% Note: (*) Estimated figures. Source: CalRecycle.
5.3 Similar to other advanced places, California used to rely heavily on exports of the recovered waste to solve its waste disposal problem. In 2017, California exported 13.2 million tonnes or 45% of its collected recyclables to other countries, about half of which was sent to China. The ban on imported waste in China in 2018 should have had a profound adverse impact on California, although such statistics are not timely available to reflect the situation.51 Reportedly, local recyclers in California are not well-equipped to handle an enlarged volume of waste stranded at home after closures of many paper mills, recycling centres and processing centres in the 2010s. 52 According to an assessment made by CalRecycle, the recovery rate of MSW in California "would have declined from 42% to 33%" in 2017 to reflect an abrupt stop of exports of all recyclable paper and plastic to China.53
51 The respective export statistics for 2018 is expected to be available only in early 2020. That
said, California's exported paper waste and plastic waste to China had already dropped by 13% and 25% respectively in 2017, and a large part of which was diverted to Southeast Asia. See CalRecycle (2019a and 2019j).
52 The Guardian (2016) and Resource Recycling (2017). 53 CalRecycle (2019j).
18
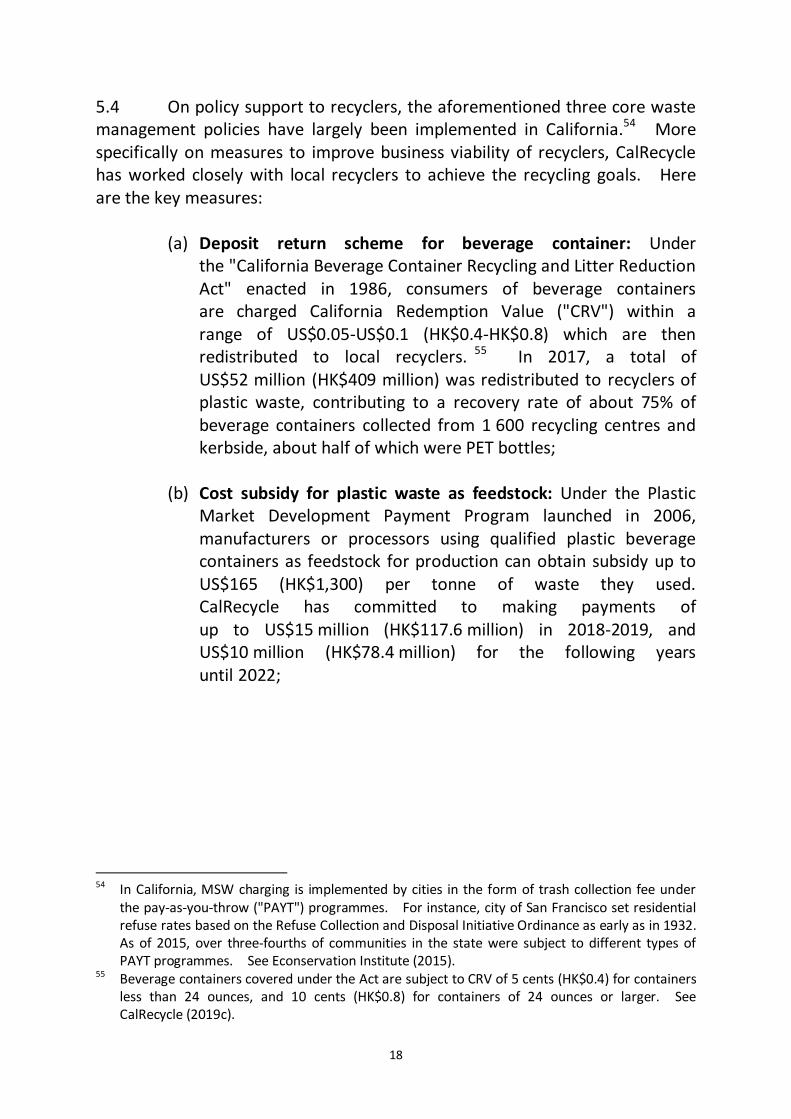
5.4 On policy support to recyclers, the aforementioned three core waste management policies have largely been implemented in California.54 More specifically on measures to improve business viability of recyclers, CalRecycle has worked closely with local recyclers to achieve the recycling goals. Here are the key measures:
(a) Deposit return scheme for beverage container: Under the "California Beverage Container Recycling and Litter Reduction Act" enacted in 1986, consumers of beverage containers are charged California Redemption Value ("CRV") within a range of US$0.05-US$0.1 (HK$0.4-HK$0.8) which are then redistributed to local recyclers. 55 In 2017, a total of US$52 million (HK$409 million) was redistributed to recyclers of plastic waste, contributing to a recovery rate of about 75% of beverage containers collected from 1 600 recycling centres and kerbside, about half of which were PET bottles;
(b) Cost subsidy for plastic waste as feedstock: Under the Plastic
Market Development Payment Program launched in 2006, manufacturers or processors using qualified plastic beverage containers as feedstock for production can obtain subsidy up to US$165 (HK$1,300) per tonne of waste they used. CalRecycle has committed to making payments of up to US$15 million (HK$117.6 million) in 2018-2019, and US$10 million (HK$78.4 million) for the following years until 2022;
54 In California, MSW charging is implemented by cities in the form of trash collection fee under
the pay-as-you-throw ("PAYT") programmes. For instance, city of San Francisco set residential refuse rates based on the Refuse Collection and Disposal Initiative Ordinance as early as in 1932. As of 2015, over three-fourths of communities in the state were subject to different types of PAYT programmes. See Econservation Institute (2015).
55 Beverage containers covered under the Act are subject to CRV of 5 cents (HK$0.4) for containers less than 24 ounces, and 10 cents (HK$0.8) for containers of 24 ounces or larger. See CalRecycle (2019c).
19
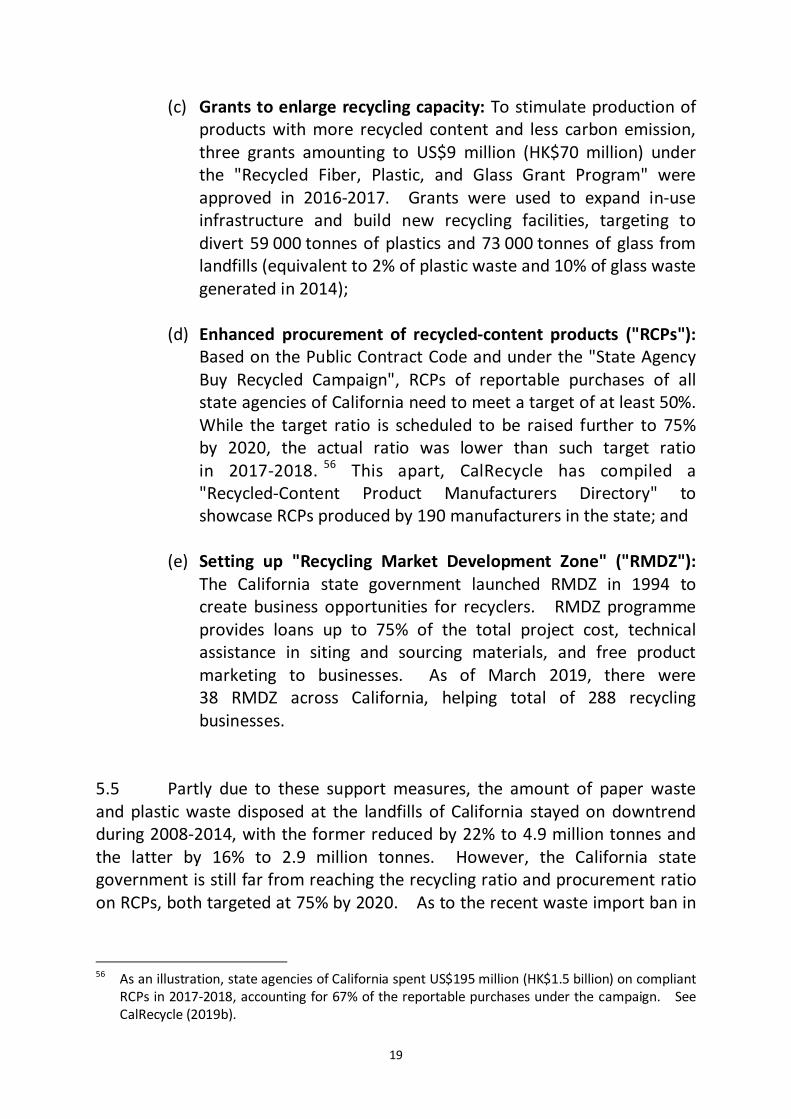
(c) Grants to enlarge recycling capacity: To stimulate production of products with more recycled content and less carbon emission, three grants amounting to US$9 million (HK$70 million) under the "Recycled Fiber, Plastic, and Glass Grant Program" were approved in 2016-2017. Grants were used to expand in-use infrastructure and build new recycling facilities, targeting to divert 59 000 tonnes of plastics and 73 000 tonnes of glass from landfills (equivalent to 2% of plastic waste and 10% of glass waste generated in 2014);
(d) Enhanced procurement of recycled-content products ("RCPs"):
Based on the Public Contract Code and under the "State Agency Buy Recycled Campaign", RCPs of reportable purchases of all state agencies of California need to meet a target of at least 50%. While the target ratio is scheduled to be raised further to 75% by 2020, the actual ratio was lower than such target ratio in 2017-2018. 56 This apart, CalRecycle has compiled a "Recycled-Content Product Manufacturers Directory" to showcase RCPs produced by 190 manufacturers in the state; and
(e) Setting up "Recycling Market Development Zone" ("RMDZ"):
The California state government launched RMDZ in 1994 to create business opportunities for recyclers. RMDZ programme provides loans up to 75% of the total project cost, technical assistance in siting and sourcing materials, and free product marketing to businesses. As of March 2019, there were 38 RMDZ across California, helping total of 288 recycling businesses.
5.5 Partly due to these support measures, the amount of paper waste and plastic waste disposed at the landfills of California stayed on downtrend during 2008-2014, with the former reduced by 22% to 4.9 million tonnes and the latter by 16% to 2.9 million tonnes. However, the California state government is still far from reaching the recycling ratio and procurement ratio on RCPs, both targeted at 75% by 2020. As to the recent waste import ban in
56 As an illustration, state agencies of California spent US$195 million (HK$1.5 billion) on compliant
RCPs in 2017-2018, accounting for 67% of the reportable purchases under the campaign. See CalRecycle (2019b).
20
China, the California state government has so far responded with reiteration of existing policy measures, without rolling out new recycling initiatives.57 6. Concluding remarks 6.1 Global recycling is still not a commercially sustainable business, mainly due to lower cost competitiveness of and weaker market demand for recycled products vis-à-vis products made of virgin materials. Although the global recovery rate of paper waste has improved to 59% in 2015 and that of plastic waste to 21% in 2017, around one-third of such waste was not recycled locally but was sent to other places for processing. Both recyclers and governments are still seeking to make recycling a sustainable business, especially after imposition of strict restrictions on waste imports in China in 2018. 6.2 Three core waste management policies (i.e. MSW waste charging, mandatory waste separation at source and EPRS) are implemented in many advanced places, providing steady supply of recyclables to recyclers. In both Taiwan and California, specific policy measures are also applied to enhance business viability of recyclers, including (a) subsidy on recycled products to enlarge recycling income; (b) green procurement to widen the market for recycled products; (c) lump-sum grants to recyclers to upgrade their facilities; and (d) purpose-built eco-park to provide subsidized land for recycling.
57 CalRecycle (2019f).
21
Appendix
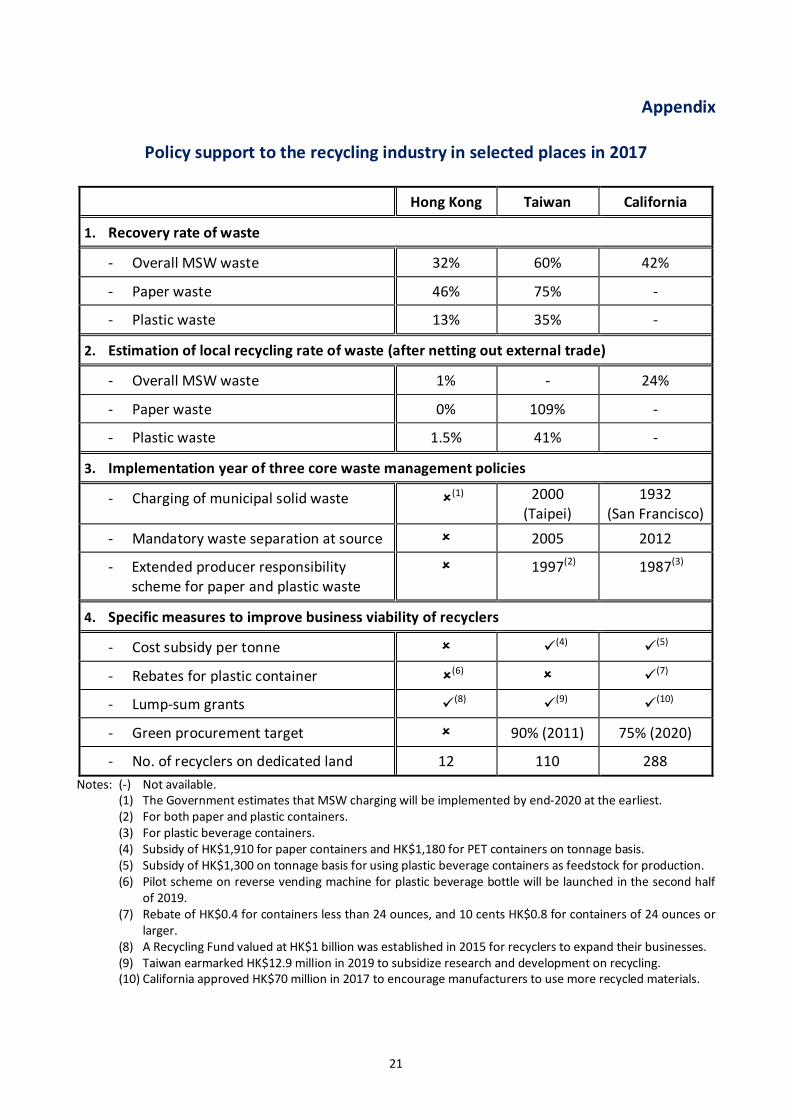
Policy support to the recycling industry in selected places in 2017
Hong Kong Taiwan California
1. Recovery rate of waste
- Overall MSW waste 32% 60% 42%
- Paper waste 46% 75% -
- Plastic waste 13% 35% -
2. Estimation of local recycling rate of waste (after netting out external trade)
- Overall MSW waste 1% - 24%
- Paper waste 0% 109% -
- Plastic waste 1.5% 41% -
3. Implementation year of three core waste management policies
- Charging of municipal solid waste (1) 2000 (Taipei)
1932 (San Francisco)
- Mandatory waste separation at source 2005 2012
- Extended producer responsibility scheme for paper and plastic waste
1997(2) 1987(3)
4. Specific measures to improve business viability of recyclers
- Cost subsidy per tonne (4) (5)
- Rebates for plastic container (6) (7)
- Lump-sum grants (8) (9) (10)
- Green procurement target 90% (2011) 75% (2020)
- No. of recyclers on dedicated land 12 110 288 Notes: (-) Not available. (1) The Government estimates that MSW charging will be implemented by end-2020 at the earliest. (2) For both paper and plastic containers. (3) For plastic beverage containers. (4) Subsidy of HK$1,910 for paper containers and HK$1,180 for PET containers on tonnage basis. (5) Subsidy of HK$1,300 on tonnage basis for using plastic beverage containers as feedstock for production. (6) Pilot scheme on reverse vending machine for plastic beverage bottle will be launched in the second half
of 2019. (7) Rebate of HK$0.4 for containers less than 24 ounces, and 10 cents HK$0.8 for containers of 24 ounces or
larger. (8) A Recycling Fund valued at HK$1 billion was established in 2015 for recyclers to expand their businesses. (9) Taiwan earmarked HK$12.9 million in 2019 to subsidize research and development on recycling. (10) California approved HK$70 million in 2017 to encourage manufacturers to use more recycled materials.
22
References Hong Kong 1. EcoPark. (2019) Tenancies of the phase 1 and phase 2 lots at EcoPark. Available
from: http://www.ecopark.com.hk/en/tenancies.aspx [Accessed April 2019]. 2. Environment Bureau. (2017) Government's response to items (a) to (e) of
the list of follow-up actions arising from the discussion at the meeting on 13 December 2016 and items (a) and (d)(iv) of the list of follow-up actions arising from the discussion at the meeting on 16 January 2017. Available from: https://www.legco.gov.hk/yr16-17/english/panels/ea/ea_rcrr/papers/ea_rcrr20170605cb1-1260-2-e.pdf [Accessed April 2019].
3. Environmental Protection Department. (2015) List of 150 Green
Procurement Items. Available from: https://www.epd.gov.hk/epd/sites/default/files/epd/english/how_help/green_procure/files/List_of_150_Green_Procurement_Items_eng.pdf [Accessed April 2019].
4. Environmental Protection Department. (2018a) Monitoring of
Solid Waste in Hong Kong – Waste Statistics for 2017. Available from: https://www.wastereduction.gov.hk/sites/default/files/msw2017.pdf [Accessed April 2019].
5. Environmental Protection Department. (2018b) Replies to initial
written questions raised by Finance Committee Members in examining the Estimates of Expenditure 2018-19. Available from: https://www.legco.gov.hk/yr17-18/english/fc/fc/w_q/enb-e.pdf [Accessed April 2019].
6. Environmental Protection Department. (2019a) Location of Collection
Points. Available from: https://www.wastereduction.gov.hk/en/quickaccess/vicinity.htm [Accessed April 2019].
7. GovHK. (2017a) Government to take contingency measures in light
of possible suspension of waste paper collection by recyclers. Available from: https://www.info.gov.hk/gia/general/201709/06/P2017090600976.htm [Accessed April 2019].
23
8. GovHK. (2017b) LCQ3: Recycling Fund. Available from: https://www.info.gov.hk/gia/general/201706/21/P2017062100552.htm [Accessed April 2019].
9. GovHK. (2017c) LCQ6: Recycling of waste paper and waste plastics.
Available from: https://www.info.gov.hk/gia/general/201710/25/P2017102500615.htm [Accessed April 2019].
10. GovHK. (2017d) LCQ8: Supporting local recycling industry. Available from:
https://www.info.gov.hk/gia/general/201710/25/P2017102500665.htm [Accessed April 2019].
11. GovHK. (2018a) EPD awards lease for four adjacent lots in EcoPark to
develop local waste paper recycling and manufacturing plant. Available from: https://www.info.gov.hk/gia/general/201812/07/P2018120700352.htm [Accessed April 2019].
12. GovHK. (2018b) LCQ4: Short-term tenancy sites for lease by recyclers.
Available from: https://www.info.gov.hk/gia/general/201805/30/P2018053000588.htm [Accessed April 2019].
13. Hong Kong Productivity Council. (2014a) A Study to Promote Recycling of
Plastic, Paper and Used Cooking Oil in Hong Kong. Available from: https://www.wastereduction.gov.hk/sites/default/files/HKPC%20Consultancy%20Report%20Final%20%28Eng%29.pdf [Accessed April 2019].
14. Hong Kong Productivity Council. (2014b) Studies on Local and Overseas
Funding Schemes and Profile of the Local Recycling Industry. 15. Legislative Council Secretariat. (2017a) Background brief on support for
local recycling industry. LC Paper No. CB(1)233/17-18(05). Available from: http://www.legco.gov.hk/yr17-18/english/panels/ea/papers/ea20171127cb1-233-5-e.pdf [Accessed April 2019].
16. Legislative Council Secretariat. (2017b) Separation and collection of
household waste in selected places. LC Paper No. IN08/16-17. Available from: http://www.legco.gov.hk/research-publications/english/1617in08-separation-and-collection-of-household-waste-in-selected-places-20170320-e.pdf [Accessed April 2019].
24
17. Legislative Council Secretariat. (2017c) Waste recycling system in selected places. LC Paper No. IN12/16-17. Available from: https://www.legco.gov.hk/research-publications/english/1617in12-waste-recycling-system-in-selected-places-20170524-e.pdf [Accessed April 2019].
18. 明 報 : 《 環 保 園 廠 房 按 金 租 金 高 昂 中 小 企 難 負 擔 》 ,
2018 年 2 月 8 日 , 網 址 : https://news.mingpao.com/pns/ 港 聞/article/20190208/s00002/1549563075446/環保園廠房按金租金高昂-中小企難負擔 [於 2019年 4月登入 ]。
19. 香港浸會大學嘉漢林業珠三角環境應用研究中心:《香港回收商現時的運作情況調查總結報告》, 2017年 12月 29日,網址 : http://recycling%2Dfund.hkbu.edu.hk/sites/default/files/Appendix%20C.2_Part%202%20香港回收商現時的運作情況調查總結報告_20171227_JW.pdf [於 2019年 4月登入 ]。
Taiwan 20. Environmental Protection Administration. (2016) The Environmental
Science and Technology Parks in Taiwan. Available from: https://estp.epa.gov.tw/en/index.htm [Accessed April 2019].
21. Environmental Protection Administration. (2019a) Recycle. Available from:
https://recycle.epa.gov.tw/en/index.html [Accessed April 2019]. 22. Environmental Protection Administration. (2019b) Solid Waste Statistics.
Available from: https://www.epa.gov.tw/ENG/513B0B39D090DE4C [Accessed April 2019].
23. Taiwan News. (2018) Rules proposed to curb imports of waste Taiwan
manufactures over half of World Cup team jerseys. Available from: https://www.taiwannews.com.tw/en/news/3476997 [Accessed April 2019].
24. 行政院環境保護署:《 106年版環境白皮書》, 2018年 8月 7日,網址: https://www.epa.gov.tw/DisplayFile.aspx?FileID=28B1244FBAF5A6A7&P=5599099a-3efa-49cf-9a1d-045bde6ff2eb [於 2019年 4月登入 ]。
25
25. 行政院環境保護署:《 107年度資源回收管理基金-信託基金部 分 決 算 資 料 》 , 2019 年 2 月 15 日 , 網 址 :
https://www.epa.gov.tw/DisplayFile.aspx?FileID=B75C23C8F69D2B65&P=02c05d7e-8eab-4849-b5cf-5f7773f75fe4 [於 2019年 4月登入 ]。
26. 行政院環境保護署:《回收處理業》, 2019年 2月 20日,網址: https://recycle.epa.gov.tw/epa/ShowPage2.aspx?key=5&sno=1009&subsno=353 [於 2019年 4月登入 ]。
27. 行政院環境保護署:《垃圾強制分類》, 2019年 2月 20日,網址: https://recycle.epa.gov.tw/epa/ShowPage2.aspx?key=5&sno=1009&subsno=30 [於 2019年 4月登入 ]。
28. 行 政 院 環 境 保 護 署 : 《 創 新 及 研 究 發 展 成 果 》 ,
2019年 2月 20日,網址: http://recycle.epa.gov.tw/epa/ShowPage2.aspx?key=6&sno=1010&subsno=294&subsubsno=347 [於 2019年 4月登入 ]。
29. 行政院環境保護 署:《循環再生 2018》, 2018年 12月,網 址 : https://recycle.epa.gov.tw/Year20/20 年 特 展 專 輯 .pdf [於 2019年 4月登入 ]。
30. 行政院環境保護署:《業務概況書面報告》, 2018年 11月 7日,網址: https://www.epa.gov.tw/DisplayFile.aspx?FileID=1E2B765CCE29774F [於 2019年 4月登入 ]。
31. 行政院環境保護署:《臺灣是循環經濟的熱點不是世界垃圾場》,2018年8月30日,網址:http://enews.epa.gov.tw/enews/fact_Newsdetail.asp?InputTime=1070830124515 [於 2019年 4月登入 ]。
32. 行政院環境保護署:《應回收廢容器回收清除處理補貼費率表》, 2018年 4月 10日,網址:http://recycle.epa.gov.tw/Upload/news/201805/應回收廢容器回收清除處理補貼費率 1070410.pdf [於 2019年 4月登入 ]。
33. 行政院環境保護署:《屬產業用料需求之事業廢棄物公告事項第一項修正草案總說明》, 2018年,網址:http://enews.epa.gov.tw/enews/enews_ftp/107/0906/092643/1070906附件 --產業用料草案總說明及對照表.pdf [於 2019年 4月登入 ]。
26
34. 財 政 部 關 務 署 : 《 進 、 出 口 貨 物 數 量 、 價 值 查 詢 》 ,2019年,網址: http://portal.sw.nat.gov.tw/APGA/GA03 [於 2019年4月登入 ]。
35. 財政部關務署:《進口廢塑膠、廢紙應遵守「屬產業用料需求之事業廢棄物」規定,以免受罰》, 2018年9月 25日,網址:https://web.customs.gov.tw/News_Content.aspx?n=F55943A3BAA86A6A&sms=1095B63D0846032B&s=5A9A554BB209C750 [於2019年4月登入 ]。
36. 經濟部工業局:《生質能暨環保產業推動計畫 106年度專案計 畫 期 末 執 行 成 果 報 告 》 , 2017年 12月 19日 , 網 址 :https://www.moeaidb.gov.tw/external/ctlr?PRO=filepath.DownloadFile&f=executive&t=f&id=12158 [於 2019年 4月登入 ]。
37. 經濟部推動綠色貿易專案辦公室:《台灣環保產業發展概況》,2018年 7月 10日,網址: https://cdn.greentrade.org.tw/sites/default/files/107-台灣環保產業發展概況%20v2.pdf [於 2019年 4月登入 ]。
38. 蘋果日報:《台灣世界垃圾場》, 2018年 8月 29日,網址:
http://inv.appledaily.com.tw/waronwaste/ [於 2019年 4月登入 ]。 California 39. CalRecycle. (2015a) 2014 Disposal-Facility-Based Characterization of
Solid Waste in California. Available from: https://www2.calrecycle.ca.gov/Publications/Download/1301 [Accessed April 2019].
40. CalRecycle. (2015b) State of Recycling in California. Available from:
https://www2.calrecycle.ca.gov/Publications/Download/1151 [Accessed April 2019].
41. CalRecycle. (2017) State of Disposal and Recycling in California:
2017 Update. Available from: https://www2.calrecycle.ca.gov/Publications/Download/1312 [Accessed April 2019].
42. CalRecycle. (2018a) California's 75 Percent Initiative Defining the Future.
Available from: https://www.calrecycle.ca.gov/calendar/75percent [Accessed April 2019].
27
43. CalRecycle. (2018b) Plastic Market Development Payment Program: Instructions. Available from: https://www.calrecycle.ca.gov/docs/cr/bevcontainer/forms/pmdinstruct.pdf [Accessed April 2019].
44. CalRecycle. (2018c) State Agency Buy Recycled Campaign.
Available from: https://www.calrecycle.ca.gov/buyrecycled/stateagency [Accessed April 2019].
45. CalRecycle. (2019a) 2017 California Exports of Recyclable Materials.
Available from: https://www2.calrecycle.ca.gov/Publications/Download/1383 [Accessed April 2019].
46. CalRecycle. (2019b) 2017-2018 SABRC Product Category Statewide
Summary. Available from: https://www.calrecycle.ca.gov/docs/cr/buyrecycled/stateagency/annualreports/201718productcategory.pdf [Accessed April 2019].
47. CalRecycle. (2019c) Beverage Container Recycling. Available from:
https://www.calrecycle.ca.gov/bevcontainer [Accessed April 2019]. 48. CalRecycle. (2019d) Export of Recyclable Materials from California.
Available from: https://www.calrecycle.ca.gov/Markets/NationalSword/Data/ [Accessed April 2019].
49. CalRecycle. (2019e) Greenhouse Gas Reduction Loan Program.
Available from: https://www.calrecycle.ca.gov/climate/grantsloans/ghgloans/ [Accessed April 2019].
50. CalRecycle. (2019f) National Sword and China's Restriction on the Import
of Recyclable Material. Available from: https://www.calrecycle.ca.gov/markets/nationalsword [Accessed April 2019].
51. CalRecycle. (2019g) Plastic Market Development Payment Rate for 2019.
Available from: https://www.calrecycle.ca.gov/docs/cr/bevcontainer/notices/2019/pmdprates.pdf [Accessed April 2019].
52. CalRecycle. (2019h) Recycled-Content Product Manufacturers (RCPM).
Available from: https://www2.calrecycle.ca.gov/buyrecycled/manufacturers/directory/ [Accessed April 2019].
53. CalRecycle. (2019i) Recycling Market Development Zone (RMDZ) Program.
Available from: https://www.calrecycle.ca.gov/rmdz [Accessed April 2019].
28
54. CalRecycle. (2019j) State of Disposal and Recycling in California: For Calendar Year 2017. Available from: https://www2.calrecycle.ca.gov/Publications/System/DR/Download/c53d4ab2%2Da63a%2D4f05%2D8255%2Daf7ba45f70b9 [Accessed April 2019].
55. Econservation Institute. (2015) Pay-As-You-Throw/variable rates for trash
collection. Available from: https://www.epa.gov/sites/production/files/2015-09/documents/skumatz.pdf [Accessed April 2019].
56. Resource Recycling. (2017) California recycled paper mill Shutters. Available
from: https://resource-recycling.com/recycling/2017/12/12/california-recycled-paper-mill-shutters/ [Accessed April 2019].
57. The Guardian. (2016) Collecting cans to survive: a 'dark future' as
California recycling centers vanish. Available from: https://www.theguardian.com/us-news/2016/aug/08/can-collectors-california-recycling-centers-close [Accessed April 2019].
58. The Mercury News. (2017) Recycling centers continue to struggle, driving
California recycling rates down. Available from: https://www.mercurynews.com/2017/06/17/recycling-centers-continue-to-struggle-driving-california-recycling-rates-down/ [Accessed April 2019].
59. Vogel, D. (2018) California Greenin' How the Golden State Became an
Environmental Leader. Available from: https://press.princeton.edu/titles/11274.html [Accessed April 2019].
Others 60. Bureau of International Recycling. (2015) Recovered Paper Market in 2013.
Available from: https://bir.org/assets/Documents/publications/brochures/2015-Paper-report-V02.pdf [Accessed April 2019].
61. Bureau of International Recycling. (2019a) The Industry – Paper.
Available from: https://bir.org/industry/paper/ [Accessed April 2019]. 62. Bureau of International Recycling. (2019b) The Industry – Plastics.
Available from: https://bir.org/industry/plastics/ [Accessed April 2019].
29
63. EcoVadis. (2018) Global CSR Risk and Performance Index 2018. Available from: https://www.comunicarseweb.com/sites/default/files/ecovadis_index_2018_final_min.pdf [Accessed April 2019].
64. Environmental Paper Network. (2018) The state of the global paper
industry 2018. Available from: http://environmentalpaper.org/wp-content/uploads/2018/04/StateOfTheGlobalPaperIndustry2018_FullReport-Final-1.pdf [Accessed April 2019].
65. Eurokey Recycling. (2019a) Commodity Prices (Plastics). Available from:
https://www.eurokeyrecycling.com/commodity-prices/plastics/ [Accessed April 2019].
66. Eurokey Recycling. (2019b) Commodity Prices (Waste paper).
Available from: https://www.eurokeyrecycling.com/commodity%2Dprices/waste-paepr/ [Accessed April 2019].
67. Geyer. R. et al. (2017) Production, use, and fate of all plastics ever made.
Science Advances, vol. 3, no. 7, July. Available from: http://advances.sciencemag.org/content/advances/3/7/e1700782.full.pdf [Accessed April 2019].
68. HM Government of the United Kingdom. (2018) A Green Future: Our
25 Year Plan to Improve the Environment. Available from: https://assets.publishing.service.gov.uk/government/uploads/system/uploads/attachment_data/file/693158/25-year-environment-plan.pdf [Accessed April 2019].
69. International Council of Forest and Paper Associations. (2017)
2017 ICFPA Sustainability Progress Report. Available from: https://icfpa.org/download/633/ [Accessed April 2019].
70. International Trade Centre. (2019a) International trade statistics on
recovered "waste and scrap" paper or paperboard. Available from: https://www.trademap.org/tradestat/Country_SelProduct_TS.aspx?nvpm=1%7c%7c%7c%7c%7c4707%7c%7c%7c4%7c1%7c1%7c1%7c2%7c1%7c2%7c4%7c1 [Accessed April 2019].
71. International Trade Centre. (2019b) International trade statistics on waste,
parings and scrap, of plastics. Available from: https://www.trademap.org/tradestat/Country_SelProduct_TS.aspx?nvpm=1%7c%7c%7c%7c%7c3915%7c%7c%7c4%7c1%7c1%7c1%7c2%7c1%7c2%7c4%7c1 [Accessed April 2019].
30
72. Ministry of the Environment of Japan. (2016) Introduction to Green Purchasing Legislation in Japan. Available from: https://www.env.go.jp/policy/hozen/green/kokusai_platform/2015report/handbook_eng.pdf [Accessed April 2019].
73. Ministry of the Environment of Japan. (2018) Japan's Resource
Circulation Policy for Plastics. Available from: http://ec.europa.eu/environment/international_issues/pdf/S2-02-Yusuke%20Inoue.pdf [Accessed April 2019].
74. Ministry of Environment of South Korea. (2019) Minister – Waste
Recycling. Available from: http://eng.me.go.kr/eng/web/index.do?menuId=372 [Accessed April 2019].
75. National Environment Agency of Singapore. (2018) Sarimbun Recycling
Park. Available from: https://www.nea.gov.sg/our-services/waste-management/waste-management-infrastructure/sarimbun-recycling-park [Accessed April 2019].
76. National Environment Agency of Singapore. (2019) 3R Fund. Available from:
https://www.nea.gov.sg/programmes-grants/grants-and-awards/3r-fund [Accessed April 2019].
77. Nielsen. (2018) Was 2018 the year of the influential
sustainable consumer? Available from: https://www.nielsen.com/us/en/insights/news/2018/was-2018-the-year-of-the-influential-sustainable-consumer.print.html [Accessed April 2019].
78. Organisation for Economic Co-operation and Development. (2018a)
Improving Plastics Management: Trends, policy responses, and the role of international co-operation and trade. Available from: https://www.oecd.org/environment/waste/policy-highlights-improving-plastics-management.pdf [Accessed April 2019].
79. Organisation for Economic Co-operation and Development. (2018b)
International Trade and the Transition to a More Resource Efficient and Circular Economy – Concept Paper. Available from: http://www.oecd.org/officialdocuments/publicdisplaydocumentpdf/?cote=COM/TAD/ENV/JWPTE(2017)3/FINAL&docLanguage=En [Accessed April 2019].
31
80. Organisation for Economic Co-operation and Development. (2019a) Municipal waste, Generation and Treatment (% Recycling). Available from: https://stats.oecd.org/ [Accessed April 2019].
81. Organisation for Economic Co-operation and Development. (2019b) Report
on a set of policy indicators on trade and environment. Available from: http://www.oecd.org/officialdocuments/publicdisplaydocumentpdf/?cote=COM/TAD/ENV/JWPTE(2018)2/FINAL&docLanguage=En [Accessed April 2019].
82. Organization of the Petroleum Exporting Countries. (2019) OPEC Basket
Price. Available from: https://www.opec.org/opec_web/en/data_graphs/40.htm [Accessed April 2019].
83. Plastics News (2019) Historical Resin Pricing. Available from:
https://www.plasticsnews.com/resin/recycled-plastics/historical-pricing [Accessed April 2019].
84. RISI. (2018) Recovered paper Outlook. Available from: https://events.risiinfo
.com/european%2Dconference/sites/default/files/presentations/2018/Rod%20Young_RCP.pdf [Accessed April 2019].
85. Supply Chain Dive. (2018) Majority of companies fall short on sustainable
procurement. Available from: https://www.supplychaindive.com/news/ecovadis-more-attention-sustainable-procurement-CSR/533429/ [Accessed April 2019].
86. The Korea Times. (2018) Gov't aims to reduce plastic waste 50% by 2030.
Available from: http://www.koreatimes.co.kr/www/nation/2018/05/371_248796.html [Accessed April 2019].
87. United Nations Environment Programme. (2017) Global review of
sustainable public procurement 2017. Available from: https://wedocs.unep.org/bitstream/handle/20.500.11822/20919/GlobalReview_Sust_Procurement.pdf?sequence=1&isAllowed=y [Accessed April 2019].
88. Waste Management. (2018) The Battle Against Recycling Contamination is
Everyone's Battle. Available from: http://mediaroom.wm.com/the-battle-against-recycling-contamination-is-everyones-battle/ [Accessed April 2019].
32
89. World Bank. (2018) What a Waste 2.0 – A Global Snapshot of Solid Waste Management to 2050. Available from: http://openknowledge.worldbank.org/bitstream/handle/10986/30317/9781464813290.pdf [Accessed April 2019].
90. World Economic Forum. (2016) The New Plastics Economy – Rethinking
the future of plastics. Available from: http://www3.weforum.org/docs/WEF_The_New_Plastics_Economy.pdf [Accessed April 2019].
91. 中央人民政府:《中共中央 國務院關於全面加強生態環境保護堅決打好污染防治攻堅戰的意見》, 2018年 6月 24日,網 址 : http://www.gov.cn/zhengce/2018-06/24/content_5300953.htm [於 2019年 4月登入 ]。
92. 海 關 總 署 : 《 海 關 總 署 解 讀 " 綠 籬 " 專 項 行 動 》 ,
2013年5月 15日,網址:http://gkml.customs.gov.cn/hefei/tabid/242/ctl/InfoDetail/InfoID/24932/mid/789/Default.aspx?ContainerSrc=%5BG%5DContainers%2F_default%2FNo+Container [於 2019年 4月登入 ]。
93. 國務院:《國務院辦公廳關於印發禁止洋垃圾入境推進固體廢物進口管理制度改革實施方案的通知》, 2017年 7月 27日,網址: http://big5.gov.cn/gate/big5/www.gov.cn/zhengce/content/2017-07/27/content_5213738.htm [於 2019年 4月登入 ]。
Prepared by Sunny LAM Research Office Information Services Division Legislative Council Secretariat 30 April 2019 Tel: 2871 2146 ------------------------------------------------------------------------------------------------------------------------------------------------------------------- Information Notes are compiled for Members and Committees of the Legislative Council. They are not legal or other professional advice and shall not be relied on as such. Information Notes are subject to copyright owned by The Legislative Council Commission (The Commission). The Commission permits accurate reproduction of Information Notes for non-commercial use in a manner not adversely affecting the Legislative Council, provided that acknowledgement is made stating the Research Office of the Legislative Council Secretariat as the source and one copy of the reproduction is sent to the Legislative Council Library. The paper number of this issue of Information Note is IN12/18-19.