Embed Size (px)
Citation preview
50 PCI Journal | March–April 2018
■ The ledge punching-shear capacities predicted by the seventh edition of the PCI Design Handbook: Precast and Prestressed Concrete overestimate the failure loads observed in several previous laboratory tests and analytical studies.
■ This paper presents the results of the second phase of an extensive experimental program conducted to investigate the effects of several parameters, such as global stress and prestressing on the ledge capacity, as well as the effectiveness of selected reinforcement details.
■ The experimental results demonstrate that increas-ing the global stress reduces ledge capacity, while the use of prestressing increases the capacity, as does concentrating the ledge reinforcement at the load location.
L-shaped ledge beams are frequently used by the precast concrete industry to support floor systems such as double-tee beams. The ledges are typically
subjected to heavy concentrated loads with eccentricity and must be carefully designed to effectively transfer these loads to the web of the beam. Generally, these ledges perform satisfactorily when designed by the procedure included in the seventh edition of the PCI Design Handbook: Precast and Prestressed Concrete,1 referred to as the PCI procedure in this paper. However, since 1985, several engineers and researchers have expressed concerns about the procedure be-cause research findings indicate that the PCI procedure may overestimate the punching-shear failure load of the ledge.2–8
In view of such concerns, a comprehensive experimen-tal program and extensive finite element modeling were conducted to develop an improved design procedure for the ledges of L-shaped beams. Research findings of the first phase of the experimental program indicated that even when beams are subjected to relatively low levels of global stress, the PCI procedure can overestimate the ledge capacity under certain conditions.9 The failure surface observed experimen-tally in the first-phase program was generally larger than the surface assumed by the PCI procedure. The first-phase study also investigated several parameters that are not consid-ered by the PCI procedure but were found to influence the behavior and the capacity of the ledge. The first-phase study also examined the performance of several proposed special reinforcement details intended to improve ledge behavior and increase ledge capacity.
Ledge behavior and strength of long-span L-shaped beams
Mohamed K. Nafadi, Gregory W. Lucier, Sami Rizkalla, Paul Zia, and Gary J. Klein

51PCI Journal | March–April 2018
This paper presents the results of a second phase of the exper-imental program that tested nine long-span L-shaped beams under conditions that included high levels of global stress. The main objectives of the second phase of the experimental program were to investigate the following:
• the effect of global stress and prestressing on ledge be-havior and strength
• the effect of key parameters, including the concrete strength and ledge height
• the effect of the spacing between two adjacent loads, particularly with regard to the observed failure surface
• the performance of selected special reinforcement details
The results of the short-span tests conducted in the first-phase program were combined with the results of the long-span tests presented in this paper. These combined results were studied alongside extensive finite element model-ing results and were used to propose a simplified design procedure.10 The proposed procedure was introduced in the eighth edition of the PCI Design Handbook.11 Detailed descriptions of the comprehensive research program are presented in the report by Rizkalla et. al.12
Experimental program
This second phase of the experimental program comprised eight long-span L-shaped beams with 45.5 ft (13.9 m) spans and one beam with a 36.5 ft (11.1 m) span. Most of the beams were fabricated with cross sections similar to those
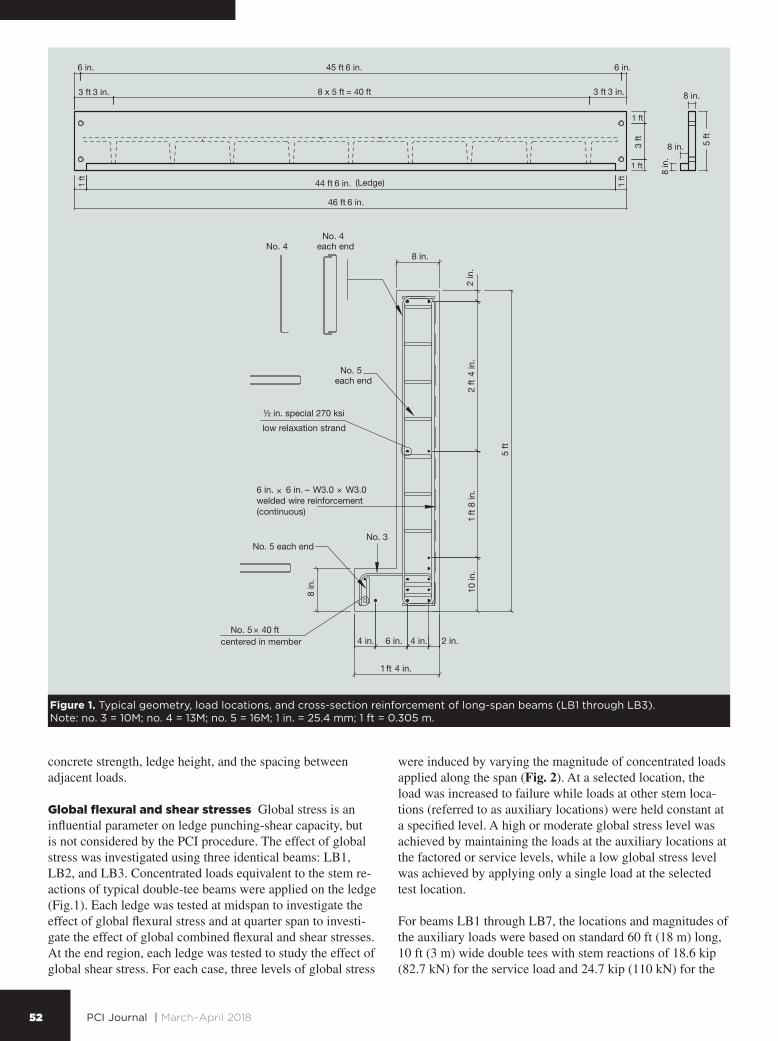
of the short-span beams tested previously.9 Table 1 provides details of the nine tested beams. Figure 1 shows a typical geometry, load locations, and cross-section reinforcement for the long-span beams studied. The first seven beams (LB1 through LB7) had the same web dimensions of 60 × 8 in. (1500 × 200 mm), while the ledge height and projection were both 8 in., except for LB5, which had a ledge height of 10 in. (250 mm). The final two beams (LB8 and LB9) had a web thickness of 10 in. and web heights of 60 and 72 in. (1800 mm), respectively. The ledge projection remained at 8 in. for both of those beams, and the ledge height increased to 12 and 18 in. (300 and 460 mm), respectively. In addition, the span of beam LB9 was 36.5 ft, as opposed to 45.5 ft for all other long beams.
For all test beams, the ledge was cut back 12 in. (300 mm) from both ends of the beam and holes were provided through the web thickness at each end to accommodate attaching the beam to the testing frame with steel rods. All beams were designed to avoid premature failure in modes other than local ledge failure. Each beam was tested to failure at various loca-tions along the span, with supplemental loads applied at other locations to generate selected levels of global stress at the test location. For the first eight beams, the ledge was tested at five locations along the span, including one test at midspan, two tests at the quarter spans, and two tests at the beam ends. For beam LB9, the ledge was tested at three locations, including one test at midspan and one additional test at each beam end.
Test parameters
Five parameters were examined in the experimental program: global flexural and shear stresses, the effect of prestressing,
Table 1. Summary of experimental program on long-span beams
SpecimenDesign concrete
compressive strength fc
' , psiLedge height hl , in.
Prestressed/reinforced
Special detail
LB1
60008
Prestressed L bars turned into the web as is typical with a typical distribution of ledge reinforcement
LB2
LB3
LB4 10,000*
LB5
6000
10*
LB68
Reinforced*
LB7
Prestressed
L bars turned into the ledge*
LB8
8000
12*L bars turned into the ledge with concentrat-ed ledge reinforcement at selected locations*
LB9 18*L bars turned into the web as is typical with a typical distribution of ledge reinforcement
Note: 1 in. = 25.4 mm; 1 psi = 6.895 kPa. * Investigated parameter for each test.
8 x 5 ft = 40 ft3 ft 3 in. 3 ft 3 in.
1 ft
1 ft
3ft 5ft
8 in.
8 in.
44 ft 6 in. (Ledge)
46 ft 6 in.
8 in
.
1ft
1ft
45 ft 6 in.6 in. 6 in.
No. 4 each endNo. 4
8 in.
No. 5 each end
No. 5 each endNo. 3
5ft
2ft
4 in
.1
8 in
.10
in.
1 ft 4 in.
6 in. × 6 in. – W3.0 × W3.0welded wire reinforcement (continuous)
8 in
.
6 in. 4 in.4 in.
2 in
.
2 in.
½ in. special 270 ksi
low relaxation strand
centered in memberNo. 5 × 40 ft
ft
52 PCI Journal | March–April 2018
concrete strength, ledge height, and the spacing between adjacent loads.
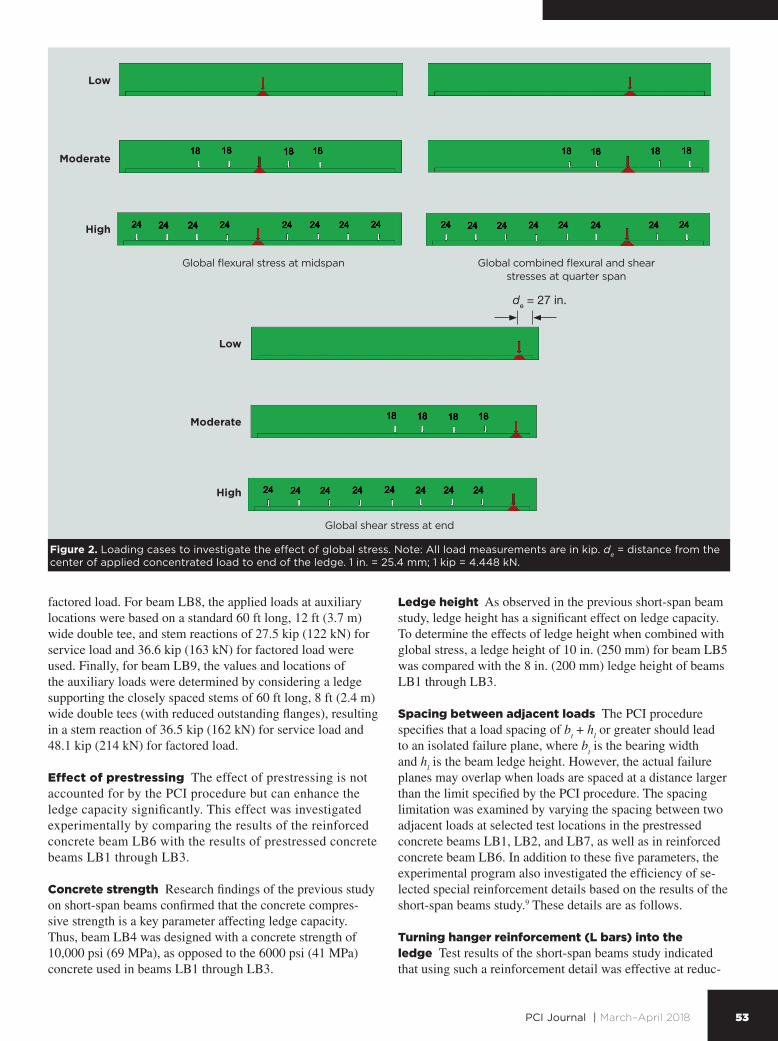
Global flexural and shear stresses Global stress is an influential parameter on ledge punching-shear capacity, but is not considered by the PCI procedure. The effect of global stress was investigated using three identical beams: LB1, LB2, and LB3. Concentrated loads equivalent to the stem re-actions of typical double-tee beams were applied on the ledge (Fig.1). Each ledge was tested at midspan to investigate the effect of global flexural stress and at quarter span to investi-gate the effect of global combined flexural and shear stresses. At the end region, each ledge was tested to study the effect of global shear stress. For each case, three levels of global stress
were induced by varying the magnitude of concentrated loads applied along the span (Fig. 2). At a selected location, the load was increased to failure while loads at other stem loca-tions (referred to as auxiliary locations) were held constant at a specified level. A high or moderate global stress level was achieved by maintaining the loads at the auxiliary locations at the factored or service levels, while a low global stress level was achieved by applying only a single load at the selected test location.
For beams LB1 through LB7, the locations and magnitudes of the auxiliary loads were based on standard 60 ft (18 m) long, 10 ft (3 m) wide double tees with stem reactions of 18.6 kip (82.7 kN) for the service load and 24.7 kip (110 kN) for the
Figure 1. Typical geometry, load locations, and cross-section reinforcement of long-span beams (LB1 through LB3). Note: no. 3 = 10M; no. 4 = 13M; no. 5 = 16M; 1 in. = 25.4 mm; 1 ft = 0.305 m.
53PCI Journal | March–April 2018
Figure 2. Loading cases to investigate the effect of global stress. Note: All load measurements are in kip. de = distance from the center of applied concentrated load to end of the ledge. 1 in. = 25.4 mm; 1 kip = 4.448 kN.
factored load. For beam LB8, the applied loads at auxiliary locations were based on a standard 60 ft long, 12 ft (3.7 m) wide double tee, and stem reactions of 27.5 kip (122 kN) for service load and 36.6 kip (163 kN) for factored load were used. Finally, for beam LB9, the values and locations of the auxiliary loads were determined by considering a ledge supporting the closely spaced stems of 60 ft long, 8 ft (2.4 m) wide double tees (with reduced outstanding flanges), resulting in a stem reaction of 36.5 kip (162 kN) for service load and 48.1 kip (214 kN) for factored load.
Effect of prestressing The effect of prestressing is not accounted for by the PCI procedure but can enhance the ledge capacity significantly. This effect was investigated experimentally by comparing the results of the reinforced concrete beam LB6 with the results of prestressed concrete beams LB1 through LB3.
Concrete strength Research findings of the previous study on short-span beams confirmed that the concrete compres-sive strength is a key parameter affecting ledge capacity. Thus, beam LB4 was designed with a concrete strength of 10,000 psi (69 MPa), as opposed to the 6000 psi (41 MPa) concrete used in beams LB1 through LB3.
Ledge height As observed in the previous short-span beam study, ledge height has a significant effect on ledge capacity. To determine the effects of ledge height when combined with global stress, a ledge height of 10 in. (250 mm) for beam LB5 was compared with the 8 in. (200 mm) ledge height of beams LB1 through LB3.
Spacing between adjacent loads The PCI procedure specifies that a load spacing of b
t + h
l or greater should lead
to an isolated failure plane, where bt is the bearing width
and hl is the beam ledge height. However, the actual failure
planes may overlap when loads are spaced at a distance larger than the limit specified by the PCI procedure. The spacing limitation was examined by varying the spacing between two adjacent loads at selected test locations in the prestressed concrete beams LB1, LB2, and LB7, as well as in reinforced concrete beam LB6. In addition to these five parameters, the experimental program also investigated the efficiency of se-lected special reinforcement details based on the results of the short-span beams study.9 These details are as follows.
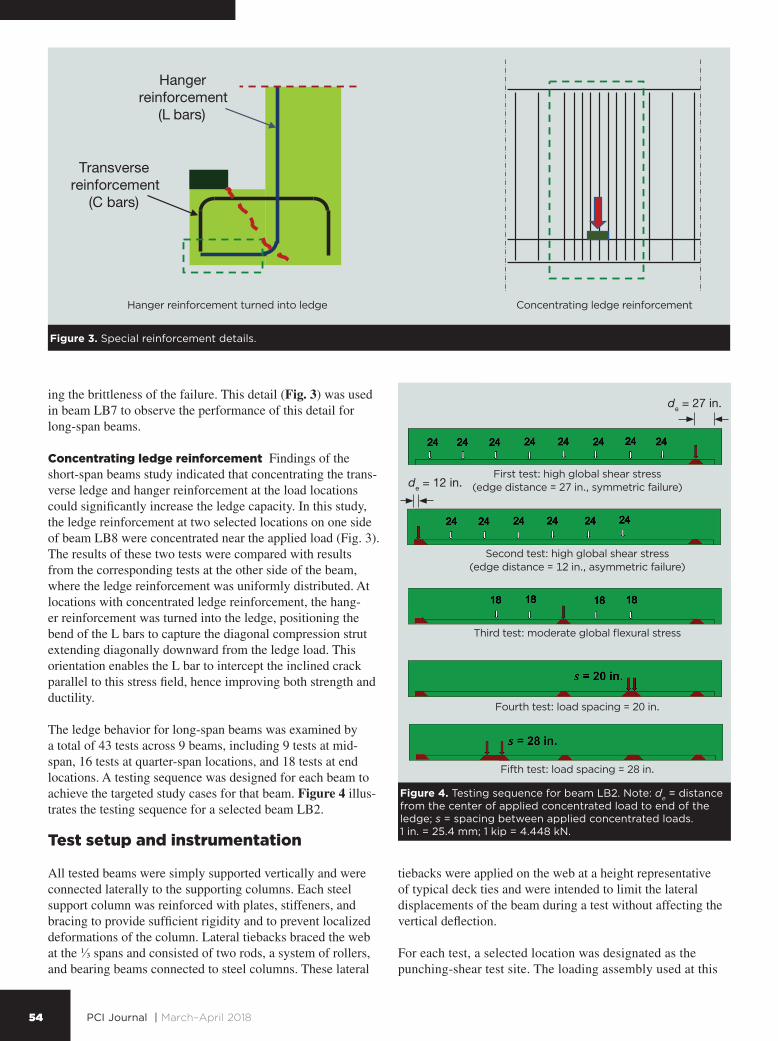
Turning hanger reinforcement (L bars) into the ledge Test results of the short-span beams study indicated that using such a reinforcement detail was effective at reduc-
Low
Low
Moderate
Moderate
High
High
de = 27 in.
Global flexural stress at midspan
Global shear stress at end
Global combined flexural and shear stresses at quarter span
Transverse reinforcement
(C bars)
Hanger reinforcement
(L bars)
54 PCI Journal | March–April 2018
ing the brittleness of the failure. This detail (Fig. 3) was used in beam LB7 to observe the performance of this detail for long-span beams.
Concentrating ledge reinforcement Findings of the short-span beams study indicated that concentrating the trans-verse ledge and hanger reinforcement at the load locations could significantly increase the ledge capacity. In this study, the ledge reinforcement at two selected locations on one side of beam LB8 were concentrated near the applied load (Fig. 3). The results of these two tests were compared with results from the corresponding tests at the other side of the beam, where the ledge reinforcement was uniformly distributed. At locations with concentrated ledge reinforcement, the hang-er reinforcement was turned into the ledge, positioning the bend of the L bars to capture the diagonal compression strut extending diagonally downward from the ledge load. This orientation enables the L bar to intercept the inclined crack parallel to this stress field, hence improving both strength and ductility.
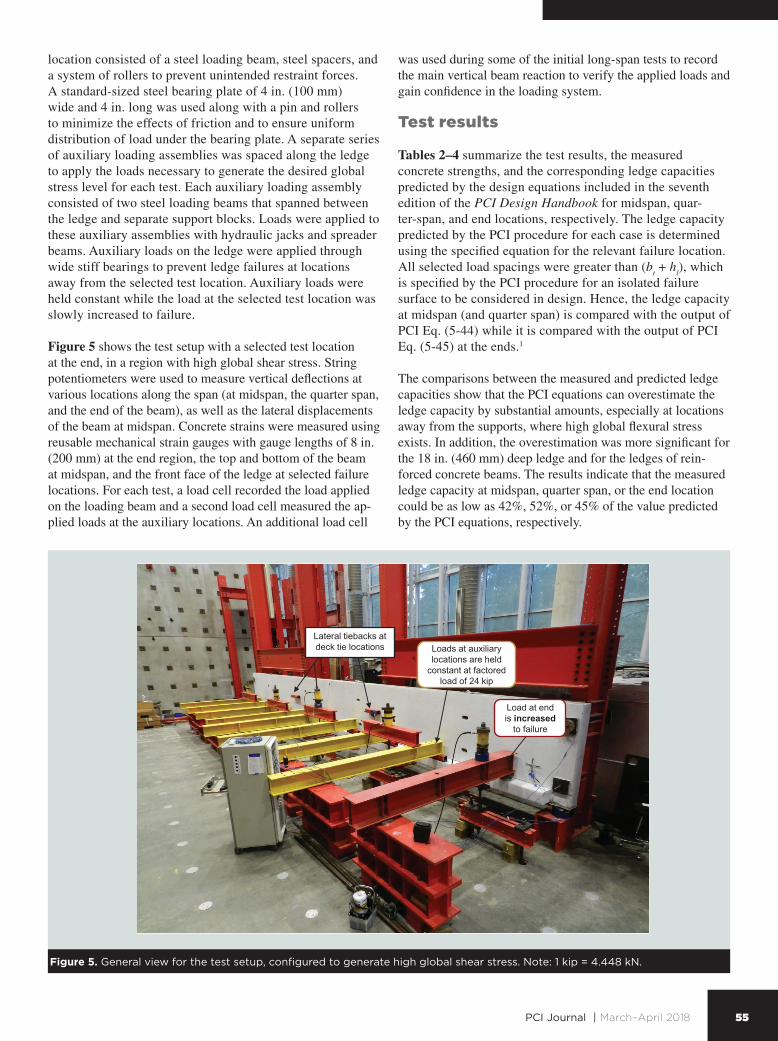
The ledge behavior for long-span beams was examined by a total of 43 tests across 9 beams, including 9 tests at mid-span, 16 tests at quarter-span locations, and 18 tests at end locations. A testing sequence was designed for each beam to achieve the targeted study cases for that beam. Figure 4 illus-trates the testing sequence for a selected beam LB2.
Test setup and instrumentation
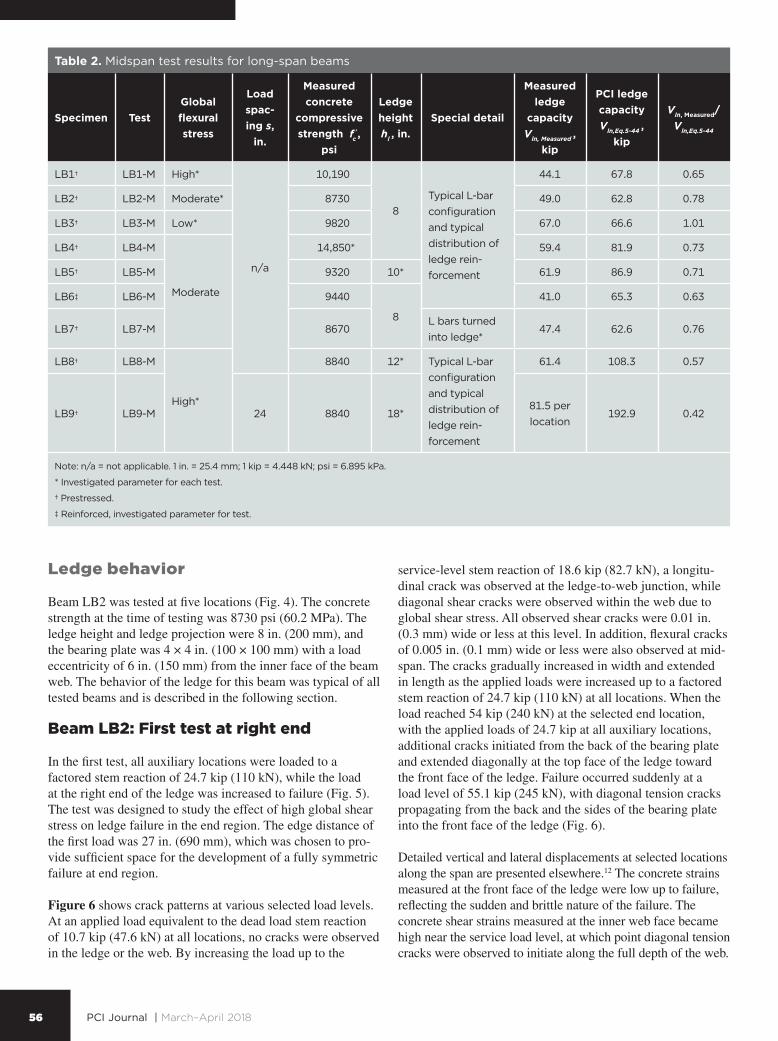
All tested beams were simply supported vertically and were connected laterally to the supporting columns. Each steel support column was reinforced with plates, stiffeners, and bracing to provide sufficient rigidity and to prevent localized deformations of the column. Lateral tiebacks braced the web at the ⅓ spans and consisted of two rods, a system of rollers, and bearing beams connected to steel columns. These lateral
tiebacks were applied on the web at a height representative of typical deck ties and were intended to limit the lateral displacements of the beam during a test without affecting the vertical deflection.
For each test, a selected location was designated as the punching-shear test site. The loading assembly used at this
Figure 3. Special reinforcement details.
Hanger reinforcement turned into ledge Concentrating ledge reinforcement
Figure 4. Testing sequence for beam LB2. Note: de = distance from the center of applied concentrated load to end of the ledge; s = spacing between applied concentrated loads. 1 in. = 25.4 mm; 1 kip = 4.448 kN.
First test: high global shear stress (edge distance = 27 in., symmetric failure)
Second test: high global shear stress (edge distance = 12 in., asymmetric failure)
Third test: moderate global flexural stress
Fourth test: load spacing = 20 in.
Fifth test: load spacing = 28 in.
de = 27 in.
de = 12 in.
Loads at auxiliary locations are held
constant at factored load of 24 kip
Load at end is increased
to failure
Lateral tiebacks at deck tie locations
55PCI Journal | March–April 2018
location consisted of a steel loading beam, steel spacers, and a system of rollers to prevent unintended restraint forces. A standard-sized steel bearing plate of 4 in. (100 mm) wide and 4 in. long was used along with a pin and rollers to minimize the effects of friction and to ensure uniform distribution of load under the bearing plate. A separate series of auxiliary loading assemblies was spaced along the ledge to apply the loads necessary to generate the desired global stress level for each test. Each auxiliary loading assembly consisted of two steel loading beams that spanned between the ledge and separate support blocks. Loads were applied to these auxiliary assemblies with hydraulic jacks and spreader beams. Auxiliary loads on the ledge were applied through wide stiff bearings to prevent ledge failures at locations away from the selected test location. Auxiliary loads were held constant while the load at the selected test location was slowly increased to failure.
Figure 5 shows the test setup with a selected test location at the end, in a region with high global shear stress. String potentiometers were used to measure vertical deflections at various locations along the span (at midspan, the quarter span, and the end of the beam), as well as the lateral displacements of the beam at midspan. Concrete strains were measured using reusable mechanical strain gauges with gauge lengths of 8 in. (200 mm) at the end region, the top and bottom of the beam at midspan, and the front face of the ledge at selected failure locations. For each test, a load cell recorded the load applied on the loading beam and a second load cell measured the ap-plied loads at the auxiliary locations. An additional load cell
was used during some of the initial long-span tests to record the main vertical beam reaction to verify the applied loads and gain confidence in the loading system.
Test results
Tables 2–4 summarize the test results, the measured concrete strengths, and the corresponding ledge capacities predicted by the design equations included in the seventh edition of the PCI Design Handbook for midspan, quar-ter-span, and end locations, respectively. The ledge capacity predicted by the PCI procedure for each case is determined using the specified equation for the relevant failure location. All selected load spacings were greater than (b
t + h
l), which
is specified by the PCI procedure for an isolated failure surface to be considered in design. Hence, the ledge capacity at midspan (and quarter span) is compared with the output of PCI Eq. (5-44) while it is compared with the output of PCI Eq. (5-45) at the ends.1
The comparisons between the measured and predicted ledge capacities show that the PCI equations can overestimate the ledge capacity by substantial amounts, especially at locations away from the supports, where high global flexural stress exists. In addition, the overestimation was more significant for the 18 in. (460 mm) deep ledge and for the ledges of rein-forced concrete beams. The results indicate that the measured ledge capacity at midspan, quarter span, or the end location could be as low as 42%, 52%, or 45% of the value predicted by the PCI equations, respectively.
Figure 5. General view for the test setup, configured to generate high global shear stress. Note: 1 kip = 4.448 kN.
56 PCI Journal | March–April 2018
Ledge behavior
Beam LB2 was tested at five locations (Fig. 4). The concrete strength at the time of testing was 8730 psi (60.2 MPa). The ledge height and ledge projection were 8 in. (200 mm), and the bearing plate was 4 × 4 in. (100 × 100 mm) with a load eccentricity of 6 in. (150 mm) from the inner face of the beam web. The behavior of the ledge for this beam was typical of all tested beams and is described in the following section.
Beam LB2: First test at right end
In the first test, all auxiliary locations were loaded to a factored stem reaction of 24.7 kip (110 kN), while the load at the right end of the ledge was increased to failure (Fig. 5). The test was designed to study the effect of high global shear stress on ledge failure in the end region. The edge distance of the first load was 27 in. (690 mm), which was chosen to pro-vide sufficient space for the development of a fully symmetric failure at end region.
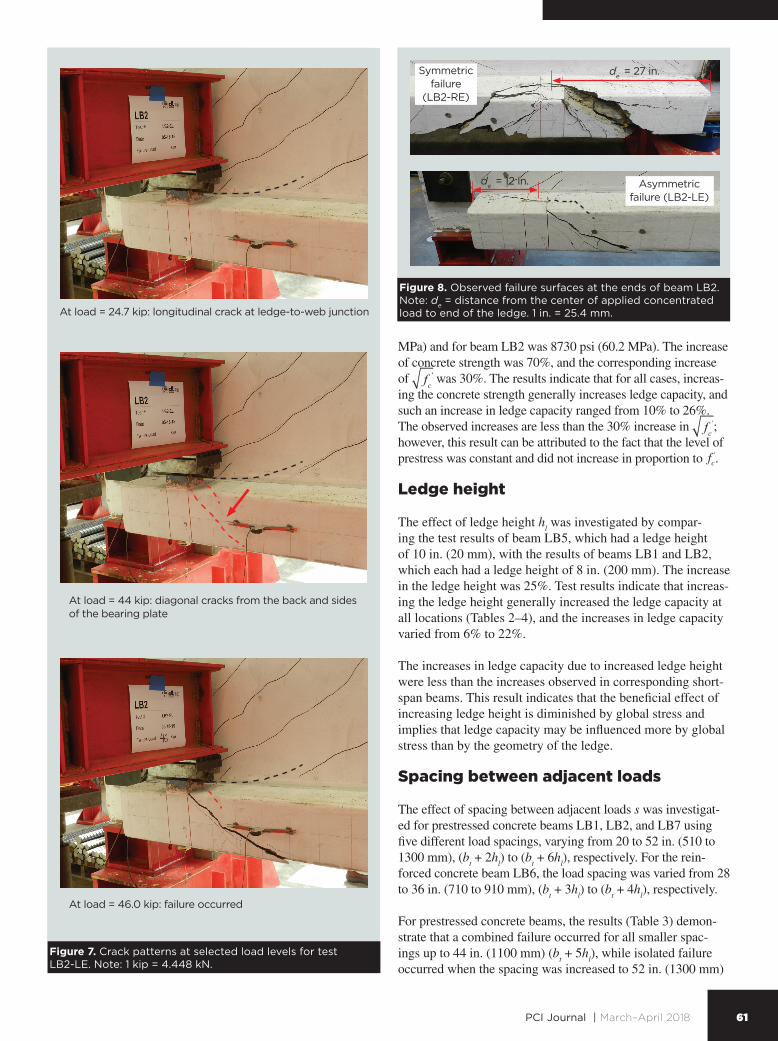
Figure 6 shows crack patterns at various selected load levels. At an applied load equivalent to the dead load stem reaction of 10.7 kip (47.6 kN) at all locations, no cracks were observed in the ledge or the web. By increasing the load up to the
service-level stem reaction of 18.6 kip (82.7 kN), a longitu-dinal crack was observed at the ledge-to-web junction, while diagonal shear cracks were observed within the web due to global shear stress. All observed shear cracks were 0.01 in. (0.3 mm) wide or less at this level. In addition, flexural cracks of 0.005 in. (0.1 mm) wide or less were also observed at mid-span. The cracks gradually increased in width and extended in length as the applied loads were increased up to a factored stem reaction of 24.7 kip (110 kN) at all locations. When the load reached 54 kip (240 kN) at the selected end location, with the applied loads of 24.7 kip at all auxiliary locations, additional cracks initiated from the back of the bearing plate and extended diagonally at the top face of the ledge toward the front face of the ledge. Failure occurred suddenly at a load level of 55.1 kip (245 kN), with diagonal tension cracks propagating from the back and the sides of the bearing plate into the front face of the ledge (Fig. 6).
Detailed vertical and lateral displacements at selected locations along the span are presented elsewhere.12 The concrete strains measured at the front face of the ledge were low up to failure, reflecting the sudden and brittle nature of the failure. The concrete shear strains measured at the inner web face became high near the service load level, at which point diagonal tension cracks were observed to initiate along the full depth of the web.
Table 2. Midspan test results for long-span beams
Specimen TestGlobal flexural stress
Load spac-ing s,
in.
Measured concrete
compressive strength fc
' , psi
Ledge height hl , in.
Special detail
Measured ledge
capacity Vln, Measured ,
kip
PCI ledge capacity Vln,Eq.5-44 ,
kip
Vln, Measured/Vln,Eq.5-44
LB1† LB1-M High*
n/a
10,190
8Typical L-bar configuration and typical distribution of ledge rein-forcement
44.1 67.8 0.65
LB2† LB2-M Moderate* 8730 49.0 62.8 0.78
LB3† LB3-M Low* 9820 67.0 66.6 1.01
LB4† LB4-M
Moderate
14,850* 59.4 81.9 0.73
LB5† LB5-M 9320 10* 61.9 86.9 0.71
LB6‡ LB6-M 9440
8
41.0 65.3 0.63
LB7† LB7-M 8670L bars turned into ledge*
47.4 62.6 0.76
LB8† LB8-M
High*
8840 12* Typical L-bar configuration and typical distribution of ledge rein-forcement
61.4 108.3 0.57
LB9† LB9-M 24 8840 18*81.5 per location
192.9 0.42
Note: n/a = not applicable. 1 in. = 25.4 mm; 1 kip = 4.448 kN; psi = 6.895 kPa.
* Investigated parameter for each test.
† Prestressed.
‡ Reinforced, investigated parameter for test.
57PCI Journal | March–April 2018
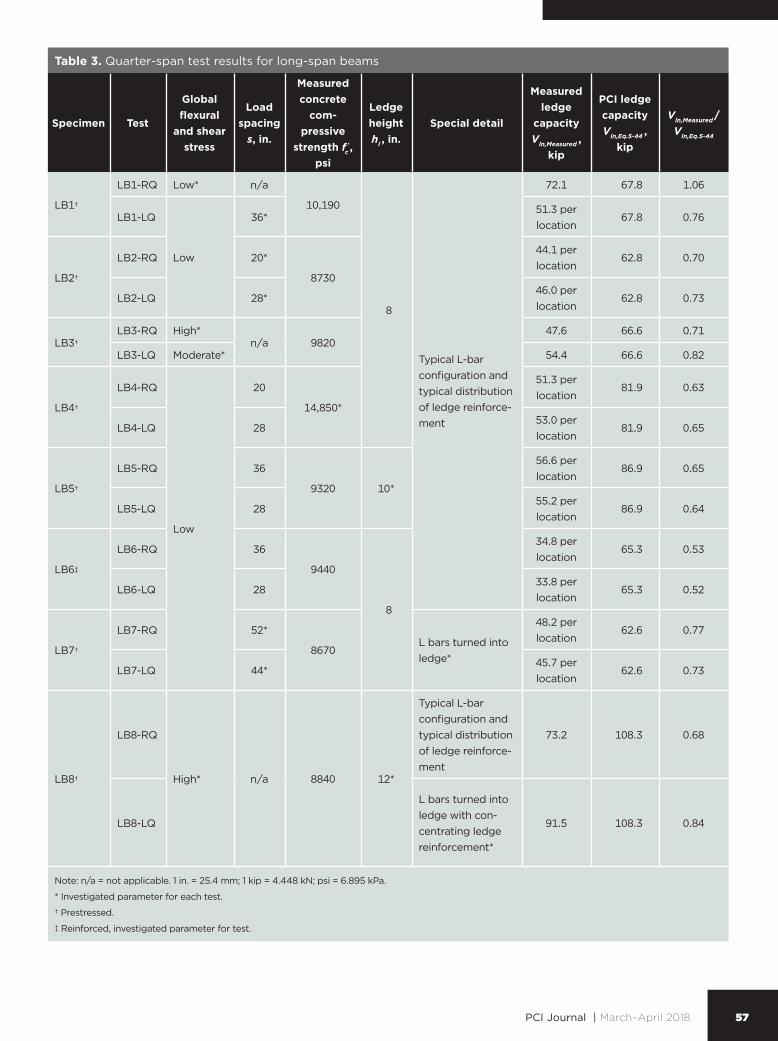
Table 3. Quarter-span test results for long-span beams
Specimen Test
Global flexural
and shear stress
Load spacing
s, in.
Measured concrete
com-pressive
strength fc' ,
psi
Ledge height hl , in.
Special detail
Measured ledge
capacity Vln,Measured ,
kip
PCI ledge capacity Vln,Eq.5-44 ,
kip
Vln,Measured/Vln,Eq.5-44
LB1†
LB1-RQ Low* n/a
10,190
8
Typical L-bar configuration and typical distribution of ledge reinforce-ment
72.1 67.8 1.06
LB1-LQ
Low
36*51.3 per location
67.8 0.76
LB2†
LB2-RQ 20*
8730
44.1 per location
62.8 0.70
LB2-LQ 28*46.0 per location
62.8 0.73
LB3†LB3-RQ High*
n/a 982047.6 66.6 0.71
LB3-LQ Moderate* 54.4 66.6 0.82
LB4†
LB4-RQ
Low
20
14,850*
51.3 per location
81.9 0.63
LB4-LQ 2853.0 per location
81.9 0.65
LB5†
LB5-RQ 36
9320 10*
56.6 per location
86.9 0.65
LB5-LQ 2855.2 per location
86.9 0.64
LB6‡
LB6-RQ 36
9440
8
34.8 per location
65.3 0.53
LB6-LQ 2833.8 per location
65.3 0.52
LB7†
LB7-RQ 52*
8670L bars turned into ledge*
48.2 per location
62.6 0.77
LB7-LQ 44*45.7 per location
62.6 0.73
LB8†
LB8-RQ
High* n/a 8840 12*
Typical L-bar configuration and typical distribution of ledge reinforce-ment
73.2 108.3 0.68
LB8-LQ
L bars turned into ledge with con-centrating ledge reinforcement*
91.5 108.3 0.84
Note: n/a = not applicable. 1 in. = 25.4 mm; 1 kip = 4.448 kN; psi = 6.895 kPa.
* Investigated parameter for each test.
† Prestressed.
‡ Reinforced, investigated parameter for test.
58 PCI Journal | March–April 2018
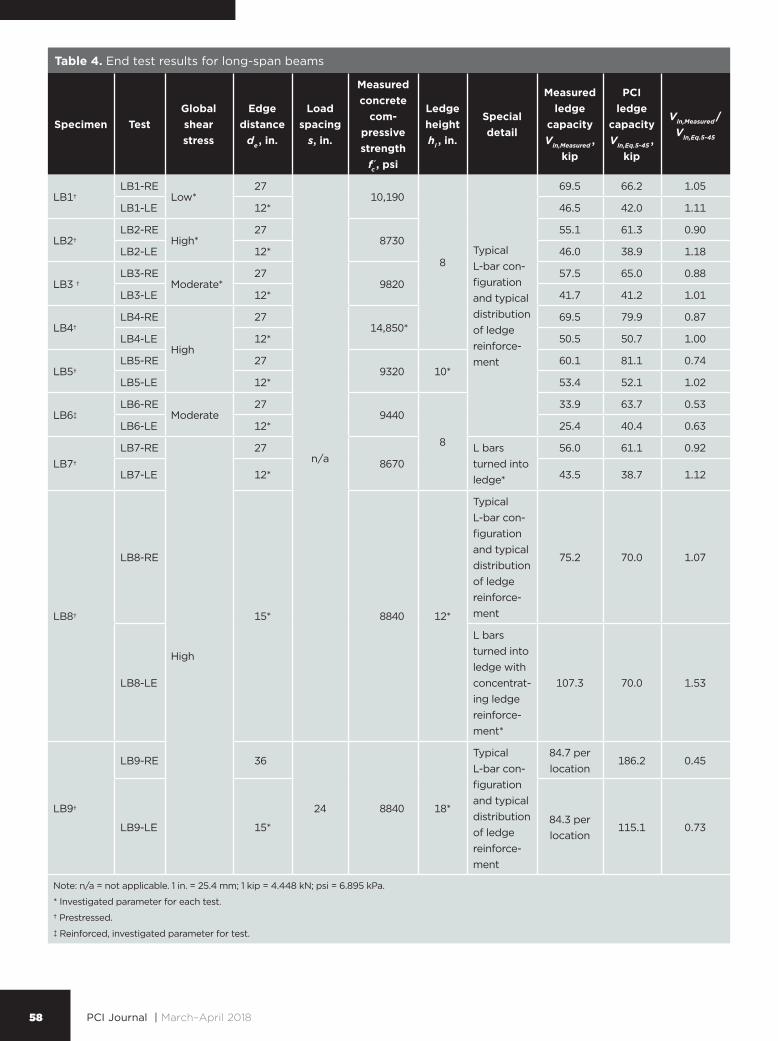
Table 4. End test results for long-span beams
Specimen TestGlobal shear stress
Edge distance
de , in.
Load spacing
s, in.
Measured concrete
com-pressive strength
fc' , psi
Ledge height hl , in.
Special detail
Measured ledge
capacity Vln,Measured ,
kip
PCI ledge
capacity Vln,Eq.5-45 ,
kip
Vln,Measured/ Vln,Eq.5-45
LB1†LB1-RE
Low*27
n/a
10,190
8Typical L-bar con-figuration and typical distribution of ledge reinforce-ment
69.5 66.2 1.05
LB1-LE 12* 46.5 42.0 1.11
LB2†LB2-RE
High*27
873055.1 61.3 0.90
LB2-LE 12* 46.0 38.9 1.18
LB3 †LB3-RE
Moderate*27
982057.5 65.0 0.88
LB3-LE 12* 41.7 41.2 1.01
LB4†LB4-RE
High
2714,850*
69.5 79.9 0.87
LB4-LE 12* 50.5 50.7 1.00
LB5†LB5-RE 27
9320 10*60.1 81.1 0.74
LB5-LE 12* 53.4 52.1 1.02
LB6‡LB6-RE
Moderate27
9440
8
33.9 63.7 0.53
LB6-LE 12* 25.4 40.4 0.63
LB7†
LB7-RE
High
278670
L bars turned into ledge*
56.0 61.1 0.92
LB7-LE 12* 43.5 38.7 1.12
LB8†
LB8-RE
15* 8840 12*
Typical L-bar con-figuration and typical distribution of ledge reinforce-ment
75.2 70.0 1.07
LB8-LE
L bars turned into ledge with concentrat-ing ledge reinforce-ment*
107.3 70.0 1.53
LB9†
LB9-RE 36
24 8840 18*
Typical L-bar con-figuration and typical distribution of ledge reinforce-ment
84.7 per location
186.2 0.45
LB9-LE 15*84.3 per location
115.1 0.73
Note: n/a = not applicable. 1 in. = 25.4 mm; 1 kip = 4.448 kN; psi = 6.895 kPa.
* Investigated parameter for each test.
† Prestressed.
‡ Reinforced, investigated parameter for test.
59PCI Journal | March–April 2018
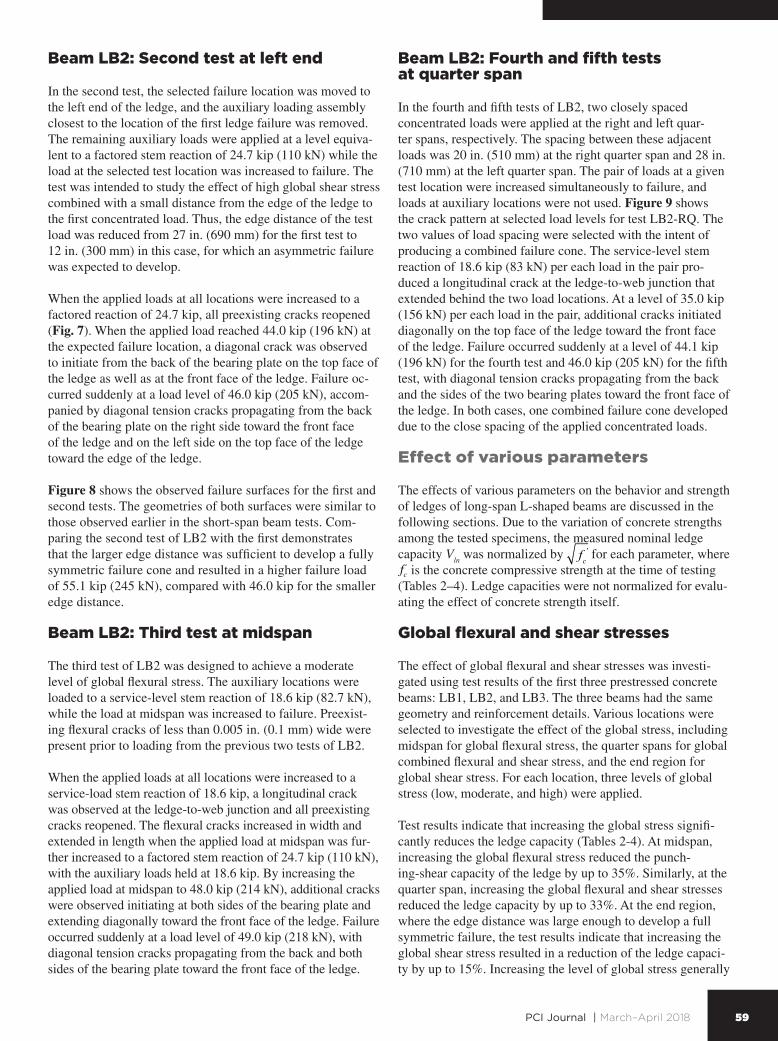
Beam LB2: Second test at left end
In the second test, the selected failure location was moved to the left end of the ledge, and the auxiliary loading assembly closest to the location of the first ledge failure was removed. The remaining auxiliary loads were applied at a level equiva-lent to a factored stem reaction of 24.7 kip (110 kN) while the load at the selected test location was increased to failure. The test was intended to study the effect of high global shear stress combined with a small distance from the edge of the ledge to the first concentrated load. Thus, the edge distance of the test load was reduced from 27 in. (690 mm) for the first test to 12 in. (300 mm) in this case, for which an asymmetric failure was expected to develop.
When the applied loads at all locations were increased to a factored reaction of 24.7 kip, all preexisting cracks reopened (Fig. 7). When the applied load reached 44.0 kip (196 kN) at the expected failure location, a diagonal crack was observed to initiate from the back of the bearing plate on the top face of the ledge as well as at the front face of the ledge. Failure oc-curred suddenly at a load level of 46.0 kip (205 kN), accom-panied by diagonal tension cracks propagating from the back of the bearing plate on the right side toward the front face of the ledge and on the left side on the top face of the ledge toward the edge of the ledge.
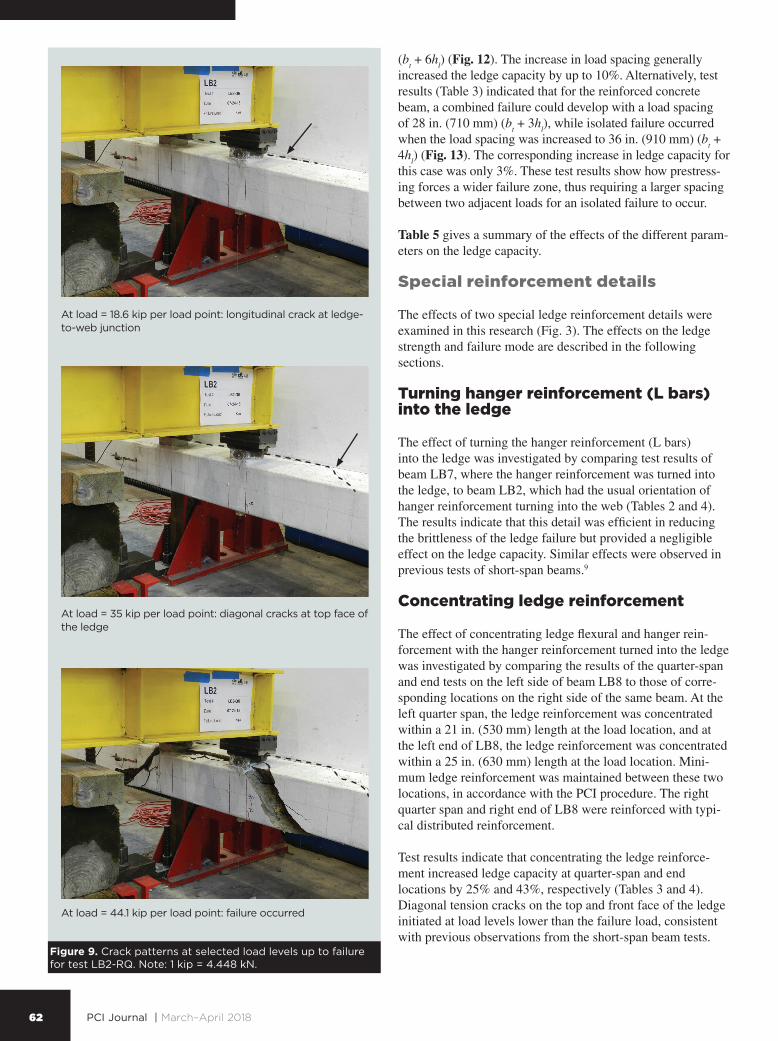
Figure 8 shows the observed failure surfaces for the first and second tests. The geometries of both surfaces were similar to those observed earlier in the short-span beam tests. Com-paring the second test of LB2 with the first demonstrates that the larger edge distance was sufficient to develop a fully symmetric failure cone and resulted in a higher failure load of 55.1 kip (245 kN), compared with 46.0 kip for the smaller edge distance.
Beam LB2: Third test at midspan
The third test of LB2 was designed to achieve a moderate level of global flexural stress. The auxiliary locations were loaded to a service-level stem reaction of 18.6 kip (82.7 kN), while the load at midspan was increased to failure. Preexist-ing flexural cracks of less than 0.005 in. (0.1 mm) wide were present prior to loading from the previous two tests of LB2.
When the applied loads at all locations were increased to a service-load stem reaction of 18.6 kip, a longitudinal crack was observed at the ledge-to-web junction and all preexisting cracks reopened. The flexural cracks increased in width and extended in length when the applied load at midspan was fur-ther increased to a factored stem reaction of 24.7 kip (110 kN), with the auxiliary loads held at 18.6 kip. By increasing the applied load at midspan to 48.0 kip (214 kN), additional cracks were observed initiating at both sides of the bearing plate and extending diagonally toward the front face of the ledge. Failure occurred suddenly at a load level of 49.0 kip (218 kN), with diagonal tension cracks propagating from the back and both sides of the bearing plate toward the front face of the ledge.
Beam LB2: Fourth and fifth tests at quarter span
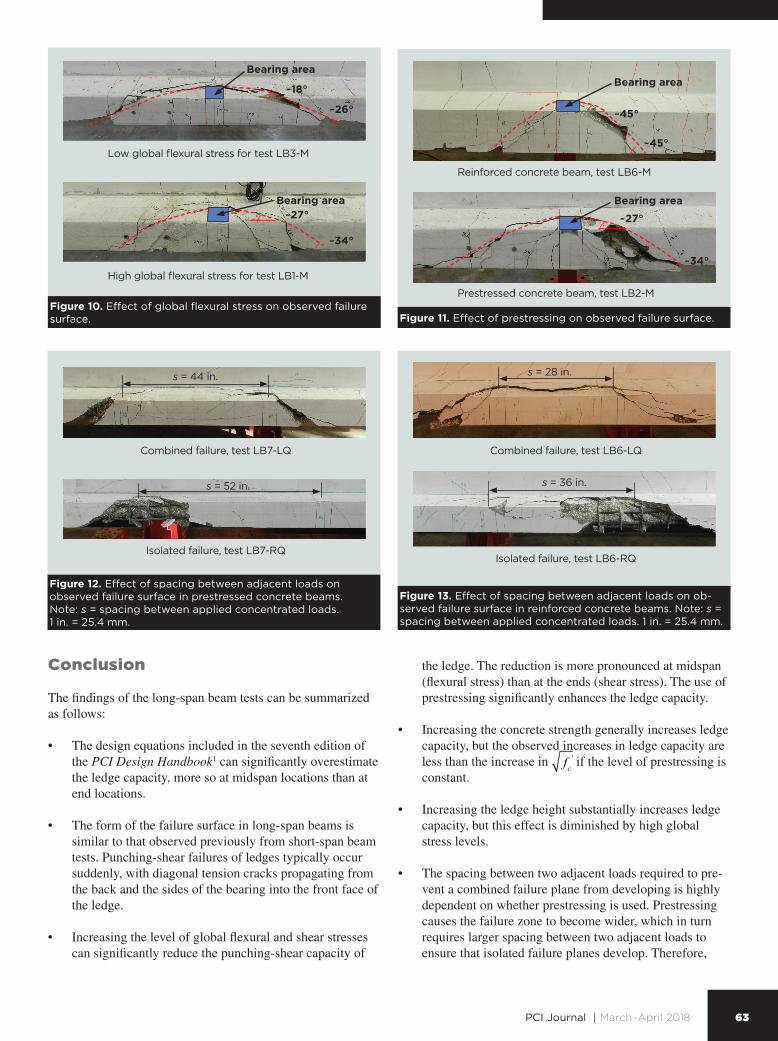
In the fourth and fifth tests of LB2, two closely spaced concentrated loads were applied at the right and left quar-ter spans, respectively. The spacing between these adjacent loads was 20 in. (510 mm) at the right quarter span and 28 in. (710 mm) at the left quarter span. The pair of loads at a given test location were increased simultaneously to failure, and loads at auxiliary locations were not used. Figure 9 shows the crack pattern at selected load levels for test LB2-RQ. The two values of load spacing were selected with the intent of producing a combined failure cone. The service-level stem reaction of 18.6 kip (83 kN) per each load in the pair pro-duced a longitudinal crack at the ledge-to-web junction that extended behind the two load locations. At a level of 35.0 kip (156 kN) per each load in the pair, additional cracks initiated diagonally on the top face of the ledge toward the front face of the ledge. Failure occurred suddenly at a level of 44.1 kip (196 kN) for the fourth test and 46.0 kip (205 kN) for the fifth test, with diagonal tension cracks propagating from the back and the sides of the two bearing plates toward the front face of the ledge. In both cases, one combined failure cone developed due to the close spacing of the applied concentrated loads.
Effect of various parameters
The effects of various parameters on the behavior and strength of ledges of long-span L-shaped beams are discussed in the following sections. Due to the variation of concrete strengths among the tested specimens, the measured nominal ledge capacity V
ln was normalized by fc
' for each parameter, where fc
' is the concrete compressive strength at the time of testing (Tables 2–4). Ledge capacities were not normalized for evalu-ating the effect of concrete strength itself.
Global flexural and shear stresses
The effect of global flexural and shear stresses was investi-gated using test results of the first three prestressed concrete beams: LB1, LB2, and LB3. The three beams had the same geometry and reinforcement details. Various locations were selected to investigate the effect of the global stress, including midspan for global flexural stress, the quarter spans for global combined flexural and shear stress, and the end region for global shear stress. For each location, three levels of global stress (low, moderate, and high) were applied.
Test results indicate that increasing the global stress signifi-cantly reduces the ledge capacity (Tables 2-4). At midspan, increasing the global flexural stress reduced the punch-ing-shear capacity of the ledge by up to 35%. Similarly, at the quarter span, increasing the global flexural and shear stresses reduced the ledge capacity by up to 33%. At the end region, where the edge distance was large enough to develop a full symmetric failure, the test results indicate that increasing the global shear stress resulted in a reduction of the ledge capaci-ty by up to 15%. Increasing the level of global stress generally
60 PCI Journal | March–April 2018
reduces ledge capacity, and such a reduction is more pro-nounced at midspan than at an end region. Observations from the experimental program also indicate that increasing global stress resulted in an increase of the slope of shear cracks and, consequently, a decrease of the overall size of the failure surface (Fig. 10). Such a feature is consistent with modified compression field theory, where the angle of shear cracks is a function of the axial normal strain and the applied shear stress at the section. Thus, increasing the applied global flexural stress at midspan or increasing the applied global shear stress at the end region generally results in steeper angles of shear cracking in the ledge.
Effect of prestressing
The effect of prestressing can be examined by comparing the test results of reinforced concrete beam LB6 to those of prestressed concrete beams LB1 through LB3. All beams had the same ledge geometry and reinforcement.
The comparison shows that prestressing significantly en-hanced the ledge capacity at all locations (Tables 2–4). The increase in ledge capacity ranged from 24% to 66%, depend-ing on the location and the loading case for each test. Such an increase is attributed to the influence of the axial compressive stress induced by prestressing, which delays concrete crack-ing and provides further stiffening for the ledge. The normal compression strain produced by the prestressing generally results in flatter angles of shear cracking, and consequently, the overall size of the failure surface increases compared with the failure surfaces observed in reinforced concrete beams (Fig. 11).
Concrete strength
The effect of concrete compressive strength fc' was evaluated by
comparing the results of five tests of beam LB4 with the results of corresponding tests of beam LB2 (Tables 2–4). The measured fc
' at the time of testing for beam LB4 was 14,850 psi (102.4
Figure 6. Crack patterns at selected load levels up to failure for test LB2-RE. Note: 1 kip = 4.448 kN.
At load = 18.6 kip: longitudinal crack at ledge-to-web junction
At load = 54 kip: diagonal cracks from the back of the bearing plate
At load = 55.1 kip: failure occurred
At load = 24.7 kip: shear cracks at end
61PCI Journal | March–April 2018
Figure 7. Crack patterns at selected load levels for test LB2-LE. Note: 1 kip = 4.448 kN.
At load = 24.7 kip: longitudinal crack at ledge-to-web junction
At load = 44 kip: diagonal cracks from the back and sides of the bearing plate
At load = 46.0 kip: failure occurred
Figure 8. Observed failure surfaces at the ends of beam LB2. Note: de = distance from the center of applied concentrated load to end of the ledge. 1 in. = 25.4 mm.
de = 27 in.
de = 12 in.
Symmetric failure
(LB2-RE)
Asymmetric failure (LB2-LE)
MPa) and for beam LB2 was 8730 psi (60.2 MPa). The increase of concrete strength was 70%, and the corresponding increase of fc
' was 30%. The results indicate that for all cases, increas-ing the concrete strength generally increases ledge capacity, and such an increase in ledge capacity ranged from 10% to 26%. The observed increases are less than the 30% increase in fc
'; however, this result can be attributed to the fact that the level of prestress was constant and did not increase in proportion to fc
'.
Ledge height
The effect of ledge height hl was investigated by compar-
ing the test results of beam LB5, which had a ledge height of 10 in. (20 mm), with the results of beams LB1 and LB2, which each had a ledge height of 8 in. (200 mm). The increase in the ledge height was 25%. Test results indicate that increas-ing the ledge height generally increased the ledge capacity at all locations (Tables 2–4), and the increases in ledge capacity varied from 6% to 22%.
The increases in ledge capacity due to increased ledge height were less than the increases observed in corresponding short-span beams. This result indicates that the beneficial effect of increasing ledge height is diminished by global stress and implies that ledge capacity may be influenced more by global stress than by the geometry of the ledge.
Spacing between adjacent loads
The effect of spacing between adjacent loads s was investigat-ed for prestressed concrete beams LB1, LB2, and LB7 using five different load spacings, varying from 20 to 52 in. (510 to 1300 mm), (b
t + 2h
l) to (b
t + 6h
l), respectively. For the rein-
forced concrete beam LB6, the load spacing was varied from 28 to 36 in. (710 to 910 mm), (b
t + 3h
l) to (b
t + 4h
l), respectively.
For prestressed concrete beams, the results (Table 3) demon-strate that a combined failure occurred for all smaller spac-ings up to 44 in. (1100 mm) (b
t + 5h
l), while isolated failure
occurred when the spacing was increased to 52 in. (1300 mm)
62 PCI Journal | March–April 2018
(bt + 6h
l) (Fig. 12). The increase in load spacing generally
increased the ledge capacity by up to 10%. Alternatively, test results (Table 3) indicated that for the reinforced concrete beam, a combined failure could develop with a load spacing of 28 in. (710 mm) (b
t + 3h
l), while isolated failure occurred
when the load spacing was increased to 36 in. (910 mm) (bt +
4hl) (Fig. 13). The corresponding increase in ledge capacity for
this case was only 3%. These test results show how prestress-ing forces a wider failure zone, thus requiring a larger spacing between two adjacent loads for an isolated failure to occur.
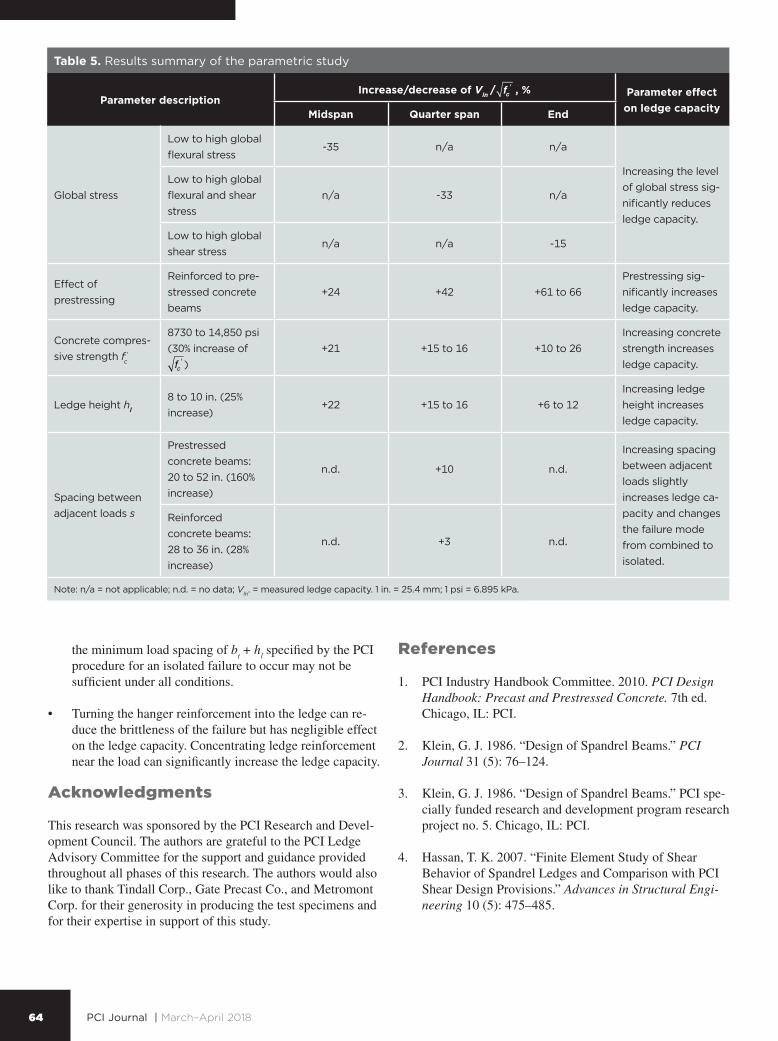
Table 5 gives a summary of the effects of the different param-eters on the ledge capacity.
Special reinforcement details
The effects of two special ledge reinforcement details were examined in this research (Fig. 3). The effects on the ledge strength and failure mode are described in the following sections.
Turning hanger reinforcement (L bars) into the ledge
The effect of turning the hanger reinforcement (L bars) into the ledge was investigated by comparing test results of beam LB7, where the hanger reinforcement was turned into the ledge, to beam LB2, which had the usual orientation of hanger reinforcement turning into the web (Tables 2 and 4). The results indicate that this detail was efficient in reducing the brittleness of the ledge failure but provided a negligible effect on the ledge capacity. Similar effects were observed in previous tests of short-span beams.9
Concentrating ledge reinforcement
The effect of concentrating ledge flexural and hanger rein-forcement with the hanger reinforcement turned into the ledge was investigated by comparing the results of the quarter-span and end tests on the left side of beam LB8 to those of corre-sponding locations on the right side of the same beam. At the left quarter span, the ledge reinforcement was concentrated within a 21 in. (530 mm) length at the load location, and at the left end of LB8, the ledge reinforcement was concentrated within a 25 in. (630 mm) length at the load location. Mini-mum ledge reinforcement was maintained between these two locations, in accordance with the PCI procedure. The right quarter span and right end of LB8 were reinforced with typi-cal distributed reinforcement.
Test results indicate that concentrating the ledge reinforce-ment increased ledge capacity at quarter-span and end locations by 25% and 43%, respectively (Tables 3 and 4). Diagonal tension cracks on the top and front face of the ledge initiated at load levels lower than the failure load, consistent with previous observations from the short-span beam tests.
Figure 9. Crack patterns at selected load levels up to failure for test LB2-RQ. Note: 1 kip = 4.448 kN.
At load = 18.6 kip per load point: longitudinal crack at ledge-to-web junction
At load = 35 kip per load point: diagonal cracks at top face of the ledge
At load = 44.1 kip per load point: failure occurred
63PCI Journal | March–April 2018
Conclusion
The findings of the long-span beam tests can be summarized as follows:
• The design equations included in the seventh edition of the PCI Design Handbook1 can significantly overestimate the ledge capacity, more so at midspan locations than at end locations.
• The form of the failure surface in long-span beams is similar to that observed previously from short-span beam tests. Punching-shear failures of ledges typically occur suddenly, with diagonal tension cracks propagating from the back and the sides of the bearing into the front face of the ledge.
• Increasing the level of global flexural and shear stresses can significantly reduce the punching-shear capacity of
the ledge. The reduction is more pronounced at midspan (flexural stress) than at the ends (shear stress). The use of prestressing significantly enhances the ledge capacity.
• Increasing the concrete strength generally increases ledge capacity, but the observed increases in ledge capacity are less than the increase in fc
' if the level of prestressing is constant.
• Increasing the ledge height substantially increases ledge capacity, but this effect is diminished by high global stress levels.
• The spacing between two adjacent loads required to pre-vent a combined failure plane from developing is highly dependent on whether prestressing is used. Prestressing causes the failure zone to become wider, which in turn requires larger spacing between two adjacent loads to ensure that isolated failure planes develop. Therefore,
Figure 10. Effect of global flexural stress on observed failure surface. Figure 11. Effect of prestressing on observed failure surface.
Bearing areaBearing area
~18°
~45°~26°
~45°
Bearing area Bearing area~27° ~27°
~34°
~34°
Low global flexural stress for test LB3-M
Reinforced concrete beam, test LB6-M
High global flexural stress for test LB1-M
Prestressed concrete beam, test LB2-M
Figure 12. Effect of spacing between adjacent loads on observed failure surface in prestressed concrete beams. Note: s = spacing between applied concentrated loads. 1 in. = 25.4 mm.
Combined failure, test LB7-LQ
s = 44 in.
s = 52 in.
Isolated failure, test LB7-RQ
Figure 13. Effect of spacing between adjacent loads on ob-served failure surface in reinforced concrete beams. Note: s = spacing between applied concentrated loads. 1 in. = 25.4 mm.
Combined failure, test LB6-LQ
s = 28 in.
s = 36 in.
Isolated failure, test LB6-RQ
64 PCI Journal | March–April 2018
Table 5. Results summary of the parametric study
Parameter descriptionIncrease/decrease of Vln / fc' , % Parameter effect
on ledge capacityMidspan Quarter span End
Global stress
Low to high global flexural stress
-35 n/a n/a
Increasing the level of global stress sig-nificantly reduces ledge capacity.
Low to high global flexural and shear stress
n/a -33 n/a
Low to high global shear stress
n/a n/a -15
Effect of prestressing
Reinforced to pre-stressed concrete beams
+24 +42 +61 to 66Prestressing sig-nificantly increases ledge capacity.
Concrete compres-sive strength fc
'
8730 to 14,850 psi (30% increase of fc' )
+21 +15 to 16 +10 to 26Increasing concrete strength increases ledge capacity.
Ledge height hl
8 to 10 in. (25% increase)
+22 +15 to 16 +6 to 12Increasing ledge height increases ledge capacity.
Spacing between adjacent loads s
Prestressed concrete beams: 20 to 52 in. (160% increase)
n.d. +10 n.d.
Increasing spacing between adjacent loads slightly increases ledge ca-pacity and changes the failure mode from combined to isolated.
Reinforced concrete beams: 28 to 36 in. (28% increase)
n.d. +3 n.d.
Note: n/a = not applicable; n.d. = no data; Vln. = measured ledge capacity. 1 in. = 25.4 mm; 1 psi = 6.895 kPa.
the minimum load spacing of bt + h
l specified by the PCI
procedure for an isolated failure to occur may not be sufficient under all conditions.
• Turning the hanger reinforcement into the ledge can re-duce the brittleness of the failure but has negligible effect on the ledge capacity. Concentrating ledge reinforcement near the load can significantly increase the ledge capacity.
Acknowledgments
This research was sponsored by the PCI Research and Devel-opment Council. The authors are grateful to the PCI Ledge Advisory Committee for the support and guidance provided throughout all phases of this research. The authors would also like to thank Tindall Corp., Gate Precast Co., and Metromont Corp. for their generosity in producing the test specimens and for their expertise in support of this study.
References
1. PCI Industry Handbook Committee. 2010. PCI Design Handbook: Precast and Prestressed Concrete. 7th ed. Chicago, IL: PCI.
2. Klein, G. J. 1986. “Design of Spandrel Beams.” PCI Journal 31 (5): 76–124.
3. Klein, G. J. 1986. “Design of Spandrel Beams.” PCI spe-cially funded research and development program research project no. 5. Chicago, IL: PCI.
4. Hassan, T. K. 2007. “Finite Element Study of Shear Behavior of Spandrel Ledges and Comparison with PCI Shear Design Provisions.” Advances in Structural Engi-neering 10 (5): 475–485.
65PCI Journal | March–April 2018
5. Lucier, G., C. Walter, S. Rizkalla, P. Zia, and G. Klein. 2011. “Development of a Rational Design Methodology for Precast Concrete Slender Spandrel Beams: Part 1, Experimental Results.” PCI Journal 56 (2): 88–112.
6. Lucier, G., C. Walter, S. Rizkalla, P. Zia, and G. Klein. 2011. “Development of a Rational Design Methodology for Precast Concrete Slender Spandrel Beams: Part 2, Analysis and Design Guidelines.” PCI Journal 56 (4): 106–133.
7. Lucier, G., C. Walter, S. Rizkalla, P. Zia, and G. Klein. 2010. “Development of a Rational Design Methodology for Precast Concrete Slender Spandrel Beams.” Tech-nical report IS-09-10. North Carolina State University, Raleigh, NC.
8. Logan, D. R. 2012. “Development of a Rational Design Methodology for Precast Slender Spandrel Beam.” Dis-cussion. PCI Journal 57 (2): 182–187.
9. Nafadi, M. K., O. M. Khalafalla, G. W. Lucier, S. Rizkalla, P. Zia, and G. J. Klein. “Ledge Behavior and Strength of Short-Span L-Shaped Beams.” PCI Journal 63 (2): 67–86.
10. Nafadi, M. K., G. W. Lucier, S. Rizkalla, P. Zia, and G. J. Klein. “Development of Design Guidelines for Ledges of L-Shaped Beams.” PCI Journal 63 (2): 32–49.
11. PCI Industry Handbook Committee. 2017. PCI Design Handbook: Precast and Prestressed Concrete. 8th ed. Chicago, IL: PCI.
12. Rizkalla, S., M. Nafadi, G. Lucier, P. Zia, and G. Klein. 2016. “Behavior and Design of Directly-Loaded L-Shaped Beam Ledges.” Technical report RD-16-03. North Carolina State University, Raleigh, NC.
Notation
bt = the width of the double-tee stem or the width of
the bearing pad, whichever is less
de = distance from the center of applied concentrated
load to end of the ledge
fc' = concrete compressive strength
hl = height of beam ledge
s = spacing between applied concentrated loads
Vln = nominal ledge capacity (V
n in section 5.5 of sev-
enth edition of the PCI Design Handbook)
Vln,Eq.5-44
= nominal ledge capacity according to equation 5-44 in section 5.5 of seventh edition of the PCI Design Handbook
Vln,Eq.5-45
= nominal ledge capacity according to equation 5-45 in section 5.5 of seventh edition of the PCI Design Handbook
Vln,Measured
= measured nominal ledge capacity
66 PCI Journal | March–April 2018
About the authors
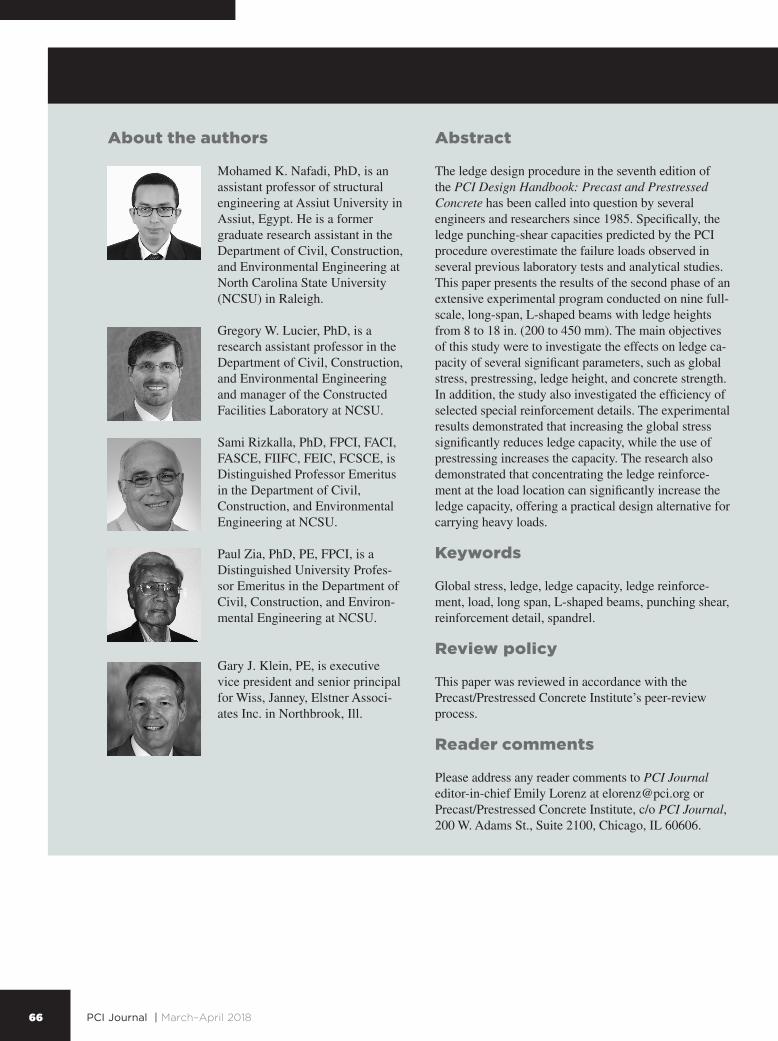
Mohamed K. Nafadi, PhD, is an assistant professor of structural engineering at Assiut University in Assiut, Egypt. He is a former graduate research assistant in the Department of Civil, Construction, and Environmental Engineering at North Carolina State University (NCSU) in Raleigh.
Gregory W. Lucier, PhD, is a research assistant professor in the Department of Civil, Construction, and Environmental Engineering and manager of the Constructed Facilities Laboratory at NCSU.
Sami Rizkalla, PhD, FPCI, FACI, FASCE, FIIFC, FEIC, FCSCE, is Distinguished Professor Emeritus in the Department of Civil, Construction, and Environmental Engineering at NCSU.
Paul Zia, PhD, PE, FPCI, is a Distinguished University Profes-sor Emeritus in the Department of Civil, Construction, and Environ-mental Engineering at NCSU.
Gary J. Klein, PE, is executive vice president and senior principal for Wiss, Janney, Elstner Associ-ates Inc. in Northbrook, Ill.
Abstract
The ledge design procedure in the seventh edition of the PCI Design Handbook: Precast and Prestressed Concrete has been called into question by several engineers and researchers since 1985. Specifically, the ledge punching-shear capacities predicted by the PCI procedure overestimate the failure loads observed in several previous laboratory tests and analytical studies. This paper presents the results of the second phase of an extensive experimental program conducted on nine full-scale, long-span, L-shaped beams with ledge heights from 8 to 18 in. (200 to 450 mm). The main objectives of this study were to investigate the effects on ledge ca-pacity of several significant parameters, such as global stress, prestressing, ledge height, and concrete strength. In addition, the study also investigated the efficiency of selected special reinforcement details. The experimental results demonstrated that increasing the global stress significantly reduces ledge capacity, while the use of prestressing increases the capacity. The research also demonstrated that concentrating the ledge reinforce-ment at the load location can significantly increase the ledge capacity, offering a practical design alternative for carrying heavy loads.
Keywords
Global stress, ledge, ledge capacity, ledge reinforce-ment, load, long span, L-shaped beams, punching shear, reinforcement detail, spandrel.
Review policy
This paper was reviewed in accordance with the Precast/Prestressed Concrete Institute’s peer-review process.
Reader comments
Please address any reader comments to PCI Journal editor-in-chief Emily Lorenz at [email protected] or Precast/Prestressed Concrete Institute, c/o PCI Journal, 200 W. Adams St., Suite 2100, Chicago, IL 60606.