Embed Size (px)
Citation preview

L E C T U R E m 1 SEAKEEPING IN DESIGN
L E C T U R E R : Tor Svensen, Det Norske Veritas Classification A/S
1. Introduction.
The primary use o f seakeeping theories is in connection with the design o f new ships.
Seakeeping theories used in combination with model experiments can play an important role in
the design process. However, it is important for the designer to have a good knowledge of the
limitations with the individual theories and methods employed. I t is also important for the
designer to know that possible design changes in order to improve seakeeping performance.are
feasible. A common problem in the design of commercial vessels is that seakeeping aspects are
considered too late in the design process, after all the major parameters influencing seakeeping
performance have been fixed based upon other considerations such as still water resistance.
The primary area for use o f seakeeping theories in design are:
- Evaluation o f basic parameters such as motions and accelerations and comparison
against criteria for cargo integrity, passenger comfort etc.
- Evaluation o f speed performance on a given route or selection o f routes for
determination o f sevice margins and required main engine power
- Calculation o f hydrodynamic loads on the hull structure in a seaway and use of this
information in connestion with the structural design o f ships
The latter is becoming an increasingly important application as reliability based structural
design procedures are gaining acceptance.
The following sections will discuss some of the important issues relating to the application of
seakeeping theories in design.
2. Use and limitations of seakeepine models
The most common theoretical method for prediction o f seakeeping performance is the linear
strip theory method. Despite the very substantial simplifications o f the actual physical realities
that are made in linear strip theory, this method has gained wide acceptance in connection with

ship design. In a survey o f ship model tanks to be published by the 1993 ITTC the following
conclusions are presented :
Three-quarters o f the Institutions use 2-D strip theory or slender body theory only. Only
about one-quarter use or have developed 3-D computations. The 3-D methods are used
mainly for zero or low forward speed.
Three-quarters o f the Institutions use a frequency domain approach. The remaining one-
quarter have a time domain capability.
It was not possible in this survey to distinguish between the methods that are routinely used
and those that are still under development. I t should also be noted that some of the institutions
that are the most active in the field o f numerical seakeeping do not own any experimental
facility and are therefore not included in the survey. However, the survey do present an
interesting picture o f the present state-of-art.
When considering seakeeping in connection with design, the most important motions are
absolute vertical acceleration and the relative motions at the bow. Vertcal accelerations are
directly related to crew and passenger comfort and safety of the cargo as well as the global
structural loads imposed. Relative motions at the bow are more related to how well the vessel
wil l be capable o f maintaining speed in heavy weather. The following comments are intended
to point out how well current seakeeping theories are capable o f predicting the various
motions and derived parameters o f interest in connection with design.
Vertical motions and accelerations: Good results from 2-D strip theory for most ordinary ship
hull forms. Although the theory is limited to small amplitude motions, results show surprisingly
good results for relative large amplitudes when compared with model experiments and fi i l l
scale measurements.
Relative motions: Relative motions at the bow as well as the stern are not predicted well by
linear 2-D theory. This is mainly due to the fact that the stationary wave field (the bow wave)
and the dynamic swell-up due to the pressure field generated by the water entry o f the flared
bow section are not included in the theory. In order to predict the relative motions at the bow
with an acceptable degree o f accuracy it is necessary to include the non-linear body- boundary
conditions in the prediction method. Such programs have been developed and are gaining
acceptance in use.

Slamming: Slamming pressures are a flinction o f relative verical velocity and geometry. For
deadrise angles less than 20 - 30 degrees, the maximum pressure will occur in the region of
where the jet is formed. Calculation o f slamming pressures necessitates the use o f nonlinear
theories. The local pressures generated in slamming will normally not have any significant
influence upon the global motions o f the vessel. As a result, the only practical way o f handling
slamming predictions today is to first predict the vessel relative motions and subsequently use a
non-linear boundary element or similar program for local investigations o f slamming. It should
be noted that the heel angle at impact is an important factor when predicting the impact
pressures. Accurate prediction o f rolling motion is therefore a requirement in connection with
slamming investigations.
Global loads - vertical bending moment: Vertical bending moment is primarily a fijnction o f
inertial loads and pressure forces acting on the hull. For large amplitude motions, linear
theories wil l underpredict the pressure forces acting on the hull during entry of the bow section
into the water. In order to account for this it is necessaty to include incoming wave as well as
the non-linear conditions on the body boundary. 2-D methods for time-domain modelling o f
these effects are standard routines today, 3-D methods are under development, but are not yet
part o f routine design procedures. Differences between linear and non-linear predictions o f
vertical bending moment can be as high as 50-60 percent.
2-D vs. 3-D theories: Complete numerical solutions based upon 3-D theories with forward
speed are still in their infancy. The major driving force behind the development of 3-D methods
is the prospect o f more accurate predictions o f hull pressures. This will give more accurate
predictions o f local and global loads as well as added resistance in waves. Developments in
computer power may result in 3-D methods playing an icreasing part in routine applications
within 2-3 years from now.
3. Seakeeping criteria
When using seakeeping criteria in connection with a design development or evaluation it is
important to remember the following 3 basic requirements:
1. The criteria and corresponding responses must be relevant to the mission of the vessel.
2. Criteria levels must be related to the actual task or mission of the vessel.

3. The numerical value o f criteria levels must be based upon actual ship performance
assessment.
For commercial ocean going vessels, seakeeping performance is principally addressed in terms
of :
Habitability: The ability of the vessel to carry out a mission with a minimum of
discomfort.
Operability: The ability to carry out a mission under all types o f weather
A third aspect o f seakeeping performance is survivability or seaworthiness. This aspect is
usually not considered in detail by the designer and is generally assumed to be satisfied by
adherence to appropriate classification rules, load line and stability regulations.
In practice the boundaries between habitability aspects and operability aspects o f seakeeping
performance are vague and the two will always be considered together.
By describing seakeeping performance in terms o f physical parameters such as absolute and
relative motions, accelerations, bow wetness and slamming it is possible to quantify
performance and subsequently evaluate performance in a rational and systematic manner.
Limiting values for individual performance criteria have been derived from full scale
operational experience. These are:
Design limits: Absolute limiting values which are not to be exceeded in service
Operational limits: Limiting values beyond which performance degradation or
increasing likelihood of vessel or cargo damage wil l occur
Limiting values for operability forms the basis for voluntary speed reduction in service.
Voluntary speed reduction or alteration o f course in service is in practice a highly subjective
action by one ship's master based upon an observed degradation in habitability or operability.
This subjective action is normally not reflected in the design analysis and limiting criteria are
treated as absolute criteria in most aspects of design analysis. This in itself may be a significant
source of error.
The enclosed figures present limiting values for selection o f the most common individual
seakeeping performance criteria applicable to merchant vessels. The significance o f individual

criteria for some principal ship types are also presented. From the data presented, it is
significant to note that criteria limits vary considerably depending upon the source and the ship
type. Only for vertical acceleration at the FP is there a reasonable agreement between the
various sources.
4. Accuracy requirements
The uncertainty associated with establishment o f valid limits for individual seakeeping criteria
are important to consider against the uncertainties in the seakeeping prediction method itself.
I t is often argued that uncertainties associated with the establishment of limiting values are not
significant when comparing characteristics o f two alternative designs. This argument may hold
for naval vessels where mission effectiveness is primarily a function o f seakeeping
performance. For merchant vessels seakeeping performance is usually a trade-off against other
factors such as still water performance and building costs. The absolute value o f each
individual seakeeping criteria limits can be an important factor in establishing a merit rating
between alternative designs in techno-economic terms. Using a more severe limiting criteria
wil l penalize a poorer seakeeping design more in terms of loss of performance. This may lead
to the incorrect conclusion that a particular design is outside the limit o f a stated performance
specification.
In order to illustrate the consequence for the design process of errors in seakeeping
predictions or in criteria limits, a case study is presented for a medium size container vessel
operating on the North Atlantic Route. Details of vessel and route are given in the enclosed
table.
The effects of introducing an error in the estimate of the relative motions at the FP upon the
limiting speeds due to deck wetness have been investigated for a range o f wave heights in the
North Atlantic. The results o f this investigation for a maximum deck wetness probability o f
3% are shown in the enclosed figure. Similariy, the effects o f changing the limiting value o f
individual seakeeping criteria have been investigated, and the results for vertical accelerations
at FP and deck wetness are shown in the enclosed figure.
The results as presented show that variations in the predicted responses, which are well within
the Hmits of accuracy for present seakeeping theories, can result in dramatic reductions in the
predicted speed for the vessel. An overestimate in relative motions by 1 metre in this case
represents an error of only 12% with a corresponding reduction in maximum permissible speed
o f over 3 knots in head seas in the range o f significant wave heights from 6 to 9 m. These
results are clearly of significant value in the design process. I f voluntary speed reduction at a

significant wave heiglit of 7.5 m is unacceptable to a particular operator, then the designer will
have to improve the seakeeping abilities o f the design by, for example, increasing the freeboard
in the bow region. When using this type o f deterministic analysis o f extreme events it is clearly
important that the seakeeping prediction method employed is capable o f generating accurate
results and that criteria limits are stablished with a high degree o f confidence. However, in
reality, a vessel wi l l only meet such extreme event situations during a very small percentage o f
the total operational time. The overall impact upon techno-economic performance may
therefore be relatively small. This is in practice best examined by performing an operational
analysis for the proposed design using a voyage simulation model. An example o f such a
model is the SEAWAY system as already presented. In a voyage simulation model the vessel
operation i modelled on a realistic trading route and the various factors affecting vessel
performance in service are modelled in combination rather than on an individual basis. The
principal steps in a voyage simulation is shown in the enclosed figure.
The environment is described in terms o f wind speed, direction, wave height, wave period and
direction for predetermined segments o f a given route. This permits both voluntary and
involuntary speed losses to be taken into account in the analysis.
Involuntary speed loss is defined as caused by
Wind resistance
Added resistance in waves (short waves and ship motion domain)
Added resistance due to steering (rudder motions)
Voluntary speed loss is a deliberate reduction in speed or change in heading due to exceedance
of one or more limiting values for individual seakeeping criteria.
Long term or short term statistical weather data can be used in a voyage simulation analysis.
In a design evaluation long term annual statistical data for the relevant routes are usually
employed. This provides the most realistic basis for assessing the total economic measure o f
merit for the design.
The selection of operational profile (route) is clearly important for the results o f the analysis.
The probability of encountering severe weather conditions varies considerably between
different sea areas with a corresponding variation in vessel performance. It is therefore
important that the design analysis is performed using a realistic operational profile
corresponding to the expected future service profile of the vessel.

In order to illustrate the above points in some more detail and to examine the importance of
seakeeping characteristics and voluntary speed reduction against other involuntary speed
losses, the container vessel described in the enclosed table has been modelled on a North
Atlantic trading route vAth a typical roundtrip schedule of 21 days.
In environmental terms the North Atlantic represents one o f the worst possible routes and both
voluntary and involuntary speed losses and derived service margins for a vessel on this route
wil l normally exceed values derived from other routes, including a world-wide operating
scenario.
Constant speed operation is assumed in the present analysis. When using constant speed as
basis for the analyses a target schedule o f port arrivals is derived based upon this target speed,
and the speed and power is adjusted continuously to give the correct arrival time. This method
o f simulation reflects the normal mode o f operation where speed and power is increased during
good weather parts o f a passage i f the vessel has previously been delayed by voluntary or
involuntary speed loss during bad weather. The practical limitations on installed engine power
are o f course observed during such simulation.
The enclosed table presents results from the analysis of involuntary speed loss showing that the
vessel is not capable o f maintaining the required schedule despite having an installed engine
power service margin of 15 percent. For the complete roundtrip voyage the average
involunatiy speed loss is 0.9 knots and for the Westbound Trans-Atlantic voyage 1.7 knots.
Also enclosed are results from an anlysis o f voluntary speed loss due to deck wetness using a 3
percent probability as the limiting criterion. For the Base Case the relative motions at the F.P.
is marginally below the critical value for voluntary speed reduction. In the subsequent cases
the freeboard has been reduced, thus simulating an overestimate in the relative vertical motions
at the F.P. The results cleariy show that a relatively large error in the seakeeping prediction
will have a small impact upon the total speed and power performance o f the vessel.
More important to note is the fact that involuntary speed losses contribute far more
significantly to the total loss in performance compared with voluntary speed losses. On the
other routes that the North Atlantic this difference is even more significant.
It is clear from these results that an error of 10-20 percent in seakeeping prediction can be
accepted at the design stage when considering voluntary speed losses and the total techno-
economic performance o f a proposed new design. The larger contribution by involuntary

speed losses to the total economic performance clearly demonstrates that it is the accurate
prediction o f added resistance which is more important in the design process.
A further comparison between speed losses due to environmental effects and speed losses due
to deteriorative effects was carried out for the same vessel. An increase in average hull
roughness from 125 [im to 300 f im in this case represents a fiirther speed loss o f 0.3 knots.
For a 5-6 year old well maintained vessel an average hull roughness o f 300 \xm would be a
representative number. Further, more dramatic speed losses would cleariy take place i f the
vessel also experienced hull fouling. A total speed loss in the range 1-1.5 knots due to
environmental and deteriorative effects would therefore be an expected value for this type o f
vessel on the North Atlantic route. In economic terms a speed loss o f 0.5 knots when
translated directly into lost cargo carried represents a total economic loss o f approximately $ 2
million over one year. This figure can serve as a guide when considering ways o f improving
the seakeeping and overall techno-economic performance of a new design.
5. Application of seakeeping theories in structural design
The conventional method of using seakeeping prediction in connection with structural design is
to perform an analysis o f motions and global loads (vertical bending moment and torsional
moment). The vessel is subsequently "placed" on a regular wave giving the same global loads
and the pressures on the hull resulting from this wave are input to the finite element model.
More recent methods o f analysis also permit taking hull pressures directly from the seakeeping
analysis in frequency domain and input to the finite element analysis. These are standard
methods and wil l not be dicussed fiirther here. Instead it is relevant to show how seakeeping
theories may be combined with modern probabilistic methods in the development o f rational
methods for structural design
Probabilistic methods are used to determine the probability o f failure for a combination of
several variables and events. Computational methods determining the probability o f failure for
a combinations o f several variables and events are today available through commercial
software. The software will schematically work as in the enclosed figure.
In order to apply probabilistic methods in assessing the safety against loss due to lack o f
stability, the following steps are required to be performed :

1) Choose physical model to describe the relevant failure modes (limit states).
2) Model the uncertainties in a consistent way by probability distributions.
3) Choose statistical distributions types and distribution parameters for all uncertain variables.
4) Integrate probability distributions with the physical model in a limit-state function.
It is seen from the above item list and scheme below that the physical model or limit state,
describing when a failure occurs, is the primary item. This numerical limit state model for use
in probabilistic methods may be both a purely experience based.regression analysis including
the error information
or
it may be a physical model describing the dynamic behaviour o f ship motions with inherent
uncertainties and model uncertainties. (Requires test results and analytical work).
Presently considerable research effort is spent in this area. However, to reach valuable results it
is not only the computational methods that needs to be improved, but also the data collection
and data analysis, forming a basis for the probabihty distributions. Experienced personnel can
then join the physical models and decide on standard probability distributions for use in
reliability analyses.
The above model requires that hazards are identified and formulated in terms o f limit state
functions. For different vessels there are different hazards or failure modes that need to be
covered.
Combination o f load effects: Within each time scale there may be a set o f load components.
For example, at the typical wave frequency it may be relevant to consider the horizontal and
vertical bending moment and the local sea pressure acting on a plate field. For a description of
the distributions o f the combined load processes a formulation using crossing statistics is a
convenient representation. The upcrossing rate describes the number o f crossings per unit time
o f a specific level, and may be the basis for the required response distributions both for the
fatigue and extreme value calculations. For a combination of several simultaneous processes
including nonlinear combinations, the outcrossing rate into the failure domain (g(X,t) 0)
contains the corresponding information (see enclosed illustration). For different types o f
failure, or load combinations, the crossing rate gives the distribution o f peaks that is used in the
fatigue calculations and the extreme value ditribution used in ultimate limit state calculations

(ULS), The method can be apphed to non-Gaussian ( for example roll motion ) and non-
stationary processes ( as for example lifting operations ). Non-linear load combinations may
also be considered, as for example buckling under biaxial loading or the Von-Mises stress
criterion. The exact solution may be approximated by simulation methods.
The numerical solution may be determined using a program such as PROBAN (se enclosed
illustration). The resulting outcrossing frequency is used to determine the probability o f failure
during one specified storm, to be fijrther processed when determining the annual probability o f
failure in the ultimate limit state. The same out-crossing fi-equency is used in determining the
long term distribution o f stress amplitudes for use in the fafigue limit state.
The process for a typical application will consist o f the following steps:
- perform seakeeping calculations to obtain motions and loads transfer fijctions as well
as the covariance matrix for the intended load effects
- define limit state fuction
- define wave environment for the analysis
- perform analysis using a probabihty integral solver program, such as PROBAN
- perform analysis on the resulting outcrossing frequency for determining ULS or
fatigue compliance with requirements.
Examples of the most relevant application area for this type o f analysis is fafigue in side
longitudinals o f large tankers, buckling o f bottom and deck panels or buckling o f L N G
spherical tank shells.
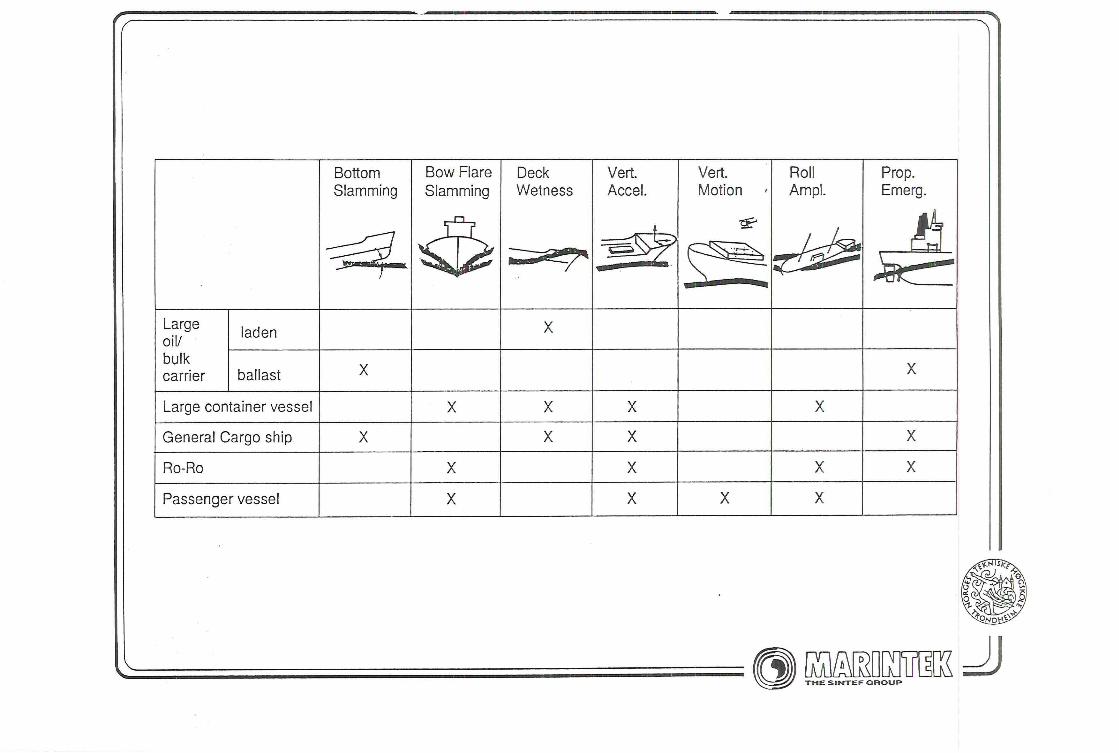
Bottom Slamming
Bow Flare Slamming
Deck Wetness
- r^ ^ n n
Vert. Accel.
Vert. Motion
Roll AmpI.
Prop. Emerg.
\ ^ ^ ^ ^
Large oil/ bulk carrier
laden X Large oil/ bulk carrier ballast X X
Large container vessel X X X X
General Cargo ship X X X X
Ro-Ro X X X X
Passenger vessel X X X X
1 Mora THE SlIMXEF GROUP
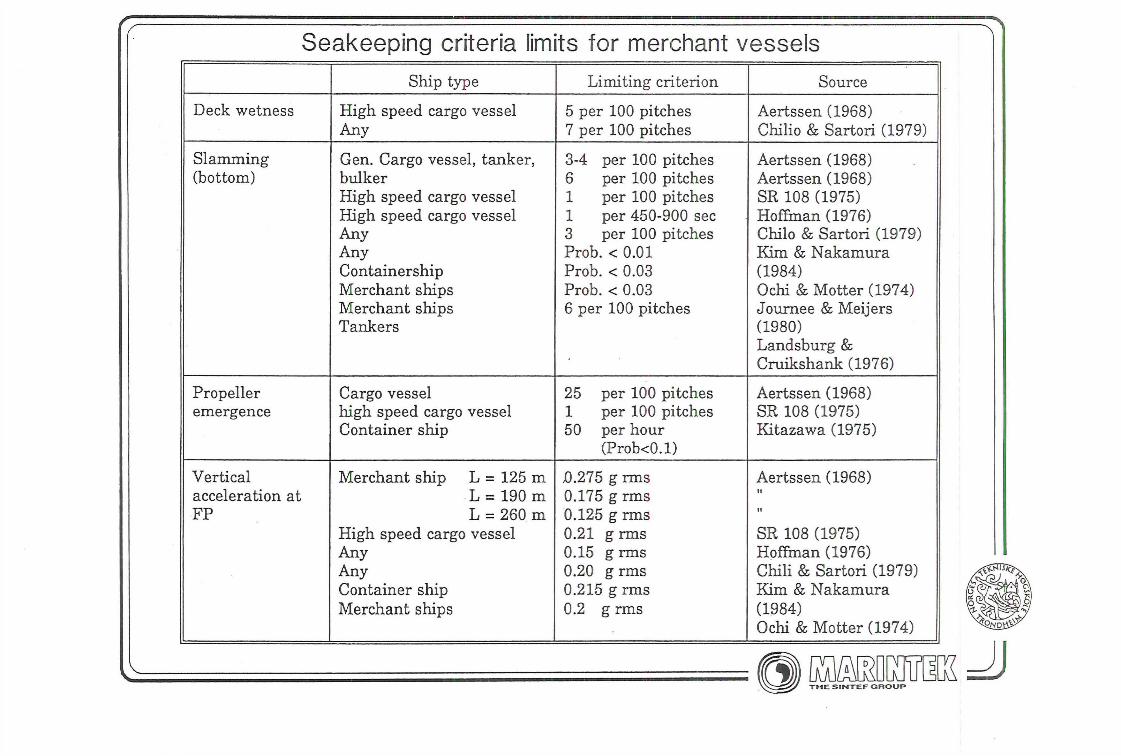
Seakeeping criteria limits for merchant vessels
Ship type Limiting criterion Source
Deck wetness High speed cargo vessel Any
5 per 100 pitches 7 per 100 pitches
Aertssen (1968) Chiho & Sartori (1979)
Slammmg (bottom)
Gen. Cargo vessel, tanker, bulker High speed cargo vessel High speed cargo vessel Any Any Containership Merchant ships Merchant ships Tankers
3-4 per 100 pitches 6 per 100 pitches 1 per 100 pitches 1 per 450-900 sec 3 per 100 pitches Prob. < 0.01 Prob. < 0.03 Prob. < 0.03 6 per 100 pitches
Aertssen (1968) Aertssen (1968) SR 108 (1975) Hoffinan (1976) Chile & Sartori (1979) Kim & Nakamura (1984) Ochi &Motter(1974) Jomnee & Meijers (1980) Landsburg & Cruikshank (1976)
Propeller emergence
Cargo vessel high speed cargo vessel Container ship
25 per 100 pitches 1 per 100 pitches 50 per hour
(Prob<0.1)
Aertssen (1968) SR 108 (1975) Kitazawa (1975)
Vertical acceleration at FP
Merchant ship L = 125 m L = 190 m L = 260 m
High speed cargo vessel Any Any Container ship Merchant ships
jO.275 g rms 0.175 g rms 0.125 g rms 0.21 g rms 0.15 g rms 0.20 grms 0.215 g rms 0.2 g rms
Aertssen (1968)
I I
SR 108 (1975) Hoffman (1976) Chih & Sartori (1979) Kim & Nakamura (1984) Ochi & Motter (1974)
T M E S I M T E F O R O U P

Limiting speeds in head waves due to
deck wetness for 1700 TEU container vessel.
Maximum probability of deck wetness = 3%.
Limiting speeds in head waves for
different limiting values of seakeeping criteria
1700 TEU container vessel.
Ship speed
6m 7m 8m 9m
8 s 8.5 s

ROUTE : NORTH ATLANTIC - ROUNTRIP DISTANCE 7500 n miles
SHIP TYPE : CONTAINER VESSEL - 1700 TEU
PRINCIPAL DIMENSIONS : L = 1 9 8 m B = 32.2 m T = 10.5 m
OTHER PRINCIPAL DATA : 0 ^ = 0.577 C ^ = 0.812
PITCH RAD. GYR. = 0.25 Lpp
PROPELLER DIAMETER = 7.1 m
TARGET SCHEDULED SPEED • 22 knots
CALCULATED VOLUNTARY SPEED LOSS DUE TO DECK WETNESS FOR VARIATIONS IN ESTIMATED RELATIVE MOTIONS AT F.P.
WESTBOUND EASTBOUND
BASE CASE 0 0
1 m (13 %) OVERESTIMATE < 0.1 knots < 0.1 knots
1.5 m (20 %) OVERESTIMATE 0.2 knots 0.2 knots
2 m (26 %) OVERESTIMATE 0.6 knots 0.5 knots
\ ^ ^ ^ / THESINTEFGI

ROUTE : NORTH ATLANTIC-ROUNTRIP DISTANCE 7500 n miles
SHIP TYPE : CONTAINER VESSEL - 1700 TEU
PRINCIPAL DIMENSIONS : L = 198 m B = 32.2 m T = 10.5 m
OTHER PRINCIPAL DATA : Cb= 0.577 C ^ = 0.812
PITCH RAD. GYR. = 0.25 Lpp
PROPELLER DIAMETER = 7.1 m
TARGET SCHEDULED SPEED : 22 knots
INVOLUNTARY SPEED LOSS AND CALCULATED
ACHIEVED SPEED
WESTBOUND EASTBOUND
ACHIEVED SPEED 20.4 21.1
INVOLUNTARY SPEED LOSS 1.7 0.9
THE SIMTEF GROUP

Basic Variable
U L
Libfary Limit States
Basic Variable
^
PROBAN
Failure Probabilities
Basic VariabI*
z:
System Configuration
S I C
Sensitivity Measures
Importance Factors Sensitivity Factors
6P 5P M ' ö c r 6r
A^VOirTASIIESCAIICH

Experiements
Data gathering
Statistical
Distributions
Numerical model of physics
G(x)
Probability
of total loss
^ Importance factors
Sensitivities

COMPUTING THE CROSSING RATE INTO FAILURE DOMAIN.
The out crossing rate :
V - | | ( G<0 n G+Ge<0 )e .„ - <i'(Pd<o. o.<!a<o)||
G is the limit state function.
G is the velocity of the processes into failure domain.
The limit state in this case :
Where :
= Stress resistance level.
£7s, = Still water induced stress.
CTy = Vertical wave induced stress.
Gh = Horisontal wave induced stress.
0^,0 = Bottom slamming induced vertical stress.
C7f|() = Flare induced vertical stress.
Time ^
E v e n t s d e s c r i b i n g an o u t - c r o s s i n g