Embed Size (px)
Citation preview

November 2014
Lecture attendance research: Methods and preliminary findings
% o
f stu
dent
s
0
20
40
60
80
100
1 18
Inspiration and early findings
only attend
only view online
neither
F
M
W
MM
M M
MM
M
W
WW
W WW
W
Lecture #
Inspiration for this project came from self-reported attendance and online viewing data from the 2011 iteration of CS50 (n=452). Something important changes over time that affects attendance on all time scales: from freshman to senior year (not shown), from the start to the end of the semester, and from Monday to Wednesday. By the end of this very popular course, 25% of students reported neither attending or watching lectures online. Lecture attendance was negatively correlated with online lecture viewing.
Weak extant literature
Undergraduate lecture attendance has not been comprehensively or rigorously measured. Past research is limited by one or more of the following:
• self reported attendance• self reported reasons for attending or missing lectures• biased sample of included courses• single course analyses
Undergraduate lecture attendance has not been systematically related to course variables, course ratings, or the availability or use of digital resources (e.g., lecture videos).

Methods• Four GoPro cameras installed visibly at front of four lecture halls
with existing video recording equipment
• Imagery data collected every minute (slowest time lapse possible with GoPros) from all courses that met in these lecture halls
• Encrypted data retrieved regularly and stored securely
• Machine learning algorithm developed iteratively based on emerging methods from computer vision
• Imagery data paired with specific course lectures based on manual reconciliation of Harvard-accessible (behind PIN) data from course syllabi, course sites, and published meeting times/locations
• One summary statistic derived from multiple estimates per lecture
• Researcher given administrative access to course sites, which included aggregate site and lecture video usage statistics
Development of algorithm
• The algorithm was developed and refined over seven months• No “out of box” solution existed• Small sample of images used initially to explore different strategies
for estimating attendance• Algorithm was “trained” to distinguish between empty seats and
seats with people in them (but not other things, such as coats or bags)
• Most accurate strategy took advantage of color profiles of empty seats versus those with people in them
• Iterations required to accommodate slight changes in camera angles• Discrepancies reconciled during week of Daylight Savings change,
when image time stamps diverged from actual times

Validation of algorithm
• Algorithmic estimates compared with random sample of manually coded images
• Correlation extremely high (r = .99)• Estimates plotted over time for each course, and potentially
aberrant estimates identified• Outliers scrutinized further based on input from faculty and
inspection of imagery data

Course A (n≈150)A
tten
danc
e (%
)
0
10
20
30
40
50
60
70
80
90
100
110
120
130
140 T
examexam
Th
T
Th
TTh
T
Th
T
ThT
Th
T
Th
T
Th
T
Th ThTh
TT T
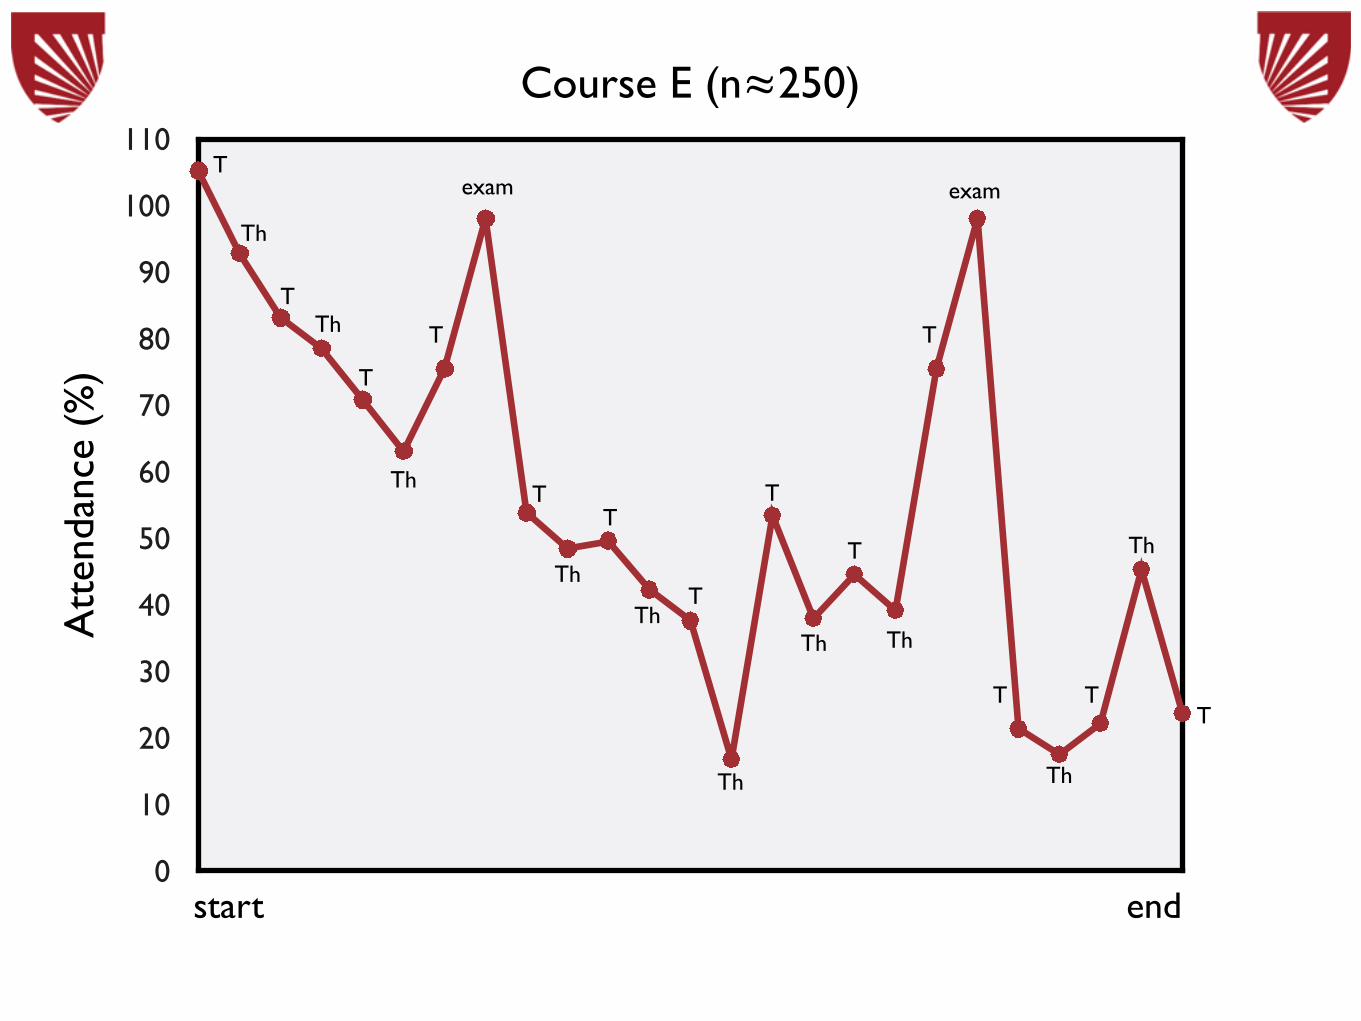
start endAt present time, attendance data from 10 courses have been analyzed fully and were presented at the HILT Conference 2014. Enrollment numbers and lecture dates were obscured for reasons of anonymity.

Course B (n≈200)A
tten
danc
e (%
)
0
10
20
30
40
50
60
70
80
90
100
110T
Th T Th
Th
T
Th
Th
Th
Th
T Th
Th
Th
Th
Th
exam
T
T
TT
T
exam
T
optional
start end

Course C (n≈125)A
tten
danc
e (%
)
0
10
20
30
40
50
60
70
80
90
100
110
120
130
exam
quizquiz quiz quiz
W
M
W
F
M
F
W
F
M
F
M W
F
F
M
W
F
F
MW
F
MF
M
W
F
MW
M
start end

Course D (n≈300)A
tten
danc
e (%
)
0
10
20
30
40
50
60
70
80
90
100
110 M
W
F
M
W
F
M
W
F
W
F
M
F
MW
F
M
W
F
MW
F
M
F
M
W
F
M
W
F
M W
F
M
W
exam exam
start end
Course E (n≈250)A
tten
danc
e (%
)
0
10
20
30
40
50
60
70
80
90
100
110exam
T
Th
Th
Th
Th
Th
T
T
T
TT
T
Th
T
T
T TT
Th Th
Th
Th
exam
T
start end

Course F (n≈300)A
tten
danc
e (%
)
0
10
20
30
40
50
60
70
80
90
100
110exam exam
M
W
F
M
W
F
M
W
F
W
F
M W
F
WF
M
F
M
W
F
M
W
FW
F
MM
MW W
W
FF
start end

Course G (n≈150)A
tten
danc
e (%
)
0
10
20
30
40
50
60
70
80
90
100
guestspeakers
optionalmovie
T
Th
T
ThT
Th
T
Th
T
Th
T
Th
T
Th
T Th T
Th
T
Th
T
start end

Course H (n≈250)A
tten
danc
e (%
)
0
10
20
30
40
50
60
70
80
90
100
110
120
exam examexamM
W
M
M
W
W
M
M
W
M
W
M
W
M
W
M
W
M
W
M
start end

Course I (n≈300)A
tten
danc
e (%
)
0
10
20
30
40
50
60
70
80
90
100
110
start end
exam exam
movie
movie
WM
MW
W
M W
WM
W
MW
W W
M
W
M
W
W

Course J (n≈100)A
tten
danc
e (%
)
0
10
20
30
40
50
60
70
80
90
100
exam
M
M
M
MM
M
M
M M
M M
MW
W
W
W W W
W W
W
W
start end

Courses A-J
Att
enda
nce
(%)
0
10
20
30
40
50
60
70
80
90
100
110
Course ACourse F
Course ECourse G
Course D
Course B
Course CCourse H
start end
Course J
Course I

Courses A-J
On the average, 60% of students attended any given lecture.
Moreover, there was incredible variability between courses in their average attendance: Some courses had as low as 38% attendance (over the semester), whereas others had as high as 94%.
Lecture attendance declined over the semester, starting at 79% and ending at 43%.
There was also loss of attendance over the week: 5% from Monday to Wednesday or Tuesday to Thursday, and 10% from Wednesday to Friday.

0%0%
0%0%0%
5%
10%4%
start end
1%9%
1%0%0%
85%
56%83%
attendance grade
premed requirement
Courses A-J
Att
enda
nce
(%)
0
10
20
30
40
50
60
70
80
90
100
110
0% 0%

Courses A-J
With this preliminary set of 10 courses, two noteworthy effects emerge.
First, courses that measured and graded attendance had higher attendance than those that did not (87% vs 49%, respectively). Second, courses in which students self-reported enrolling to fulfill a premed requirement had much higher attendance than other courses.
Other reasons for taking the courses (e.g., elective vs General Education requirement) did not show significant effects, nor did time of day, day of week, published Q ratings, or the availability of lecture videos.
Course I stands out as unusual: It had high attendance yet did not grade or measure attendance, nor did it fulfill a premed requirement. One distinguishing aspect of this course is that the instructor restricted access to the lecture videos until immediately before exams.

Machine learning algorithms can be used to accurately measure attendance in large lecture courses.
Lecture attendance declines over the week and over the semester.
There is a huge range in average lecture attendance across courses.
These differences appear mostly structural in nature.
Preliminary findings(10 courses)

For most courses, site use (# unique authenticated users per week) correlated positively with lecture attendance. The more students attended lectures, the more they visited the course site.
Analysis of lecture video usage is problematic—most courses make their videos available to anyone at Harvard or anyone on the internet. Nonetheless, preliminary results show a positive correlation for some courses and a negative correlation for others.
Site and video use

How do we interpret attendance in high-enrollment courses?
What evidence-based advice can we offer instructors who wish to promote attendance in high-enrollment courses?
How does the availability and use of online course videos (or other digital resources) affect attendance in high-enrollment courses?
Will the present findings replicate in a larger sample of high-enrollment courses? What other factors explain variability between courses in lecture attendance?
Open questions