Embed Size (px)
Citation preview

Lecture 1: Pulverised coal combustion carbon
capture and storage, GHG reduction and oxyfuel technology
APP OFWG Capacity Building Course, Monday/Tuesday 15/16 March, 2010
Xijiao Hotel, Beijing, China
Professor Terry Wall
OFWG Project Leader and
University of Newcastle, Australia

Content and references
Lecture content:
1. CCS technology comparisons
2. Carbon avoidance costs
3. Oxyfuel technology status
References:
B.J.P. Buhre, L.K. Elliott, C.D. Sheng, R.P. Gupta, and T.F. Wall, Oxy-Fuel Combustion Technology For Coal-Fired Power Generation, Progress in Energy and Combustion Science, 31, 283-307, 2005.
T. F. Wall, Combustion processes for carbon capture, Invited plenary lecture and review, 31st International Symposium on Combustion, University of Heidelberg, Proceedings of The Combustion Institute, 31, 31-47, 2007.
Terry Wall, Yinghui Liu, Chris Spero, Liza Elliott, Sameer Khare, Renu Rathnam, Farida Zeenathal, Behdad Moghtaderi, Bart Buhre, Changdong Scheng, Raj Gupta, Toshihiko Yamada, Keiji Makino, Jianglong Yu, An overview on oxyfuel coal combustion—state of the art research and technology development, Chemical Engineering Research and Design (ChERD), Volume 87, Issue 8, Pages 1003-1016, 2009.
… and web links on OFWG site http://www.newcastle.edu.au/project/oxy-fuel-working-group/links.html
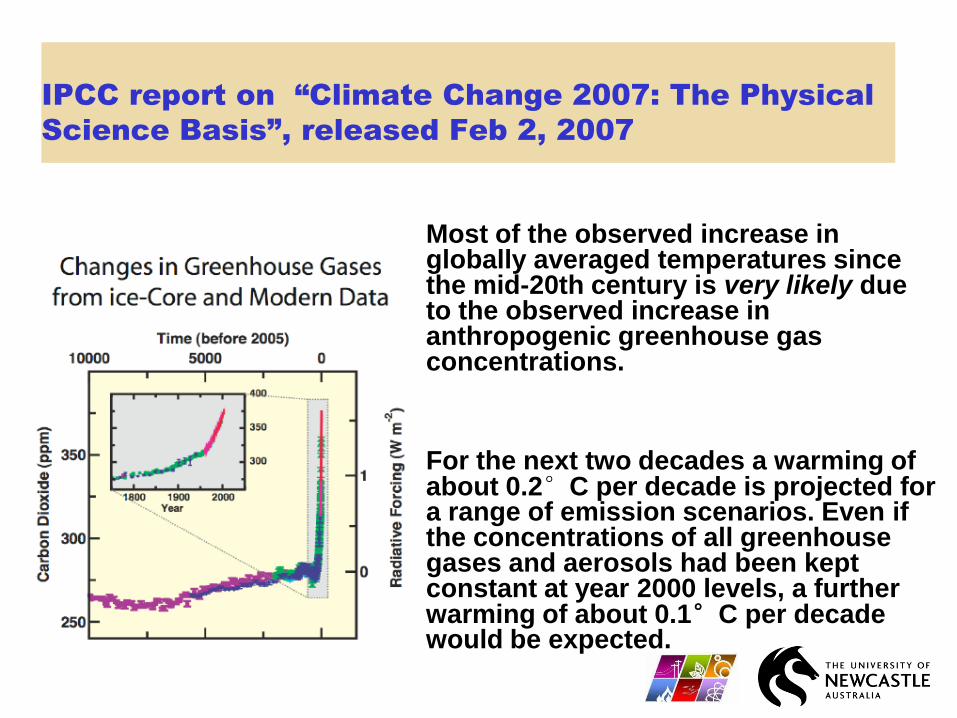
IPCC report on “Climate Change 2007: The Physical
Science Basis”, released Feb 2, 2007
Most of the observed increase in globally averaged temperatures since the mid-20th century is very likely due to the observed increase in anthropogenic greenhouse gas concentrations.
For the next two decades a warming of about 0.2°C per decade is projected for a range of emission scenarios. Even if the concentrations of all greenhouse gases and aerosols had been kept constant at year 2000 levels, a further warming of about 0.1°C per decade would be expected.

Reports other than IPCC
IEA CCS technology costs, 2003-5
Stern Report, 2007 – act now or costs greater later
MIT coal report, 2007 – coal needs CCS
McKinsey Report, 2007 – CCS costs in context
GCCI Report, 2009 – status of CCS

Course focus: Why power generation? Why
coal? Why CCS?
Thambimuthu, GHCT-8 Conference Opening Session, June, 2006. ― Need to focus on
• Power generation, the main source of emissions
• Coal, the main fuel for power generation
• Saline aquifers, the largest potential store ‖
Coal emits more CO2 per energy than other fuels, but is a relatively secure energy source
CCS R&D emphasis on coal technology

CO2
storage capacity
Capacity
• In highly prospective and prospective areas, suitable saline aquifer formations, oil or gas fields, or coal beds, at least
• 2,000 GtCO2 ~ 150 years of worldwide CO2 from large stationary sources
Matching CO2 sources and storage sinks
• 30-60% of CO2 emissions from electricity generation and 30-40% of those from industry would be suitable for capture in the future
• IPCC study uses 1-8 US$/tCO2 for 250 km transport

7
PCC, post-combustion capture, with
additional plant noted in red
Conventional (pf) Power Generation CO2 Capture
Boiler or
Gas Turbine
de NOx /
FGD
Steam
Turbine
Solvent
scrubbing
Steam
Air
Fuel
Power CO2
compression CO2
Vented
N2, O2, H2O,
some CO2
Flue gas

IGCC-CCS, pre-combustion capture
Gasification Shift Conversion
CO+H2O H2+CO2
Air
Separation
Unit (ASU)
CO2 capture/
acid gas
removal
Oxygen
Steam
Sulphur
recovery
CO2
compression
Coal, fed dry
or as slurry
H2S
CO2
Combined
Cycle
Nitrogen Air Power
Air
Sulphur
Air

Oxy- fuel
Boiler or
Gas Turbine
Ash removal /
cooler /
condenser / FGD
Steam
Turbine
Purification /
compression
Steam
Oxygen
Fuel
Power
CO2 (SO2)
CO2 –rich
Flue Gas
Air
Separation
unit (ASU)
Air
Recycled Flue Gas (RFG)
Nitrogen
Conc.
Stream
of CO2
Vent

Status: Examples of operating plants,
www.co2captureandstorage.info
Technology Location Coal Power Capture Storage
PCC Warrier Run*, Chiba*, Bellingham
X* X X
IGCC 4 power plants- USA, EU
Many refineries
X
X
X
X X
Oxyf Kimberlina X X
Storage Weyburn*, Sleipner, In Salah X* X X
Status: Some demonstrations of coal-fired integrated plants
PCC RWE (Germany) Post - 2009
IGCC-CCS Futuregen (USA), 275 MWe
RWE (Germany), 400-450 MWe
Stanwell (Australia), 200 MWe
2012
2014
2012
Oxyf Vattenfall (Germany), 30 MWt
Callide (Australia), 30 MWe
2008
2010

CCS options, with desirable characteristics
indicated X
Option Integrated plant
demonstratedat commercial
scale
For retrofit
Can be applied to
slip-stream
No O2supply
No CO2capture
Gives H2
PCC X X X
IGCC-CCS
X
Oxyf X X

Zero emission technology (ZET) targets and CO2
release
Emissions, from IEA (2005)
SO2 – 98-99 % removalNOx – 25-50 mg/m3Particulates – 1-10 mg/m3
CO2 release, g/kWh, from IEA technology reports (2003-2005)
Pf+FGD, without capture 710-910
PCC 117IGCC-CCS, dry 142IGCC-CCS, slurry 152Oxyfuel 92

Efficiency comparisons with and without
capture, neglecting transport and storage
0
5
10
15
20
25
30
35
40
45
50
PCC IGCC-CCS
slurryIGCC-CCS
dry
Oxyf
Technology
Eff
icie
ncy,
% L
HV
With CCS
PCC IGCC IGCC Oxyf
-slurry -dry
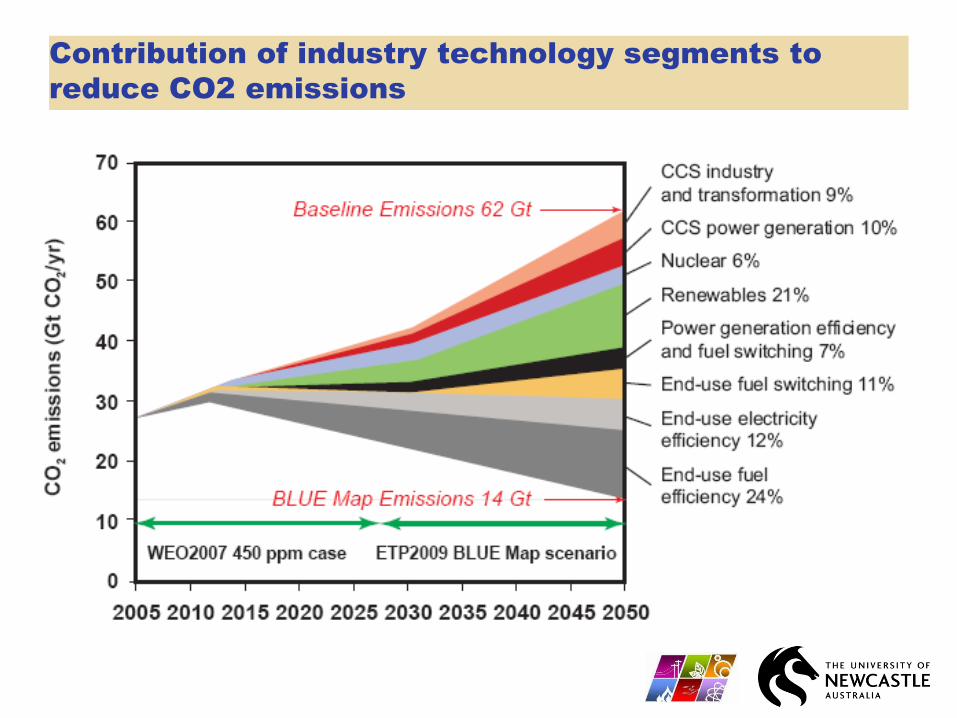
Contribution of industry technology segments to
reduce CO2 emissions

GHG global reductions in the power sector in 2030 – CCS
significance

CCS projects worldwide
Commercial scale and integrated projects :
• projects storing or proposing to store 1 Mtpa or greater of CO2
• CCS projects that are integrated, that is, combines the CO2 capture

Historical progression of oxyfuel technology, with
projects without electricity generation scaled to MWe/3

Oxyfuel pilot plants and demonstration projects
PROJECT Location MWth Start Up Year Boiler Type Main Fuel CO2 Train
B & W USA 30 2007 Pilot PC Bit, Sub B., Lig.
Jupiter USA 20 2007 Industr. No FGR NG, Coal
Oxy-coal UK UK 40 2009 Pilot PC Bituminous
Alstom (Windsor Facility) USA 15 2009 Pilot PC (Tangential) Bit., Sub B., PRB
Vattenfall Germany 30 2008 Pilot PC Lignite (Bit.) With CCS
Total, Lacq France 30 2009 Industrial boiler NG With CCS
Callide Australia 90 2011 30 MWe PC Bituminous With CCS
CIUDEN – PC Spain 20 2010 Pilot PC Anthra. Bit, Lig. Coke With CCS
CIUDEN – CFB Spain 30 2010 Pilot CFB Anthra. Bit, Lig. Coke With CCS
ENEL HP Oxy Italy 48 2012 Pilot Plant Coal
HBPA – Michigan / Praxair USA 225 2014? ~75 MWe CFB Bit. With CCS
Vattenfall (Janschwalde) Germany ~1000 2014? ~300 MWe PC Lignite (Bit.) With CCS
Endesa/CIUDEN Spain ~1000 2015? ~300 MWe CFB? ? With CCS
Black Hills Power/B&W/AL USA ~400 2015? ~100 MWe PC With CCS
KOSEP/KEPRI Yongdong Korea ~400 2018? ~100 MWe PC ? ?

Sequence to commercialization, proposed by S Santos,
at the IEA Oxyfuel Conference, 2009

Components of the roadmap to deployment
2010 2015 2020 2025
- Partial demonstration, without
CCS or power generation
- Integrated
demonstration
- Integrated and
CCS>1Mtpa
First generation technology Second generation
Research
- Pilot-scale testing and
gas cleaning
-O2 supply- Thermal
integration
Regulation
- Gas quality, transport
and storage
PF USC efficiency target, with
CCS, %HHV40-42% >45%
Oxy-f
uel te
ch
nolo
gy
develo
pm
ent
Eff
icie
ncy
mile
sto
nes