Embed Size (px)
Citation preview

GROWINGSMARTER:Learning and equitable development in East Asia and Pacific
World Bank East Asiaand Pacific RegionalFlagship Report - 2018

The EAP region: A half-century of stellar growthAverage economic growth between 1961 and 2015
Source: Data from World Development Indicators (World Bank, various years). Author’scalculations.
World economy
+3.5%+7.2%
Developing East Asia Pacific
vs
each year
each year

Size of EAP economy at various growth rates
Source: Data from World Development Indicators (World Bank, various years).Note: Data cover the years 1960-2015. GDP = gross domestic product.
$11.1 trillionEAP with China

Size of EAP economy at various growth rates
Source: Data from World Development Indicators (World Bank, various years).Note: Data cover the years 1960-2015. GDP = gross domestic product.
$1.5 trillionWorld

Size of EAP economy at various growth rates
Source: Data from World Development Indicators (World Bank, various years).Note: Data cover the years 1960-2015. GDP = gross domestic product.
$1.5 trillionWorld
$4.8 trillionEAP without China

Source: Data from World Development Indicators (World Bank, various years).Note: Data cover the years 1960-2015. GDP = gross domestic product.
$11.1 trillionEAP with China
Size of EAP economy at various growth rates

The share of people in EAP working in agriculture has fallen and the share working in services has risen
Source: Data from International Labor Organization. Author’s calculations.
Share of population in 1991Agriculture Services Other

The share of people in EAP working in agriculture has fallen and the share working in services has risen
Source: Data from International Labor Organization. Author’s calculations.
Share of population in 2016Agriculture Services Other

Tens of millions of childrenin school but not learning
29countries and economies
of the world’sschool age children
20 millionpublic school teachers
7/10of the world’s top
educational systems
Regional snapshotThe East Asia and Pacific region is hometo:
26%

Education attainment grew rapidly and steadily in EAP since 1950
Source: Barro and Lee 2013.
Average years of schooling for adults aged 25+ in EAP compared to world average in 1950
World EAP
1.3 years
2.9 years

Education attainment grew rapidly and steadily in EAP since 1950
Source: Barro and Lee 2013.
7.9 years 8 years
Average years of schooling for adults aged 25+ in EAP compared to world average in 2010
World EAP

Every year of schooling raises earnings by 10%
Source: Montenegro and Patrinos 2014.

There are rising returns to higher levels of education, despite increases in supply
Source: Di Gropello and Sakellariou 2010.
Wage premiums to tertiary education
Vietnam 1992
Share of workers with tertiary education

There are rising returns to higher levels of education, despite increases in supply
Source: Di Gropello and Sakellariou 2010.
+94%
Vietnam 2006
Wage premiums to tertiary education
Share of workers with tertiary education
+273%

Developing countries cluster at bottom of global scaleMean scores for selected developed and developing countries (1965-2015)
0
200
400
600
Source: Harmonized Learning Outcomes (HLO) database.

EAP has some of the best education systems in the world, but also some that struggle to perform well
Note: Composite constructed average of PISA and TIMSS performance over all available iterations. Calculations based on PISA and TIMSS scores on nine assessments since 2000 for PISA, and 2003 for TIMSS.
350 400 450 500 512 550 556 600 650406
B-S-J-G (China)Macao SAR, China
Japan Taiwan, China
Korea, Rep.Hong Kong SAR, China
Vietnam
ThailandMalaysia
Indonesia
Philippines
SingaporeShanghai, China

In Above-Average Performing Systems, learning is 2+ years above predicted levels
Source: PISA 2015 (OECD 2016).
Singapore
IndonesiaB-S-J-G (China)
Korea, Rep.
Japan
Vietnam Thailand
Malaysia
2.0
1.3
1.3
2.0
4.4
-0.6
-0.6
-0.7

Scores are not only high, they are also equitable
Source: PISA 2015 (OECD 2016).
OECD Vietnam and B-S-J-G (China)
Students in bottom 40% of SES in Vietnam and BSJG score = 506
Bottom TopQuintile 2 Quintile 3 Quintile 4
Average OECD score = 493
650
450
550

Up to 60% of students in EAP are in systems in which learning outcomes are low or unknown
Source: Calculations based on a composite constructed average of PISA and TIMSS performance on the nine iterations of these assessments since 2000 (for PISA) and 2003 (for TIMSS).
Students in systems with learning crisesStudents in Top
Performing and Above-Average Performing Systems
40% 60%

What can be learnedfrom successful systems?

5 key policydomains
Align institutions to ensure that basic conditions for learningare in place in schools
Assess students todiagnose issues and inform instruction
Concentrate effective,equity-minded public spending on basic education
Ensure children areready to learn in school
Select and support teachers throughout their careers to allow them to focus on the classroom
LEARNING

Align institutions to ensure basic conditions for learning
1

Top Performing systems had an unshakeable commitment to developing skills for prosperity
Source: Barro and Lee 2013.
Singapore
Taiwan
Hong Kong
Korea
Japan
Percent of population with no schooling in 1950
68%
55%42%
35%
8%

Top Performing systems had an unshakeable commitment to developing skills for prosperity
Source: Barro and Lee 2013.
Singapore
Taiwan
Hong Kong
Korea
Japan
18%
5%8%
7%
0%
Percent of population with no schooling in 2010

Concentrate effective, equity-minded public spending on basic education
2

Unlike Top Performing Systems, Below-Average Performing Systems still struggle to focus spending on basic education
Source: Japan Ministry of Education.
Percent of government education spendingElementary Tertiary
2014 201620111980 20001960
IndonesiaJapan
0%
70%
35%
Source: Indonesia Ministry of Education and Culture.

Select and support teachers throughout their careers to allow them to focus on the classroom
3
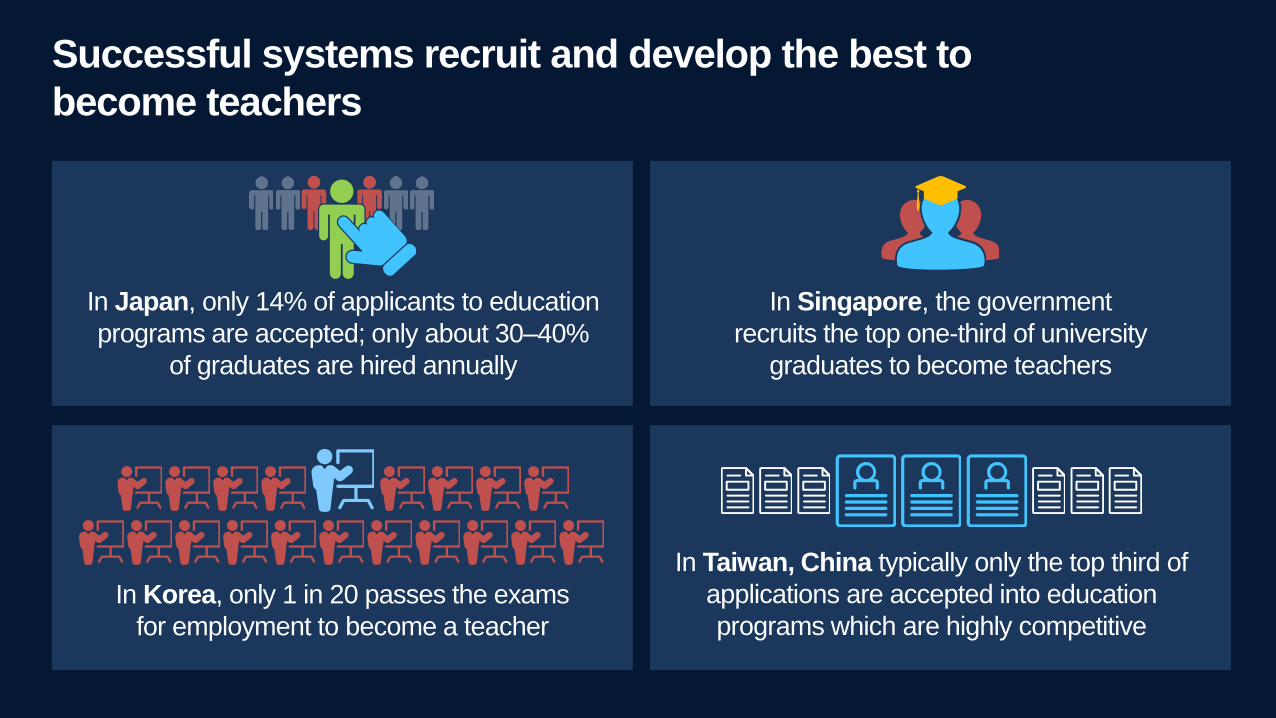
Successful systems recruit and develop the best to become teachers
In Japan, only 14% of applicants to education programs are accepted; only about 30–40%
of graduates are hired annually
In Singapore, the government recruits the top one-third of university
graduates to become teachers
In Korea, only 1 in 20 passes the exams for employment to become a teacher
In Taiwan, China typically only the top third of applications are accepted into education programs which are highly competitive

Top Performing and Above Average Performing Systems in EAP tend to use more elaboration and less memorization
Source: OECD 2016.
Teaching and learning strategies in mathematics around the world
Morememorization
More elaboration
More student-oriented instruction
More teacher-directed instruction
Indonesia
MalaysiaThailand
Taiwan, China
Korea Shanghai, ChinaVietnam
Hong Kong, SAR
United Kingdom
United StatesFinland
Macau, SAR
OECD average

Ensure that children are ready to learn in school
4
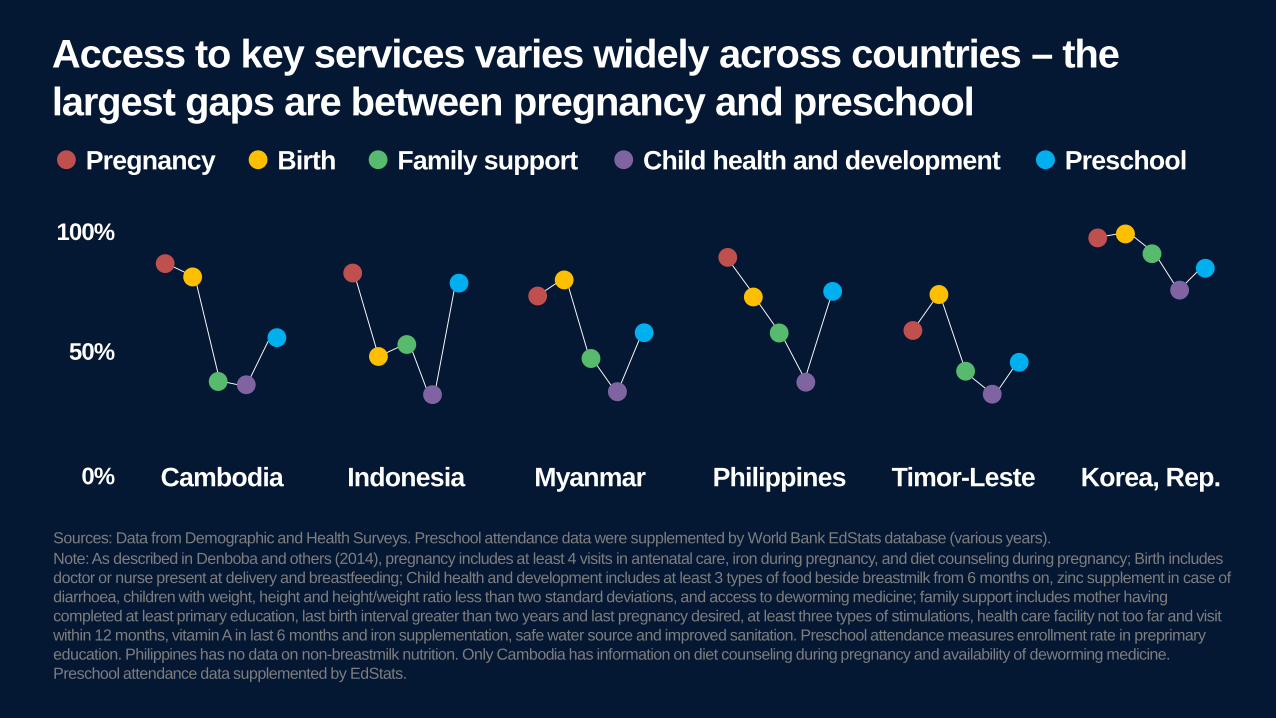
Access to key services varies widely across countries – the largest gaps are between pregnancy and preschool
Sources: Data from Demographic and Health Surveys. Preschool attendance data were supplemented by World Bank EdStats database (various years).Note: As described in Denboba and others (2014), pregnancy includes at least 4 visits in antenatal care, iron during pregnancy, and diet counseling during pregnancy; Birth includes doctor or nurse present at delivery and breastfeeding; Child health and development includes at least 3 types of food beside breastmilk from 6 months on, zinc supplement in case of diarrhoea, children with weight, height and height/weight ratio less than two standard deviations, and access to deworming medicine; family support includes mother having completed at least primary education, last birth interval greater than two years and last pregnancy desired, at least three types of stimulations, health care facility not too far and visit within 12 months, vitamin A in last 6 months and iron supplementation, safe water source and improved sanitation. Preschool attendance measures enrollment rate in preprimaryeducation. Philippines has no data on non-breastmilk nutrition. Only Cambodia has information on diet counseling during pregnancy and availability of deworming medicine. Preschool attendance data supplemented by EdStats.
0% Cambodia Indonesia Myanmar Philippines Timor-Leste Korea, Rep.
100%
Pregnancy Birth Child health and development PreschoolFamily support
50%

Assess students to inform instruction
5

Data from assessments have spurred national reformsEGRA zero-word readers, 2nd grade
Source: Graham and Kelly 2017. Note: All data are from nationally representative samples completed in the second half of the school year. Zero-word scores are based on the oral reading fluency subcomponent for all countries except Cambodia and Timor-Leste, for which it is based on the familiar word reading subcomponent.
Indonesia
Tonga
Myanmar – Yangon
Cambodia
Vanuatu
Timor-Leste
Philippines - Cebuano0% 60%30%

Data from assessments have spurred national reformsEGRA zero-word readers, 2nd grade
2010
Source: Graham and Kelly 2017. Note: Data are from nationally representative samples completed in the second half of the school year. Cambodia scores based on the familiar word reading subcomponent.
Cambodia
0% 60%30%
48%

Data from assessments have spurred national reformsEGRA zero-word readers, 2nd grade
2012
Source: Graham and Kelly 2017. Note: Data are from nationally representative samples completed in the second half of the school year. Cambodia scores based on the familiar word reading subcomponent.
Cambodia
0% 60%30%
33%

Actions across policy domains drive learning
Aligninstitutions to ensurebasic
conditions for learning
Ensurethat children are ready
to learn in school
Assessstudents to diagnose issues
and inform instruction
Concentrateeffective, equity-minded
public spending on basic education
Select and supportteachers throughout their careers
to allow them to focusonthe classroom

Thank you!
Harry Patrinos@hpatrinos
Michael CrawfordAmer Hasan
@ahasanwbRaja Bentaouet Kattan