Embed Size (px)
Citation preview
Lean OfficeTraining YOU to Recreate Your
World
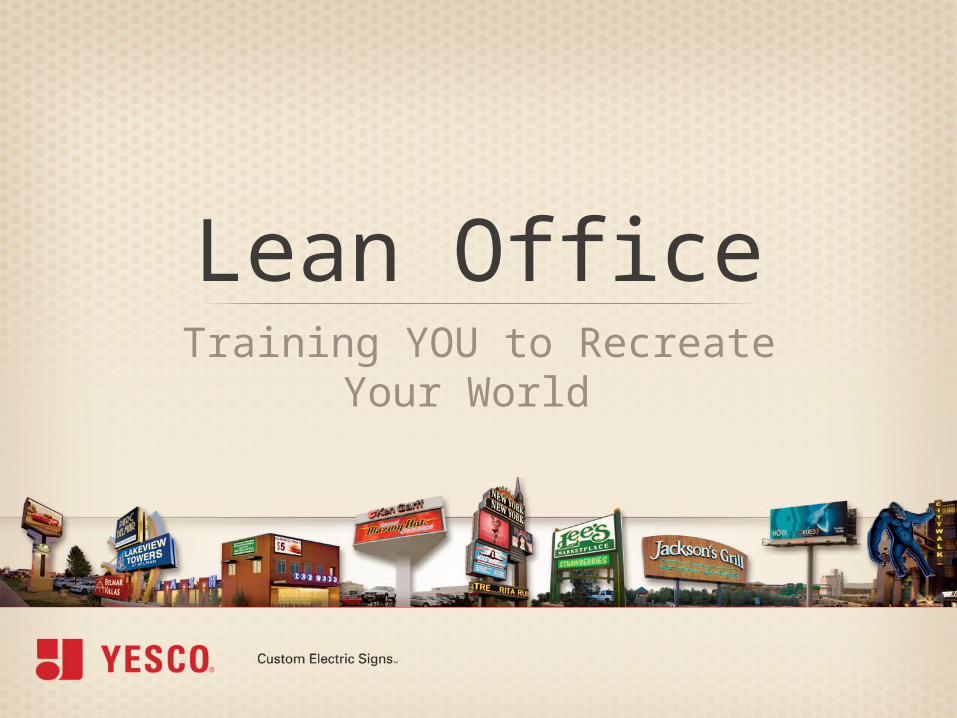
Course Agenda» Lean office overview
» Definition of waste
» Orientation to YESCO Hawaii
» Round one of simulation
» Value Stream Mapping (current state)
» Implementing lean tools
» Round two of simulation
» Value Stream Mapping (future state)
» Round three final simulation
» Final Evaluation
2
Introductions
» Who are you?
» Where are you from?
» What do you want to learn today?
» ?’s
3
What is Lean Office?Lean Office is a systematic
approach applied to the value chain with an aim to streamline the business processes by:
» Eliminating waste» Utilizing lean techniques» Resulting in: Lead time
reduction and Productivity improvement
4
Why Lean Office?
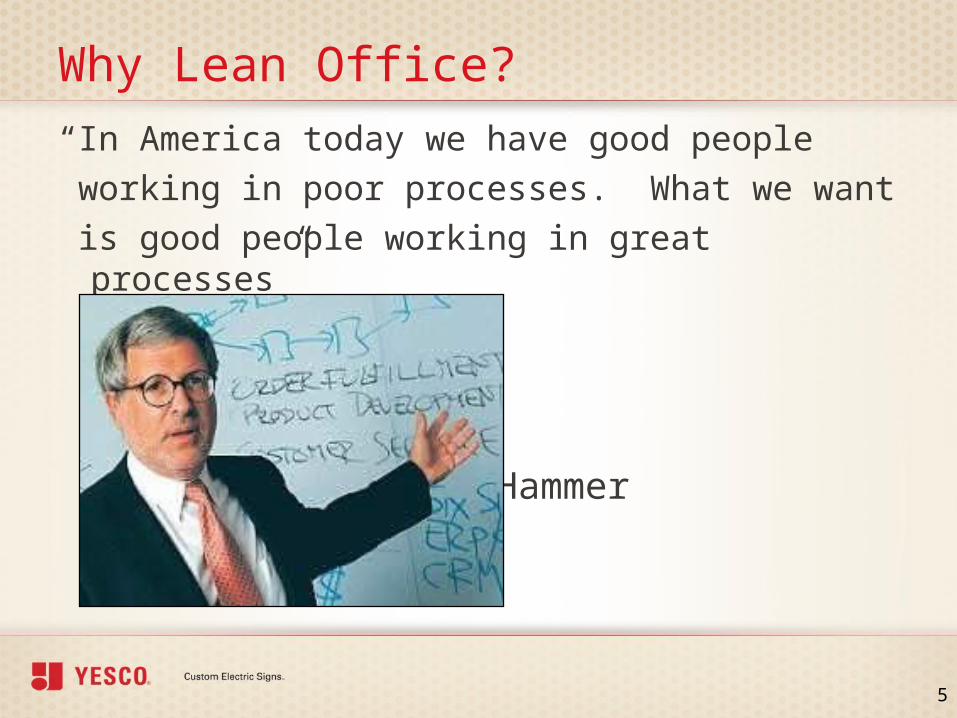
“In America today we have good people
working in poor processes. What we want
is good people working in great processes”
Michael Hammer
5
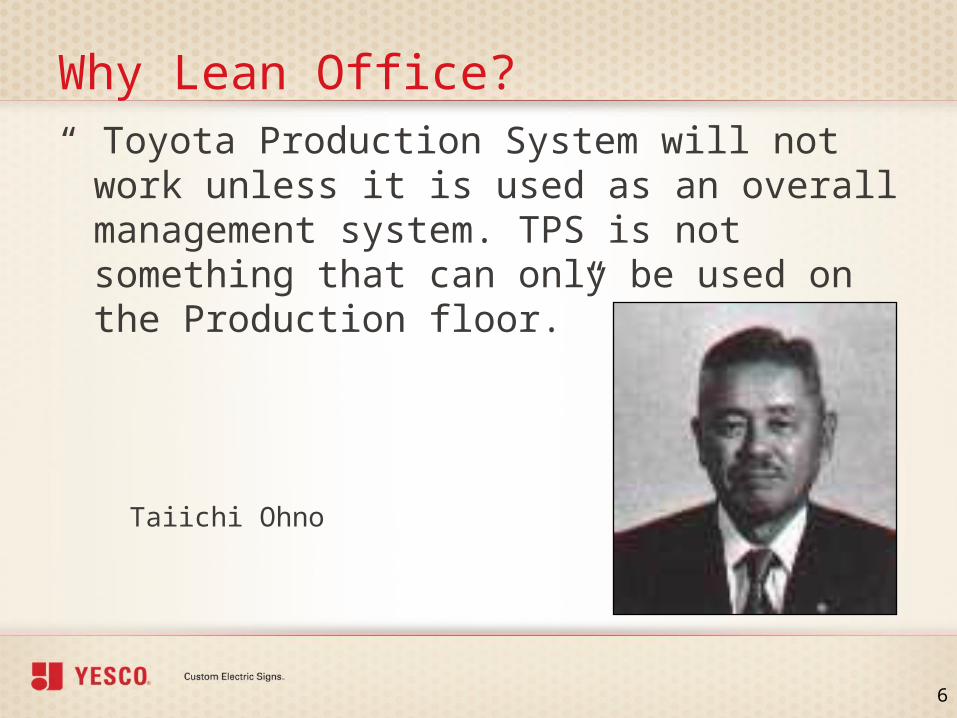
Why Lean Office?“ Toyota Production System will not work unless it
is used as an overall management system. TPS is not something that can only be used on the Production floor.”
Taiichi Ohno
6
Lean Office
$$LEAD TIME REDUCTION
7
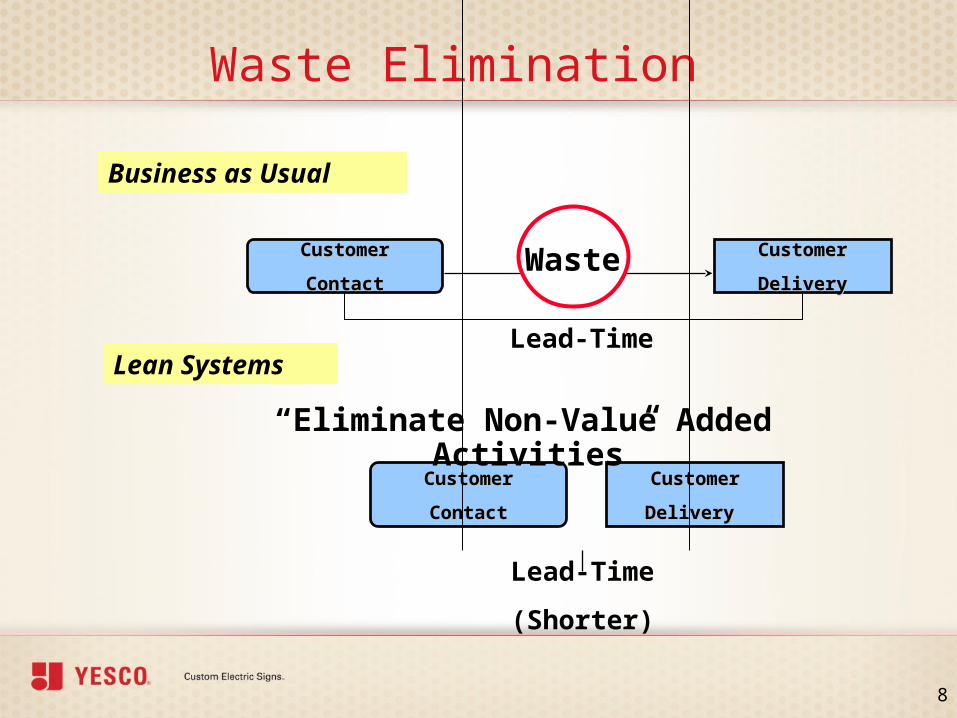
Lean Systems
Business as Usual
CustomerCustomer
DeliveryDelivery
CustomerCustomer
ContactContact
Lead-Time
Waste
CustomerCustomer
Delivery Delivery
CustomerCustomer
ContactContact
Lead-Time
(Shorter)
Waste Elimination
“Eliminate Non-Value Added Activities”
8
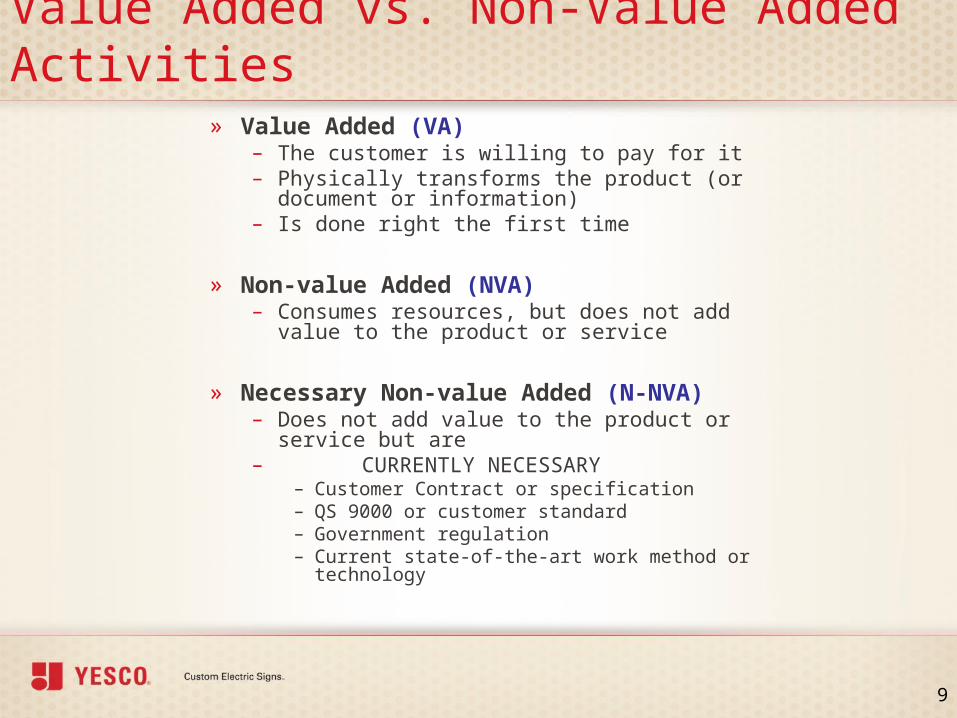
Value Added vs. Non-Value Added Activities» Value Added (VA)
– The customer is willing to pay for it– Physically transforms the product (or document
or information)– Is done right the first time
» Non-value Added (NVA)– Consumes resources, but does not add value to
the product or service
» Necessary Non-value Added (N-NVA)– Does not add value to the product or service but
are – CURRENTLY NECESSARY
– Customer Contract or specification – QS 9000 or customer standard– Government regulation– Current state-of-the-art work method or technology
9
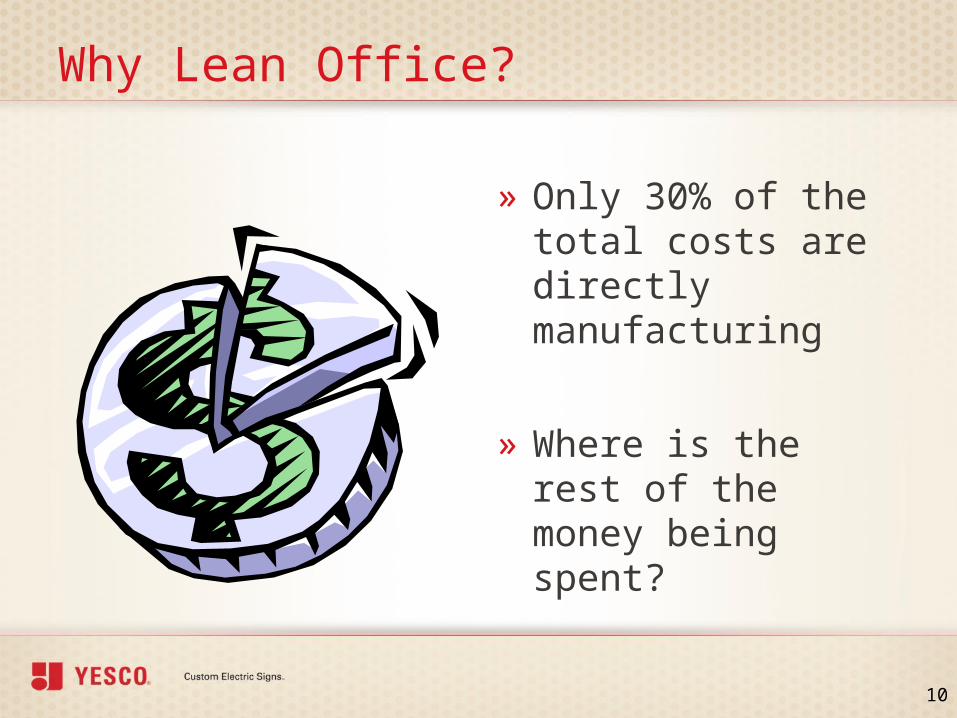
Why Lean Office?
» Only 30% of the total costs are directly manufacturing
» Where is the rest of the money being spent?
10
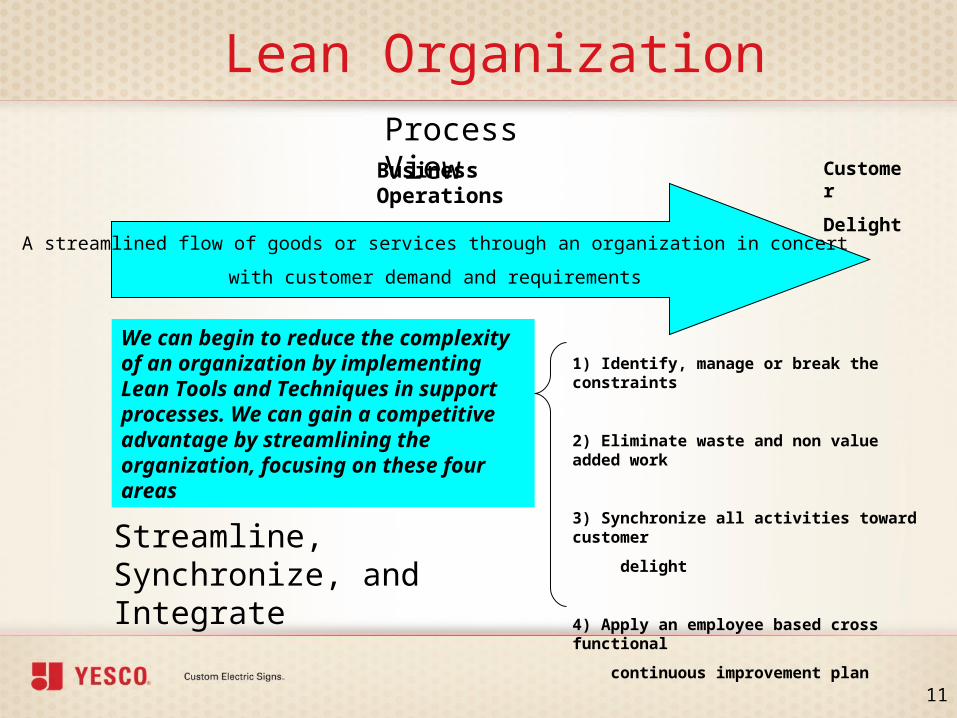
Lean Organization
A streamlined flow of goods or services through an organization in concert
with customer demand and requirements
Customer
Delight
Business Operations
1) Identify, manage or break the constraints
2) Eliminate waste and non value added work
3) Synchronize all activities toward customer
delight
4) Apply an employee based cross functional
continuous improvement plan
Streamline, Synchronize, and Integrate
Process View
We can begin to reduce the complexity of an organization by implementing Lean Tools and Techniques in support processes. We can gain a competitive advantage by streamlining the organization, focusing on these four areas
11
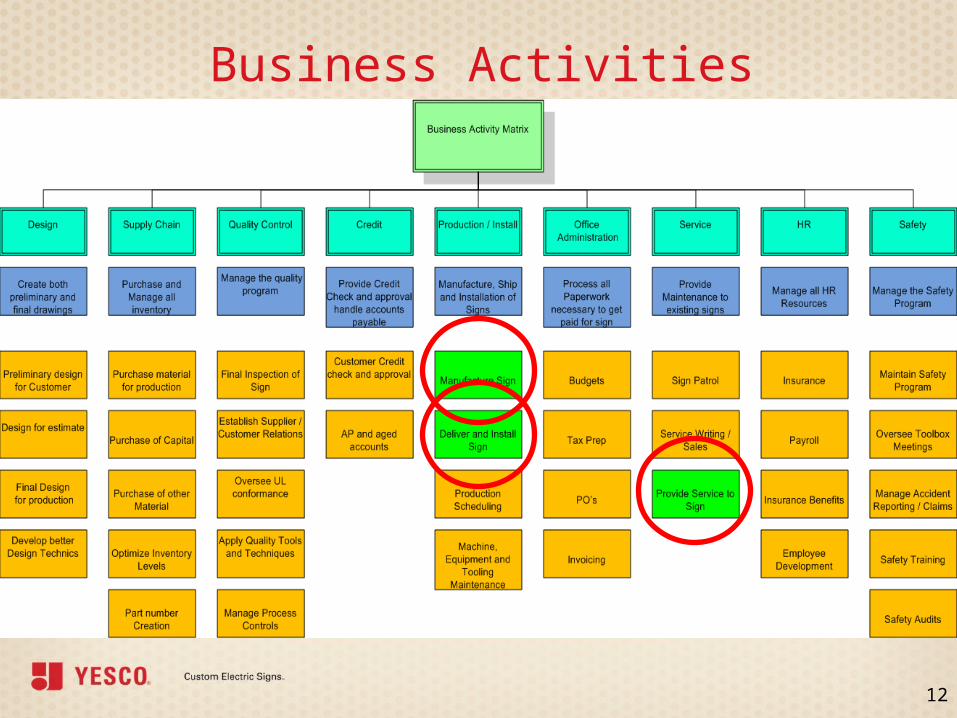
Business Activities
12
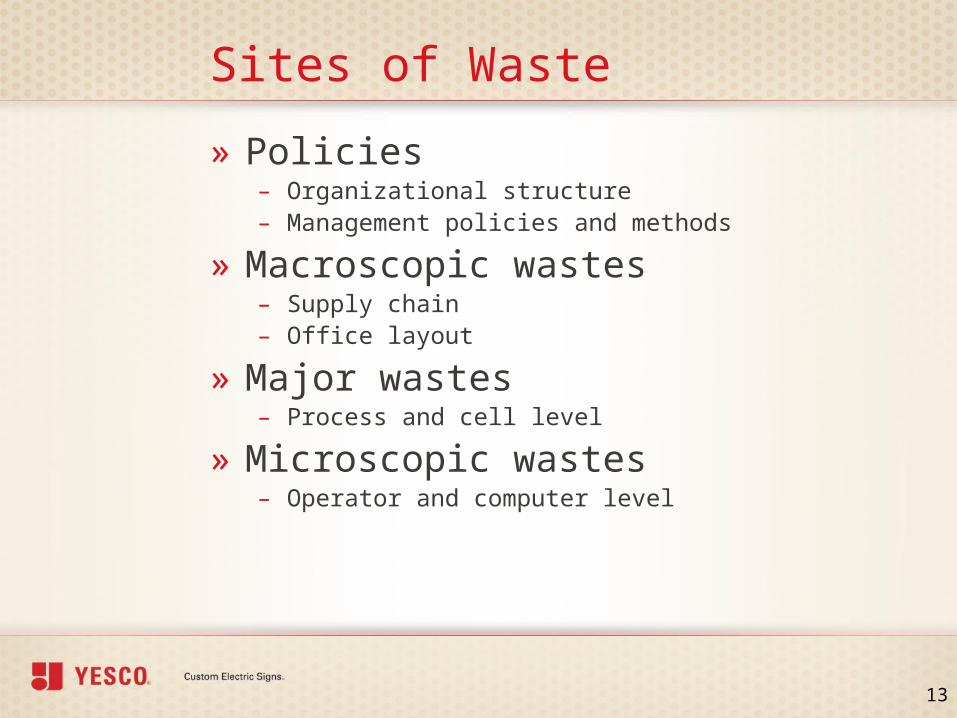
Sites of Waste
» Policies – Organizational structure– Management policies and methods
» Macroscopic wastes – Supply chain– Office layout
» Major wastes – Process and cell level
» Microscopic wastes – Operator and computer level
13
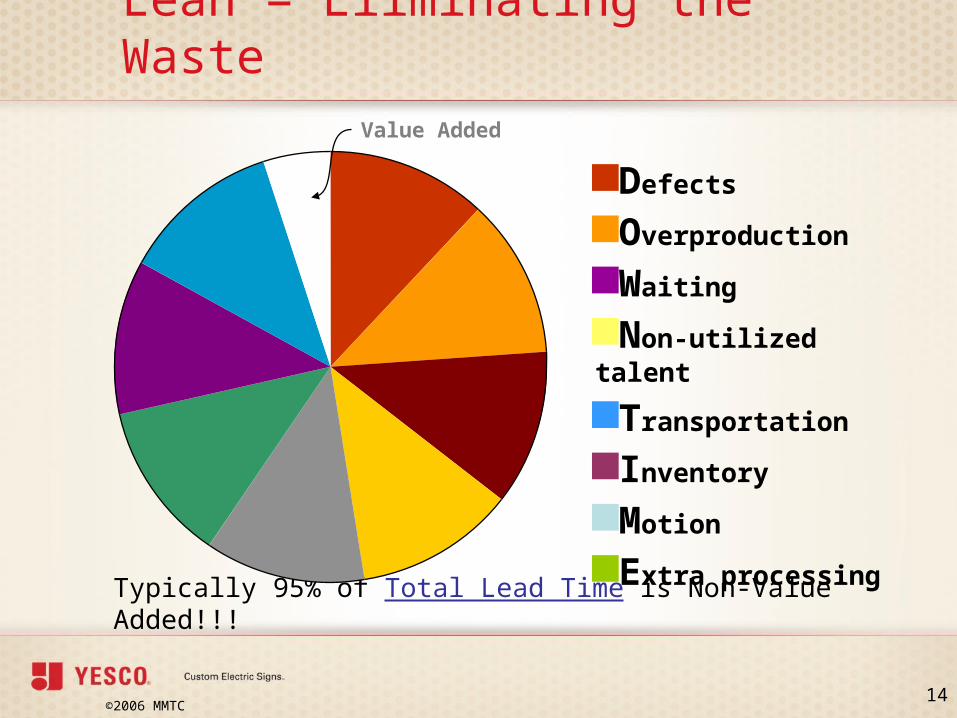
Defects
Overproduction
Waiting
Non-utilized talent
Transportation
Inventory
Motion
Extra processing
Typically 95% of Total Lead Time is Non-Value Added!!!
Value Added
Lean = Eliminating the Waste
©2006 MMTC14
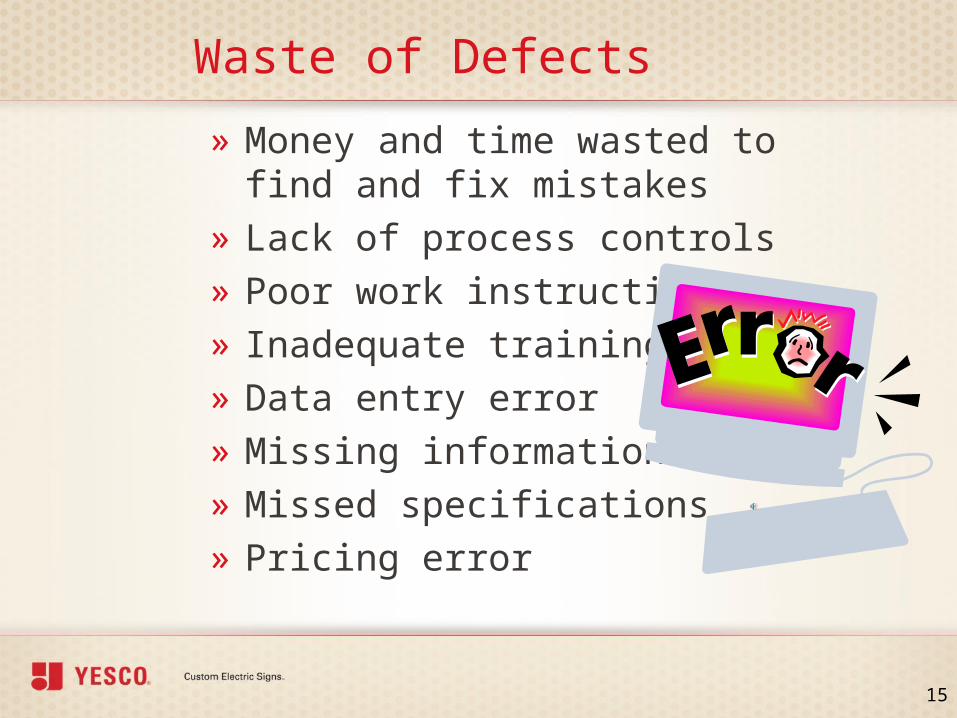
Waste of Defects
» Money and time wasted to find and fix mistakes
» Lack of process controls» Poor work instructions» Inadequate training» Data entry error» Missing information» Missed specifications» Pricing error
15
Waste of Overproduction
» Making multiple schedules due to system incompatibilities
» E-mails/memos to everyone
» Printing extra documents just-in-case
» More information than the process requires
» More information than the customer needs
» Creating reports no one reads
16
Waste of Waiting
» Time lost when people and resources are waiting: » Unbalanced workload» Equipment break downs» Batch processing» Waiting for information» Waiting for copiers/faxes» Waiting for customer response» Waiting for an internal response
17
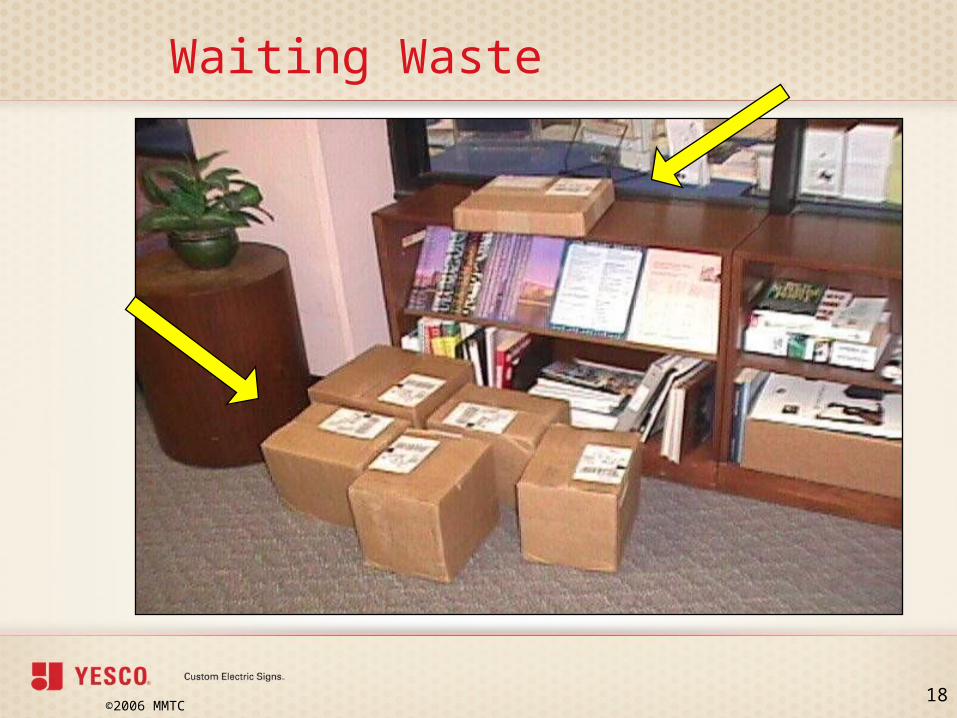
Waiting Waste
©2006 MMTC18
Waste of Non-Utilized Talent
» Unclear job descriptions
» Lack of training
» Lack of synergy and collaboration
» No feedback loop for continuous improvement
» Suggestions for improvements that are not investigated/utilized
19
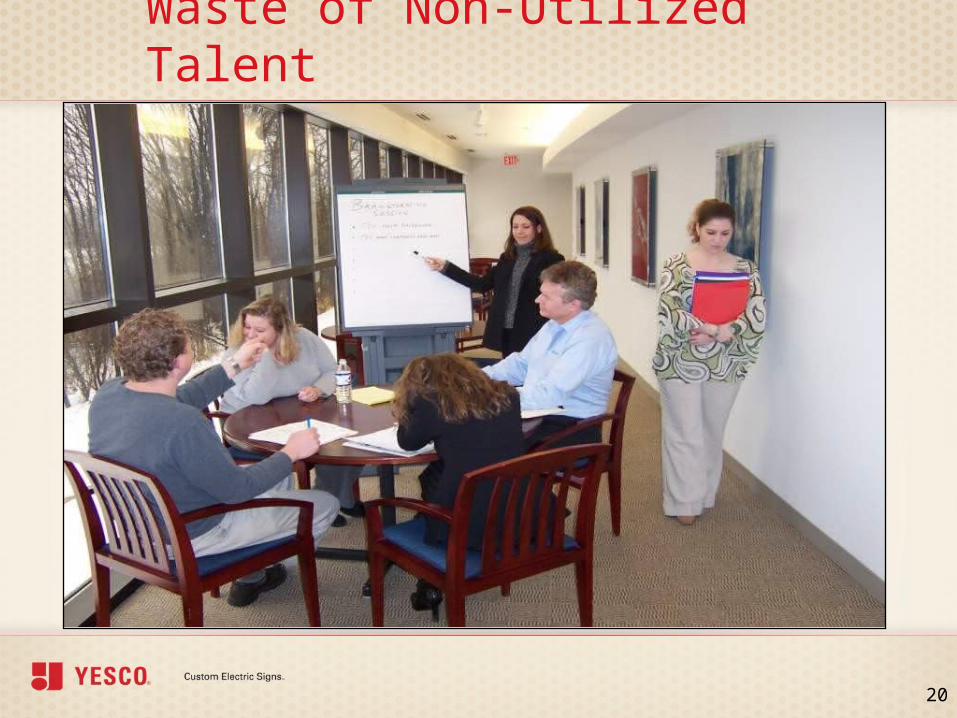
Waste of Non-Utilized Talent
20
Waste of Transportation
» Poor office layout
» Walking around to correct mistakes and find answers
» Retrieving or storing files
» Carrying documents to and from shared equipment
» Going to get signatures
» Taking files to another person
21
Waste of Inventory
» Storing of obsolete prints and specs
» Obsolete databases/files and folders
» Files pile up between work desks
» Open projects (WIP)
» Office supplies
» E-mails waiting to be read
» Unused records in a database
22
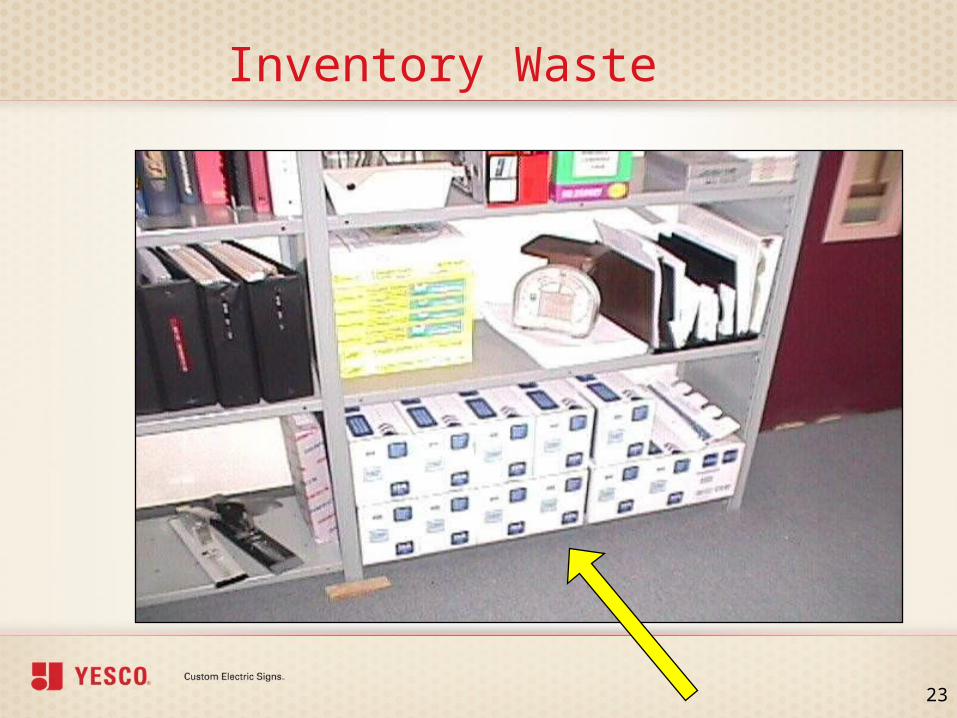
Inventory Waste
23
Waste of Motion
» Looking for items because they are out of place
» Mis- or unfiled papers
» Saving files everywhere
» Handling paperwork that could be electronic
» Extra clicks or keystrokes
» Working around other open files on desk
24
Waste of Extra Processing
» Doing more than is required to meet customer requirements
» Unnecessary paperwork
» Redundant approvals
» Repeated manual entry of data
» Use of outdated standard forms
» Use of inappropriate software
» Creating hard copies of reports
25
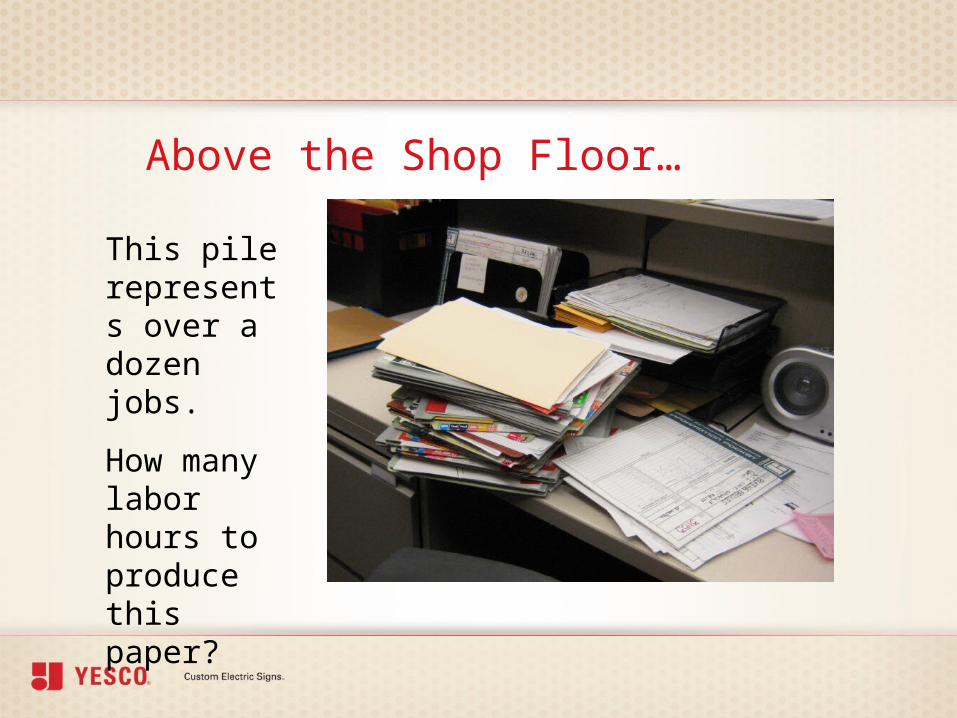
Above the Shop Floor…
This pile represents over a dozen jobs.
How many labor hours to produce this paper?
Office Simulation
Let’s learn by doing!
28
YESCO HawaiiA New Division
29
YESCO Hawaii Orientation
» You are all employees of YESCO Hawaii» Positions to be filled:
- Sales - Material Control- Business Office - Scheduling-Engineering - Production/Installation
-Process Engineer
» We will work in batches of 5 at Sales and 1 everywhere else
» We will measure the following- # of orders shipped- # of invoices faxed- # of quote drawings completed- Work in process
30
YESCO Hawaii – Company Policies
» Work shift is 10 minutes
» Keep busy at all times
» The goal is to Install and invoice 14 orders and complete 3 new business quotes
31
YESCO Hawaii
Round 1Round 1
32

Metrics Scorecard
33
Measures Team 1 Team 2 Team 1 Team 2 Team 1 Team 2Lead TimeWork-In-ProcessOrders Shipped/InstalledDrawings QuotedInvoiced $s $0Material Costs $0Labor Costs $0Overhead Fixed Costs ($5,000) $0
Total Cost $0 $0 $0 $0 $0 $0Total Revenue $0 $0 $0 $0 $0 $0
Profit / Loss Totals $0 $0 $0 $0 $0 $0
YESCO Hawaii
Round 2Round 2
34
Make some improvements!

Metrics Scorecard
35
Measures Team 1 Team 2 Team 1 Team 2 Team 1 Team 2Lead TimeWork-In-ProcessOrders Shipped/InstalledDrawings QuotedInvoiced $s $0Material Costs $0Labor Costs $0Overhead Fixed Costs ($5,000) $0
Total Cost $0 $0 $0 $0 $0 $0Total Revenue $0 $0 $0 $0 $0 $0
Profit / Loss Totals $0 $0 $0 $0 $0 $0
LET’S GET LEAN
Learn the tools to recreate your WORLD
36
Its all aboutIts all about
TimeTime
DVD
37
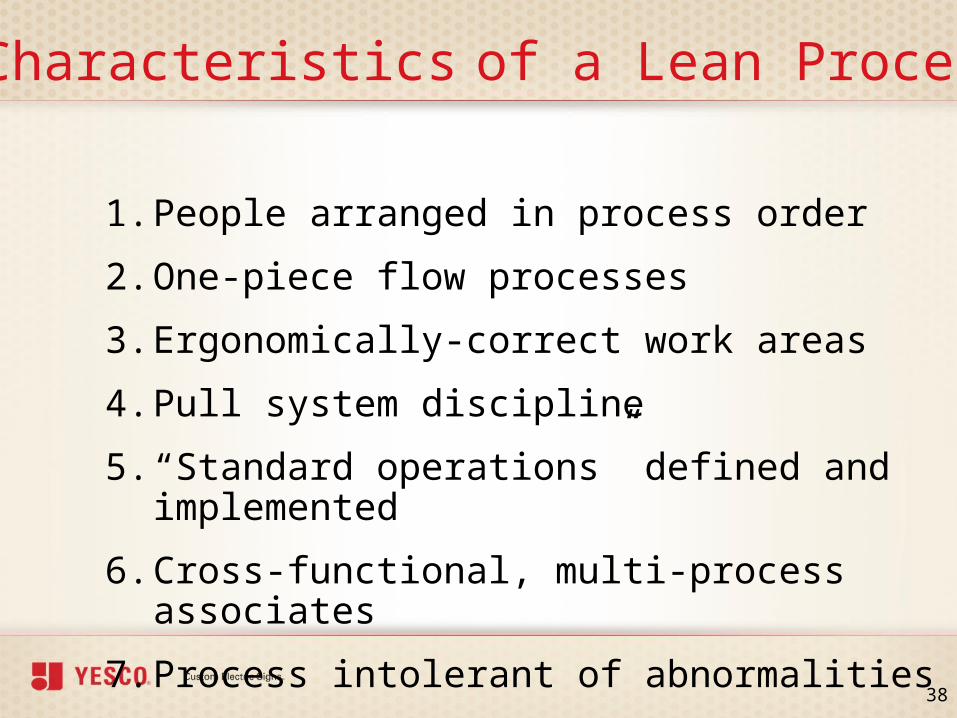
Characteristics of a Lean Process
1. People arranged in process order
2. One-piece flow processes
3. Ergonomically-correct work areas
4. Pull system discipline
5. “Standard operations” defined and implemented
6. Cross-functional, multi-process associates
7. Process intolerant of abnormalities
38
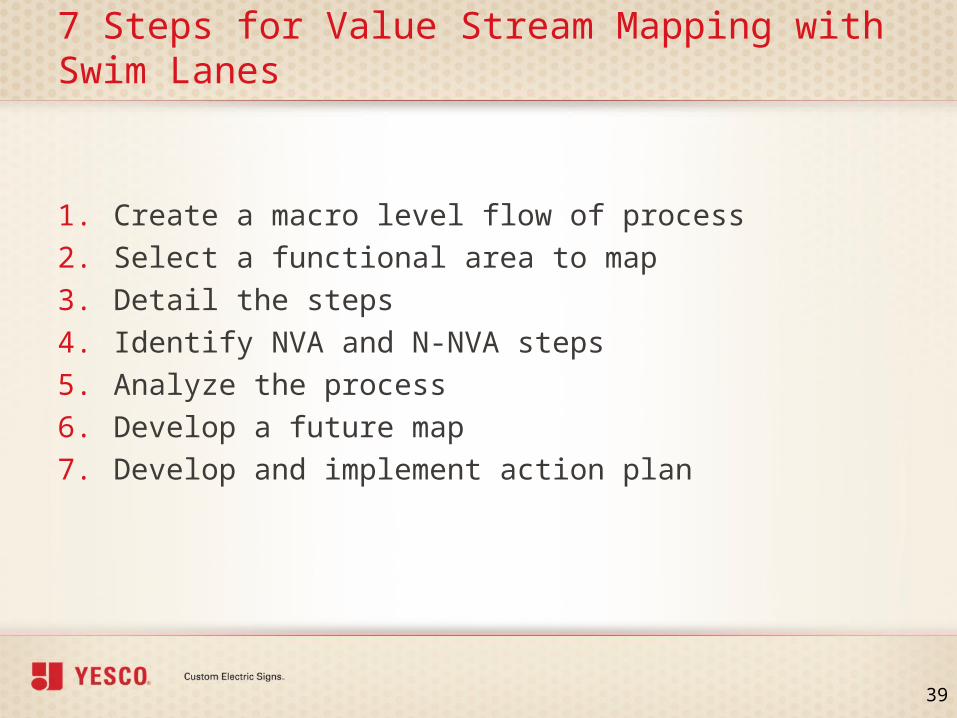
7 Steps for Value Stream Mapping with Swim Lanes
1. Create a macro level flow of process
2. Select a functional area to map
3. Detail the steps
4. Identify NVA and N-NVA steps
5. Analyze the process
6. Develop a future map
7. Develop and implement action plan
39
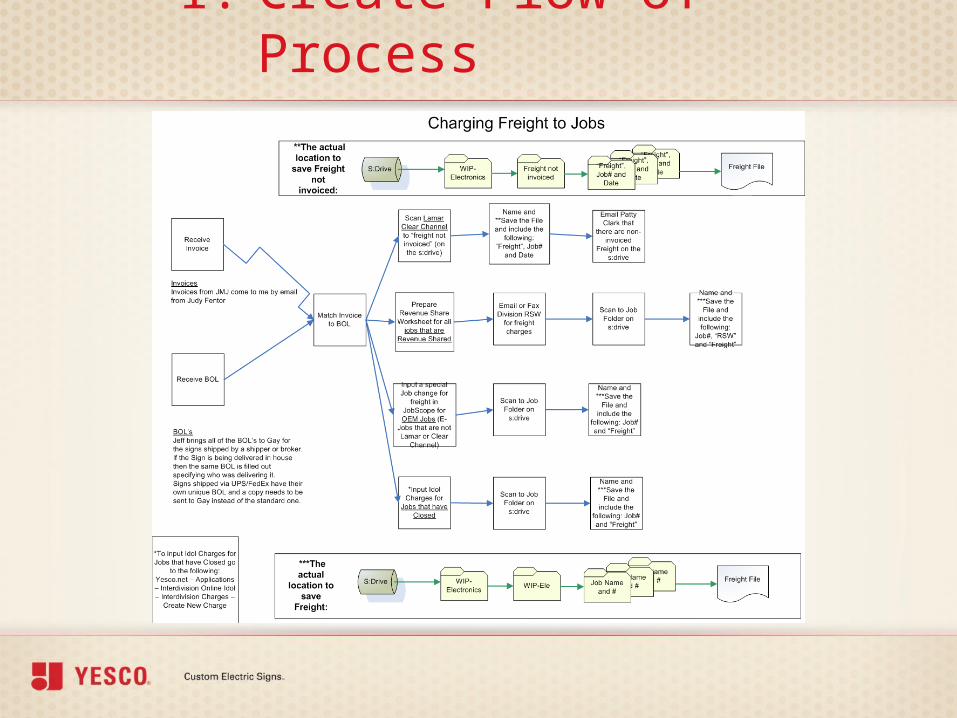
1. Create Flow of Process
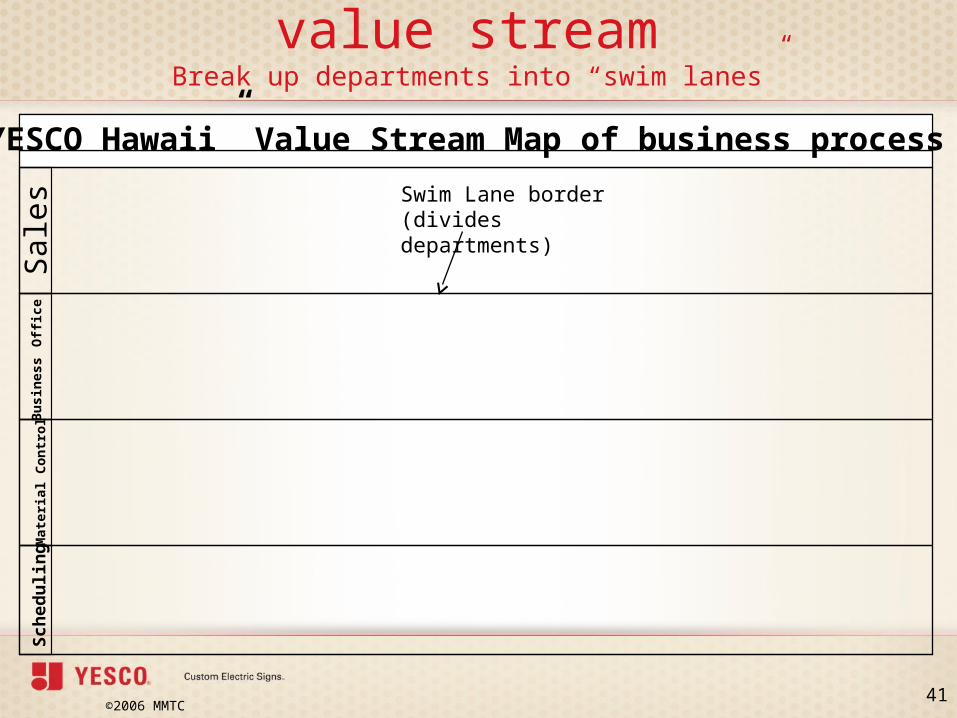
2. Select Functional Area or value stream
Break up departments into “swim lanes”
©2006 MMTC
“YESCO Hawaii” Value Stream Map of business process
Sch
edu
ling
Mat
eria
l Co
ntr
ol
Bu
sin
ess
Off
ice
Sa
les
41
Swim Lane border (divides departments)
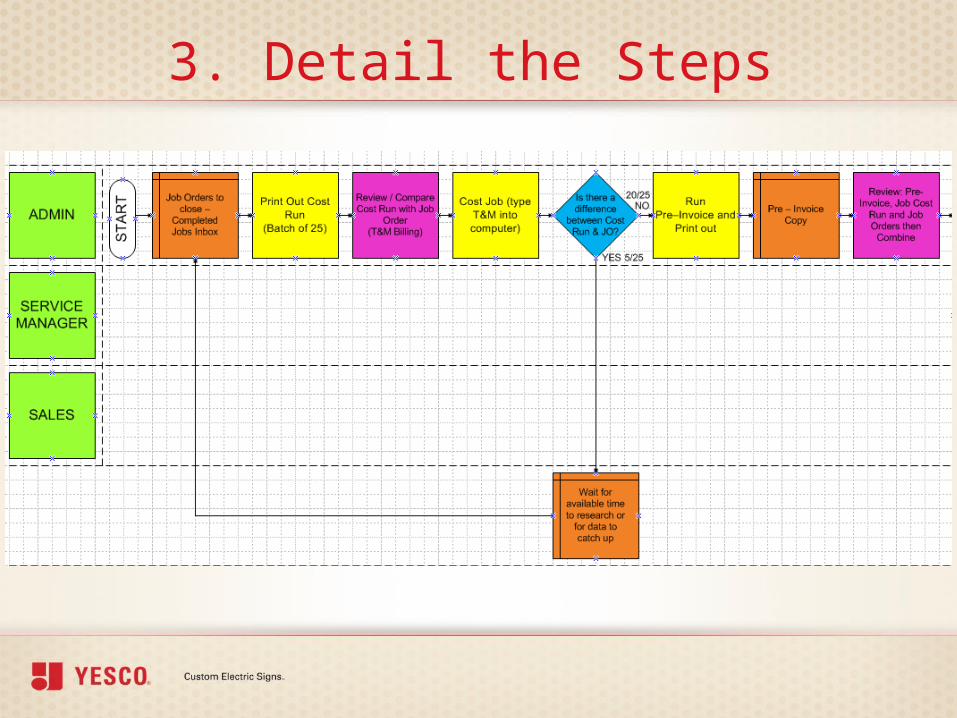
3. Detail the Steps
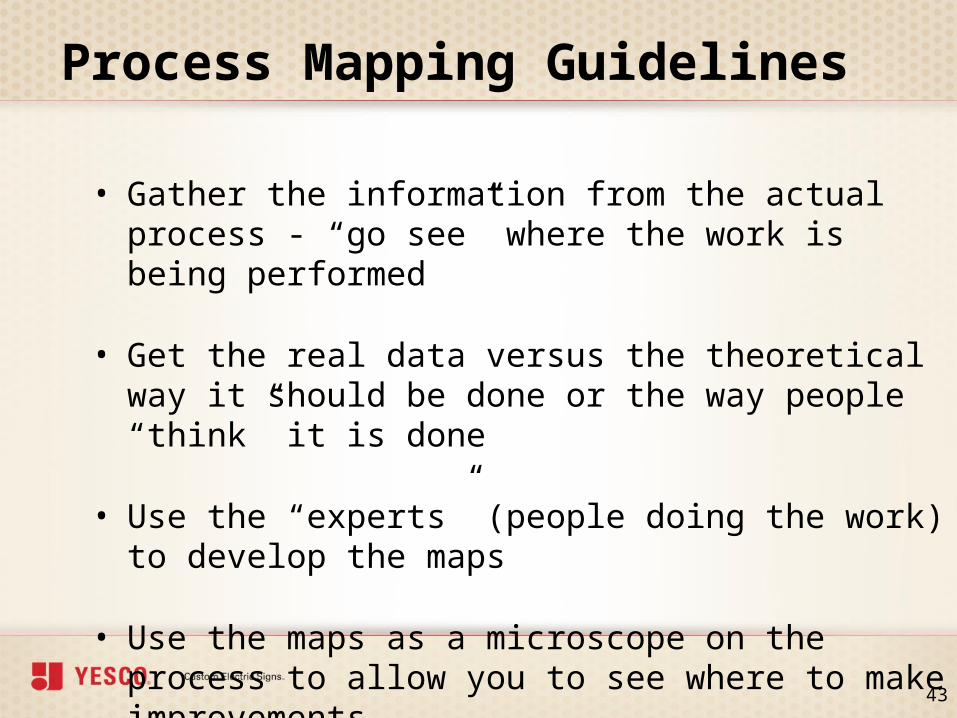
Process Mapping Guidelines
• Gather the information from the actual process - “go see” where the work is being performed
• Get the real data versus the theoretical way it should be done or the way people “think” it is done
• Use the “experts” (people doing the work) to develop the maps
• Use the maps as a microscope on the process to allow you to see where to make improvements
43
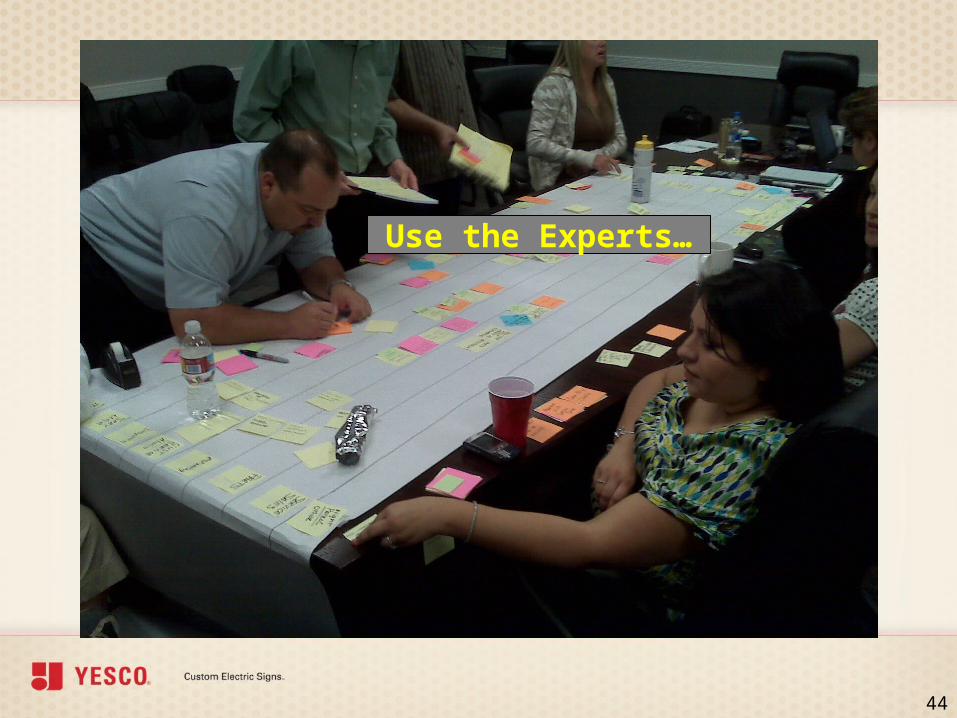
Use the Experts…
44
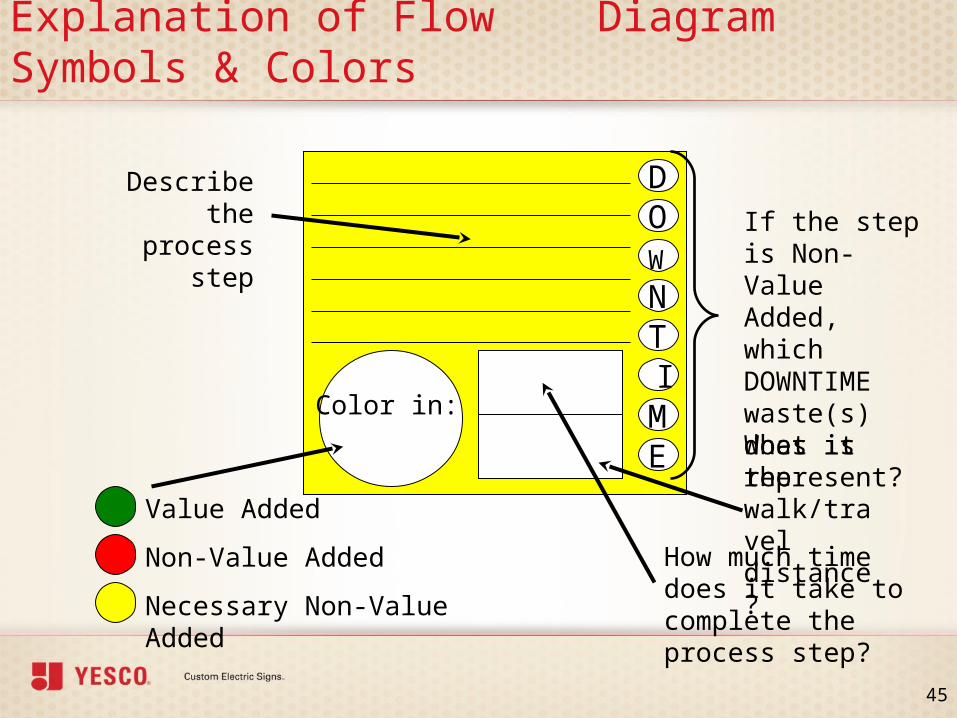
Explanation of Flow Diagram Symbols & Colors
D
W
NTIME
Describe the process
stepIf the step is Non-Value Added, which DOWNTIME waste(s) does it represent?
How much time does it take to complete the process step?
O
Value Added
Non-Value Added
Necessary Non-Value Added
What is the walk/travel distance?
Color in:
45
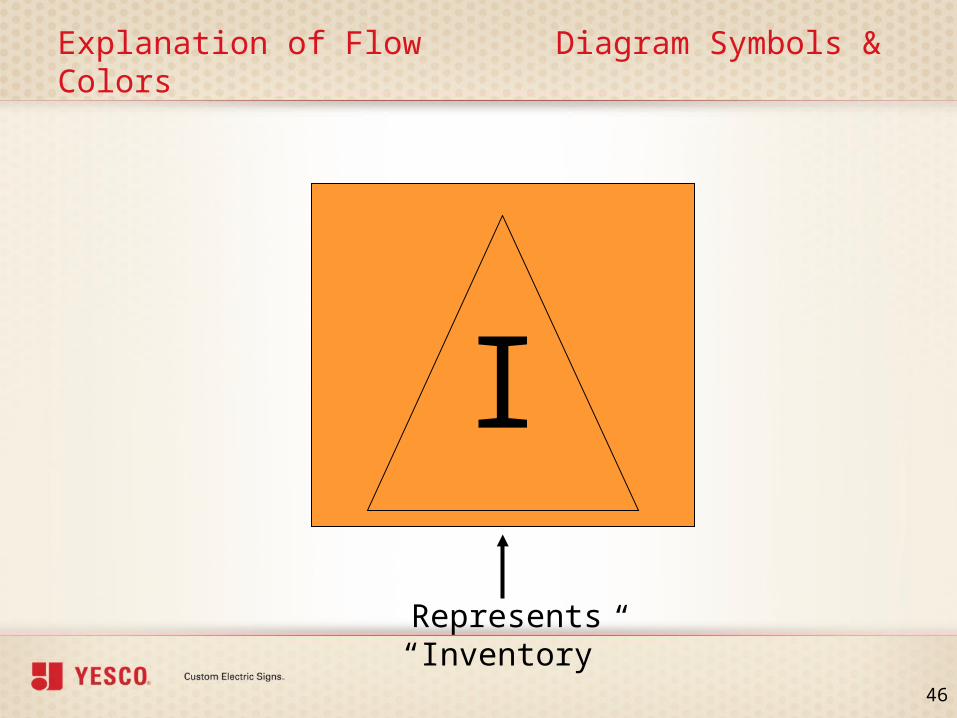
Explanation of Flow Diagram Symbols & Colors
Represents “Inventory”
I
46
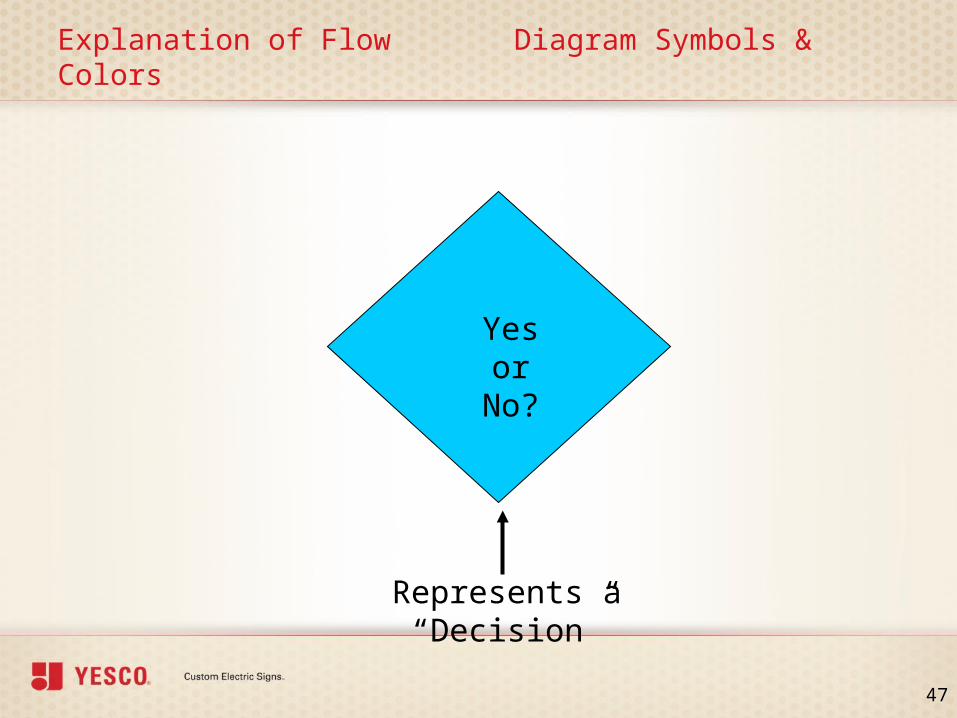
Explanation of Flow Diagram Symbols & Colors
Represents a “Decision”
47
Yes or No?
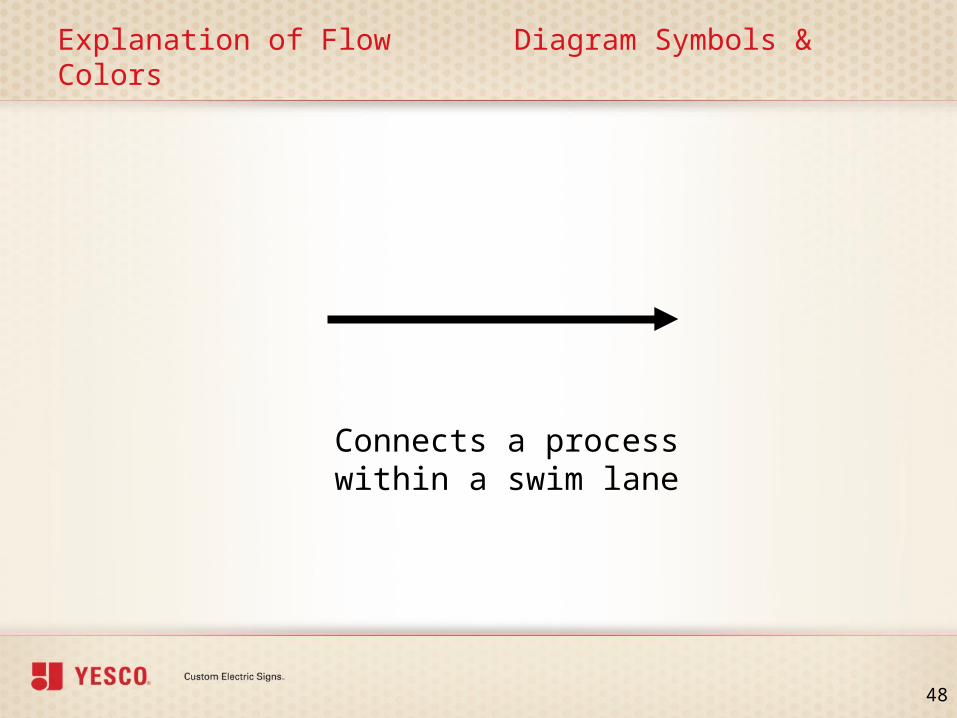
Explanation of Flow Diagram Symbols & Colors
Connects a process within a swim lane
48
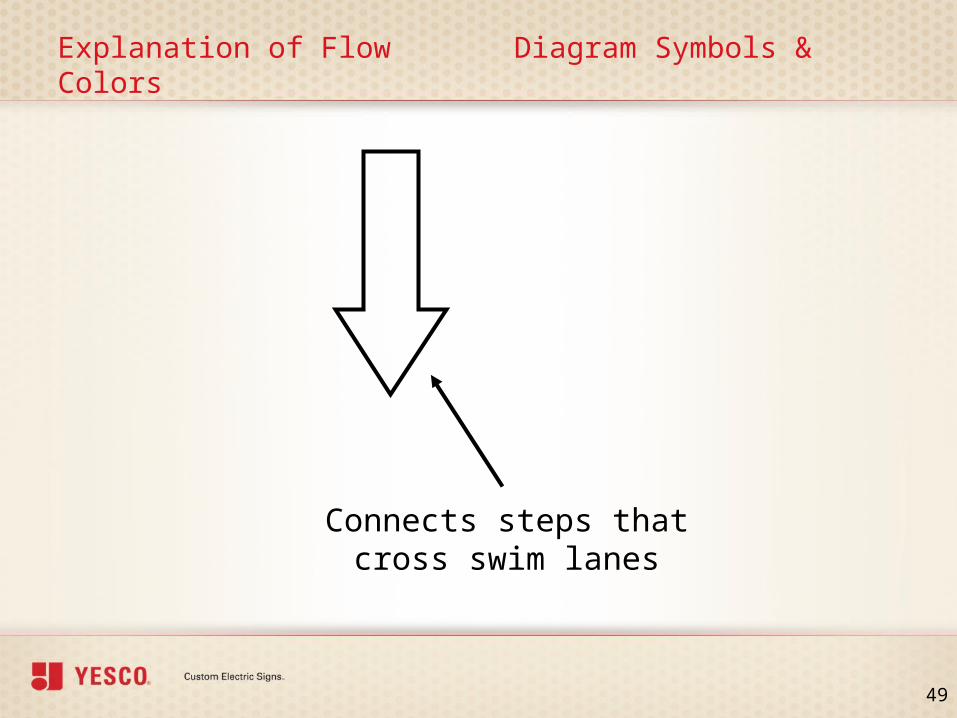
Explanation of Flow Diagram Symbols & Colors
Connects steps that cross swim lanes
49
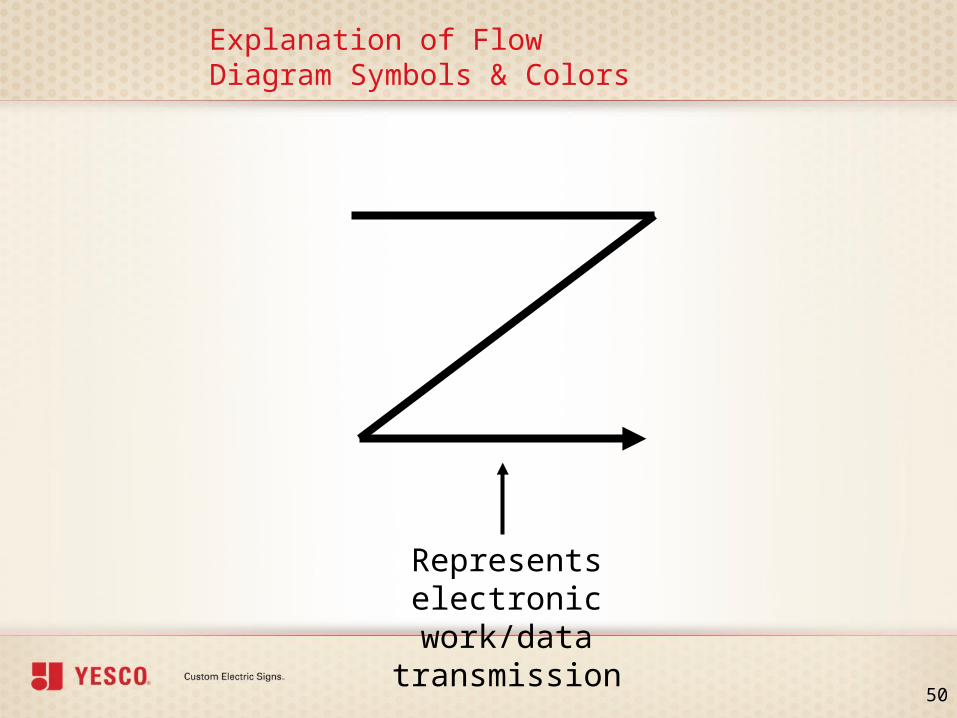
Explanation of Flow Diagram Symbols & Colors
Represents electronic work/data transmission
50
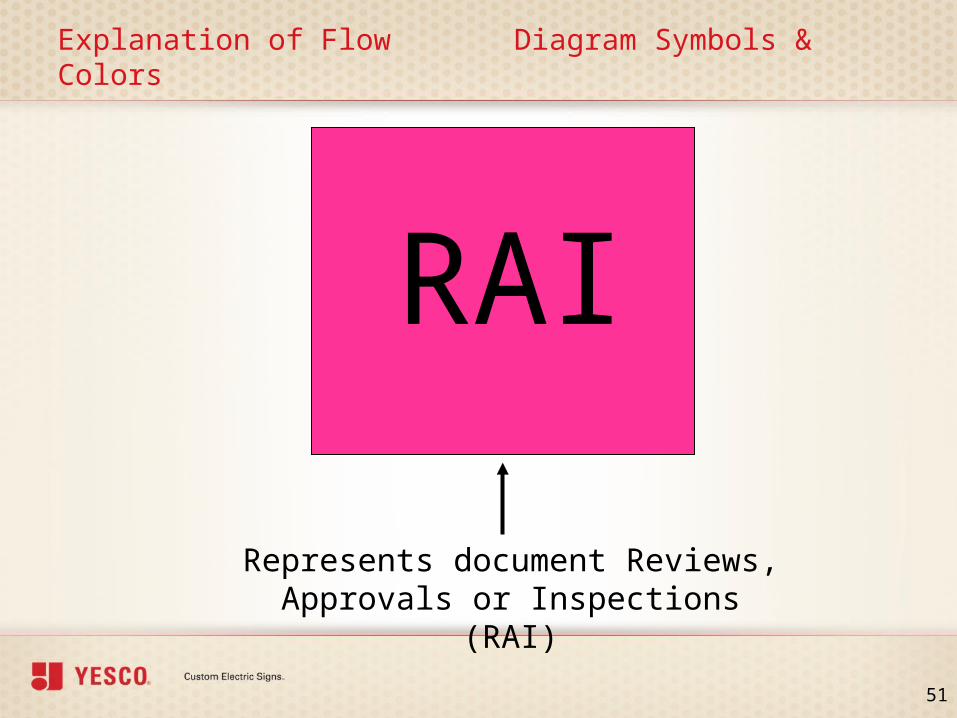
Explanation of Flow Diagram Symbols & Colors
Represents document Reviews, Approvals or Inspections (RAI)
RAI
51
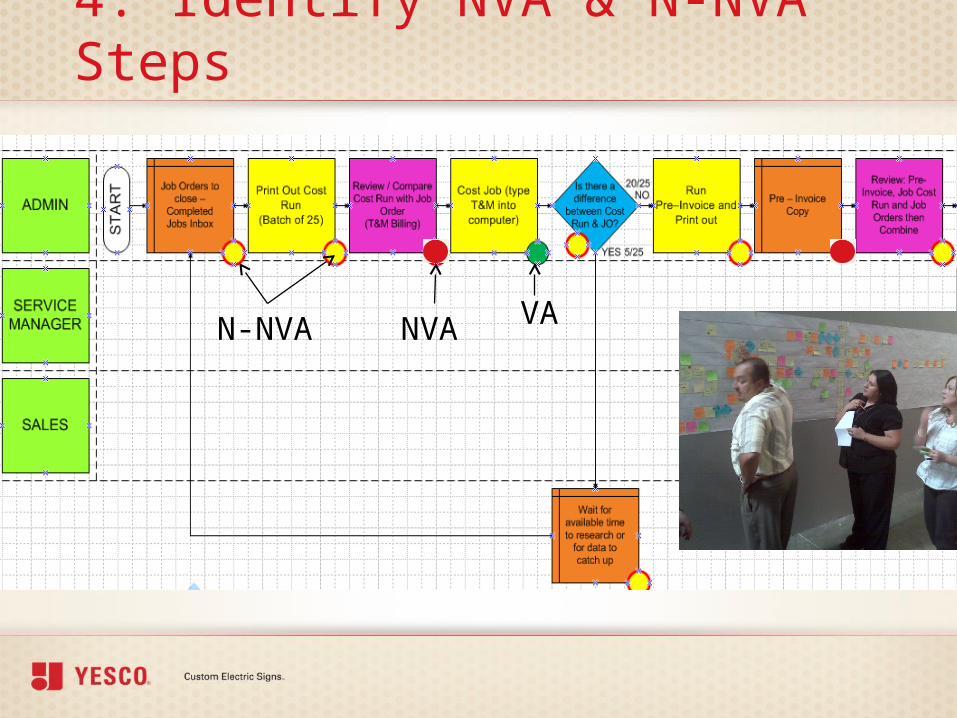
4. Identify NVA & N-NVA Steps
NVAN-NVA VA
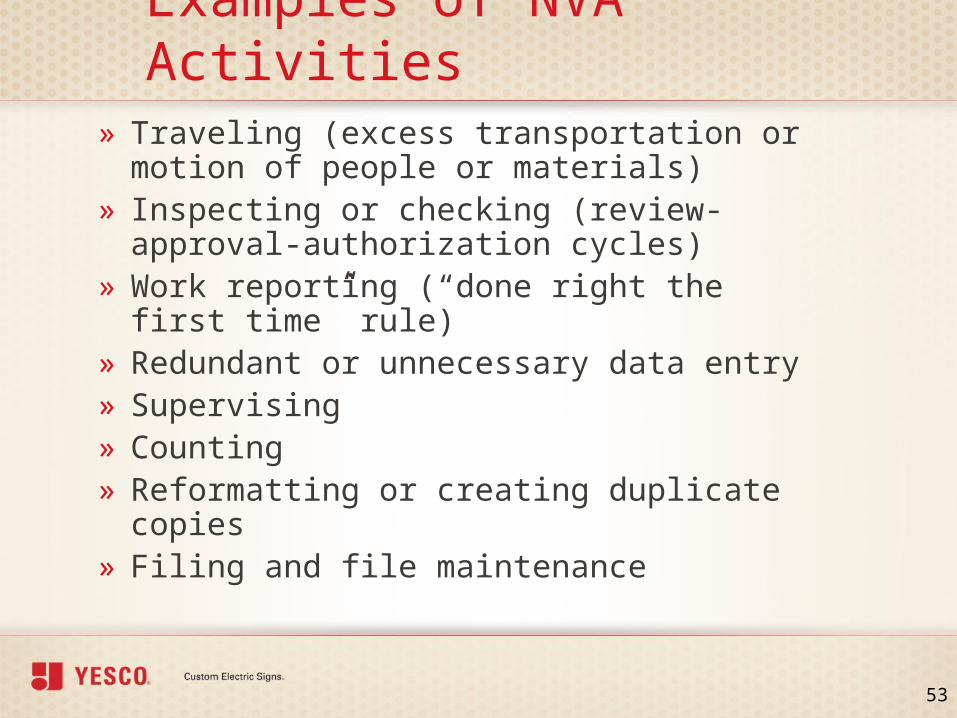
Examples of NVA Activities» Traveling (excess transportation or motion of
people or materials)» Inspecting or checking (review-approval-
authorization cycles)» Work reporting (“done right the first time” rule)» Redundant or unnecessary data entry» Supervising» Counting» Reformatting or creating duplicate copies» Filing and file maintenance
53
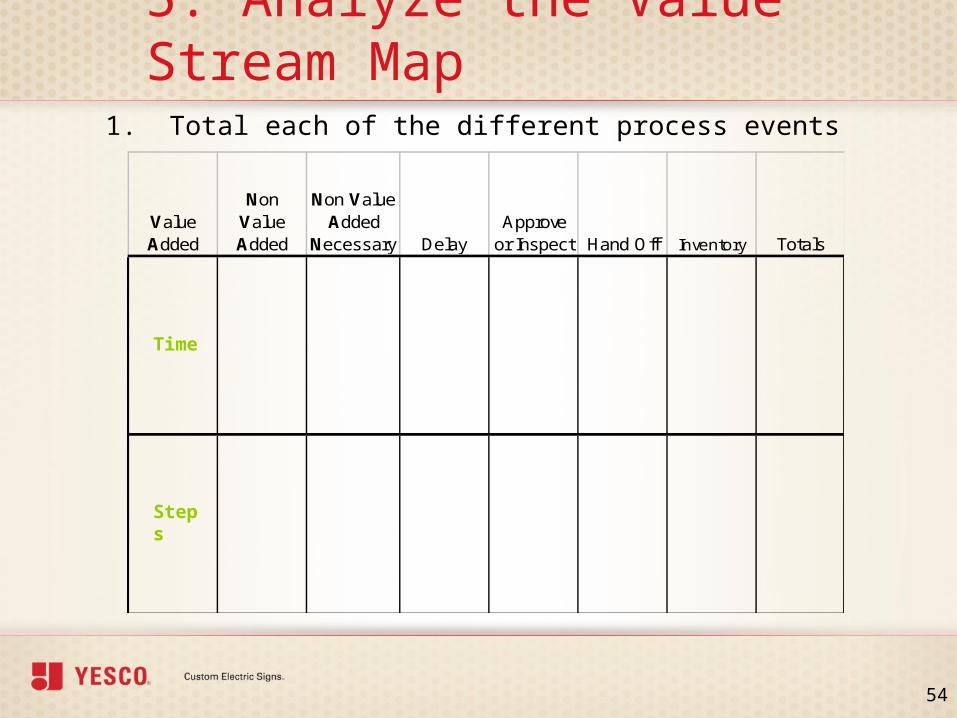
5. Analyze the Value Stream Map
1. Total each of the different process events
Value Added
Non Value Added
Non Value Added
Necessary DelayApprove
or Inspect Hand Off Inventory Totals
Steps
Time
54
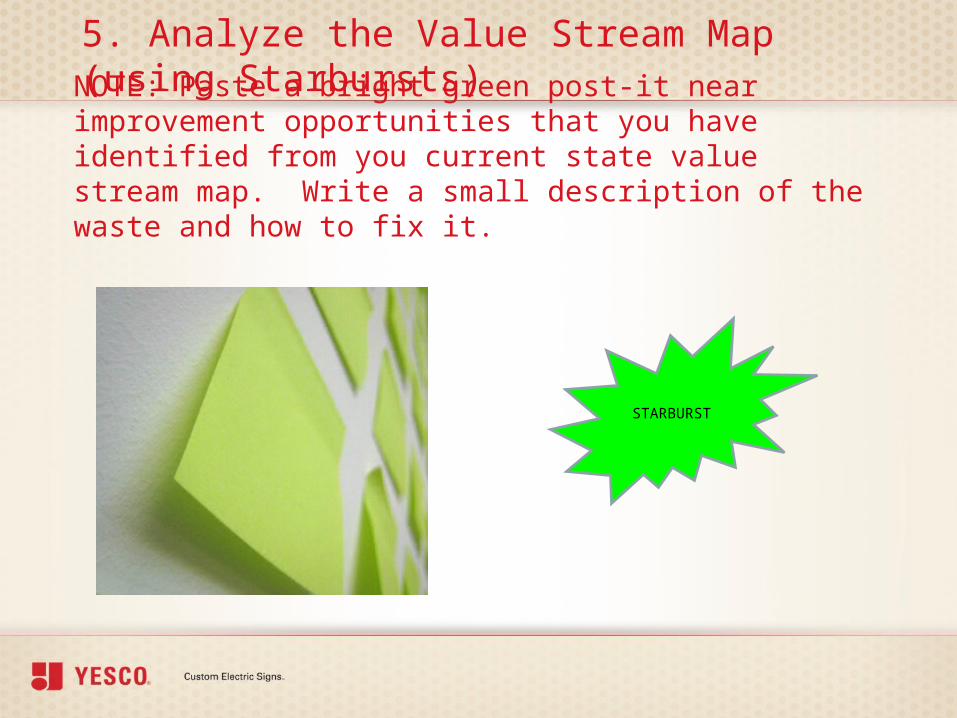
NOTE: Paste a bright green post-it near improvement opportunities that you have identified from you current state value stream map. Write a small description of the waste and how to fix it.
5. Analyze the Value Stream Map (using Starbursts)
STARBURST
5. Analyze the Process Map2. Identify opportunities to combine steps that occur between two or
more people
• In order to eliminate handoffs or delays
3. Identify opportunities to perform work simultaneously instead of sequentially
• In “parallel” instead of “serially”. What is the earliest a particular work step can occur?
• Identify opportunities where work (documents or information) can be delivered to the next person or operation one piece at a time instead of delivering work in a “Batch”
• Identify opportunities to build into the process signals or advanced notice to downstream departments to prepare to receive or produce work
56
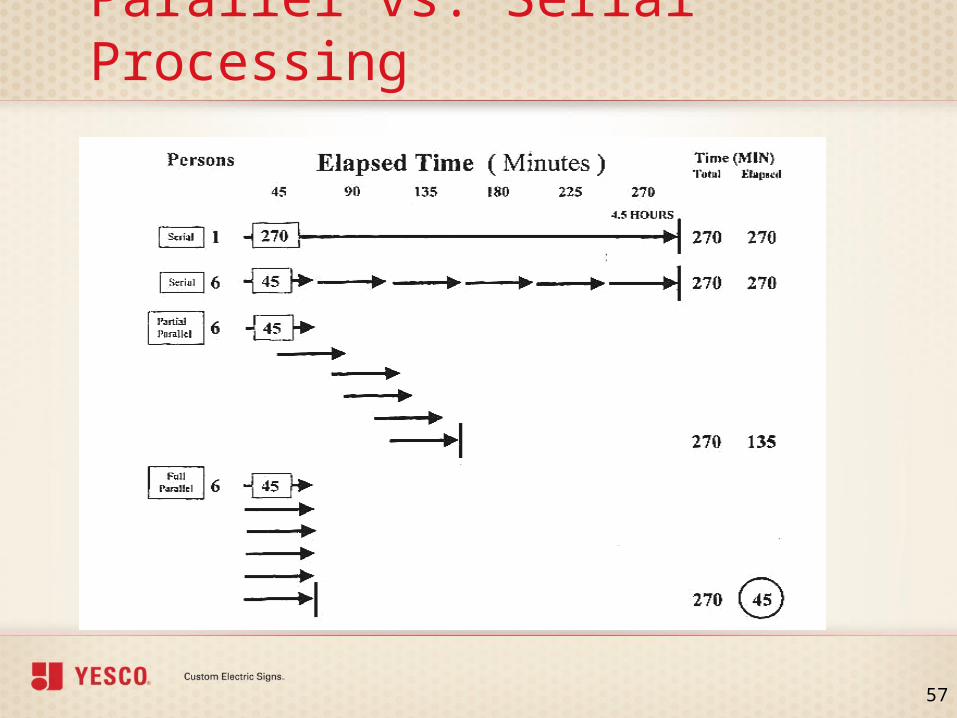
Parallel vs. Serial Processing
57
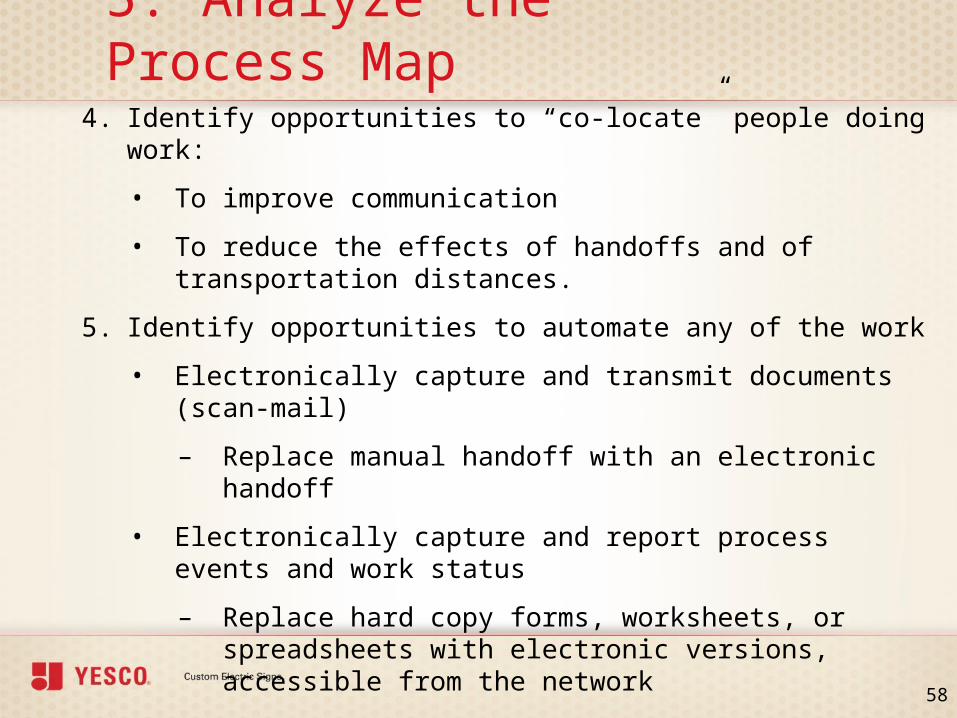
5. Analyze the Process Map4. Identify opportunities to “co-locate” people doing work:
• To improve communication
• To reduce the effects of handoffs and of transportation distances.
5. Identify opportunities to automate any of the work
• Electronically capture and transmit documents (scan-mail)
– Replace manual handoff with an electronic handoff
• Electronically capture and report process events and work status
– Replace hard copy forms, worksheets, or spreadsheets with electronic versions, accessible from the network
• Electronically combine several documents into a single database
58
5. Analyze the Process Map
6. Identify problems which if solved will reduce time or error rate
7. Determine whether the entire process is a candidate for “reengineering”
59
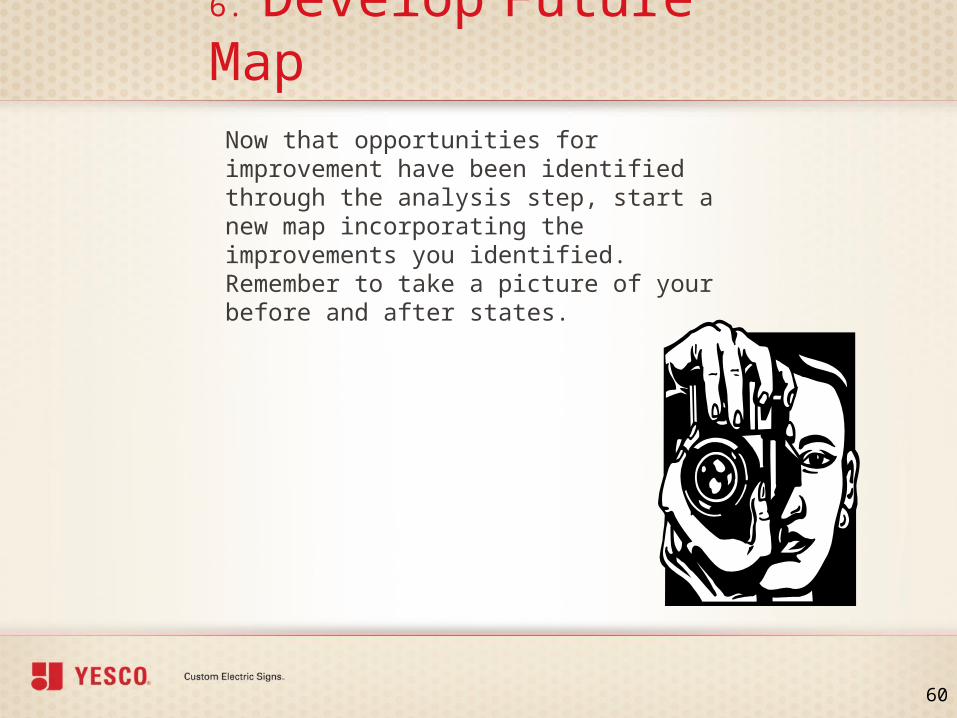
6. Develop Future MapNow that opportunities for improvement have been identified through the analysis step, start a new map incorporating the improvements you identified. Remember to take a picture of your before and after states.
60
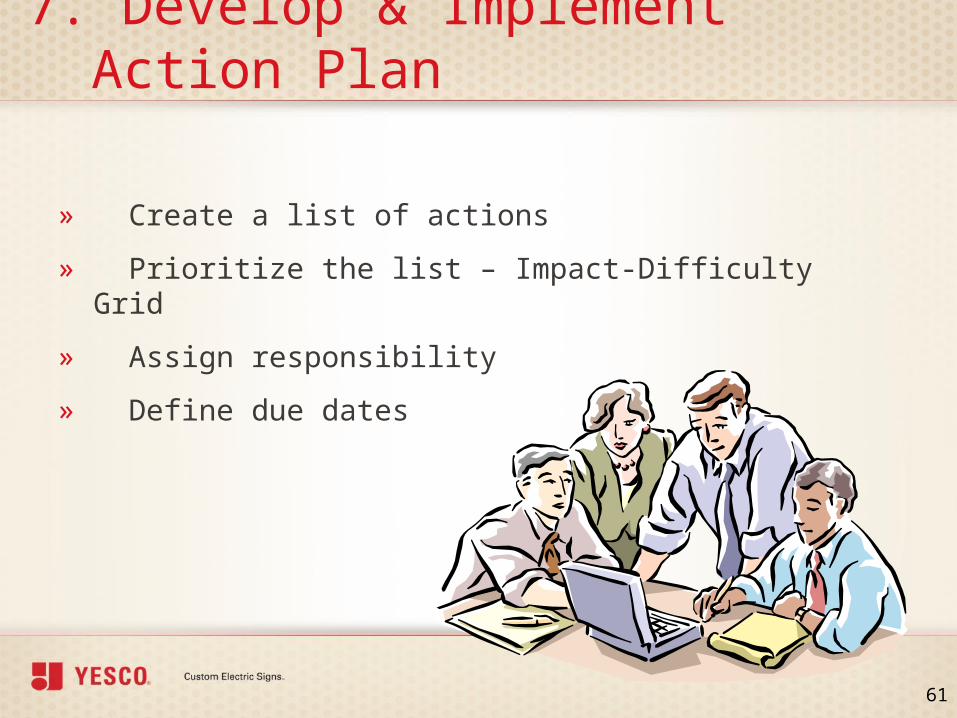
7. Develop & Implement Action Plan
» Create a list of actions
» Prioritize the list – Impact-Difficulty Grid
» Assign responsibility
» Define due dates
61
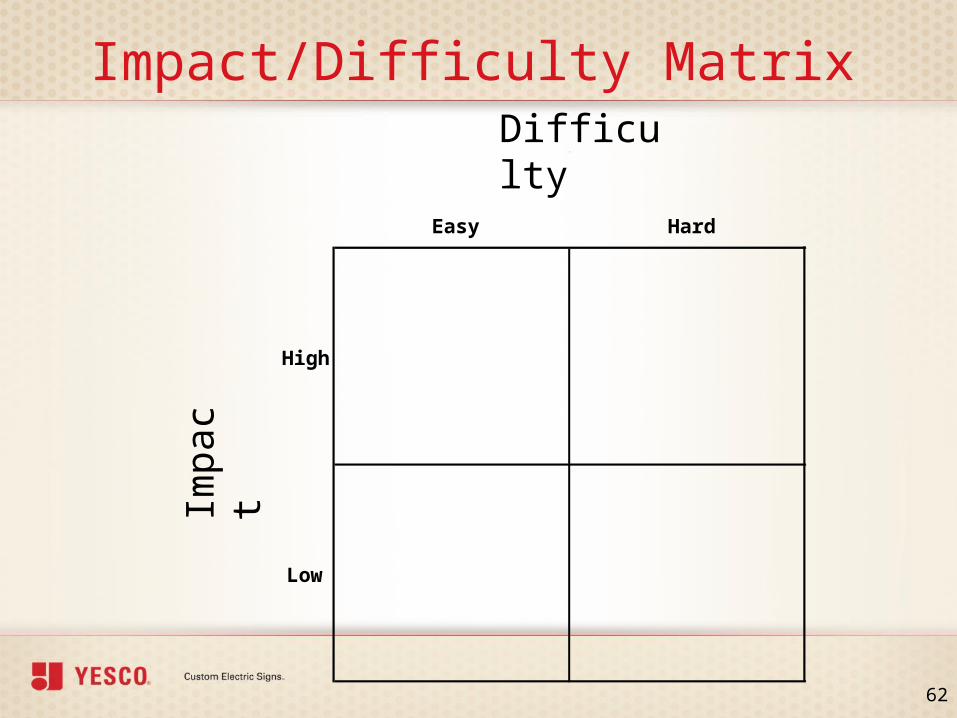
Impact/Difficulty Matrix
Easy Hard
High
Low
Difficulty
Impa
ct
62
Sustaining Improvements
» Recognize that several follow-up activities may be necessary:– Implementing and refining a measurement or performance monitoring
system– Initiating additional improvements or corrections based on the
measured results of the improved process
» Reconvene Team representatives until the projected levels of improvement have been achieved and sustained for at least three months
63
Exercise
Exercise – Map the process!
64
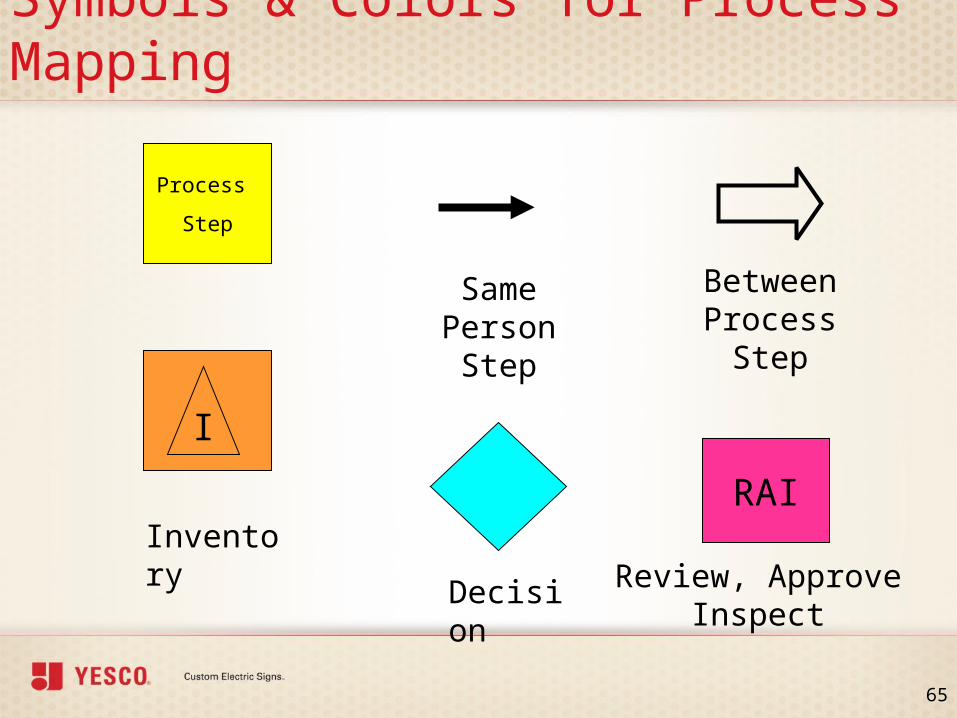
Symbols & Colors for Process Mapping
Process
Step
Same Person
Step
Between Process Step
I
Inventory
Decision
RAI
Review, Approve Inspect
65
Lean Tools
Fill up your Tool Box!
66
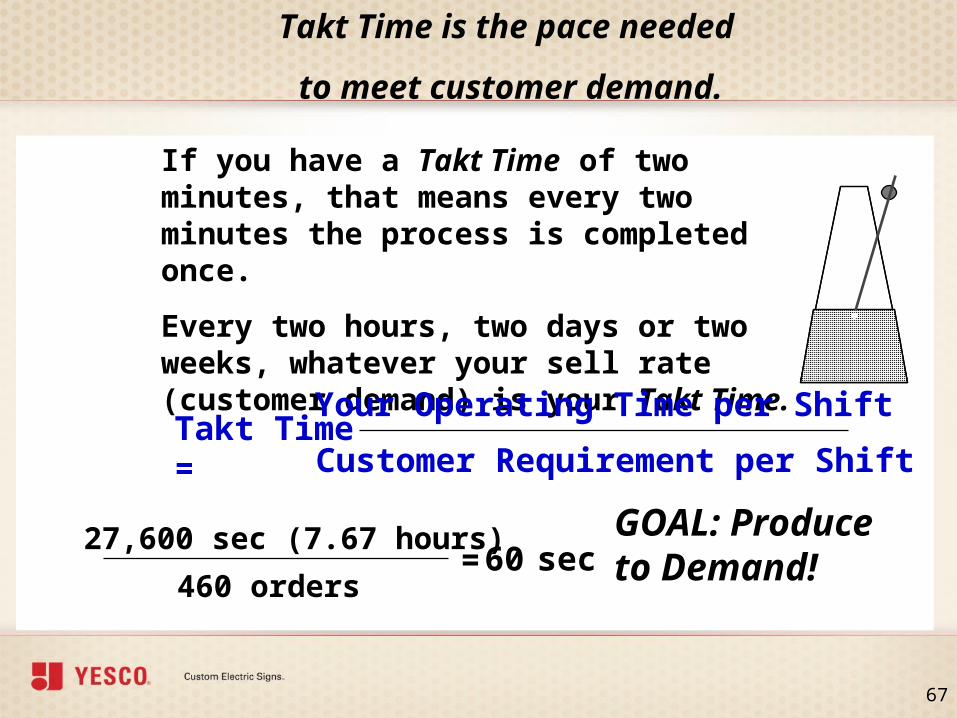
Establishing Takt Time
Takt Time is the pace needed
to meet customer demand.
If you have a Takt Time of two minutes, that means every two minutes the process is completed once.
Every two hours, two days or two weeks, whatever your sell rate (customer demand) is your Takt Time.
Takt Time =Your Operating Time per Shift
Customer Requirement per Shift
27,600 sec (7.67 hours)
460 orders= 60
secGOAL: Produce to Demand!
67
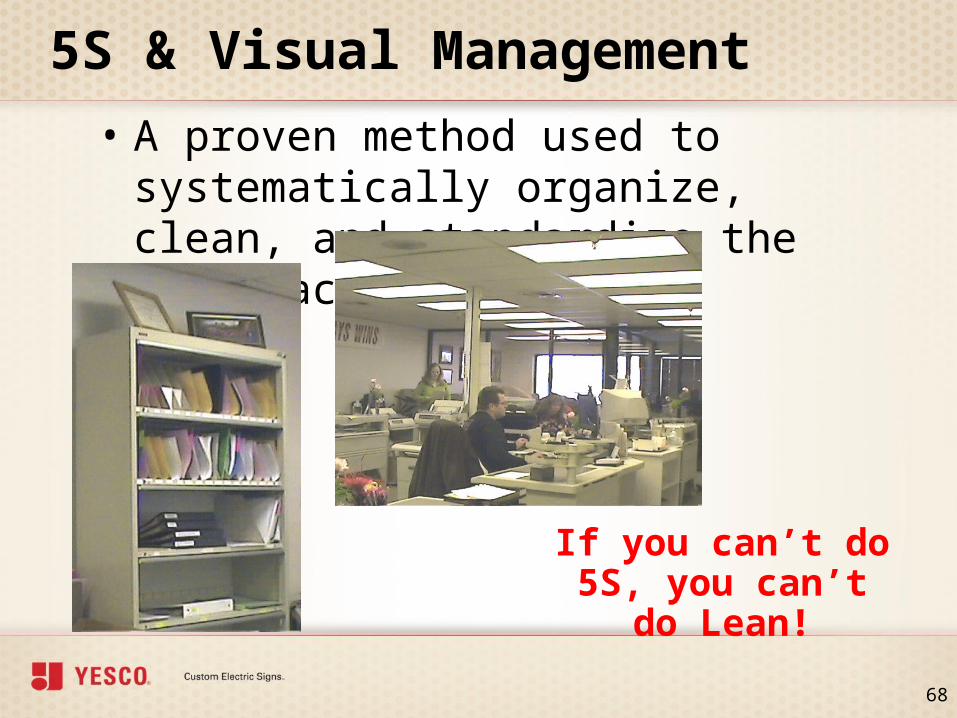
5S & Visual Management
• A proven method used to systematically organize, clean, and standardize the workplace
If you can’t do 5S, you can’t do Lean!
68
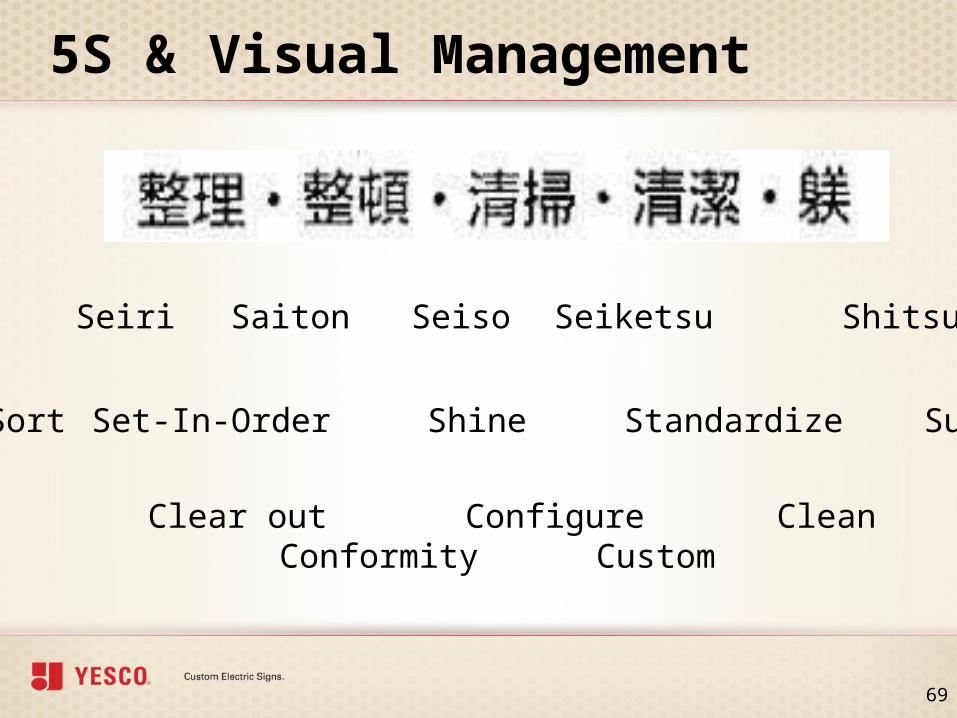
5S & Visual Management
Seiri Saiton Seiso Seiketsu Shitsuke
Sort Set-In-Order Shine Standardize Sustain
Clear out Configure Clean Conformity Custom
69
Elements of a 5S Program• Sort - what is not needed, sort through, then sort out; “When in
doubt, throw it out!”• Set-in-order - what must be kept; make visible and self-explanatory
so everyone knows where everything goes• Shine - everything that remains. Clean equipment, tools and
workplace• Standardize - implement best practices to keep the workplace clean
and organize• Sustain - making a habit of properly maintaining correct procedures
70
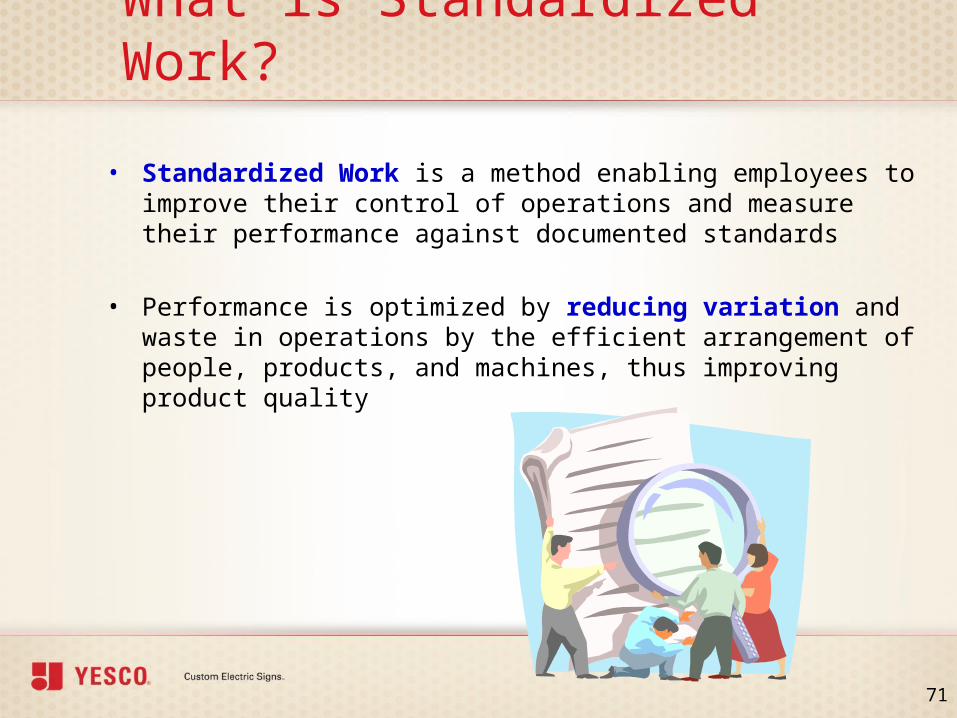
What is Standardized Work?
• Standardized Work is a method enabling employees to improve their control of operations and measure their performance against documented standards
• Performance is optimized by reducing variation and waste in operations by the efficient arrangement of people, products, and machines, thus improving product quality
71
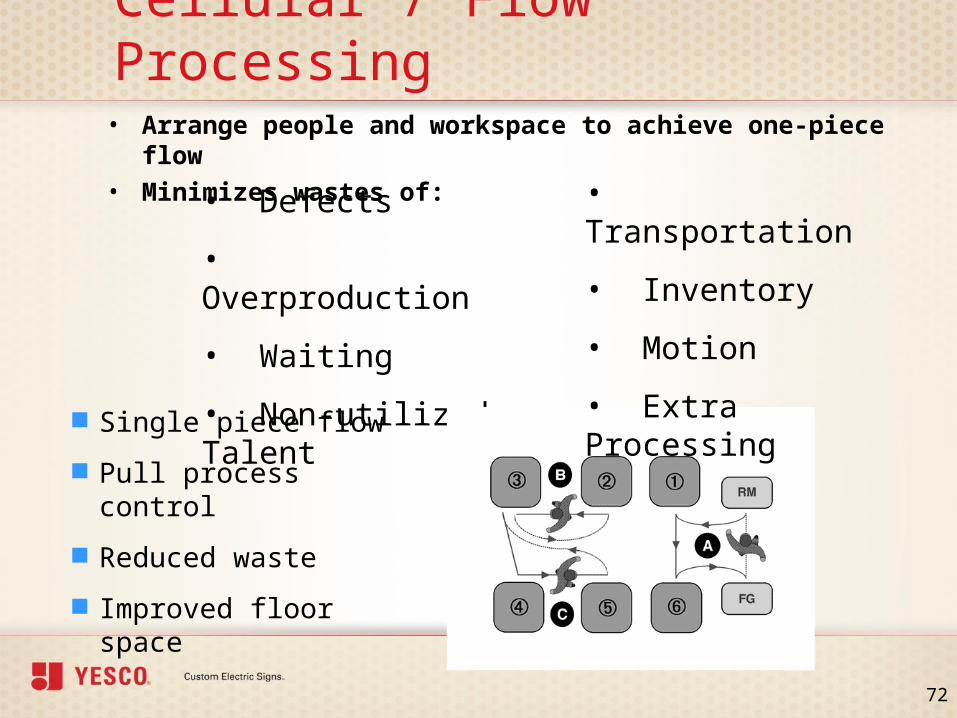
Cellular / Flow Processing• Arrange people and workspace to achieve one-piece flow• Minimizes wastes of:
• Defects
• Overproduction
• Waiting
• Non-utilized Talent
• Transportation
• Inventory
• Motion
• Extra Processing
Single piece flow
Pull process control
Reduced waste
Improved floor space
72
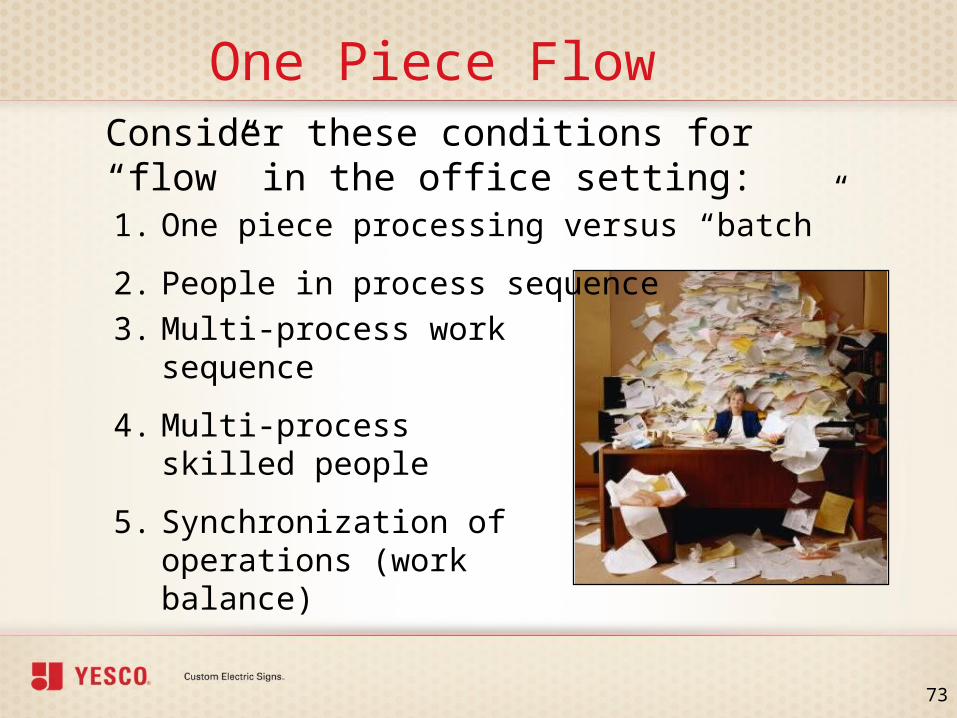
One Piece FlowConsider these conditions for “flow” in the office setting:1. One piece processing versus “batch”
2. People in process sequence
3. Multi-process work sequence
4. Multi-process skilled people
5. Synchronization of operations (work balance)
73
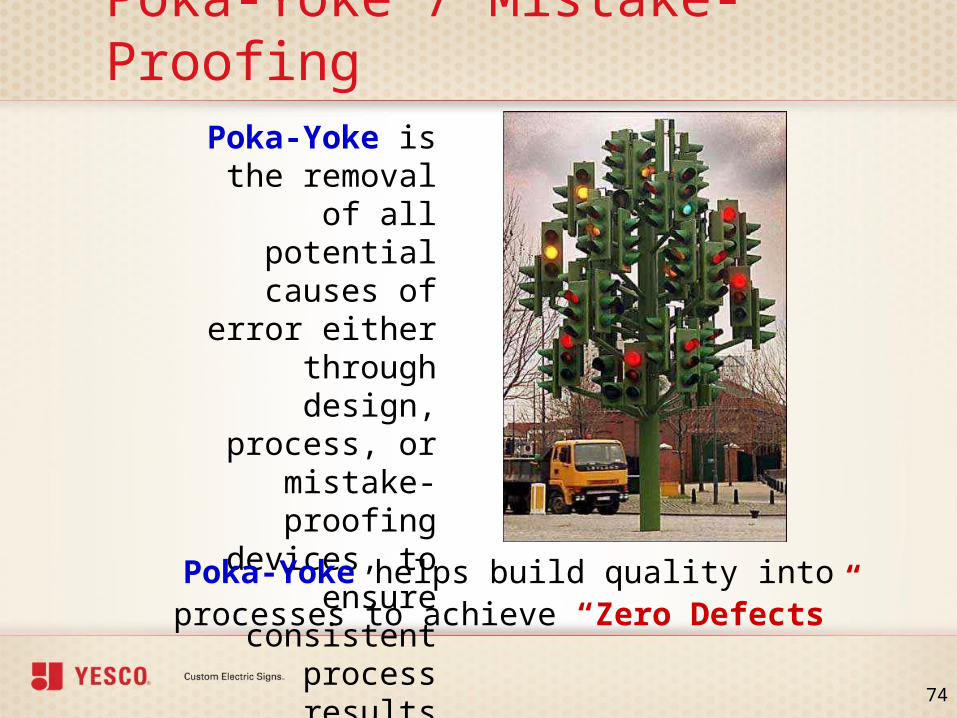
Poka-Yoke / Mistake-ProofingPoka-Yoke is the
removal of all potential causes of
error either through design,
process, or mistake-proofing
devices, to ensure consistent process
results
Poka-Yoke helps build quality into processes to achieve “Zero Defects”
74
Kaizen
• Kai = Change
• Zen = Good (for the better)
• Kaizen = Continuous Improvement
Kaizen has a bias for action!
75
Yesco Hawaii
Round 3Round 3
76
Remember to think outside the box!
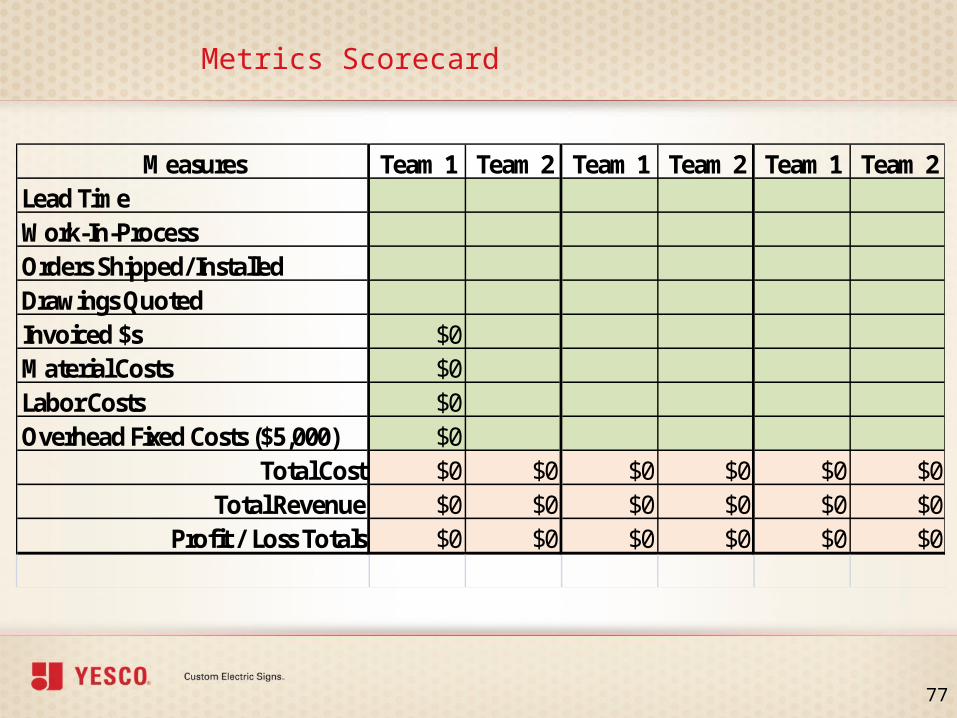
Metrics Scorecard
77
Measures Team 1 Team 2 Team 1 Team 2 Team 1 Team 2Lead TimeWork-In-ProcessOrders Shipped/InstalledDrawings QuotedInvoiced $s $0Material Costs $0Labor Costs $0Overhead Fixed Costs ($5,000) $0
Total Cost $0 $0 $0 $0 $0 $0Total Revenue $0 $0 $0 $0 $0 $0
Profit / Loss Totals $0 $0 $0 $0 $0 $0
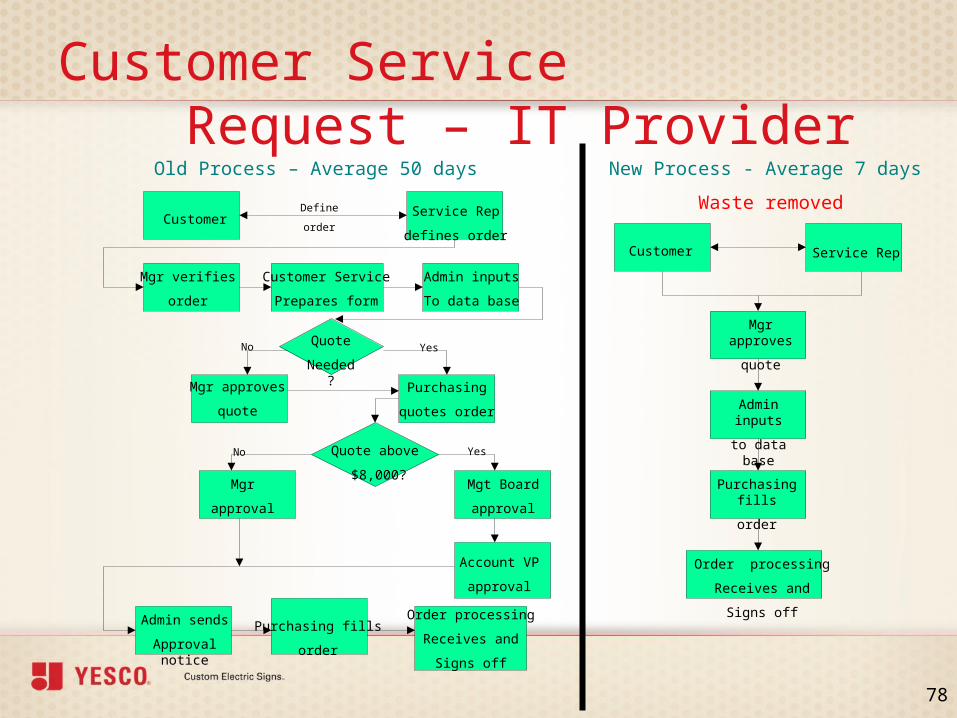
Customer Service Request – IT Provider
Purchasing
quotes order
Order processing
Receives and
Signs off
Service Rep
defines order
Mgr verifies
order
Customer Service
Prepares form
Admin inputs
To data base
Quote
Needed?
Mgr approves
quote
Quote above
$8,000?Mgr
approval
Mgt Board
approval
Account VP
approval
Purchasing fills
order
Define
order
No
No
Yes
Yes
Old Process – Average 50 days New Process - Average 7 days
Waste removed
Customer Service Rep
Mgr approves
quote
Admin inputs
to data base
Purchasing fills
order
Order processing
Receives and
Signs off
Customer
Admin sends
Approval notice
78
YESCO Las Vegas Success Story
» The business office has reduced Node 5 (last day of labor to date of invoice) from an average of 15 to 20 days to 5 to 12 days for the Exteriors Branch.
» The same concepts are being used to streamline the billing process for Interiors eliminating several hand offs and reducing Node 5 as well.
79
YESCO Electronics Success Story…
80
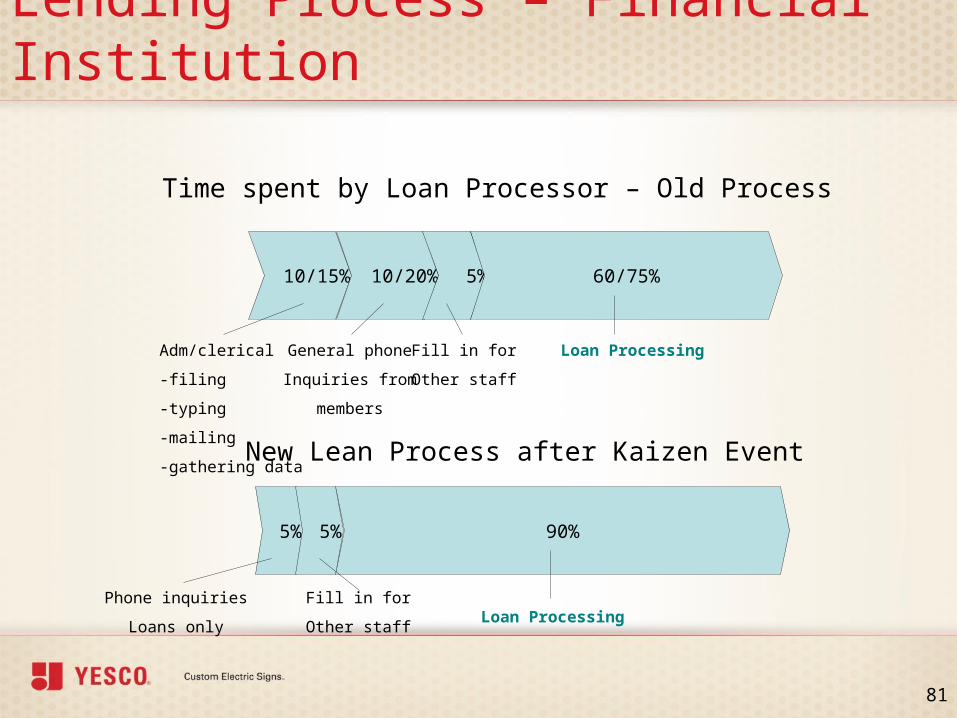
Lending Process – Financial Institution
10/15% 10/20% 5% 60/75%
90% 5% 5%
Adm/clerical
-filing
-typing
-mailing
-gathering data
General phone
Inquiries from
members
Fill in for
Other staff
Loan Processing
Phone inquiries
Loans only
Fill in for
Other staffLoan Processing
Time spent by Loan Processor – Old Process
New Lean Process after Kaizen Event
81
Keys to Success» Create a sense of urgency» Have a vision, communicate it continuously» Focus on key process drivers» Remove all obstacles to achieve the vision» Create short term victories» Don’t declare victory too soon» Speak with data
– Don’t assume– Analyze data – doubt it– Make decisions with data– Take action based on data– Check results
82
The ideal first project…
» … is clearly and unambiguously measurable. This is not always possible for administrative Kaizens.
» …satisfies a widely-perceived need.» … is a repeatable process.» … is self-contained, not subject to
uncontrollable external influence.
83
Administrative Process Improvement
» Administrative Kaizens are often discontinuous mini-Kaizens.
» The team meets first to understand the nature of the project and decide what they will need to know. The current state is described. A process map may be developed.
» Any information unavailable at the first meeting is provided prior to the second meeting.
» The second meeting is generally one day. The project is analyzed and a complete action plan is developed. The plan is implemented and the outcomes are monitored.
» If necessary, a follow up meeting is held.
84
The Kaizen Project Team» Team members are selected on a project-by-project
basis.» There is a team leader chosen to facilitate and
coordinate. The leader is not in charge in the traditional sense.
» The team can be comprised of:
Subject matter experts in the target area.Subject matter experts in the target area.
Others in the same segment of the organization.Others in the same segment of the organization.
Individuals from other areas of the organization. Individuals from other areas of the organization.
This includes technical staff.This includes technical staff.
Individuals from outside the organization.Individuals from outside the organization.
85
The Kaizen Project TeamAn open, egalitarian structure is
important.
When Kaizen project work is underway, organizational position is irrelevant and disregarded.
All team members are considered equal within the team.
86
Key Kaizen Tenets
» An open atmosphere is critical. Free thinking and contribution are necessary.
» Everything is open to question. No assumptions are made.
» A Kaizen event is not developing a list of ideas or recommendations to be studied. The outcome is implemented.
87
Now – Recreate that World
» Map it – with the experts» Study your map» Implement changes» Celebrate» Study and implement more changes» Celebrate» Repeat, Repeat, Repeat
88
Questions?
89