Embed Size (px)
Citation preview

Academic Research International Vol. 8(4) December 2017
____________________________________________________________________________________________________________________________________________________________________________________________________________________________________________________________________________________________________________
Copyright © 2017 SAVAP International ISSN: 2223-9944, e ISSN: 2223-9553
www.savap.org.pk 194 www.journals.savap.org.pk
LEAN AND GREEN MANUFACTURING DESIGN AT SMES’S
MADURA SHIPYARD WITH VALUE STREAM MAPPING TOOL AND
SIMULATION MODEL
Soffia Pudji Estiasih1, Bambang Sutejo
2 , Wing Hendroprasetyo Akbar Putra
3
1Management Department, University of WR Supratman Surabaya;
2Indutrial Engineering Department, University of WR Supratman Surabaya;
3Ship Engineering Department, Sepuluh Nopember Institute of Technology (ITS) Surabaya,
INDONESIA.
[email protected], bamsitats@gmail
3
ABSTRACT
Madura shipyard has a responsibility to improve the efficiency of its production
system. The problems faced in increasing the efficiency of the production system are:
(1) The existence of waste work shop such as product defect, over production,
excessive transportation, Inappropriate Processing, Unnecessary inventory,
Unnecessary motion, and waiting time occurring in the production process Madura
vessel (2) Still non value adding activity that happened ship production process at
Madura shipyard. and (3) Due to the absence of waste work shop and non value
adding activity, the efficiency of ship production process in Madura shipyard can not
be reached maximally
In this research, it will be designing the system in ship production process using
Simulation method, Value Stream Analysis Tool (VALSAT) to solve the inefficiency
problem that happened in ship production process at Madura shipyard. The design
process is by integrating the Simulation method, Value Stream Analysis Tool
(VALSAT), Response Surface Methodology, and Analitycal Hierarchy Analysis
(AHP). The simulation method is used to model the ship production system and lean
manufacturing system designed in Madura shipyard, while the VALSAT method is
used to identify waste workshops, map the value adding activity and non value adding
activity that occurs in the ship production process in the Madura shipyard. To
measure the performance of designed lean manufacturing system is done experiment
and optimization with Response Surface Methodology method. Multi performance
criteria measurement using Analitycal Hierarchy Process (AHP) method with work in
process, waiting time, and flow time criteria is used to determine optimal lean
manufacturing system.
For the first year of research, the highest waste weights in SME shipyard of
Bangkalan Madura are Excessive Transportation with 2.4 weight, Unnecessary
Inventory with weight of 1.66, and Over Production 1.26. From the Value Stream
Analysis Tool, the highest value mapping tool is activity process mapping, supply
chain response matrix, and demand amplification mapping. Based on the activity
mapping process for hull construction, outfitting machinery, electrical outfitting
obtained value adding activity in SMEs’s Bangkalan Madura shipyard is still low.
Value adding activity based on operating time is 70%. To know the root cause of
waste in this research used fishbone diagram for each type of waste
Keywords: Lean Manufacturing, simulation model, VALSAT, waste
workshop, non value adding activity, Analytical Hierarchy Process (AHP)
Academic Research International Vol. 8(4) December 2017
____________________________________________________________________________________________________________________________________________________________________________________________________________________________________________________________________________________________________________
Copyright © 2017 SAVAP International ISSN: 2223-9944, e ISSN: 2223-9553
www.savap.org.pk 195 www.journals.savap.org.pk
INTRODUCTION
Madura shipyard, which has a core business in ship building and ship repair, is a national
shipbuilding company that has international standard and has standard ISO 9001. The sharp
depreciation of the rupiah gives a considerable export market opportunity for the national
shipyard that has been standardized national such as the Madura shipyard. Given the
increasing need for new ships in the world of around 35 million BRT / yr, while the
production capability of only about 15 million BRT / year, including about 100,000 BRT /
year supported by the national ship industry, provides substantial opportunities for growth
Madura shipbuilding industry. In addition to these opportunities, many challenges to be faced
by the national shipbuilding industry such as:
i. The development of shipyards (towards) to the same market segment, including the
growth of shipyards with PMA facilities around the island of Batam and Karimun
islands.
ii. The development of shipyards in the Philippines that are geographically close to
Indonesia.
iii. Limited technological mastery, and the quality of existing human resources, make
Madura's shipyard still difficult enough to compete in the global market.
iv. Difficulties in bidding and fulfilling payment systems that are generally applicable to
international orders, as a result of weak long-term funding.
In the face of the rapid demand and competition in the ship industry in Indonesia and the
world today, let alone supported by the needs and opportunities of the new shipbuilding
sector to strengthen the national fleet and national economy in the future, the Madura
shipyard is expected to immediately make changes- changes in the company it has. These
changes are not only done in the managerial system of the company but also the most
important must make changes to the system of production, especially efforts to improve the
efficiency of production systems.
The design of lean manufacturing system to solve the inefficiency problem in ship production
process at Madura shipyard, considering that in a whole manufacturing process from product
design, raw material purchasing, process to delivery of finished product, almost always can
be found the real thing need not be done, do not give added value or things that are too much
in doing it. This is commonly called "wastehold" or waste workshop. Lean's approach aims to
eliminate waste elimination and non-value added activity, smooth the flow of material,
products and information, and continuous quality improvement. According to Gaspersz and
Fontana (2011), Lean explains that it is a continous improvement effort to eliminate waste,
and to increase the value added of products (goods and or services), in order to deliver results
to customers (customer value).According to Heizer and Render (2009), Waste occurs in the
factory business processes that are often found such as defective products, excess inventory,
time wastage and so forth.
RESEARCH OBJECTIVES
Specific objectives of this research are as follows:
1. Designing Lean Manufacturing System on ship production process at madura
shipyard by integrating Value Stream Analysis Tool (VALSAT) and Simulation
Method.
2. Create value stream mapping for ship production process at Madura shipyard.
3. Designing lean manufacturing system simulation model on ship production process at
madura shipyard.
Academic Research International Vol. 8(4) December 2017
____________________________________________________________________________________________________________________________________________________________________________________________________________________________________________________________________________________________________________
Copyright © 2017 SAVAP International ISSN: 2223-9944, e ISSN: 2223-9553
www.savap.org.pk 196 www.journals.savap.org.pk
4. Identify waste workshops and non value adding activity in ship production process at
madura shipyard.
5. Maximize the efficiency of ship production system in Madura shipyard with minimize
product defect, over production, Excessive transportation, In appropriate Processing,
Unnecessary inventory, Unnecessary motion, and waiting time on ship production
process at Madura shipyard.
RESEARCH METHODOLOGY
Lean Manufacturing System Design
Determining Products and Family Products (Part Family)
The first important step to do when developing a value stream map is to identify the product
and the family of the product or part family (the product group that passes the same process
and use the same public equipment and resources). There are two methods used to identify
the family of products (Part family):
Product Quantity Analysis
Product quantity analysis is used to see which product has the highest production volume. In
this method is made pareto diagram to see which product which production reach 80% from
total production.
Product Route Analysis (Production Process Matrix)
Production Process Matrix is a matrix that contains all types of products that are in a value
stream.
Value Stream Mapping (VSM) -Current State
At this stage it is done by mapping individual products, product groups and product lines
along the value stream process. VSM is an important planning tool for identifying critical
improvements that can contribute to and influence business significantly by seeking
companies to identify waste and sources to value a process stream. When creating a value
stream map, it is important to focus on one product family at a time. The rule of thumb is to
create a map for the highest-volume product first.
Identify Waste Workshop
Stages of identification of waste, in this penelitin intended to obtain information about waste
that occurs in global systems using questionnaires. The questionnaire is based on the
conditions and characteristics of the system on possible waste (Environment, Healtyand
Safety (EHS), Defect / Rework, Overproduction, Waiting Time, Not Utilizing Employee
Knowledge, Skill and Ability, Excessive Transportation, Unnecessary Inventories
Unnecessary Motion, Inappropriate Processing.
Determination of the Key Performance Indicator
Determination of some key performance measures of value stream process such as process
cycle efficiency, lead time, Overall Equiment effetiveness.
Value Stream Analysis Tool (VALSAT)
At this stage that is done is:
1. Determine tools with value stream mapping tool to identify the waste that occurs,
and to know the group of non-value added activities of each process along the
value stream.

Academic Research International Vol. 8(4) December 2017
____________________________________________________________________________________________________________________________________________________________________________________________________________________________________________________________________________________________________________
Copyright © 2017 SAVAP International ISSN: 2223-9944, e ISSN: 2223-9553
www.savap.org.pk 197 www.journals.savap.org.pk
2. Conduct factor analysis to determine the factors causing waste that occurs in the
system by using fishbone diagram.
3. Analyze the failure mode using Failure Mode and Effect Analisys (FMEA) by
looking at the greatest value of RPN to find out the most serious problems that
occur.
Value Stream Mapping-Future State
Describe the future state map based on predetermined priority solutions, to understand the
state of the upcoming system plan.
Preparation of Simulation Program
The selection of software to be used in the simulation will have a major impact on the success
of the researcher. This will affect the model's accuracy, model validity, execution time, and
overall research completion time.
RESULTS AND ANALYSIS
Big Picture Mapping
Big Picture Mapping is a high-level process mapping that encompasses a broad process but
with a low level of detail. This tool is very helpful in identifying waste in SME Madura
shipyard. Wasting can be known by knowing the physical flow and information of the
company and describing it in one unity. Picture big picture mapping for SME Shipyard
Madura as shown in Figure 1
Figure 1 Big Picture Mapping for SME shipyard of Bangkalan Madura
Identify Waste Workshop
VALSAT begins with a Waste Workshop that is the method of extracting information to
obtain as much input as possible about the waste that occurs in the system. The main
objective and Waste Workshop is to equate perceptions about waste so as to obtain common
goals that will facilitate improvement.
Academic Research International Vol. 8(4) December 2017
____________________________________________________________________________________________________________________________________________________________________________________________________________________________________________________________________________________________________________
Copyright © 2017 SAVAP International ISSN: 2223-9944, e ISSN: 2223-9553
www.savap.org.pk 198 www.journals.savap.org.pk
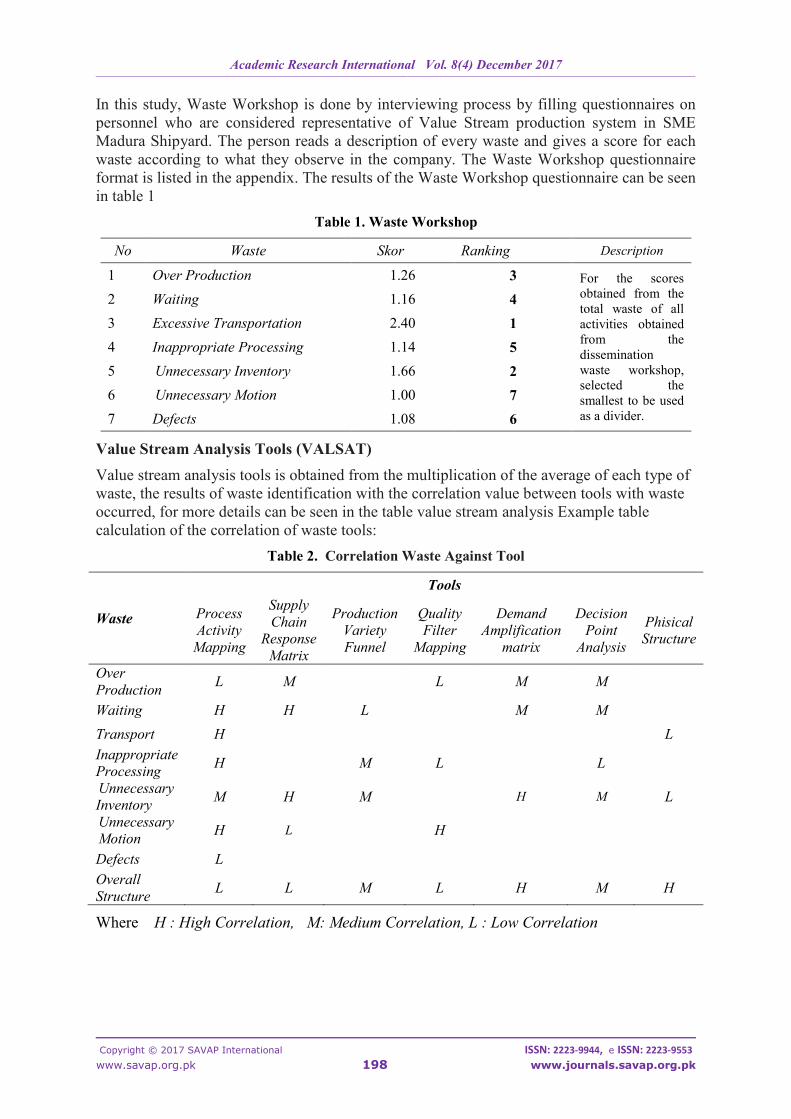
In this study, Waste Workshop is done by interviewing process by filling questionnaires on
personnel who are considered representative of Value Stream production system in SME
Madura Shipyard. The person reads a description of every waste and gives a score for each
waste according to what they observe in the company. The Waste Workshop questionnaire
format is listed in the appendix. The results of the Waste Workshop questionnaire can be seen
in table 1
Table 1. Waste Workshop
No Waste Skor Ranking Description
1 Over Production 1.26 3 For the scores
obtained from the
total waste of all
activities obtained
from the
dissemination
waste workshop,
selected the
smallest to be used
as a divider.
2 Waiting 1.16 4
3 Excessive Transportation 2.40 1
4 Inappropriate Processing 1.14 5
5 Unnecessary Inventory 1.66 2
6 Unnecessary Motion 1.00 7
7 Defects 1.08 6
Value Stream Analysis Tools (VALSAT)
Value stream analysis tools is obtained from the multiplication of the average of each type of
waste, the results of waste identification with the correlation value between tools with waste
occurred, for more details can be seen in the table value stream analysis Example table
calculation of the correlation of waste tools:
Table 2. Correlation Waste Against Tool
Waste
Tools
Process
Activity
Mapping
Supply
Chain
Response
Matrix
Production
Variety
Funnel
Quality
Filter
Mapping
Demand
Amplification
matrix
Decision
Point
Analysis
Phisical
Structure
Over
Production L M L M M
Waiting H H L M M
Transport H L
Inappropriate
Processing H M L L
Unnecessary
Inventory M H M H M L
Unnecessary
Motion H L H
Defects L
Overall
Structure L L M L H M H
Where H : High Correlation, M: Medium Correlation, L : Low Correlation

Academic Research International Vol. 8(4) December 2017
____________________________________________________________________________________________________________________________________________________________________________________________________________________________________________________________________________________________________________
Copyright © 2017 SAVAP International ISSN: 2223-9944, e ISSN: 2223-9553
www.savap.org.pk 199 www.journals.savap.org.pk
Table 3. VALSAT
Waste Bobot
Tools
Process
Activity
Mapping
Supply
Chain
Response
Matrix
Production
Variety
Funnel
Quality
Filter
Mapping
Demand
Amplification
matrix
Decision
Point
Analysis
Phisical
Structure
Over
Production 1.26 1,3 3.9 1,3 3,9 3,9
Waiting 1.16 10,44 10,44 1,16 3,48 3,48
Transport 2.40 21,6 2,4
Inappropriate
Processing 1.14 10,26 3,42 1,14 1,14
Unnecessary
Inventory 1.66 4,98 14,94 4,98 14,94 4,98 1,66
Unnecessary
Motion 1.00 9 1 9
Defects 1.08 1,08
Total Bobot 57,66 30,28 9,56 11,44 22,32 13,5 4,06
Ranking 1 2 6 5 3 4 7
So based on VALSAT (Value Stream Analysis Tool) method, then the mapping tool used is
Process Actifity Mapping, Supply Chain Response Matrix, and Demand Amplification
Matrix
Process Activity Mapping for Hull Outfitting
Based on observation on production process of outfitting system, can be made activity mapping
process for hull outfitting system as follows:
Table 4(Part-I).. Proses Activity Mapping for Hull Outfitting
No. Phase Activity Activity Type Machine
/facility
Distance
(m)
Time
(days)
Amount
f Labor O T I S D
1 Werehouse Handling
Material T
Forklip &
Crane 40 2 8
2
Fabrication
shop
Shop Blasting
& Shop
Primer
O
sandblast,
air
compressor,
paint
50 10 10
3 Handling
material T Forklip 10 3 2
4 Ident Material I Pencil &
paper 50 5 2
5 Handling
material O
Forklip &
Crane 8 2 2
6 Marking O Solid Marker 15 17 5
7 Handling
material T
Forklip &
Crane 10 3 8
8 Cutting
manual O
Cutting
Blander 6 21 12
9 Handling
Material T
Over Head
Crane 10 ton 15 3 8
Academic Research International Vol. 8(4) December 2017
____________________________________________________________________________________________________________________________________________________________________________________________________________________________________________________________________________________________________________
Copyright © 2017 SAVAP International ISSN: 2223-9944, e ISSN: 2223-9553
www.savap.org.pk 200 www.journals.savap.org.pk
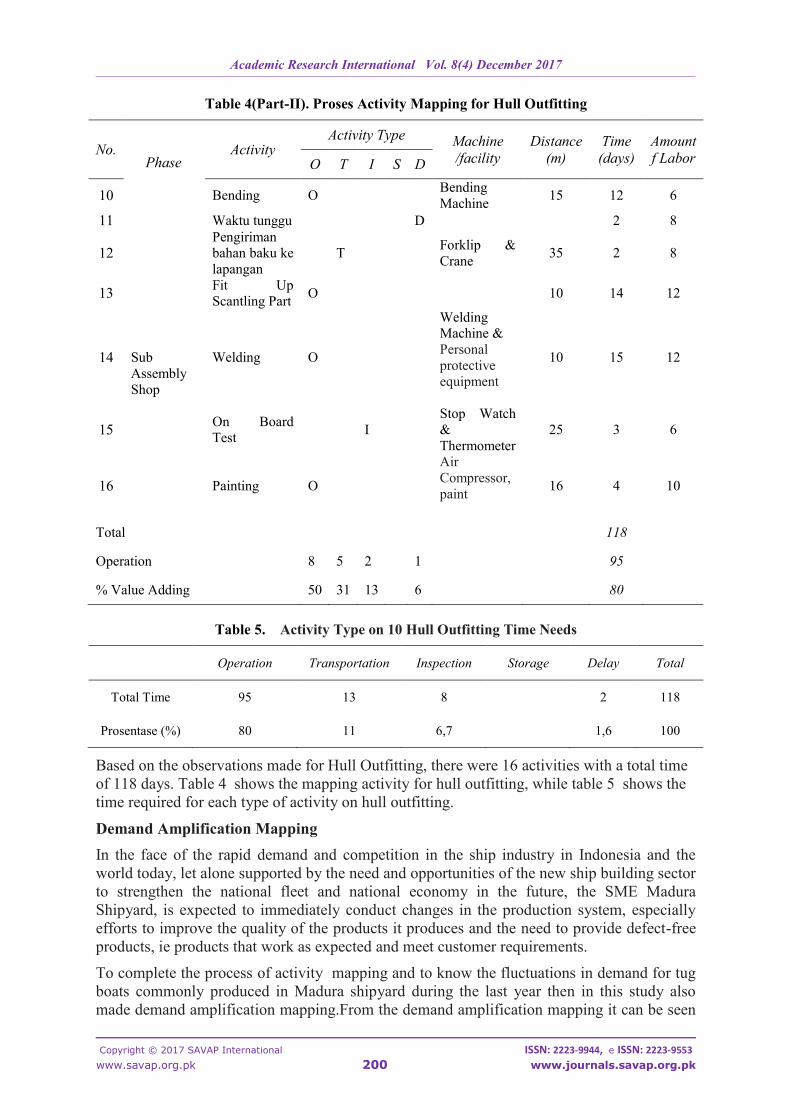
Table 4(Part-II). Proses Activity Mapping for Hull Outfitting
No.
Phase Activity
Activity Type Machine
/facility
Distance
(m)
Time
(days)
Amount
f Labor O T I S D
10 Bending O Bending
Machine 15 12 6
11 Waktu tunggu D 2 8
12
Sub
Assembly
Shop
Pengiriman
bahan baku ke
lapangan
T Forklip &
Crane 35 2 8
13 Fit Up
Scantling Part O 10 14 12
14 Welding O
Welding
Machine &
Personal
protective
equipment
10 15 12
15 On Board
Test I
Stop Watch
&
Thermometer
25 3 6
16 Painting O
Air
Compressor,
paint
16 4 10
Total 118
Operation 8 5 2 1 95
% Value Adding 50 31 13 6 80
Table 5. Activity Type on 10 Hull Outfitting Time Needs
Operation Transportation Inspection Storage Delay Total
Total Time 95 13 8 2 118
Prosentase (%) 80 11 6,7 1,6 100
Based on the observations made for Hull Outfitting, there were 16 activities with a total time
of 118 days. Table 4 shows the mapping activity for hull outfitting, while table 5 shows the
time required for each type of activity on hull outfitting.
Demand Amplification Mapping
In the face of the rapid demand and competition in the ship industry in Indonesia and the
world today, let alone supported by the need and opportunities of the new ship building sector
to strengthen the national fleet and national economy in the future, the SME Madura
Shipyard, is expected to immediately conduct changes in the production system, especially
efforts to improve the quality of the products it produces and the need to provide defect-free
products, ie products that work as expected and meet customer requirements.
To complete the process of activity mapping and to know the fluctuations in demand for tug
boats commonly produced in Madura shipyard during the last year then in this study also
made demand amplification mapping.From the demand amplification mapping it can be seen

Academic Research International Vol. 8(4) December 2017
____________________________________________________________________________________________________________________________________________________________________________________________________________________________________________________________________________________________________________
Copyright © 2017 SAVAP International ISSN: 2223-9944, e ISSN: 2223-9553
www.savap.org.pk 201 www.journals.savap.org.pk
that the fluctuations in demand for the world's tug boat boat occupy the largest percentage.
Tugs is the largest part of the world's ship fleet with 16,804 vessels. The next largest part is
taken by the General Cargo ship (8,777 ships). Followed by passenger ferry (4,902 ships),
small product tank (2,678 ships), Dredgers (1,365 vessels). Demand for tugs is projected to
grow by 3.6% - 4.0% p.a. in 2015-2017. Dengan see the situation and conditions such SME
Shipyard Madura, must restructure, both restructuring in the field of management and in the
field of production system. Restructuring in the production field means making efficiency in
its production system. In this research, efficiency in the production system is directed to the
creation of lean manufacture, by eliminating waste workshop and non value adding activity in
the production system.
Cause and Effect Analysis
Cause and Effect analysis (fishbone diagram) is a tool that can be used to identify the root
cause of the problem. Fishbone diagram in this research is used to analyze the root cause of
waste that occurred in Madura shipyard. Filling the waste questionnaire is addressed to
employees who really know the condition of ship production process in SME Madura
shipyard. The result of the questionnaire is a critical waste of 7 waste that occurs. From these
results can be built a cause and effect analysis to identify the impact and root causes. Cause
and effect analysis in this research can be seen in figure 2. as follows:
Figure 2. Cause and Effect Analysis
CONCLUSION
Conclusions drawn from the research on lean manufacturing design in SME shipyard
Bangkalan Madura are as follows:
1. Based on Big picture mapping for current state condition, ship production process in
UKM shipyard of Bangkalan Madura still not optimal, because there are still many
ship time of completion still not on time. So it creates a penalty cost, which causes a
big loss for the company.
2. From the results of waste identification obtained waste that has the highest weight
in SME shipyard Bangkalan Madura is Excessive Transportation with weight 2.4,
Unnecessary Inventory with weight 1.66, and Over Production 1.26.
3. From the Value Stream Analysis Tool, the highest value mapping tool is activity
process mapping, supply chain response matrix, and demand amplification mapping
4. Based on the activity mapping process for hull construction, outfitting machinery,
electrical outfitting obtained value adding activity in SMEs Bangkalan Madura
shipyard is still low. Value adding activity based on operating time is about 70%.

Academic Research International Vol. 8(4) December 2017
____________________________________________________________________________________________________________________________________________________________________________________________________________________________________________________________________________________________________________
Copyright © 2017 SAVAP International ISSN: 2223-9944, e ISSN: 2223-9553
www.savap.org.pk 202 www.journals.savap.org.pk
5. To know the root cause of waste in this study used fishbone diagram for each type of
waste.
REFERENCES
[1] BuanaMa’ruf. A. (1990). A chase study: Rationalizing the structure and improving the
performance and efficiency of Eurobuild Shipbuilders and Shiprepairs Limited.
Glasgow-UK: University of Strathclyde.
[2] Fowlkes, W. Y., & Creveling, C. M. (1995). Engineering methods for robust product
desgn: Using Taguchi methods in technology and product development. New York:
Addison-Wesley Publising Company.
[3] Gaspersz, V., & Avanti, F. (2011). Learn six sigma for manufacturing and service
industries. Bogor: Penerbit Vinchristo Publication.
[4] George, M. L. (2000). Lean six sigma: Combining six sigma quality with lean speed.
New York: Mc Graw Hill.
[5] Groover, M. P. (1987). Automation production sistem and computer integrated
manufacturing. New York: Prentice- Hall.
[6] Heizer, J., & Render, B. (2005). Operations management. Jakarta: Salemba Empat.
[7] Hines & Taylor. (2000). Strategy & excellence in the supply chain. London: Penerbit
Prentice Hall.
[8] Hines, P. (2000). Value stream management: Strategy and excellence in the supply
chain. Great Britain: Prentice Hall.
[9] Luki, T. (2003). Evaluasi dan perbaikan sistem produksi dengan meminimasi
pemborosan pada value stream sebagai upaya menuju lean production di PT
behaestex. Surabaya: TI ITAT.
[10] Radovic, I., & Mac, C. (2004). Lean six sigma in shipbuilding. USA: University of
New Orleans.
[11] Rahaju, S. (2004). Perancangan lean manufacturing denganmenggunakan value stream
mapping tool di cv jepara plastic Surabaya. Jurnal Sistem Teknik Industri.
[12] Richardus, E. I., & Richardus, D. (2002). Konsep manajemen supply chain. Jakarta:
Gramedia Widya Sarana Indonesia.
[13] Saraswati, R., Asri, N.P., Oktavera, R., Prihatiningsih, E. (2015). Eco-innovation for
strengthening global competitiveness and building capacity in shipbuilding industry in
East Java to support MP3EI program corridor economic Java. Educational Research
International, 4(4), 22-29.
[14] Shendy, R. (2006). Aplikasi metode lean untuk mengevaluasi dan mengurangi
pemborosan pada proses produksi di PG. Surabaya: TI ITATS.
[15] Sohal, A.S., & Terziovsky, M. (2000). TQM in Australian manufacturing: Factor
critical to success. International Journal of Quality and Relliability Management, 17
(2), 158-167.