Embed Size (px)
Citation preview
Laurens CountyLaurens CountyCommunityCommunityProfileProfile
34th in order of county creation
December 10, 1807
Prepared for Laurens County Cooperative Extensionby the Center for Agribusiness and Economic Development
The University of Georgia • Athens, GA
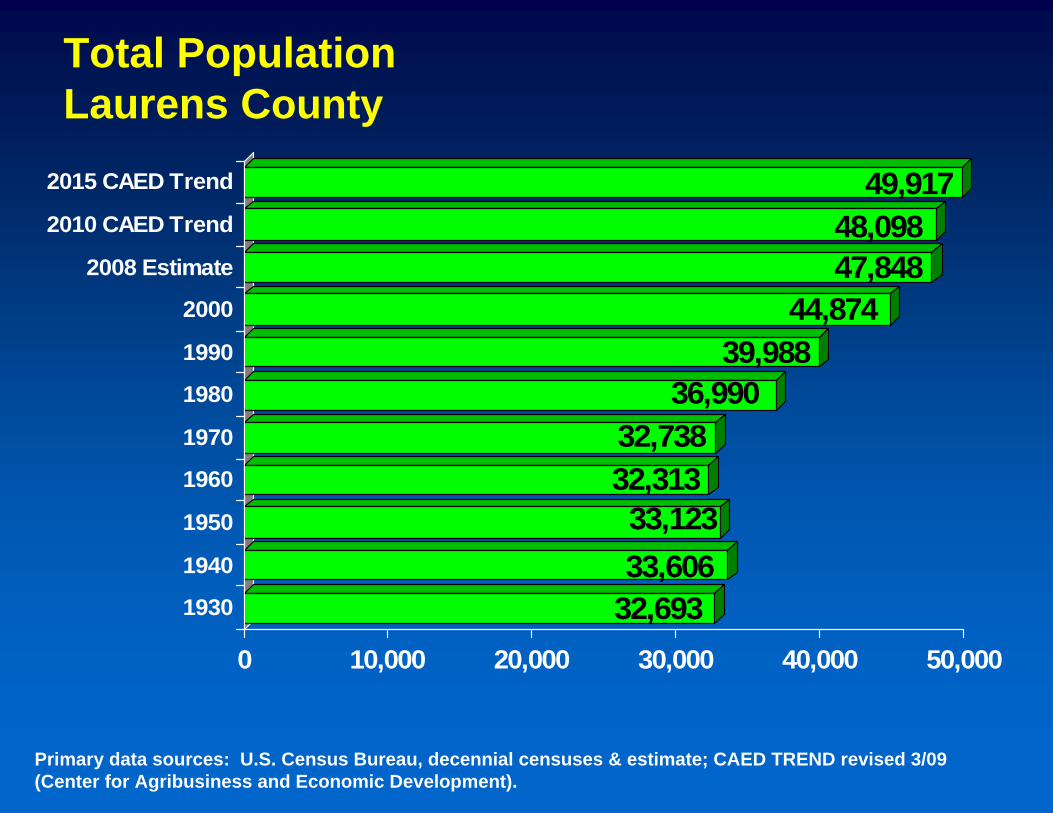
32,69333,60633,123
32,31332,738
36,99039,988
44,87447,84848,098
49,917
0 10,000 20,000 30,000 40,000 50,000
1930
1940
1950
1960
1970
1980
1990
2000
2008 Estimate
2010 CAED Trend
2015 CAED Trend
Primary data sources: U.S. Census Bureau, decennial censuses & estimate; CAED TREND revised 3/09 (Center for Agribusiness and Economic Development).
Total PopulationLaurens County
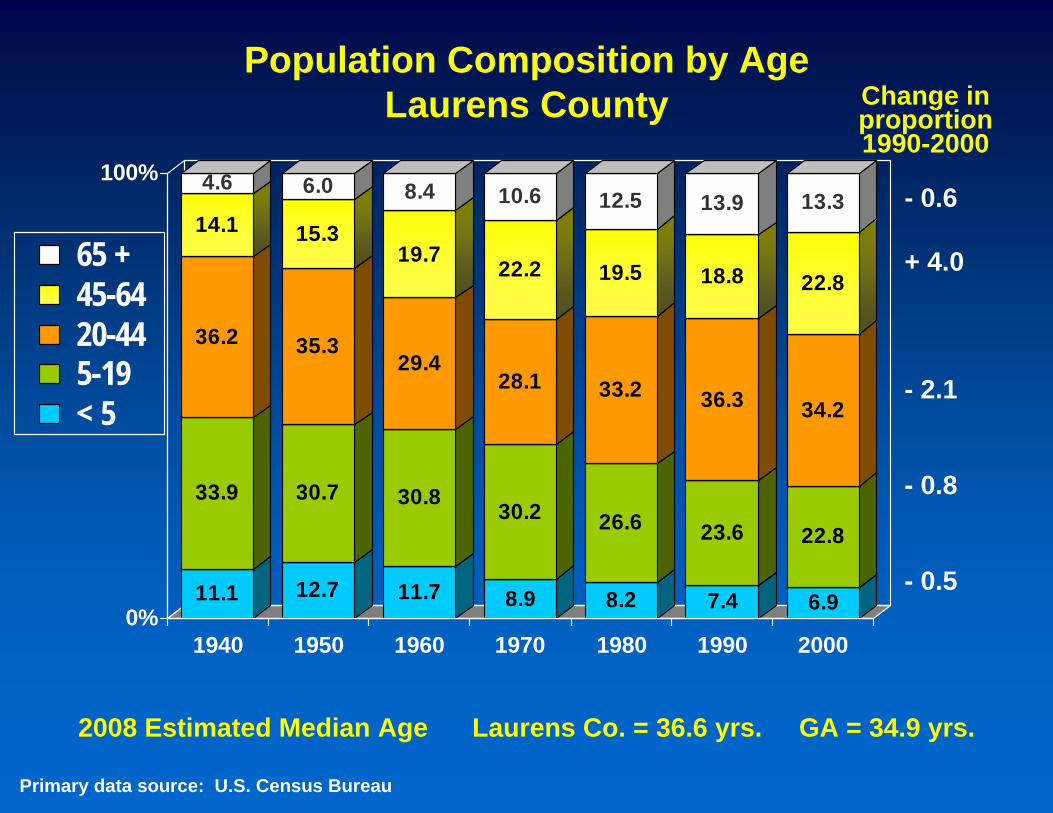
Population Composition by AgeLaurens County
11.1
33.9
36.2
14.1
4.6
12.7
30.7
35.3
15.3
6.0
11.7
30.8
29.4
19.7
8.4
8.9
30.2
28.1
22.2
10.6
8.2
26.6
33.2
19.5
12.5
7.4
23.6
36.3
18.8
13.9
6.9
22.8
34.2
22.8
13.3
0%
100%
1940 1950 1960 1970 1980 1990 2000
65 + 45-64 20-44 5-19 < 5
2008 Estimated Median Age Laurens Co. = 36.6 yrs. GA = 34.9 yrs.
Primary data source: U.S. Census Bureau
- 0.6
+ 4.0
- 2.1
- 0.8
- 0.5
Change in proportion 1990-2000
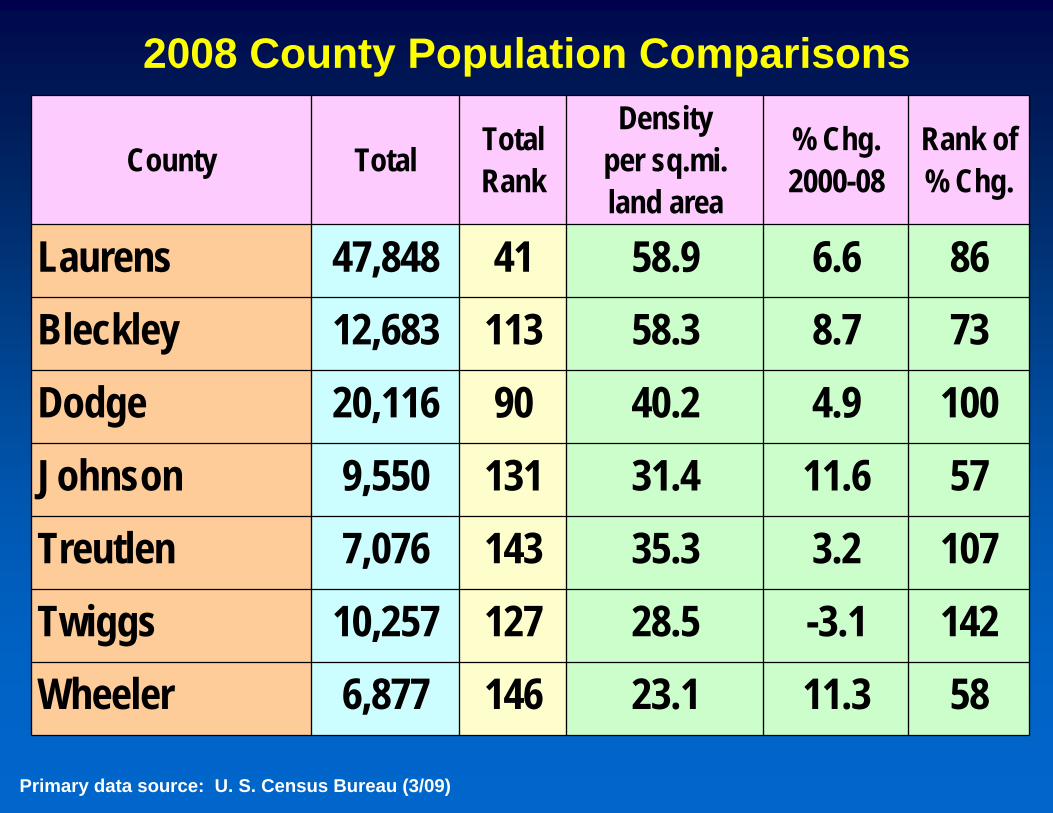
2008 County Population Comparisons
County Total TotalRank
Densityper sq.mi.land area
% Chg.2000-08
Rank of% Chg.
Laurens 47,848 41 58.9 6.6 86Bleckley 12,683 113 58.3 8.7 73Dodge 20,116 90 40.2 4.9 100Johnson 9,550 131 31.4 11.6 57Treutlen 7,076 143 35.3 3.2 107Twiggs 10,257 127 28.5 -3.1 142Wheeler 6,877 146 23.1 11.3 58
Primary data source: U. S. Census Bureau (3/09)
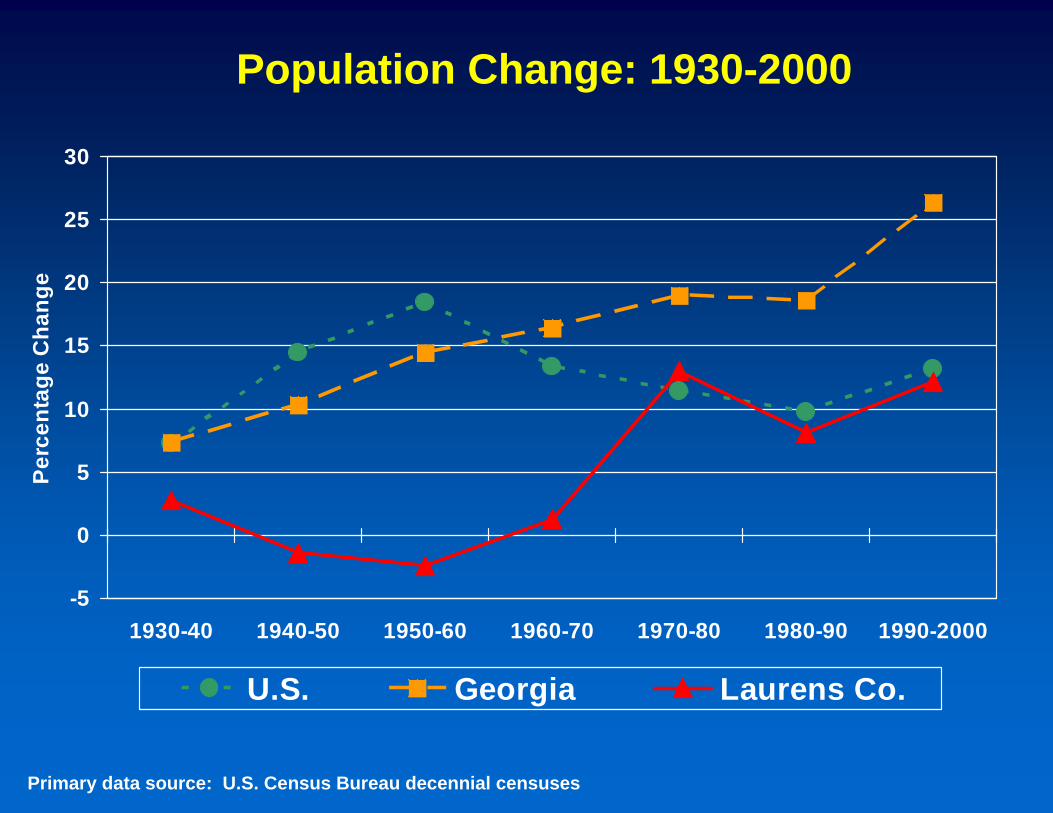
Population Change: 1930-2000
-5
0
5
10
15
20
25
30
1930-40 1940-50 1950-60 1960-70 1970-80 1980-90 1990-2000
Perc
enta
ge C
hang
e
U.S. Georgia Laurens Co.
Primary data source: U.S. Census Bureau decennial censuses
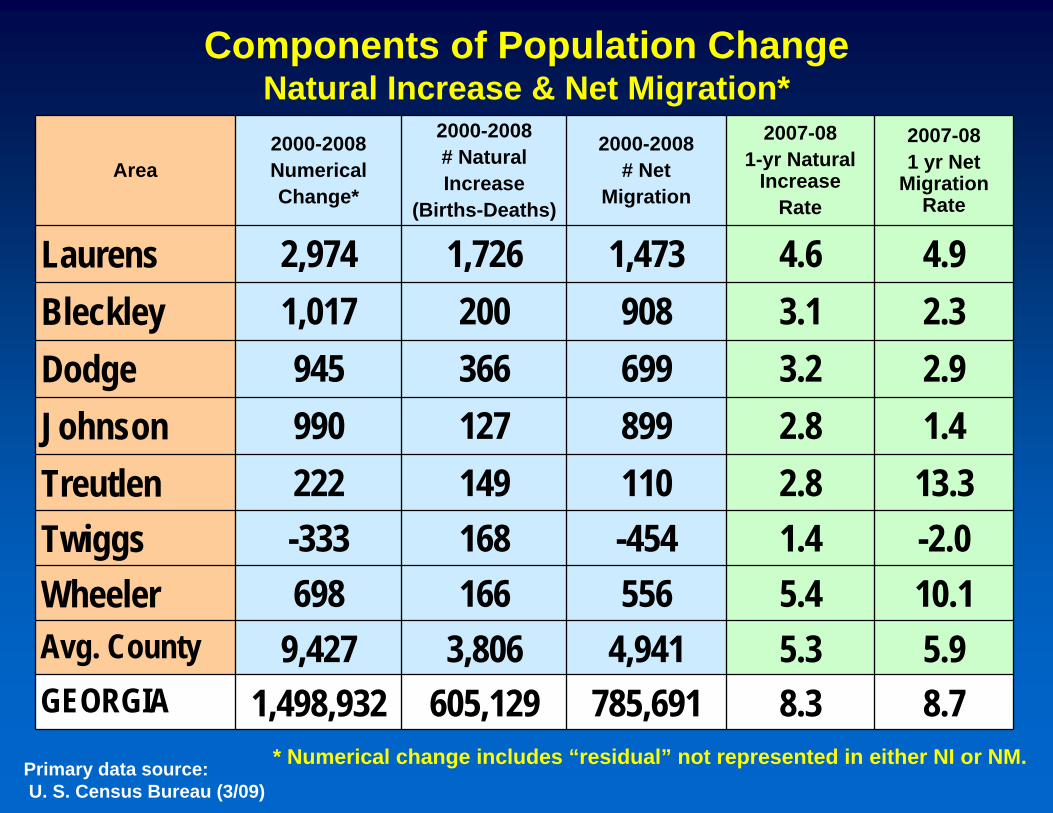
Components of Population ChangeNatural Increase & Net Migration*
Area2000-2008NumericalChange*
2000-2008# NaturalIncrease
(Births-Deaths)
2000-2008# Net
Migration
2007-081-yr Natural
IncreaseRate
2007-081 yr Net
Migration Rate
Laurens 2,974 1,726 1,473 4.6 4.9Bleckley 1,017 200 908 3.1 2.3Dodge 945 366 699 3.2 2.9Johnson 990 127 899 2.8 1.4Treutlen 222 149 110 2.8 13.3Twiggs -333 168 -454 1.4 -2.0Wheeler 698 166 556 5.4 10.1Avg. County 9,427 3,806 4,941 5.3 5.9GEORGIA 1,498,932 605,129 785,691 8.3 8.7
* Numerical change includes “residual” not represented in either NI or NM.Primary data source:U. S. Census Bureau (3/09)
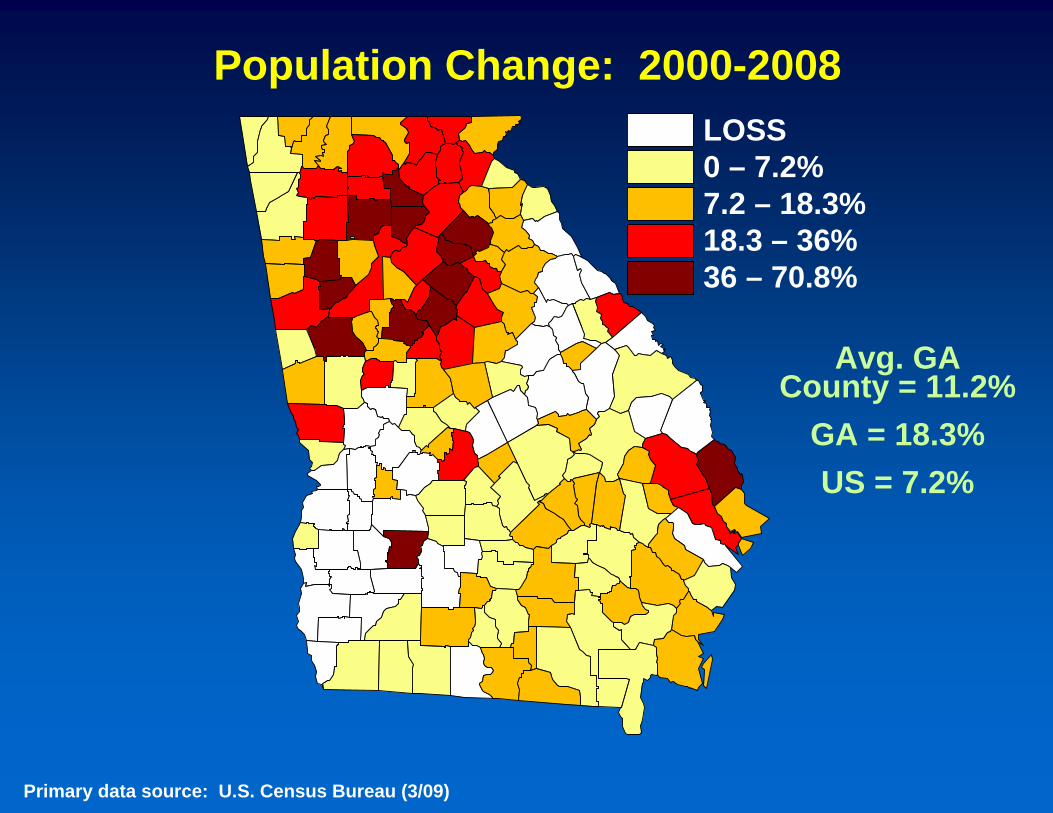
Population Change: 2000-2008LOSS0 – 7.2%7.2 – 18.3%18.3 – 36%36 – 70.8%
Avg. GA County = 11.2%
GA = 18.3%US = 7.2%
Primary data source: U.S. Census Bureau (3/09)
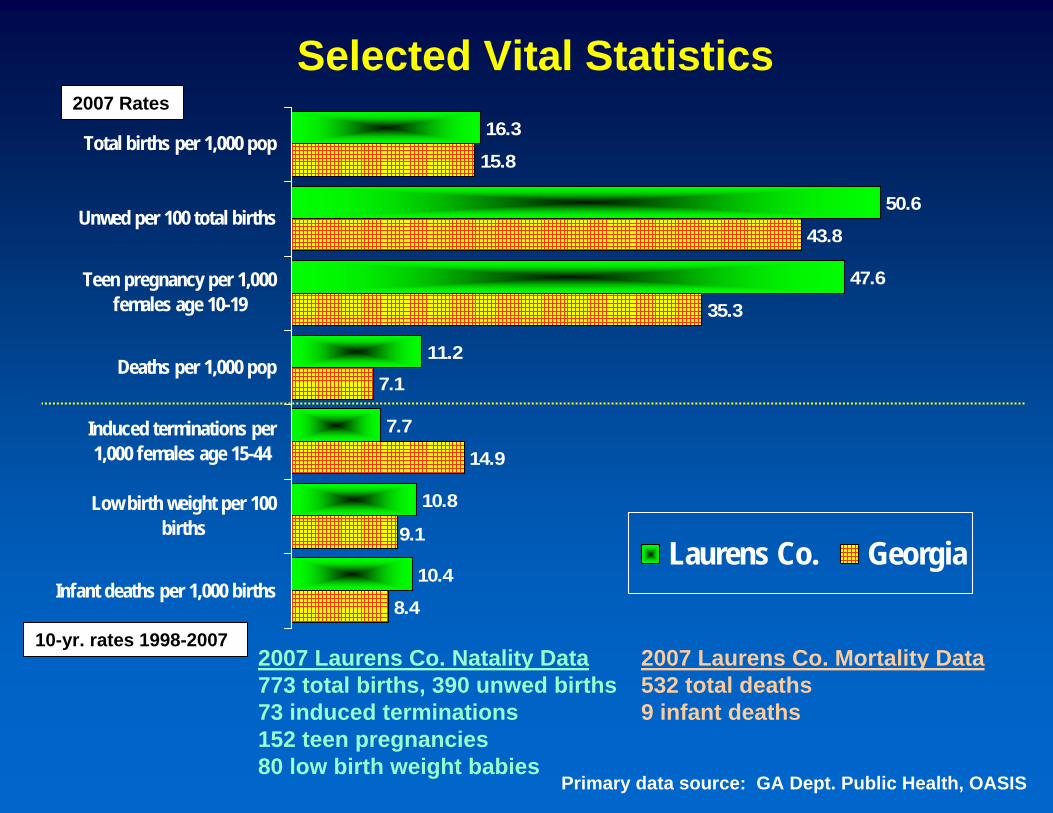
16.3
47.6
11.2
7.7
10.8
10.4
15.8
43.8
35.3
7.1
14.9
8.4
50.6
9.1
Total births per 1,000 pop
Unwed per 100 total births
Teen pregnancy per 1,000females age 10-19
Deaths per 1,000 pop
Induced terminations per1,000 females age 15-44
Low birth weight per 100births
Infant deaths per 1,000 birthsLaurens Co. Georgia
Selected Vital Statistics
2007 Laurens Co. Natality Data773 total births, 390 unwed births73 induced terminations152 teen pregnancies80 low birth weight babies
2007 Laurens Co. Mortality Data532 total deaths9 infant deaths
Primary data source: GA Dept. Public Health, OASIS
2007 Rates
10-yr. rates 1998-2007
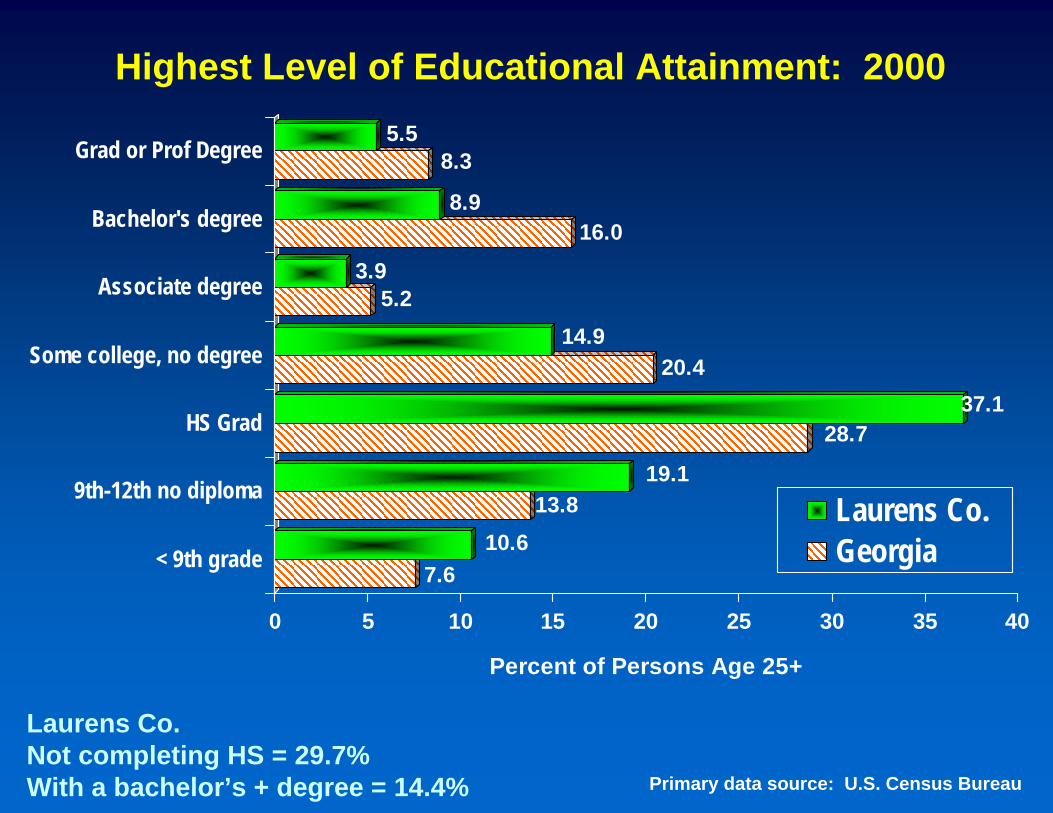
7.610.6
13.819.1
28.737.1
20.414.9
5.23.9
16.08.9
8.35.5
0 5 10 15 20 25 30 35 40
Percent of Persons Age 25+
< 9th grade
9th-12th no diploma
HS Grad
Some college, no degree
Associate degree
Bachelor's degree
Grad or Prof Degree
Laurens Co.Georgia
Highest Level of Educational Attainment: 2000
Primary data source: U.S. Census Bureau
Laurens Co. Not completing HS = 29.7%With a bachelor’s + degree = 14.4%
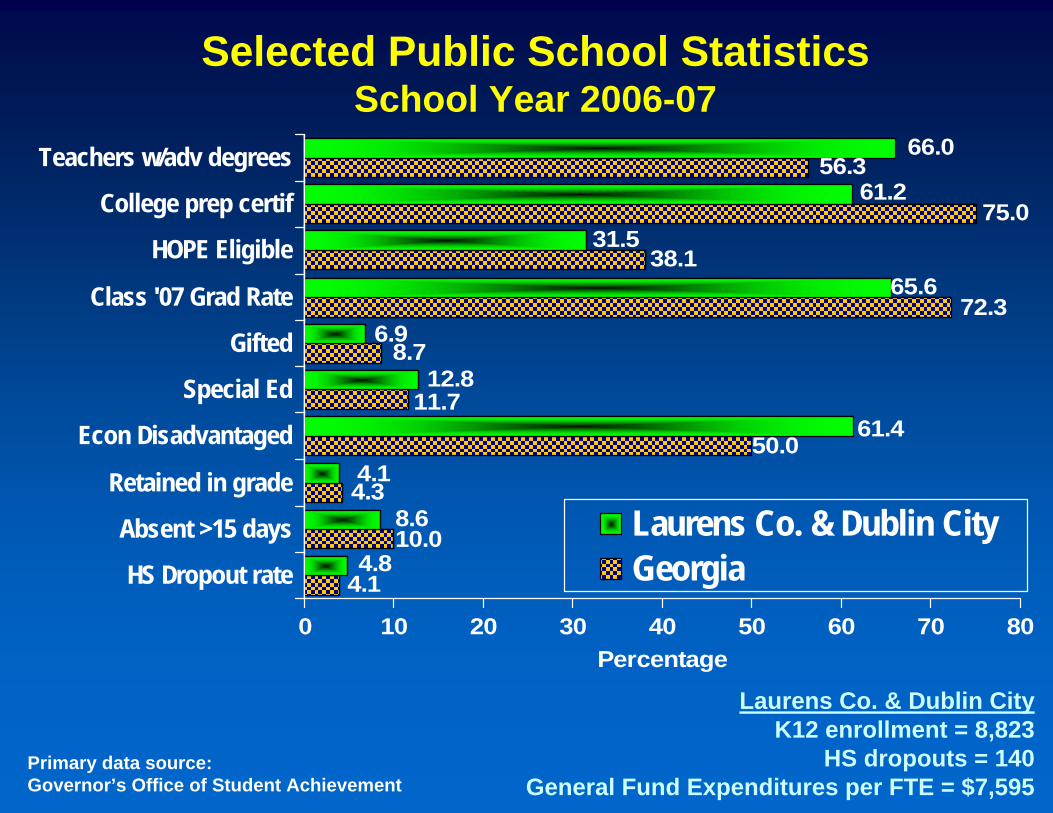
Selected Public School StatisticsSchool Year 2006-07
4.14.8
10.08.6
4.34.1
50.061.4
11.712.8
8.76.9
72.365.6
38.131.5
75.061.2
56.366.0
0 10 20 30 40 50 60 70 80Percentage
HS Dropout rate
Absent >15 days
Retained in grade
Econ Disadvantaged
Special Ed
Gifted
Class '07 Grad Rate
HOPE Eligible
College prep certif
Teachers w/adv degrees
Laurens Co. & Dublin CityGeorgia
Primary data source:Governor’s Office of Student Achievement
Laurens Co. & Dublin CityK12 enrollment = 8,823
HS dropouts = 140General Fund Expenditures per FTE = $7,595
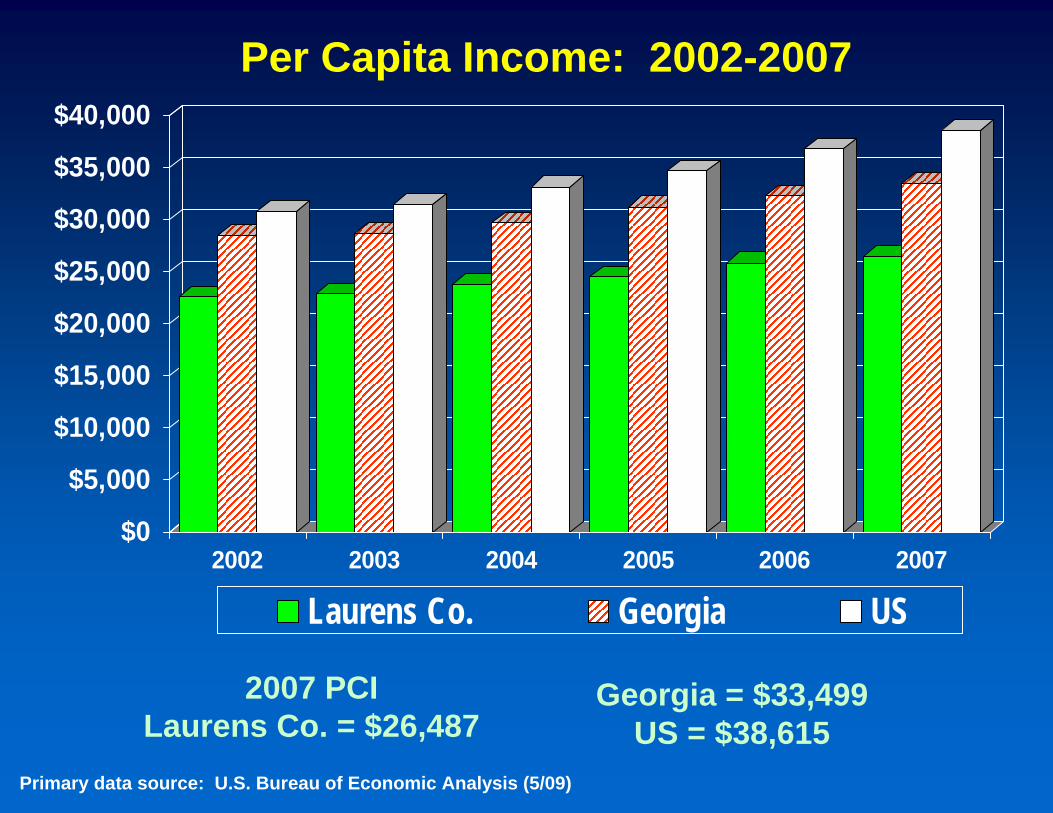
Per Capita Income: 2002-2007
Primary data source: U.S. Bureau of Economic Analysis (5/09)
2007 PCILaurens Co. = $26,487
Georgia = $33,499US = $38,615
$0
$5,000
$10,000
$15,000
$20,000
$25,000
$30,000
$35,000
$40,000
2002 2003 2004 2005 2006 2007
Laurens Co. Georgia US
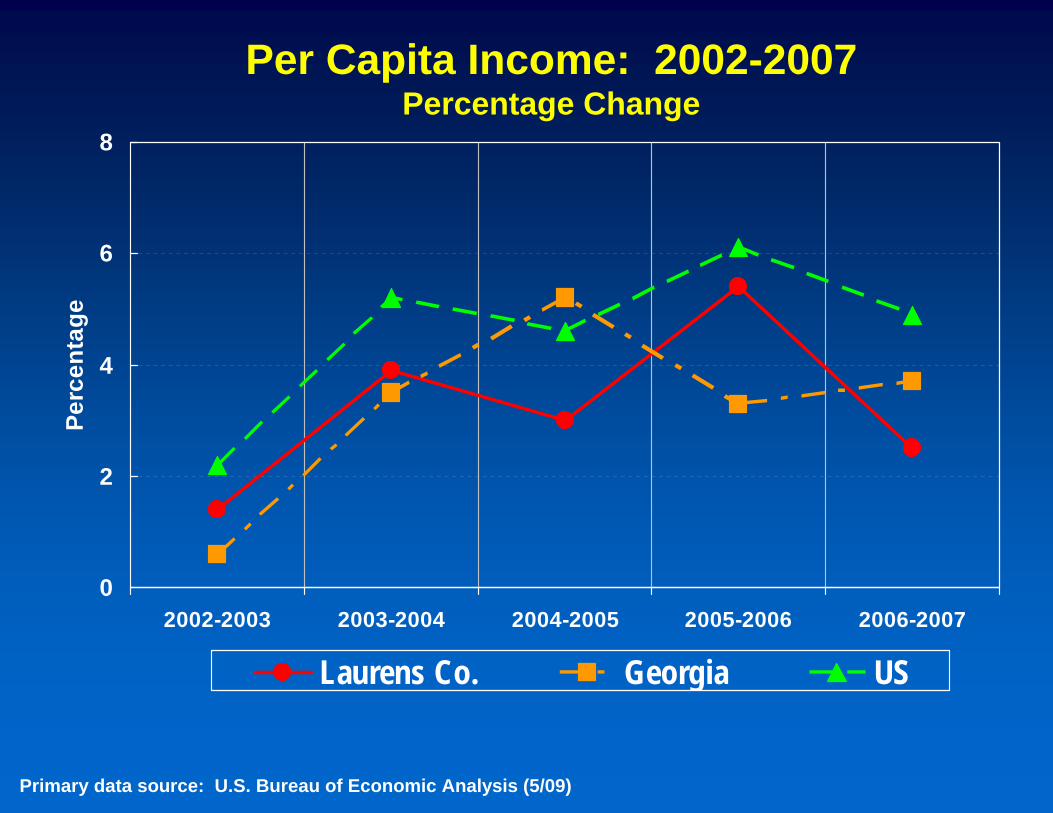
Per Capita Income: 2002-2007Percentage Change
0
2
4
6
8
2002-2003 2003-2004 2004-2005 2005-2006 2006-2007
Perc
enta
ge
Laurens Co. Georgia US
Primary data source: U.S. Bureau of Economic Analysis (5/09)
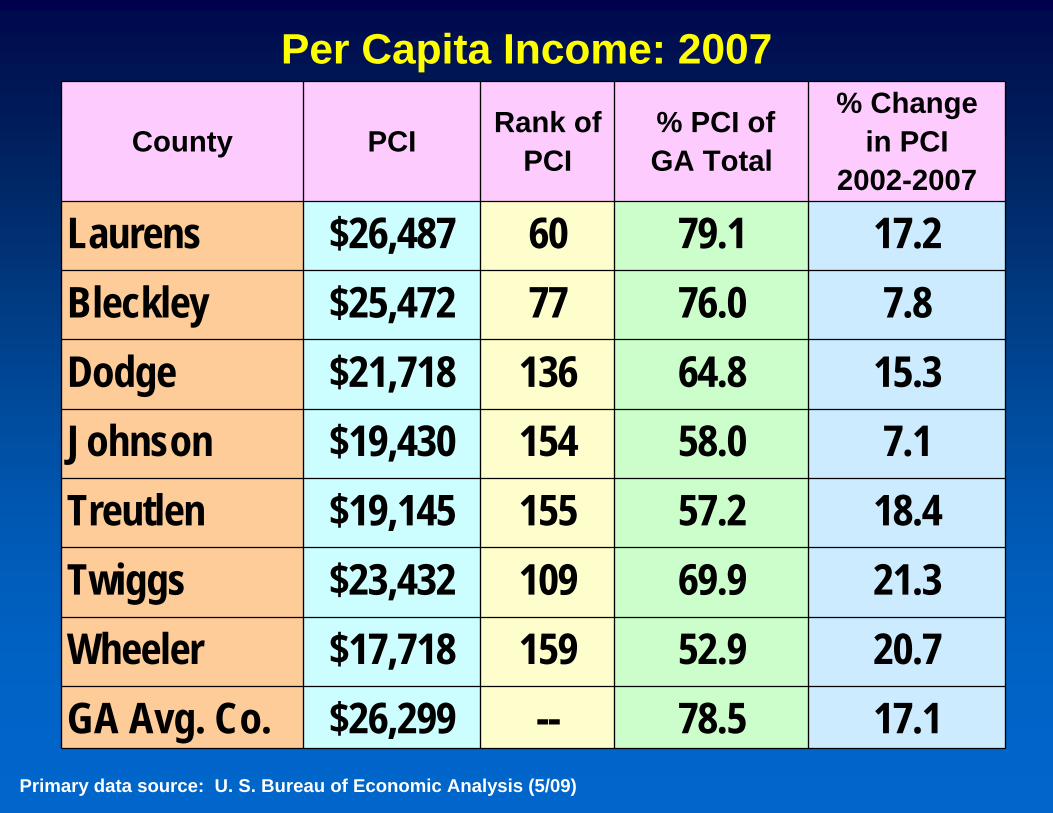
Per Capita Income: 2007
County PCI Rank ofPCI
% PCI ofGA Total
% Changein PCI
2002-2007
Laurens $26,487 60 79.1 17.2Bleckley $25,472 77 76.0 7.8Dodge $21,718 136 64.8 15.3Johnson $19,430 154 58.0 7.1Treutlen $19,145 155 57.2 18.4Twiggs $23,432 109 69.9 21.3Wheeler $17,718 159 52.9 20.7GA Avg. Co. $26,299 -- 78.5 17.1
Primary data source: U. S. Bureau of Economic Analysis (5/09)
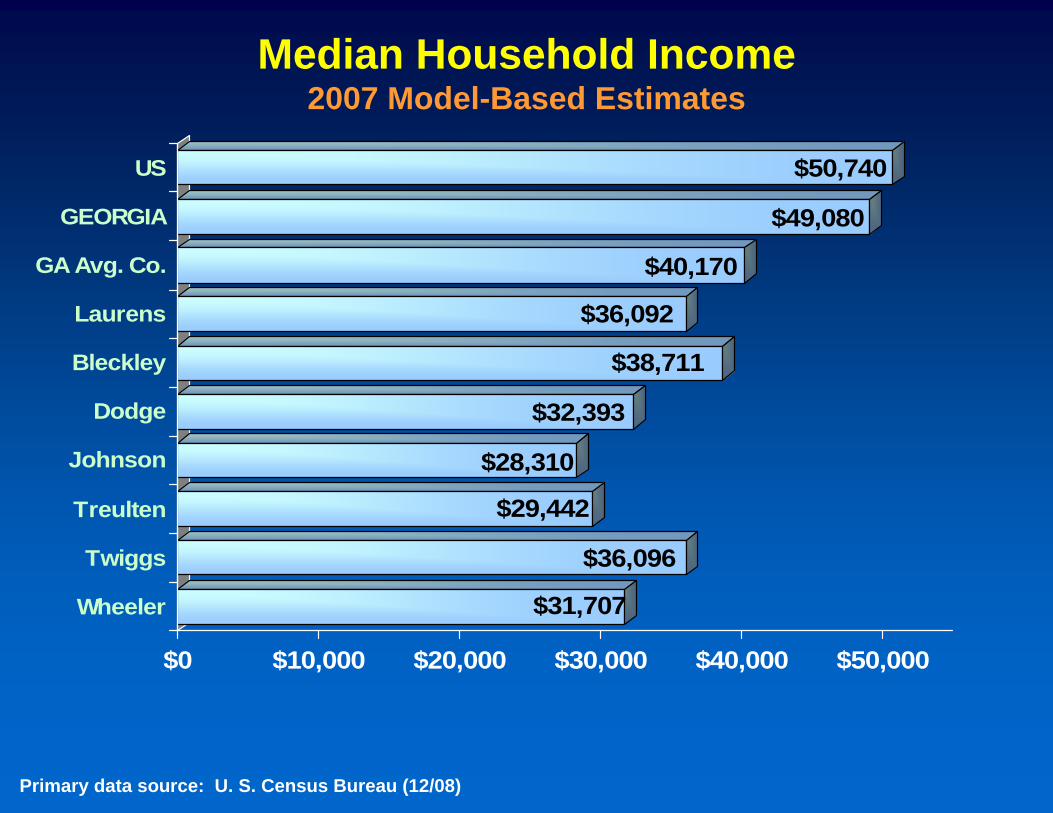
$31,707
$36,096
$29,442
$28,310
$32,393
$38,711
$36,092
$40,170
$49,080
$50,740
$0 $10,000 $20,000 $30,000 $40,000 $50,000
US
GEORGIA
GA Avg. Co.
Laurens
Bleckley
Dodge
Johnson
Treulten
Twiggs
Wheeler
Primary data source: U. S. Census Bureau (12/08)
Median Household Income2007 Model-Based Estimates
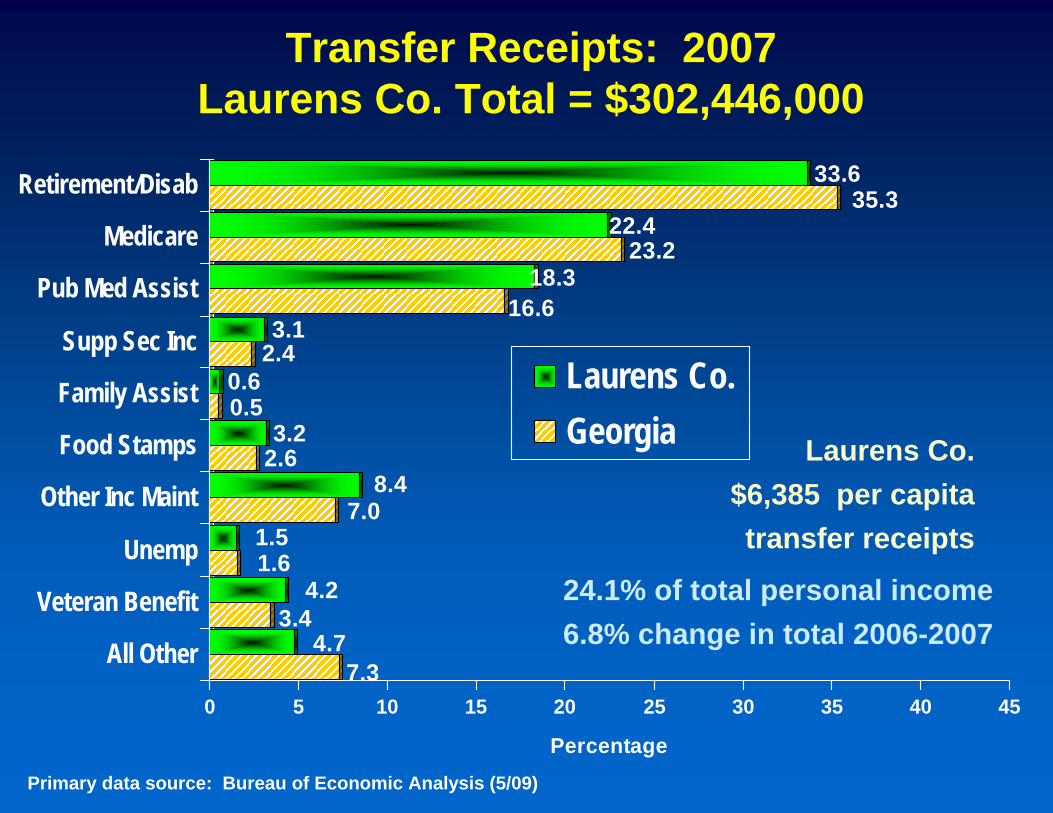
7.34.7
3.44.2
1.61.5
7.08.4
2.63.2
0.50.6
2.43.1
16.618.3
23.222.4
35.333.6
0 5 10 15 20 25 30 35 40 45
Percentage
All Other
Veteran Benefit
Unemp
Other Inc Maint
Food Stamps
Family Assist
Supp Sec Inc
Pub Med Assist
Medicare
Retirement/Disab
Laurens Co.Georgia
Transfer Receipts: 2007Laurens Co. Total = $302,446,000
Laurens Co.$6,385 per capitatransfer receipts
24.1% of total personal income6.8% change in total 2006-2007
Primary data source: Bureau of Economic Analysis (5/09)
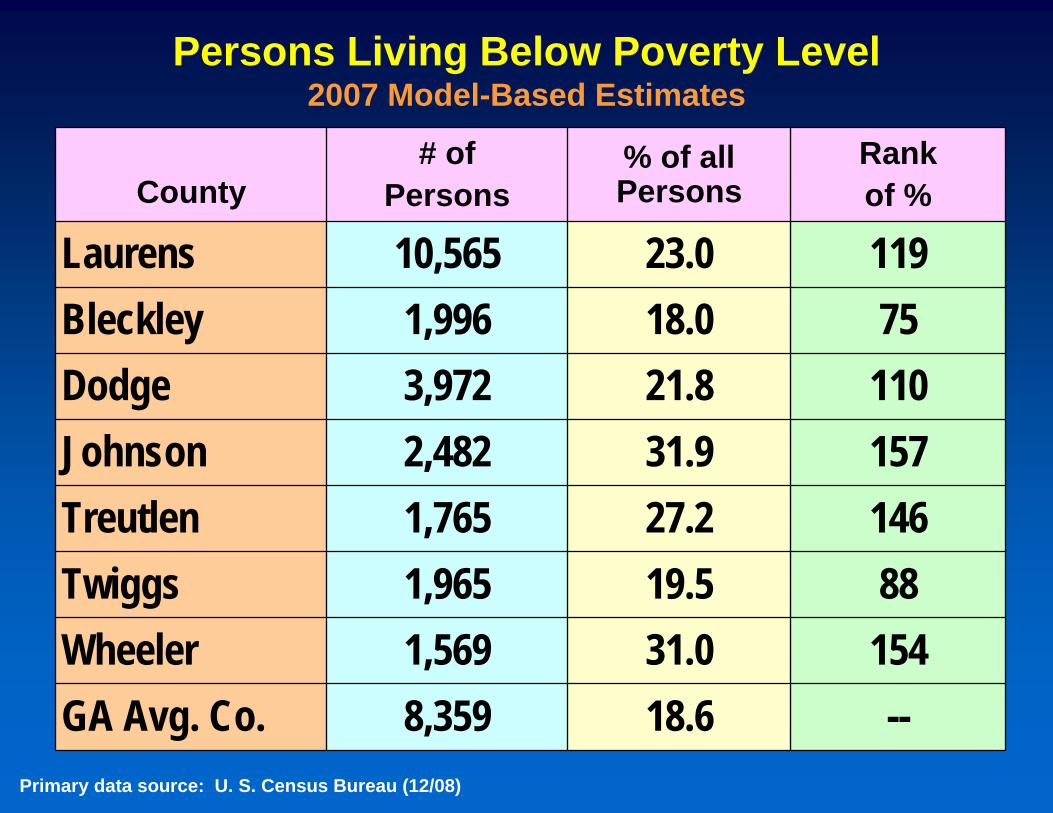
Persons Living Below Poverty Level2007 Model-Based Estimates
County# of
Persons% of all Persons
Rankof %
Laurens 10,565 23.0 119Bleckley 1,996 18.0 75Dodge 3,972 21.8 110Johnson 2,482 31.9 157Treutlen 1,765 27.2 146Twiggs 1,965 19.5 88Wheeler 1,569 31.0 154GA Avg. Co. 8,359 18.6 --
Primary data source: U. S. Census Bureau (12/08)
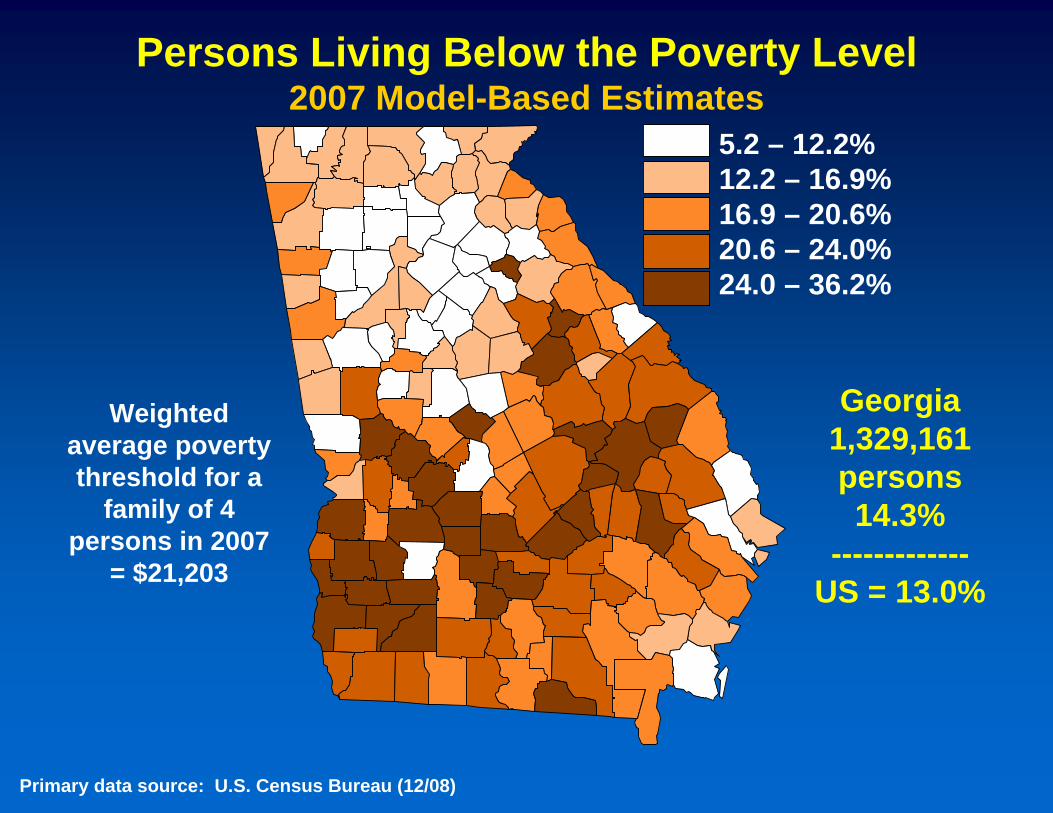
Persons Living Below the Poverty Level2007 Model-Based Estimates
5.2 – 12.2%12.2 – 16.9%16.9 – 20.6%20.6 – 24.0%24.0 – 36.2%
Georgia1,329,161persons14.3%
-------------US = 13.0%
Primary data source: U.S. Census Bureau (12/08)
Weighted average poverty threshold for a
family of 4 persons in 2007
= $21,203
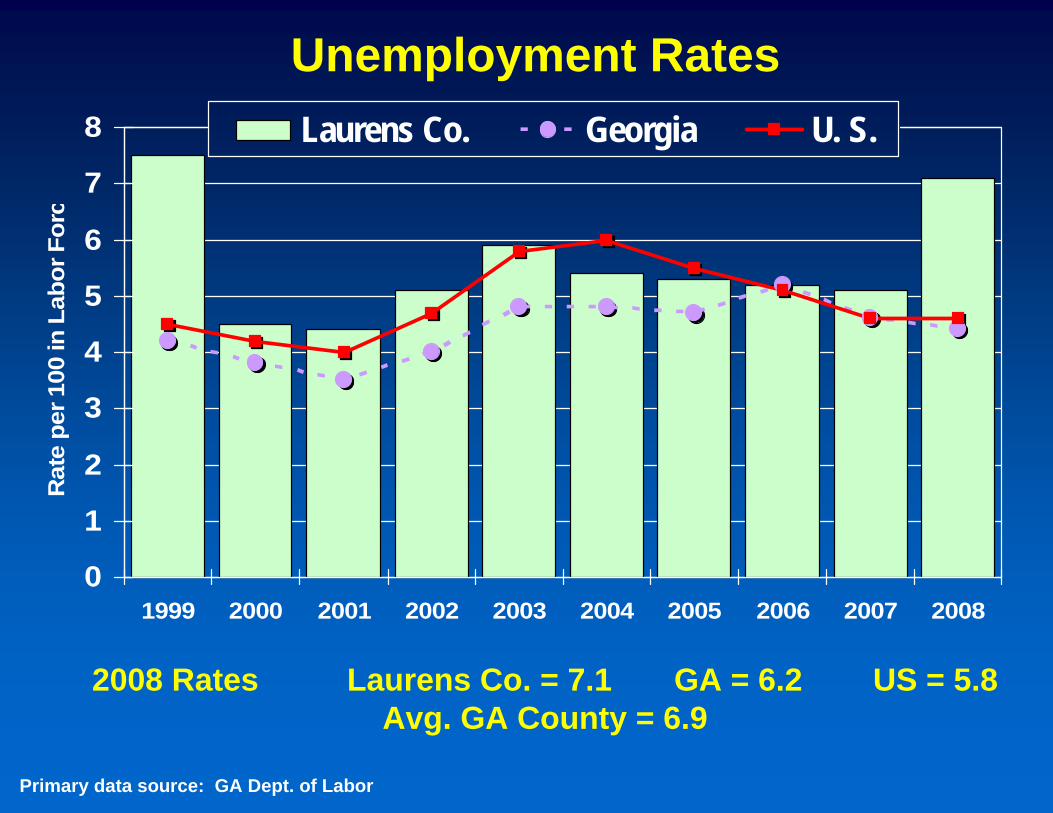
Unemployment Rates
0
1
2
3
4
5
6
7
8
1999 2000 2001 2002 2003 2004 2005 2006 2007 2008
Rat
e pe
r 100
in L
abor
For
c
Laurens Co. Georgia U. S.
2008 Rates Laurens Co. = 7.1 GA = 6.2 US = 5.8Avg. GA County = 6.9
Primary data source: GA Dept. of Labor
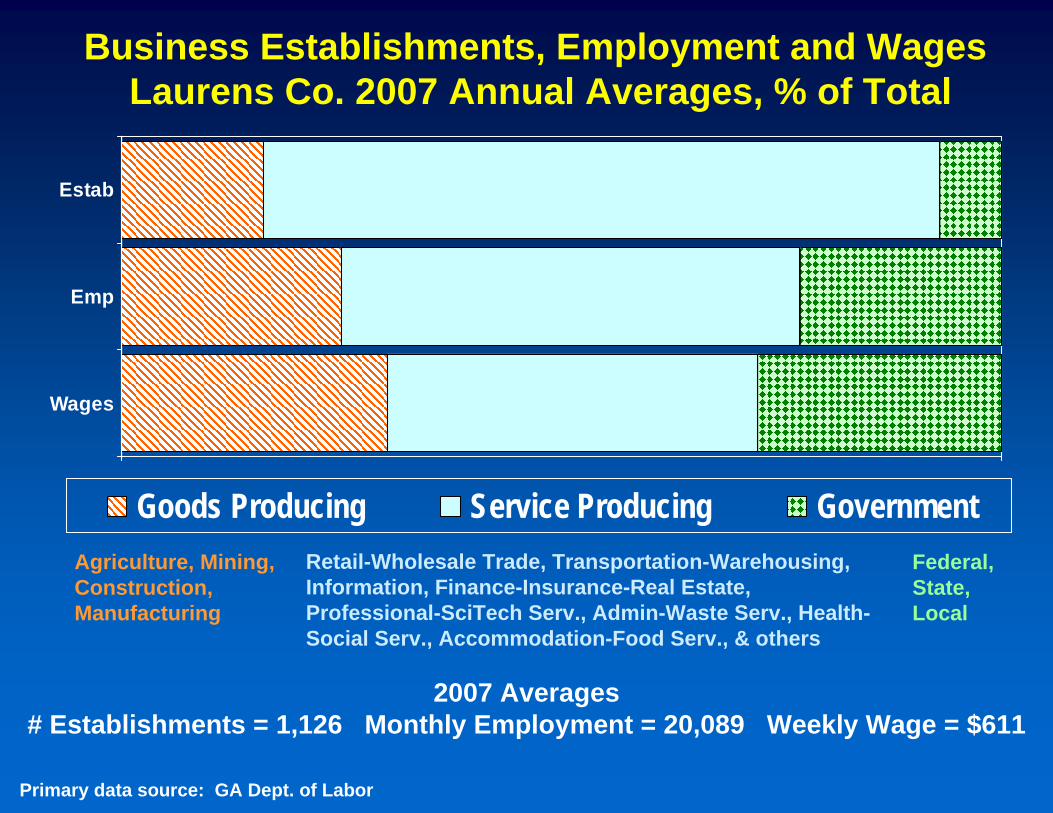
Estab
Emp
Wages
Goods Producing Service Producing Government
Primary data source: GA Dept. of Labor
Business Establishments, Employment and WagesLaurens Co. 2007 Annual Averages, % of Total
Agriculture, Mining, Construction, Manufacturing
Retail-Wholesale Trade, Transportation-Warehousing, Information, Finance-Insurance-Real Estate, Professional-SciTech Serv., Admin-Waste Serv., Health-Social Serv., Accommodation-Food Serv., & others
Federal, State, Local
2007 Averages# Establishments = 1,126 Monthly Employment = 20,089 Weekly Wage = $611
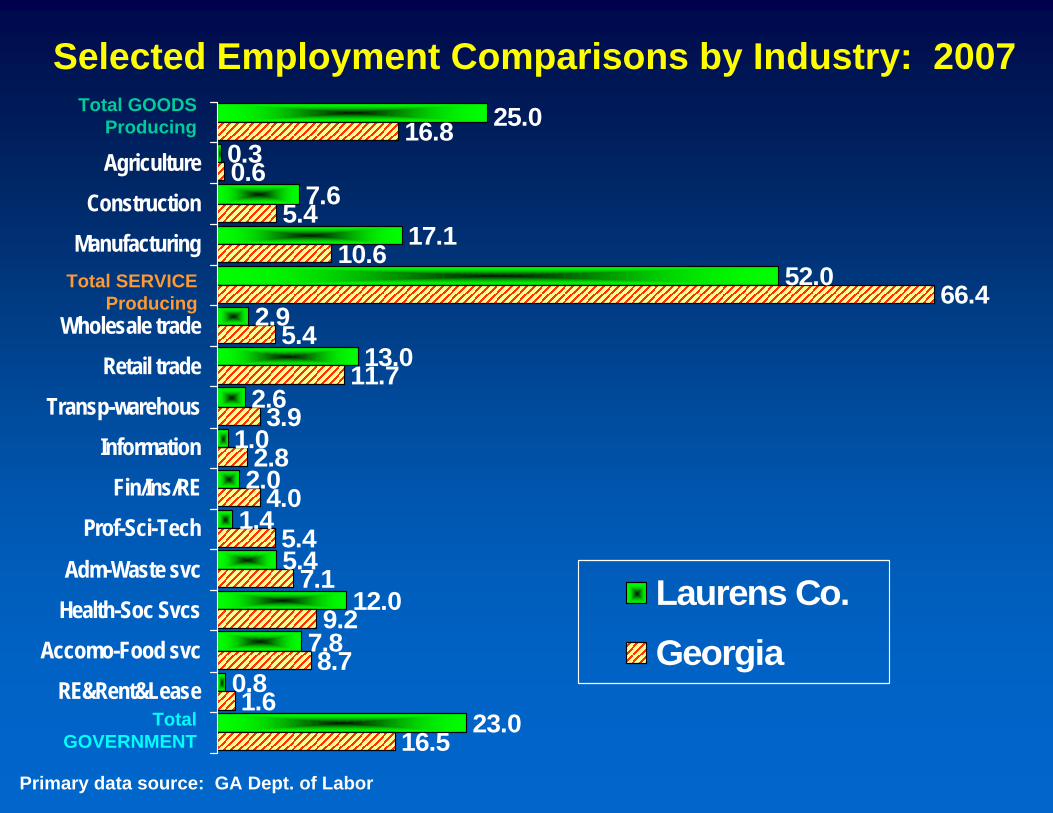
Selected Employment Comparisons by Industry: 200725.0
7.617.1
52.02.9
13.02.6
1.02.01.4
5.412.0
7.80.8
23.0
16.80.6
5.410.6
66.45.4
11.73.9
2.84.0
5.47.1
9.28.7
1.616.5
0.3AgricultureConstruction
Manufacturing
Wholesale tradeRetail trade
Transp-warehousInformation
Fin/Ins/REProf-Sci-Tech
Adm-Waste svcHealth-Soc Svcs
Accomo-Food svcRE&Rent&Lease
Laurens Co.Georgia
Primary data source: GA Dept. of Labor
Total GOODS Producing
Total SERVICE Producing
Total GOVERNMENT
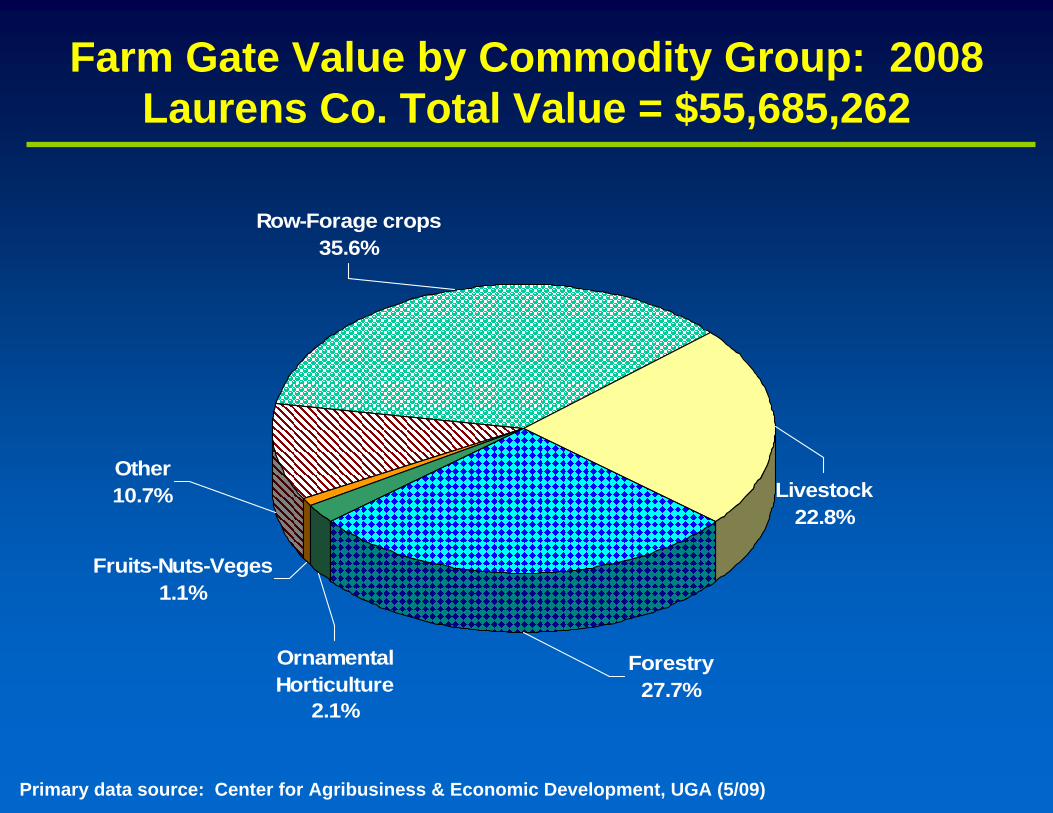
Farm Gate Value by Commodity Group: 2008Laurens Co. Total Value = $55,685,262
Other10.7%
Fruits-Nuts-Veges1.1%
Ornamental Horticulture
2.1%
Forestry27.7%
Livestock22.8%
Row-Forage crops35.6%
Primary data source: Center for Agribusiness & Economic Development, UGA (5/09)
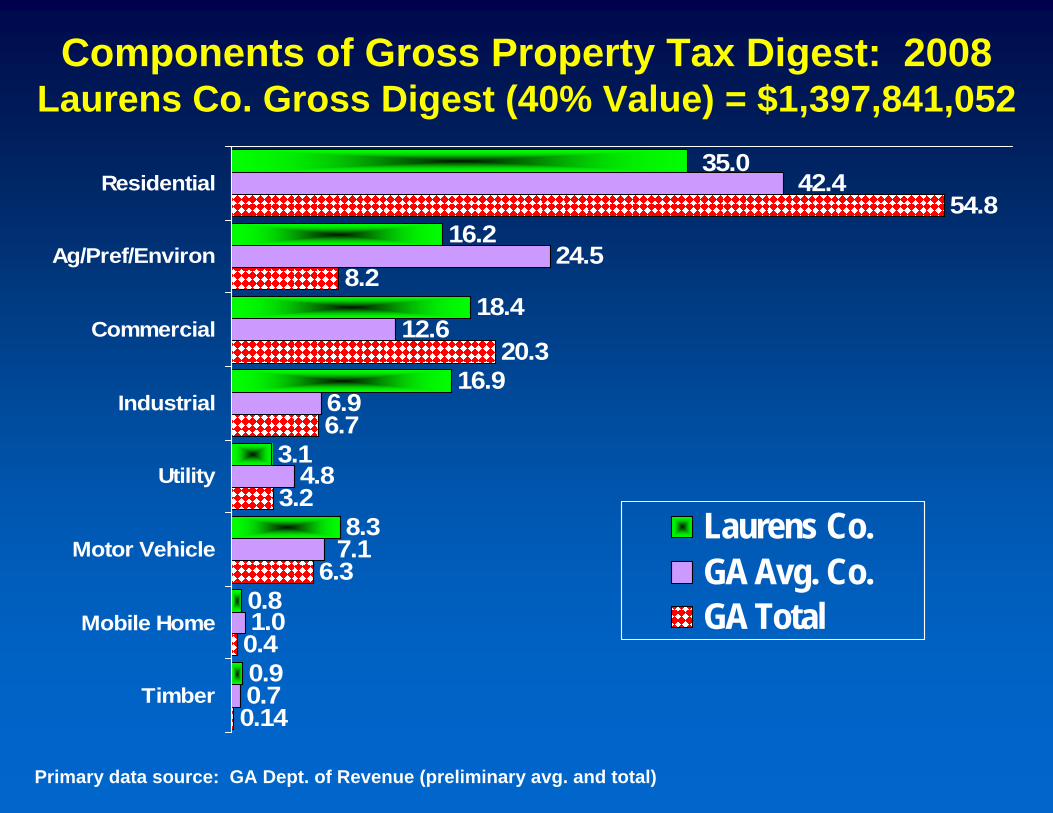
Components of Gross Property Tax Digest: 2008Laurens Co. Gross Digest (40% Value) = $1,397,841,052
18.4
16.9
3.1
8.3
0.8
0.9
24.5
12.6
6.9
4.8
1.0
0.7
54.8
8.2
20.3
6.7
3.2
6.3
0.4
0.14
35.0
16.2
42.4
7.1
Residential
Ag/Pref/Environ
Commercial
Industrial
Utility
Motor Vehicle
Mobile Home
Timber
Laurens Co.GA Avg. Co. GA Total
Primary data source: GA Dept. of Revenue (preliminary avg. and total)
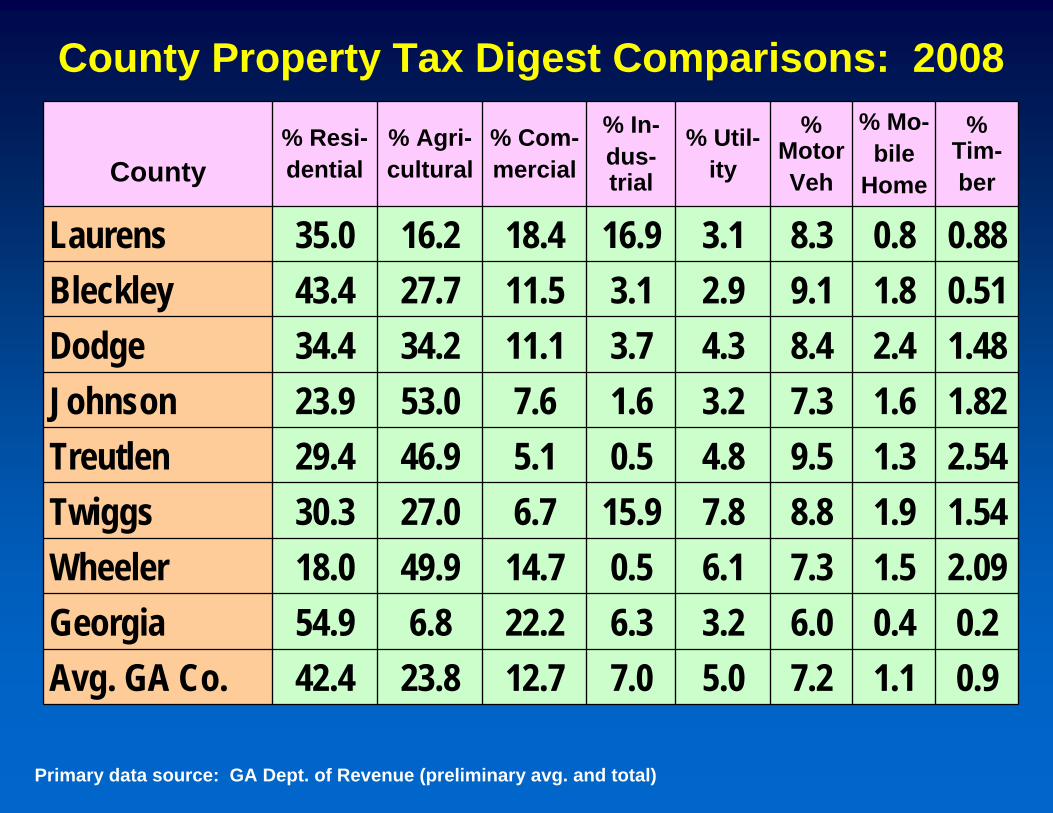
County Property Tax Digest Comparisons: 2008
County% Resi-dential
% Agri-cultural
% Com-mercial
% In-dus-trial
% Util-ity
% MotorVeh
% Mo-bile
Home
% Tim-ber
Laurens 35.0 16.2 18.4 16.9 3.1 8.3 0.8 0.88Bleckley 43.4 27.7 11.5 3.1 2.9 9.1 1.8 0.51Dodge 34.4 34.2 11.1 3.7 4.3 8.4 2.4 1.48Johnson 23.9 53.0 7.6 1.6 3.2 7.3 1.6 1.82Treutlen 29.4 46.9 5.1 0.5 4.8 9.5 1.3 2.54Twiggs 30.3 27.0 6.7 15.9 7.8 8.8 1.9 1.54Wheeler 18.0 49.9 14.7 0.5 6.1 7.3 1.5 2.09Georgia 54.9 6.8 22.2 6.3 3.2 6.0 0.4 0.2Avg. GA Co. 42.4 23.8 12.7 7.0 5.0 7.2 1.1 0.9
Primary data source: GA Dept. of Revenue (preliminary avg. and total)
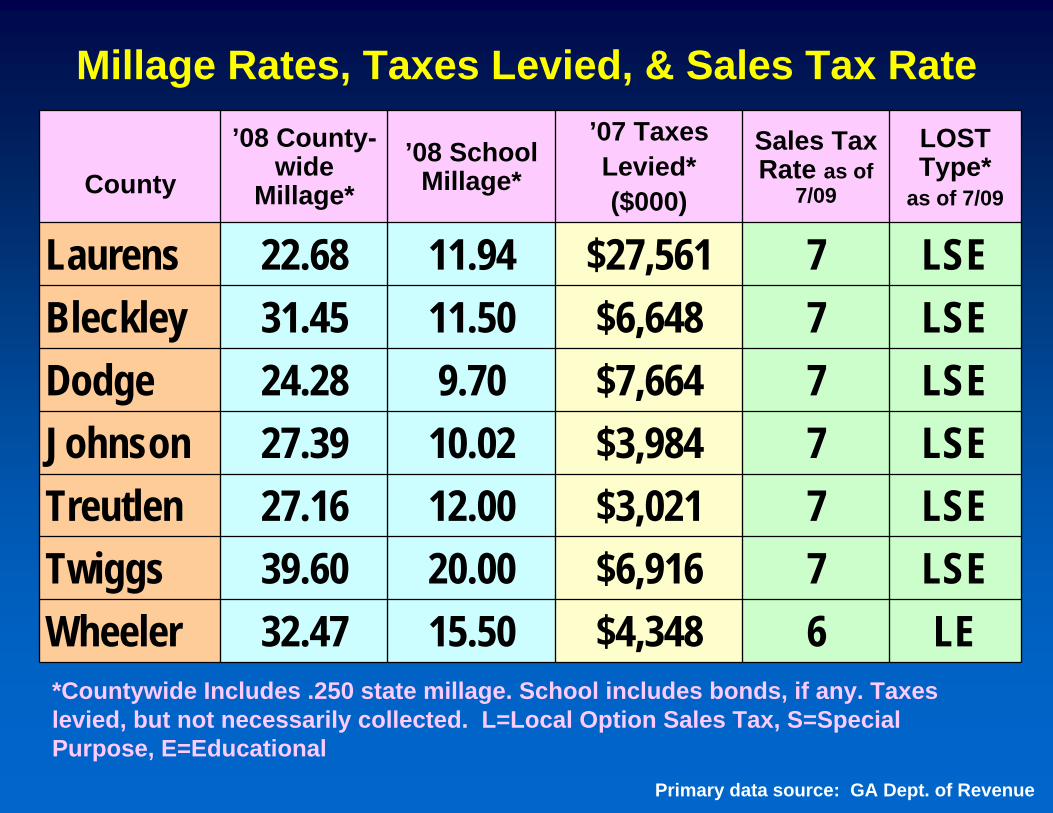
Millage Rates, Taxes Levied, & Sales Tax Rate
County
’08 County-wide
Millage*’08 School
Millage*
’07 TaxesLevied*($000)
Sales Tax Rate as of
7/09
LOST Type*
as of 7/09
Laurens 22.68 11.94 $27,561 7 LSEBleckley 31.45 11.50 $6,648 7 LSEDodge 24.28 9.70 $7,664 7 LSEJohnson 27.39 10.02 $3,984 7 LSETreutlen 27.16 12.00 $3,021 7 LSETwiggs 39.60 20.00 $6,916 7 LSEWheeler 32.47 15.50 $4,348 6 LE
Primary data source: GA Dept. of Revenue
*Countywide Includes .250 state millage. School includes bonds, if any. Taxes levied, but not necessarily collected. L=Local Option Sales Tax, S=Special Purpose, E=Educational
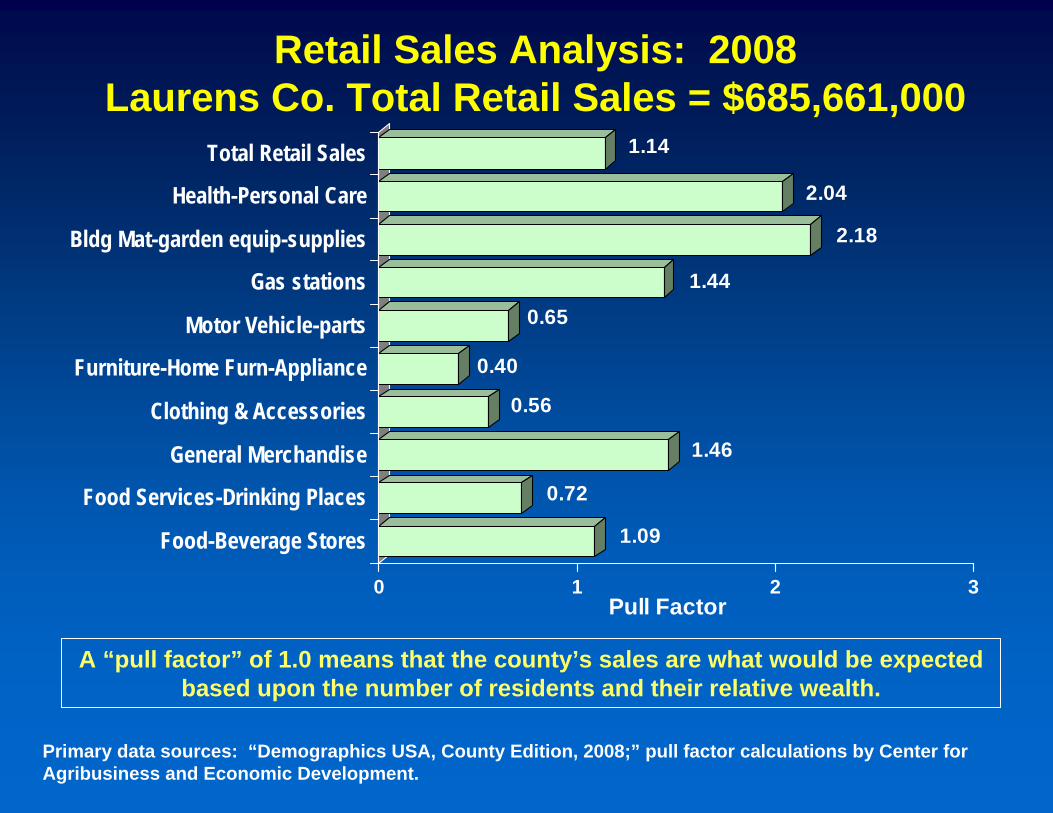
1.09
0.72
1.46
0.56
0.40
0.65
1.44
2.18
2.04
1.14
0 1 2 3Pull Factor
Food-Beverage Stores
Food Services-Drinking Places
General Merchandise
Clothing & Accessories
Furniture-Home Furn-Appliance
Motor Vehicle-parts
Gas stations
Bldg Mat-garden equip-supplies
Health-Personal Care
Total Retail Sales
A “pull factor” of 1.0 means that the county’s sales are what would be expectedbased upon the number of residents and their relative wealth.
Primary data sources: “Demographics USA, County Edition, 2008;” pull factor calculations by Center for Agribusiness and Economic Development.
Retail Sales Analysis: 2008Laurens Co. Total Retail Sales = $685,661,000
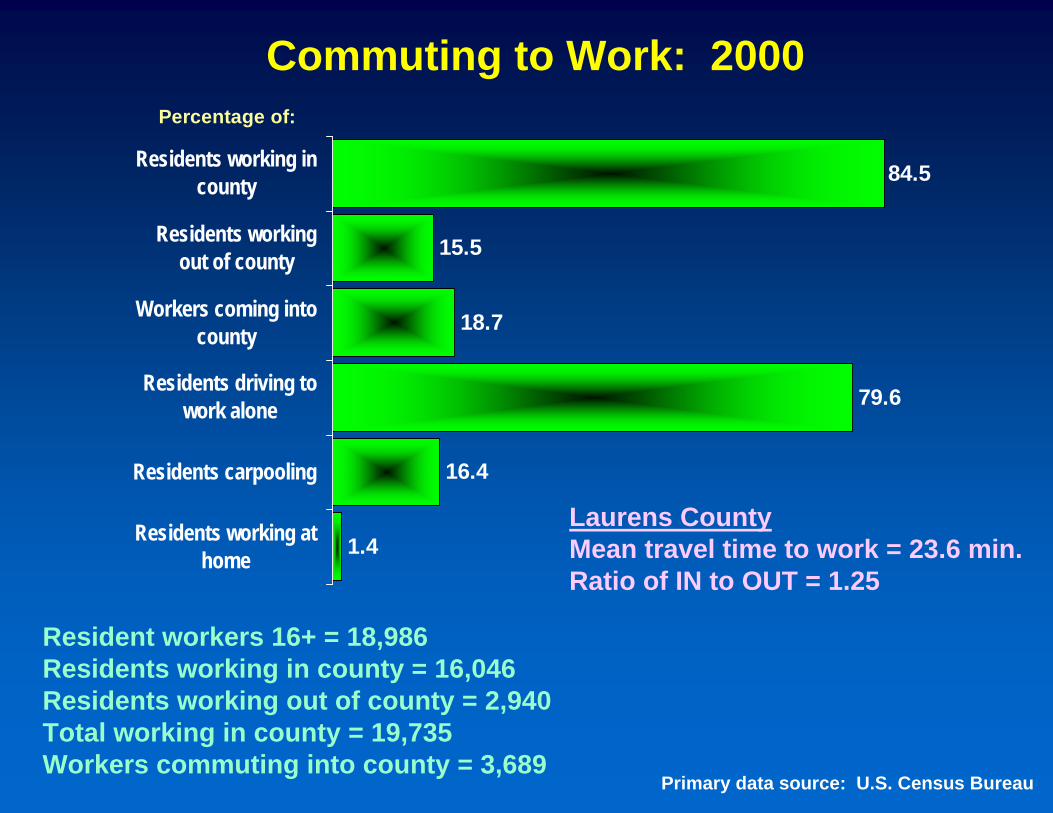
84.5
18.7
79.6
16.4
1.4
15.5
Residents working incounty
Residents workingout of county
Workers coming intocounty
Residents driving towork alone
Residents carpooling
Residents working athome
Percentage of:
Commuting to Work: 2000
Resident workers 16+ = 18,986Residents working in county = 16,046Residents working out of county = 2,940Total working in county = 19,735Workers commuting into county = 3,689
Primary data source: U.S. Census Bureau
Laurens CountyMean travel time to work = 23.6 min.Ratio of IN to OUT = 1.25
Prepared for Laurens County Cooperative Extensionby Susan R. Boatright
Center for Agribusiness and Economic DevelopmentCollege of Agricultural and Environmental Sciences
The University of Georgia • Athens, GAGeorgia Cooperative Extension
706-542-0760 • 706-542-8938To learn more about your county, click on
“Georgia Statistics System” at our website:www.caed.uga.edu
This study was developed to assist community leadership with their
future planning and decision making.
Special Area Report# 0917 July, 2009


![[External] Nidec GA - Company Profile 2021](https://img.pdfslide.us/doc/110x75/622c6205be7d7064cb234e03/external-nidec-ga-company-profile-2021.jpg)