Embed Size (px)
Citation preview
Latino Representation on Fortune 1000 Boards
kpmg.com

© 2019 KPMG LLP, a Delaware limited liability partnership and the U.S. member firm of the KPMG network of independent member firms affiliated with KPMG International Cooperative (“KPMG International”), a Swiss entity. All rights reserved.
The KPMG name and logo are registered trademarks or trademarks of KPMG International. NDPPS 869289
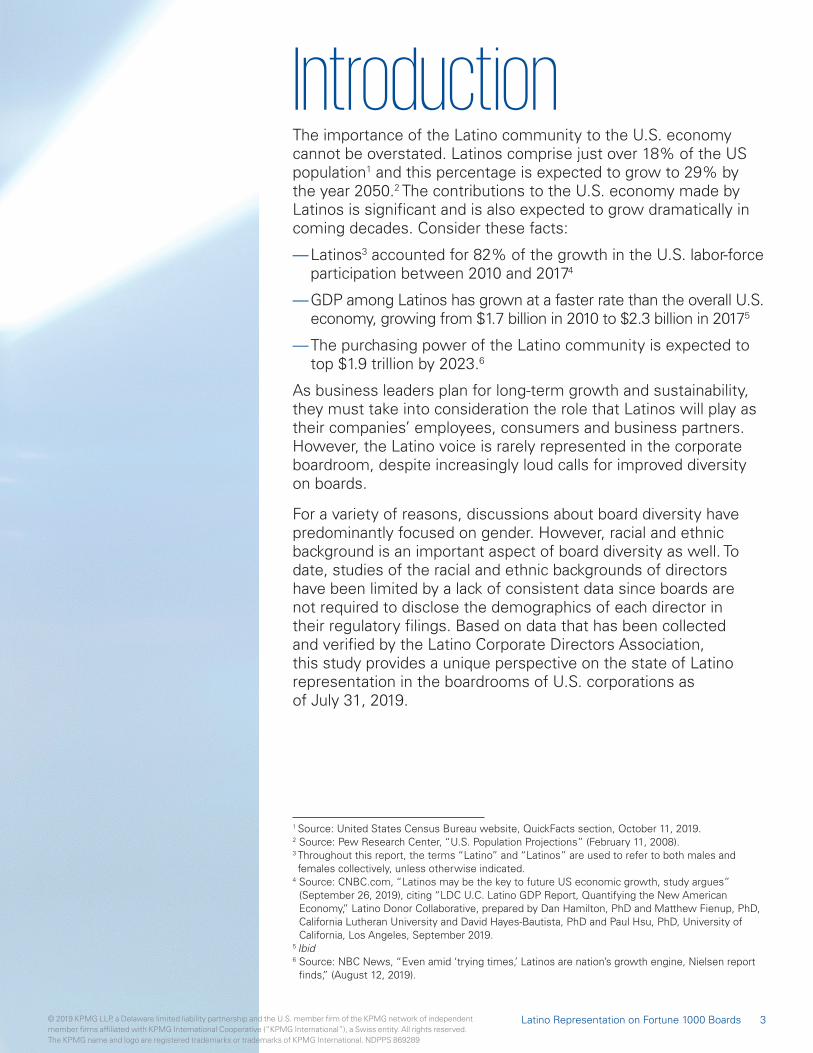
IntroductionThe importance of the Latino community to the U.S. economy cannot be overstated. Latinos comprise just over 18% of the US population1 and this percentage is expected to grow to 29% by the year 2050.2 The contributions to the U.S. economy made by Latinos is significant and is also expected to grow dramatically in coming decades. Consider these facts:
— Latinos3 accounted for 82% of the growth in the U.S. labor-force participation between 2010 and 20174
— GDP among Latinos has grown at a faster rate than the overall U.S. economy, growing from $1.7 billion in 2010 to $2.3 billion in 20175
— The purchasing power of the Latino community is expected to top $1.9 trillion by 2023.6
As business leaders plan for long-term growth and sustainability, they must take into consideration the role that Latinos will play as their companies’ employees, consumers and business partners. However, the Latino voice is rarely represented in the corporate boardroom, despite increasingly loud calls for improved diversity on boards.
For a variety of reasons, discussions about board diversity have predominantly focused on gender. However, racial and ethnic background is an important aspect of board diversity as well. To date, studies of the racial and ethnic backgrounds of directors have been limited by a lack of consistent data since boards are not required to disclose the demographics of each director in their regulatory filings. Based on data that has been collected and verified by the Latino Corporate Directors Association, this study provides a unique perspective on the state of Latino representation in the boardrooms of U.S. corporations as of July 31, 2019.
3Latino Representation on Fortune 1000 Boards
1 Source: United States Census Bureau website, QuickFacts section, October 11, 2019.2 Source: Pew Research Center, “U.S. Population Projections” (February 11, 2008).3 Throughout this report, the terms “Latino” and “Latinos” are used to refer to both males and females collectively, unless otherwise indicated.
4 Source: CNBC.com, “Latinos may be the key to future US economic growth, study argues” (September 26, 2019), citing “LDC U.C. Latino GDP Report, Quantifying the New American Economy,” Latino Donor Collaborative, prepared by Dan Hamilton, PhD and Matthew Fienup, PhD, California Lutheran University and David Hayes-Bautista, PhD and Paul Hsu, PhD, University of California, Los Angeles, September 2019.
5 Ibid6 Source: NBC News, “Even amid ‘trying times,’ Latinos are nation’s growth engine, Nielsen report
finds,” (August 12, 2019).
© 2019 KPMG LLP, a Delaware limited liability partnership and the U.S. member firm of the KPMG network of independent member firms affiliated with KPMG International Cooperative (“KPMG International”), a Swiss entity. All rights reserved. The KPMG name and logo are registered trademarks or trademarks of KPMG International. NDPPS 869289
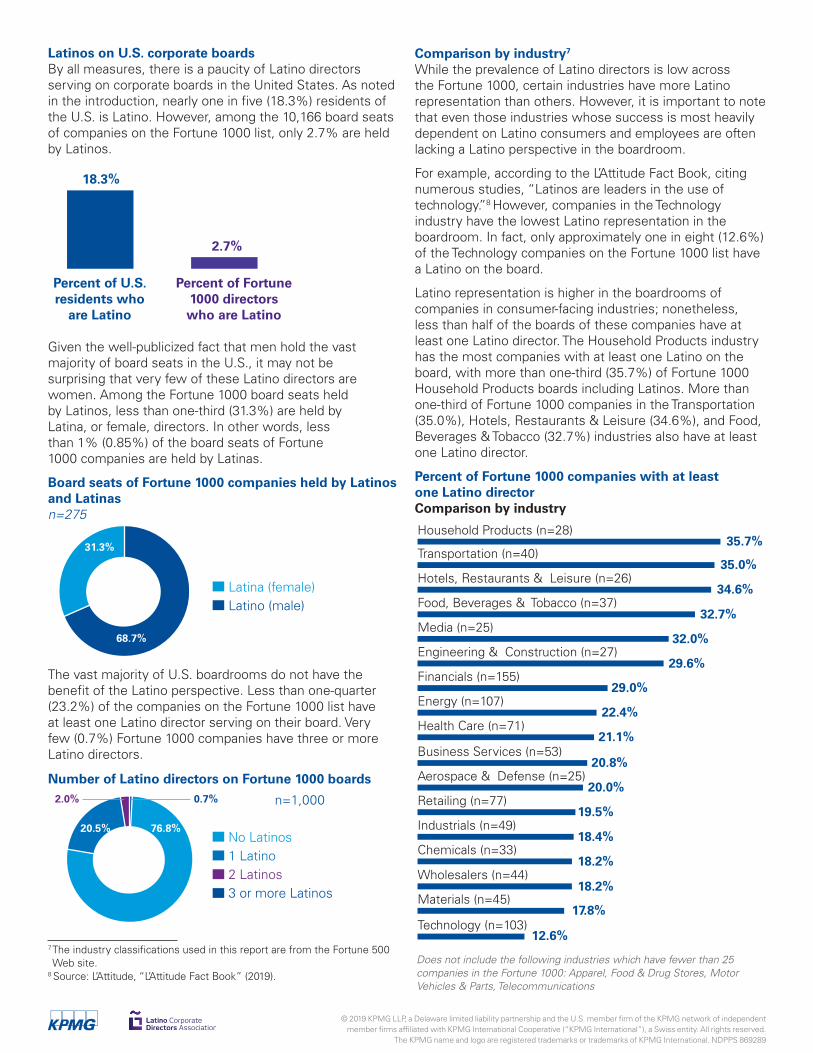
Latinos on U.S. corporate boardsBy all measures, there is a paucity of Latino directors serving on corporate boards in the United States. As noted in the introduction, nearly one in five (18.3%) residents of the U.S. is Latino. However, among the 10,166 board seats of companies on the Fortune 1000 list, only 2.7% are held by Latinos.
Given the well-publicized fact that men hold the vast majority of board seats in the U.S., it may not be surprising that very few of these Latino directors are women. Among the Fortune 1000 board seats held by Latinos, less than one-third (31.3%) are held by Latina, or female, directors. In other words, less than 1% (0.85%) of the board seats of Fortune 1000 companies are held by Latinas.
The vast majority of U.S. boardrooms do not have the benefit of the Latino perspective. Less than one-quarter (23.2%) of the companies on the Fortune 1000 list have at least one Latino director serving on their board. Very few (0.7%) Fortune 1000 companies have three or more Latino directors.
Comparison by industry7 While the prevalence of Latino directors is low across the Fortune 1000, certain industries have more Latino representation than others. However, it is important to note that even those industries whose success is most heavily dependent on Latino consumers and employees are often lacking a Latino perspective in the boardroom.
For example, according to the L’Attitude Fact Book, citing numerous studies, “Latinos are leaders in the use of technology.”8 However, companies in the Technology industry have the lowest Latino representation in the boardroom. In fact, only approximately one in eight (12.6%) of the Technology companies on the Fortune 1000 list have a Latino on the board.
Latino representation is higher in the boardrooms of companies in consumer-facing industries; nonetheless, less than half of the boards of these companies have at least one Latino director. The Household Products industry has the most companies with at least one Latino on the board, with more than one-third (35.7%) of Fortune 1000 Household Products boards including Latinos. More than one-third of Fortune 1000 companies in the Transportation (35.0%), Hotels, Restaurants & Leisure (34.6%), and Food, Beverages & Tobacco (32.7%) industries also have at least one Latino director.
Percent of Fortune 1000 companies with at least one Latino directorComparison by industry
18.3%
2.7%
Percent of Fortune 1000 directors who are Latino
Percent of U.S. residents who
are Latino
Board seats of Fortune 1000 companies held by Latinos and Latinas n=275
Number of Latino directors on Fortune 1000 boards0.7%2.0%
76.8%20.5%
68.7%
31.3%
Latina (female) Latino (male)
No Latinos1 Latino2 Latinos3 or more Latinos
n=1,000
Household Products (n=28)35.7%
Transportation (n=40)35.0%
Hotels, Restaurants & Leisure (n=26)34.6%
Food, Beverages & Tobacco (n=37)32.7%
Media (n=25)32.0%
Engineering & Construction (n=27)29.6%
Financials (n=155)29.0%
Energy (n=107)22.4%
Health Care (n=71)21.1%
Business Services (n=53)20.8%
Aerospace & Defense (n=25)20.0%
Retailing (n=77)19.5%
Industrials (n=49)18.4%
Chemicals (n=33)18.2%
Wholesalers (n=44)18.2%
Materials (n=45)17.8%
Technology (n=103)12.6%
Does not include the following industries which have fewer than 25 companies in the Fortune 1000: Apparel, Food & Drug Stores, Motor Vehicles & Parts, Telecommunications
7 The industry classifications used in this report are from the Fortune 500 Web site.
8 Source: L’Attitude, “L’Attitude Fact Book” (2019).
© 2019 KPMG LLP, a Delaware limited liability partnership and the U.S. member firm of the KPMG network of independent member firms affiliated with KPMG International Cooperative (“KPMG International”), a Swiss entity. All rights reserved.
The KPMG name and logo are registered trademarks or trademarks of KPMG International. NDPPS 869289
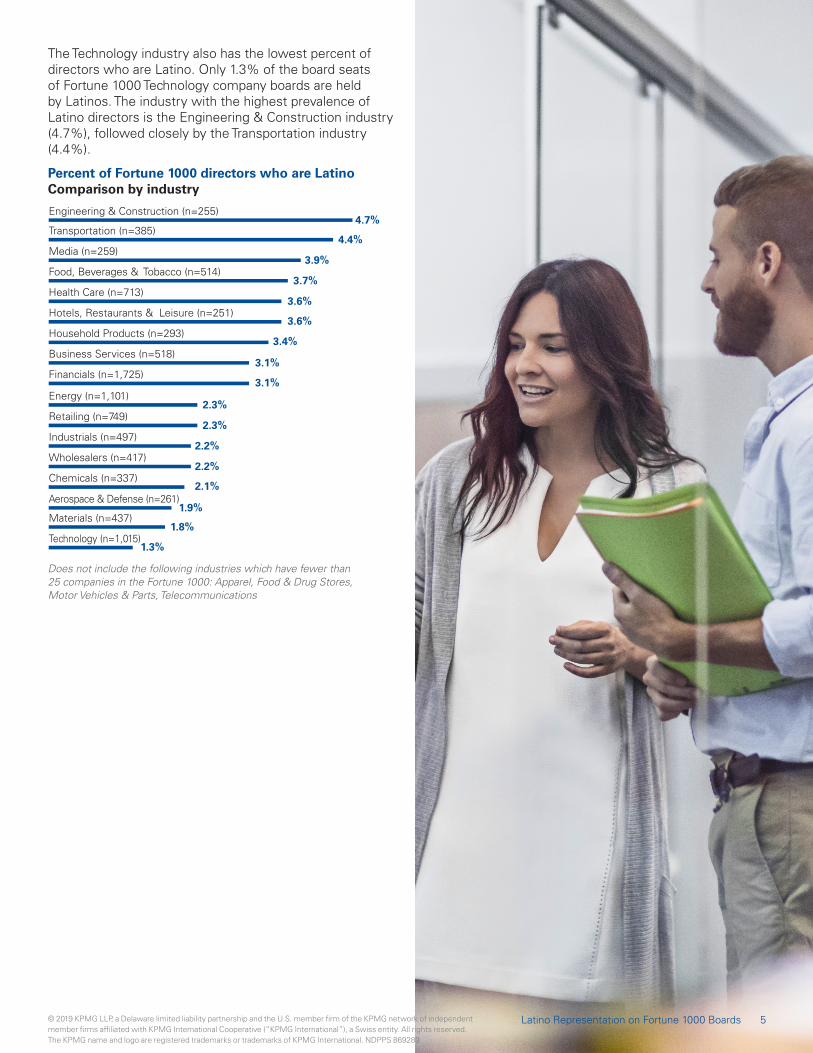
The Technology industry also has the lowest percent of directors who are Latino. Only 1.3% of the board seats of Fortune 1000 Technology company boards are held by Latinos. The industry with the highest prevalence of Latino directors is the Engineering & Construction industry (4.7%), followed closely by the Transportation industry (4.4%).
Percent of Fortune 1000 directors who are LatinoComparison by industry
Engineering & Construction (n=255)4.7%
4.4%
3.9%
3.7%
3.6%
3.6%
3.4%
3.1%
3.1%
2.3%
2.3%
2.2%
2.2%
2.1%
1.9%
1.8%
1.3%
Transportation (n=385)
Media (n=259)
Food, Beverages & Tobacco (n=514)
Health Care (n=713)
Hotels, Restaurants & Leisure (n=251)
Household Products (n=293)
Business Services (n=518)
Financials (n=1,725)
Energy (n=1,101)
Retailing (n=749)
Industrials (n=497)
Wholesalers (n=417)
Chemicals (n=337)
Aerospace & Defense (n=261)
Materials (n=437)
Technology (n=1,015)
Does not include the following industries which have fewer than 25 companies in the Fortune 1000: Apparel, Food & Drug Stores, Motor Vehicles & Parts, Telecommunications
5Latino Representation on Fortune 1000 Boards© 2019 KPMG LLP, a Delaware limited liability partnership and the U.S. member firm of the KPMG network of independent member firms affiliated with KPMG International Cooperative (“KPMG International”), a Swiss entity. All rights reserved. The KPMG name and logo are registered trademarks or trademarks of KPMG International. NDPPS 869289
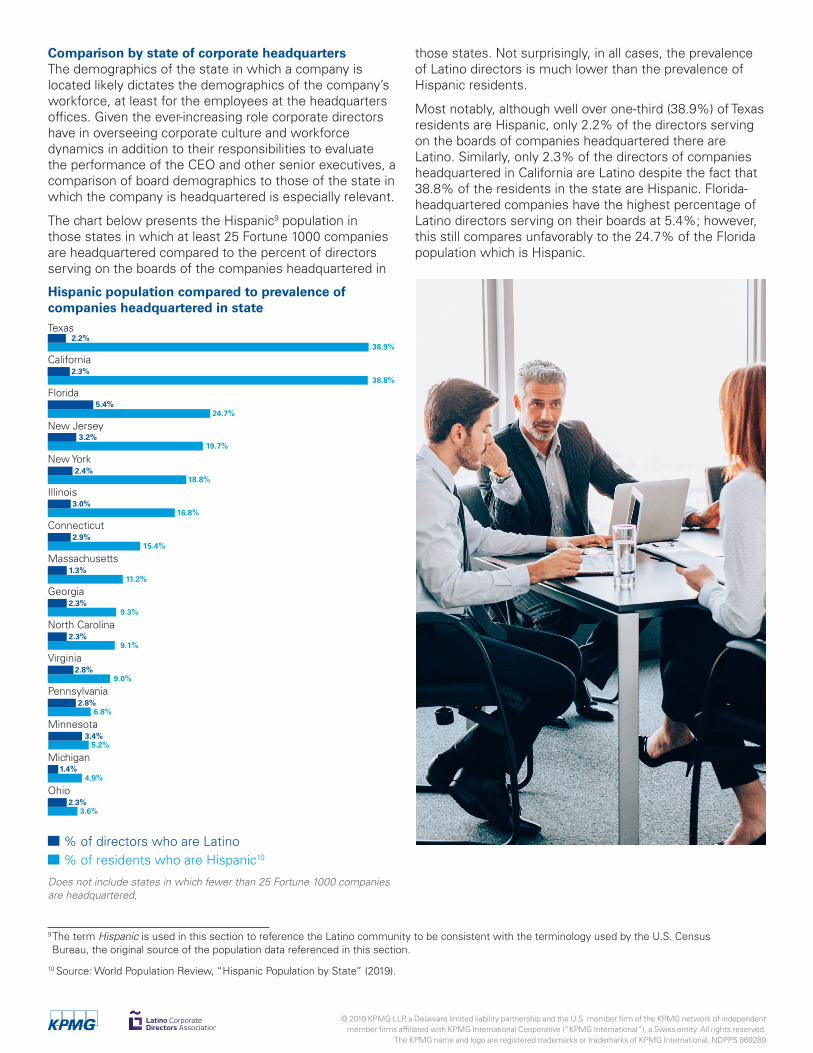
Comparison by state of corporate headquartersThe demographics of the state in which a company is located likely dictates the demographics of the company’s workforce, at least for the employees at the headquarters offices. Given the ever-increasing role corporate directors have in overseeing corporate culture and workforce dynamics in addition to their responsibilities to evaluate the performance of the CEO and other senior executives, a comparison of board demographics to those of the state in which the company is headquartered is especially relevant.
The chart below presents the Hispanic9 population in those states in which at least 25 Fortune 1000 companies are headquartered compared to the percent of directors serving on the boards of the companies headquartered in
those states. Not surprisingly, in all cases, the prevalence of Latino directors is much lower than the prevalence of Hispanic residents.
Most notably, although well over one-third (38.9%) of Texas residents are Hispanic, only 2.2% of the directors serving on the boards of companies headquartered there are Latino. Similarly, only 2.3% of the directors of companies headquartered in California are Latino despite the fact that 38.8% of the residents in the state are Hispanic. Florida-headquartered companies have the highest percentage of Latino directors serving on their boards at 5.4%; however, this still compares unfavorably to the 24.7% of the Florida population which is Hispanic.
9 The term Hispanic is used in this section to reference the Latino community to be consistent with the terminology used by the U.S. Census Bureau, the original source of the population data referenced in this section.
10 Source: World Population Review, “Hispanic Population by State” (2019).
Texas
38.9%
38.8%
24.7%
19.7%
18.8%
16.8%
15.4%
11.2%
9.0%
6.8%
5.2%
4.9%
3.6%
0% 5% 10% 15% 20% 25% 30% 35% 40%
2.2%
2.3%
5.4%
3.2%
2.4%
3.0%
California
Florida
New Jersey
New York
Illinois
Connecticut
Massachusetts
Virginia
Pennsylvania
Minnesota
Michigan
Ohio
2.9%
1.3%
9.1%
North Carolina2.3%
9.3%
Georgia2.3%
2.8%
2.8%
3.4%
1.4%
2.3%
Does not include states in which fewer than 25 Fortune 1000 companies are headquartered,
% of directors who are Latino% of residents who are Hispanic10
Hispanic population compared to prevalence of companies headquartered in state
© 2019 KPMG LLP, a Delaware limited liability partnership and the U.S. member firm of the KPMG network of independent member firms affiliated with KPMG International Cooperative (“KPMG International”), a Swiss entity. All rights reserved.
The KPMG name and logo are registered trademarks or trademarks of KPMG International. NDPPS 869289

Among those states in which at least 25 Fortune 1000 companies are headquartered, Massachusetts and Michigan have the lowest percentages of companies (12.5% and 14.3%, respectively) with at least one Latino corporate director. Texas and California—both states with a high percentage of Hispanic residents, as noted previously—have the third and fourth lowest prevalence of companies with Latinos in the boardroom, at 17.0% and 21.2%, respectively. The state with the highest percentage of companies with Latino directors is Connecticut, where nearly one-third (29.6%) of the companies headquartered in the state have at least one Latino director.
MethodologyThe KPMG Board Leadership Center prepared the analyses presented in this report using data provided by the Latino Corporate Directors Association (LCDA). LCDA compiled this data by identifying individuals who reside in the US and self-identify as Latino and who served on the boards of companies on the 2018 Fortune 1000 list as of July 31, 2019.
Connecticut (n=27)29.6%
Virginia (n=38)28.9%
Florida (n=35)28.6%
28.0%
27.3%
27.1%
26.2%
23.7%
23.3%
23.1%
22.8%
21.2%
17.0%
14.3%
12.5%
Minnesota (n=25)
New Jersey (n=33)
Illinois (n=70)
Pennsylvania (n=42)
New York (n=93)
Georgia (n=30)
North Carolina (n=26)
Ohio (n=57)
California (n=118)
Texas (n=94)
Michigan (n=28)
Massachusetts (n=32)
7Latino Representation on Fortune 1000 Boards
Percent of companies headquartered in state which have at least one Latino director
Does not include states in which fewer than 25 Fortune 1000 companies are headquartered.
© 2019 KPMG LLP, a Delaware limited liability partnership and the U.S. member firm of the KPMG network of independent member firms affiliated with KPMG International Cooperative (“KPMG International”), a Swiss entity. All rights reserved. The KPMG name and logo are registered trademarks or trademarks of KPMG International. NDPPS 869289

kpmg.com/socialmedia
Some or all of the services described herein may not be permissible for KPMG audit clients and their affiliates or related entities.
© 2019 KPMG LLP, a Delaware limited liability partnership and the U.S. member firm of the KPMG network of independent member firms affiliated with KPMG International Cooperative (“KPMG International”), a Swiss entity. All rights reserved. The KPMG name and logo are registered trademarks or trademarks of KPMG International. NDPPS 869289