Embed Size (px)
Citation preview
Latino Business Ownership: Contributions and Barriers for
U.S.-born and Immigrant LatinoEntrepreneurs
by Robert W. Fairlie, Ph.D.
Economic Consulting Santa Cruz, CA 95060
for Office of Advocacy
U.S. Small Business Administration under contract number SBAHQ-16-Q-0061
Release Date: January 2018
This report was developed under a contract with the Small Business Administration, Office of Advocacy, and contains information and analysis that were reviewed by officials of the Office of Advocacy. However, the final conclusions of the report do not necessarily reflect the views of the Office of Advocacy.
2
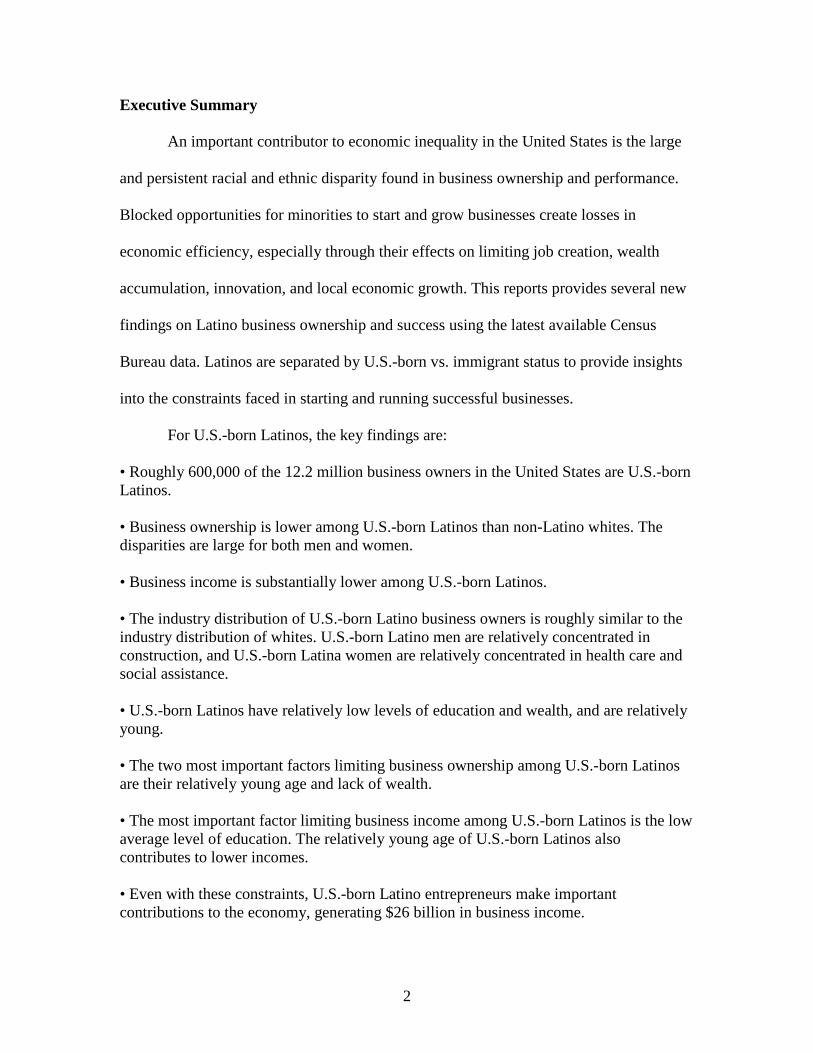
Executive Summary An important contributor to economic inequality in the United States is the large
and persistent racial and ethnic disparity found in business ownership and performance.
Blocked opportunities for minorities to start and grow businesses create losses in
economic efficiency, especially through their effects on limiting job creation, wealth
accumulation, innovation, and local economic growth. This reports provides several new
findings on Latino business ownership and success using the latest available Census
Bureau data. Latinos are separated by U.S.-born vs. immigrant status to provide insights
into the constraints faced in starting and running successful businesses.
For U.S.-born Latinos, the key findings are:
• Roughly 600,000 of the 12.2 million business owners in the United States are U.S.-born Latinos. • Business ownership is lower among U.S.-born Latinos than non-Latino whites. The disparities are large for both men and women. • Business income is substantially lower among U.S.-born Latinos. • The industry distribution of U.S.-born Latino business owners is roughly similar to the industry distribution of whites. U.S.-born Latino men are relatively concentrated in construction, and U.S.-born Latina women are relatively concentrated in health care and social assistance. • U.S.-born Latinos have relatively low levels of education and wealth, and are relatively young. • The two most important factors limiting business ownership among U.S.-born Latinos are their relatively young age and lack of wealth. • The most important factor limiting business income among U.S.-born Latinos is the low average level of education. The relatively young age of U.S.-born Latinos also contributes to lower incomes. • Even with these constraints, U.S.-born Latino entrepreneurs make important contributions to the economy, generating $26 billion in business income.
3
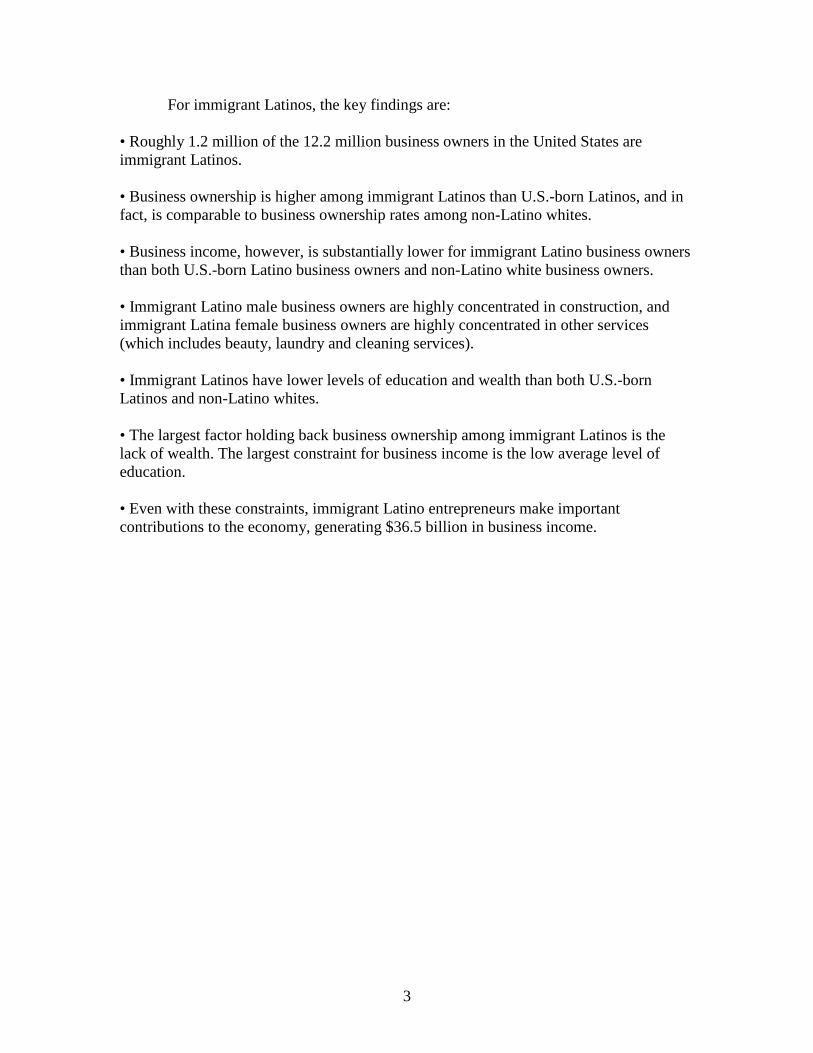
For immigrant Latinos, the key findings are:
• Roughly 1.2 million of the 12.2 million business owners in the United States are immigrant Latinos. • Business ownership is higher among immigrant Latinos than U.S.-born Latinos, and in fact, is comparable to business ownership rates among non-Latino whites. • Business income, however, is substantially lower for immigrant Latino business owners than both U.S.-born Latino business owners and non-Latino white business owners. • Immigrant Latino male business owners are highly concentrated in construction, and immigrant Latina female business owners are highly concentrated in other services (which includes beauty, laundry and cleaning services). • Immigrant Latinos have lower levels of education and wealth than both U.S.-born Latinos and non-Latino whites. • The largest factor holding back business ownership among immigrant Latinos is the lack of wealth. The largest constraint for business income is the low average level of education. • Even with these constraints, immigrant Latino entrepreneurs make important contributions to the economy, generating $36.5 billion in business income.
4
Contents List of Tables .......................................................................................................................5
1. Introduction ......................................................................................................................6
2. Literature Review.............................................................................................................9
Wealth Differences ..................................................................................................9 Financial Capital ....................................................................................................11 Evidence of Lending Discrimination .....................................................................15 Other Discriminatory Barriers ...............................................................................17 Human Capital Barriers .........................................................................................18 Family Business Background and Social Capital ..................................................20
3. Data ................................................................................................................................23
Where Do Latino Immigrants Come from? ...........................................................25
4. Business Ownership and Income ...................................................................................26 Patterns among Latino Men and Latina Women ...................................................30 Industry Distributions of Business Owners ...........................................................32
5. Contributions of Latino Business Owners to the U.S. Economy ...................................36
6. Explanations for Differences in Business Ownership Rates and Income ......................39
Differences in Education, Wealth and Other Characteristics ................................39 Decomposition Technique .....................................................................................43 Decomposition Results for Business Ownership ...................................................46 Decomposition Results for Business Income ........................................................50
7. Discussion and Conclusions ..........................................................................................53
References ..........................................................................................................................57
5
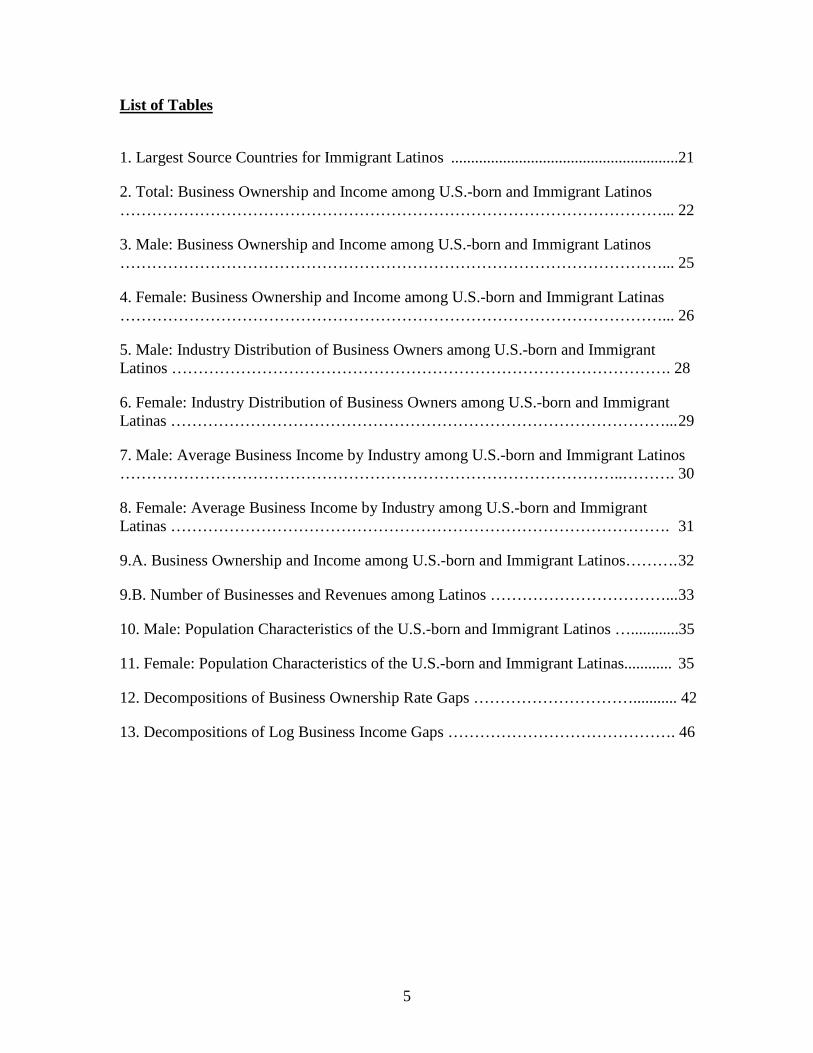
List of Tables
1. Largest Source Countries for Immigrant Latinos .........................................................21
2. Total: Business Ownership and Income among U.S.-born and Immigrant Latinos …………………………………………………………………………………………... 22
3. Male: Business Ownership and Income among U.S.-born and Immigrant Latinos …………………………………………………………………………………………... 25
4. Female: Business Ownership and Income among U.S.-born and Immigrant Latinas …………………………………………………………………………………………... 26
5. Male: Industry Distribution of Business Owners among U.S.-born and Immigrant Latinos …………………………………………………………………………………. 28
6. Female: Industry Distribution of Business Owners among U.S.-born and Immigrant Latinas …………………………………………………………………………………... 29
7. Male: Average Business Income by Industry among U.S.-born and Immigrant Latinos …………………………………………………………………………………..………. 30
8. Female: Average Business Income by Industry among U.S.-born and Immigrant Latinas …………………………………………………………………………………. 31
9.A. Business Ownership and Income among U.S.-born and Immigrant Latinos………. 32
9.B. Number of Businesses and Revenues among Latinos ……………………………... 33
10. Male: Population Characteristics of the U.S.-born and Immigrant Latinos …............35
11. Female: Population Characteristics of the U.S.-born and Immigrant Latinas............ 35
12. Decompositions of Business Ownership Rate Gaps …………………………........... 42
13. Decompositions of Log Business Income Gaps ……………………………………. 46
6
1. Introduction Large and persistent racial disparities in business ownership and performance
exist in the United States. These disparities are alarming because of their magnitude and
the importance of business ownership as a way to make a living for many Americans.
Roughly 1 in 10 workers, or 12 million people, in the United States are self-employed
business owners. These 12 million business owners hold roughly 40 percent of total U.S.
wealth (Bucks, Kennickell, and Moore 2006). Yet only 7 percent of Latinos own
businesses compared with more than 11 percent of non-Latino whites. Similarly troubling
is that Latino-owned businesses tend to have lower average sales and hire fewer
employees than white-owned businesses, and the disparities have widened over the past
couple of decades (Fairlie and Robb 2008; U.S. Census Bureau 2015; McManus 2016
Davila and Mora 2013).
Improving success among minority business owners in the United States is a
major concern among policymakers. Although they are sometimes controversial, a
variety of federal, state, and local government programs offer contracting goals, price
discounts, and loans to businesses owned by minorities, women, and other disadvantaged
groups (Boston 1999, Chatterji, Chay and Fairlie 2014, and Joint Center for Political and
Economic Studies 1994). One of the goals of these programs is to foster minority
business development, which may have implications for reducing earnings and wealth
inequality (Bradford 2003). Self-employed business owners earn more on average than
wage and salary workers (Borjas 1999), and disadvantaged business owners have more
upward income mobility and experience faster earnings growth than disadvantaged wage
and salary workers (Holtz-Eakin, Rosen and Weathers 2000, Fairlie 2004). It has also
7
been argued that some disadvantaged groups historically facing discrimination or blocked
opportunities in the wage/salary sector, such as Chinese, Greek, Italian, Japanese, and
Jewish have used business ownership as a source of economic advancement.1
Another concern, which is often overlooked, is the loss in economic efficiency
resulting from blocked opportunities for minorities to start and grow businesses.2
Business formation has been associated with the creation of new industries, innovation,
job creation, improvement in sector productivity, and economic growth (Reynolds 2005).
If minority entrepreneurs face liquidity constraints, discrimination or other barriers to
creating new business or expanding current businesses, there will be efficiency losses in
the economy. Although it would be difficult to determine the value of these losses,
barriers to entry and expansion that minority-owned businesses face are potentially costly
to U.S. productivity, especially as minorities represent an increasing share of the total
population. Barriers to business growth may be especially damaging for job creation in
low-income neighborhoods (Boston 1999, 2006).
In this report, I use the latest available microdata from the U.S. Census Bureau to
explore why Latino business ownership and income are relatively low. The report
provides a comparison of the experiences of U.S.-born Latinos and immigrant Latinos
shedding new light on the barriers faced by Latino Americans to successful business
ownership. Because levels of business ownership and income are so different between
men and women, they are also examined separately.
1 See Glazer and Moynihan (1970), Loewen (1971), Light (1972, 1979), Baron et al. (1975), Bonacich and Modell (1980), and Sowell (1981). 2 Hsieh et al. (2016) find that falling occupational barriers for minority workers may explain one fourth of aggregate growth in per-capita GDP from 1960 to 2010.
8
I examine potential barriers created by human capital, wealth, demographic,
geographic, and industry constraints. The analysis estimates the contribution of each
barrier simultaneously to identify independent effects. This is important because many of
these factors (e.g. education, wealth, age, geography) are correlated with each other, and
thus a separate analysis could be misleading. I also focus on the current barriers faced by
Latinos and do not examine trends over time.3
Several key questions are addressed in the analysis:
• What contributions do Latinos make to business ownership in the economy? • What contributions do Latino business owners make to total U.S. business income? • What are the separate contributions to business ownership and income from U.S.-born and immigrant Latinos? • Do U.S.-born Latinos have different business ownership rates and income than non-minorities (defined here as non-Latino whites)? • Do immigrant Latinos experience similar disparities in business ownership and income? • What are the barriers faced by U.S.-born Latinos in successful business ownership? • Are the barriers for immigrant Latinos similar?
These barriers limit the potential for Latino business ownership and success. This
is an important concern with the high levels of racial and ethnic inequality existing today.
Substantial inequality continues to exist in the United States and does not appear to be
going away in the near future (Stanford Center on Poverty and Inequality 2017).
3 For a comprehensive analysis of trends over time in Latino entrepreneurship in the 2000s see Davila and Mora (2013).
9
2. Literature Review A growing literature examines the potential barriers limiting business ownership
and performance among minorities. This section provides only a partial review of this
expansive literature focusing on several broad categories of potential constraints.4 Not all
constraints discussed here can be tested in the empirical section because of data
limitations. Although there are many more constraints I focus here on wealth disparities,
access to financial capital, discrimination in lending, other types of discrimination,
human capital, family business background, social capital, and access to technology.
Many previous studies focus on constraints particular to African-American entrepreneurs
with fewer studies focusing on constraints faced by Latino entrepreneurs.
Wealth Differences
The importance of personal wealth as a determinant of entrepreneurship has been
the focus of an extensive body of literature. Most studies find that asset levels (e.g. net
worth) measured in one year increase the probability of starting a business by the
following year.5 The finding has generally been interpreted as providing evidence that
entrepreneurs face liquidity constraints. This is also consistent with observations that
owner's wealth can be invested directly in the business or used as collateral to obtain
business loans. Furthermore, investors frequently require a substantial level of owner's
investment of his/her own capital as an incentive (i.e. "skin in the game").
4 For additional sources on minority and Latino entrepreneurship see, for example, Fairlie and Robb (2008); Bates (2011); Davila and Mora (2013); Stanford Latino Entrepreneurship Initiative (2015). 5 For example, see Evans and Jovanovic (1989), Evans and Leighton (1989), Meyer (1990), Holtz-Eakin, Joulfaian, and Rosen (1994), Blanchflower and Oswald (1998), Dunn and Holtz-Eakin (2000), Fairlie (1999), Holtz-Eakin and Rosen (2005), Elitcha and Fonseca (2016), and Fairlie and Krashinsky (2012).
10
Do inequalities in personal wealth then translate into disparities in business
creation and ownership? Wealth inequality is alarming high. Half of all black families
have less than $9,211 in wealth, and half of all Latino families have less than $12,460.
Wealth levels among whites are 11 to 14 times higher (U.S. Census Bureau 2017).
Racial differences in home equity may be especially important in providing access to
startup capital. Only 42 percent of blacks and 45 percent of Latinos own their own home
compared with 72 percent of whites (US. Census Bureau 2017). Furthermore, for both
blacks and whites who own homes, the median equity in their homes is much lower than
for whites. Homes provide collateral and home equity loans provide relatively low-cost
financing. Without being able to tap into this equity many minorities will not be able to
start businesses (Fairlie and Robb 2008).
These findings from the previous literature suggest that relatively low levels of
wealth among blacks and Latinos and the existence of liquidity constraints may create a
substantial barrier to entry for minority entrepreneurs. Indeed, a few previous studies
provide direct evidence supporting this hypothesis. Using matched CPS Annual
Demographic Files (ADF) data from 1998 to 2003, Fairlie (2006) finds that the largest
single factor explaining racial disparities in business creation rates are differences in asset
levels. Lower levels of assets among blacks account for 15.5 percent of the difference
between the rates of business creation among whites and blacks. This finding is
consistent with the presence of liquidity constraints and low levels of assets limiting
opportunities for blacks to start businesses. The finding is very similar to earlier
estimates reported in Fairlie (1999) for men using the Panel Study of Income Dynamics
11
(PSID). Estimates from the PSID indicate that 13.9 to 15.2 percent of the black/white
gap in business start rates can be explained by differences in assets.
Fairlie and Woodruff (2010) examine the causes of low rates of business
formation among Mexican-Americans. One of the most important factors in explaining
the gaps between Mexican-Americans and non-Latino whites in rates of business creation
is also assets. Relatively low levels of assets explain roughly one quarter of the business
entry rate gap for Mexican-Americans. Lofstrom and Wang (2009) using SIPP data also
find that low levels of wealth for Mexican-Americans and other Latinos work to lower
self-employment entry rates. And more recently, Davila and Mora (2013) find barriers
faced by Hispanic entrepreneurs in gaining access to financial capital. Apparently, low
levels of personal wealth limit opportunities for Mexican-Americans and other Latinos to
start businesses.
Financial Capital
Although previous research provides evidence that is consistent with low levels of
personal wealth resulting in lower rates of business creation among minorities, very little
research has focused on the related question of whether low levels of personal wealth and
liquidity constraints also limit the ability of minority entrepreneurs to raise startup capital
resulting in undercapitalized businesses. The consequence is that these undercapitalized
businesses will likely have lower sales, profits and employment and will be more likely
to fail than businesses receiving the optimal amount of startup capital. Evidence on the
link between startup capital and owner's wealth is provided by examining the relationship
between business loans and personal commitments, such as using personal assets for
12
collateral for business liabilities and guarantees that make owners personally liable for
business debts. Using data from the SSBF and Survey of Consumer Finances (SCF),
Avery, Bostic and Samolyk (1998) find that the majority of all small business loans have
personal commitments. The common use of personal commitments to obtain business
loans suggests that wealthier entrepreneurs may be able to negotiate better credit terms
and obtain larger loans for their new businesses possibly leading to more successful
firms.6 Cavalluzzo and Wolken (2005) find that personal wealth, primarily through home
ownership, decreases the probability of loan denials among existing business owners. If
personal wealth is important for existing business owners in acquiring business loans then
it may be even more important for entrepreneurs in acquiring startup loans.
Estimates from Survey of Business Owners (SBO) and earlier Characteristics of
Business Owners (CBO) data indicate that black and Latino-owned businesses have very
low levels of startup capital relative to white-owned businesses (U.S. Census Bureau
1997, 2016; Fairlie and Robb 2008). Estimates from the 2012 SBO indicate that 2.2
percent of black firms start with $100,000 or more of capital compared with 8.5 percent
of white, non-Hispanic firms. Only 3.5 percent of Latino firms start with $100,000 or
more in capital. Even after imposing minimum work hours for business owners in the
1992 CBO microdata, Fairlie and Robb (2008) find large racial differences. For example,
they find that less than 2 percent of black firms start with $100,000 or more of capital and
6.5 percent have between $25,000 and $100,000 in startup capital. Black-owned firms are
also found to have lower levels of startup capital across all major industries. Davila and
6 Astebro and Berhardt (2003) finds a positive relationship between business survival and having a bank loan at startup after controlling for owner and business characteristics.
13
Mora (2013) present evidence from the 2007 SBO showing lower levels of startup capital
among Latino businesses than non-Latino businesses.
Focusing on startups, Fairlie, Robb and Robinson (2016) find that black-owned
businesses start with less financial capital and continue to invest less in the early years of
existence. The total funding gap then not only perpetuates, but gets worse over time.
They also find that black startups obtain less funding from all major sources than white
startups.
What are the consequences of these racial disparities in startup capital? Previous
research indicates that the level of startup capital is a strong predictor of business success
(see for example Bates 1997 and Fairlie and Robb 2008). In turn, low levels of startup
capital are found to be a major cause of worse outcomes among black-owned businesses.
Using earlier CBO data, Bates (1997) finds evidence that racial differences in business
outcomes are associated with disparities in startup capital. More recent estimates indicate
that lower levels of startup capital among black firms are the most important explanation
for why black-owned businesses have lower survivor rates, profits, employment and sales
than white-owned businesses (Fairlie and Robb 2008). They also find the opposite holds
for Asian firms: Asian firms have higher startup capital levels and better business
outcomes.
Minority and non-minority entrepreneurs differ in the types of financing they use
for their businesses. Previous research indicates, for example, that black entrepreneurs
rely less on banks than whites for startup capital. Only 6.6 percent of black firms
received business loans from banking or commercial lending institutions (U.S. Census
Bureau 1997). Nearly twice that percentage of white firms received bank loans for
14
startup capital. Blacks are also less likely to use a home equity line for startup capital
than are whites, which may be partly due to the lower rates of home ownership reported
above. On the other hand, black business owners are more likely to rely on credit cards
for startup funds than are white business owners. In a few studies using the 1987 CBO,
Bates (1997, 2005) finds that black firms are found to be more likely to start with no
capital, less likely to borrow startup capital and more likely to rely solely on equity
capital than white firms. Bates (2005) also finds that loans received by black firms
borrowing startup capital are significantly smaller than those received by white firms
even after controlling for equity capital and owner and business characteristics such as
education and industry.
Previous research also indicates that minority-owned businesses are more likely to
use credit cards and less likely to use bank loans to start their businesses than non-
minority owned businesses (U.S. Department of Commerce 2008). Davila and Mora
(2013) find using the 2002 SSBF that Latino businesses were less likely to get approved
for business loans, were more likely to not apply for loans because of fear of rejection,
have smaller loan amounts, and pay higher interest rates on loans on average.
Minority firms also have trouble securing funds from venture capitalists and angel
investors. Private equity funds targeting minority markets are very small relative to the
total, which is problematic because these funds appear to be important for success (Yago
and Pankrat 2000).7 The disparity in access does not appear to be driven by performance
differences. Bates and Bradford (2008) examine the performance of investments made
by venture capital funds specializing in minority firms and find that these funds produce
7 Minority angels comprise 3.6 percent of the all angel investors, and MBEs comprise 3.7 percent of firms presenting their business ideas to potential angel investors (Sohl 2008).
15
large returns. Venture capital funds focusing on investing in minority firms provide
returns that are comparable to mainstream venture capital firms. Funds investing in
minority businesses may provide attractive returns because the market is underserved.
Evidence of Lending Discrimination
A factor that may pose a barrier to obtaining financial capital for minority-owned
businesses is lending discrimination. Much of the recent research on the issue of
discrimination in business lending uses data from various years of the Survey of Small
Business Finances (SSBF). The main finding from this literature is that Minority
Business Enterprises (MBE) experience higher loan denial probabilities and pay higher
interest rates than white-owned businesses even after controlling for differences in credit-
worthiness, and other factors (Blanchard, Yinger and Zhao 2008; Blanchflower, Levine
and Zimmerman 2003; Cavalluzzo, Cavalluzzo, and Wolken 2002; Cavalluzzo, and
Wolken 2005; Coleman 2002, 2003; Mitchell and Pearce 2004, 2011; Bates and Robb
2016).
Cavalluzzo and Wolken (2005) found that while greater personal wealth is
associated with a lower probability of denial, even after controlling for personal wealth,
there remained a large difference in denial rates across demographic groups. They also
found that denial rates for blacks increased with lender market concentration, a finding
consistent with Becker's (1957) classic theories of discrimination. Using the 1993
National Survey of Small Business Finances (NSSBF), Cavalluzzo, Cavalluzzo, and
Wolken (2002) found that all minority groups were more likely than whites to have
unmet credit needs. Blacks were more likely to have been denied credit, even after
16
controlling for many factors related to creditworthiness. In fact, denial rates and unmet
credit needs for blacks widened with an increase in lender market concentration. The
concern of denial or "giving up" often prevented some individuals from applying for a
loan, even when they had credit needs. Blacks and Hispanics most notably had these
fears. Bostic and Lampani (1999) include additional geographic controls and continue to
find a statistically significant difference in approval rates between blacks and whites.
Blanchflower, Levine, and Zimmerman (2003) conducted a similar analysis with
similar results. They found that minority-owned businesses were more likely to have a
loan application denied, even after controlling for differences in creditworthiness, and
that blacks paid a higher interest rate on loans obtained. They also found that concerns
over whether a loan application would be denied prevented some prospective borrowers
from applying for a loan in the first place. Owners often report not applying for loans
because they feared rejection. After statistically controlling for differences in credit risks
posed by firms needing but not applying for credit, Blanchflower, Levine and
Zimmerman (2003) found gaps of 26 percentage points between blacks and whites and
15 percentage points between Latinos and whites.
More recently, Bates and Robb (2015) used data from the Kauffman Firm Survey
(KFS) over the period 2008-2011 to examine the extent of unmet credit needs and
outcomes of their applications among minority-owned businesses. Even after controlling
for credit-risk factors, black-owned firms and Latino-owned firms were more likely to be
discouraged borrowers and more likely to have their applications denied by banks than
were white-owned firms, thus confirming the findings from earlier studies.
17
Other Discriminatory Barriers
Discrimination against minority businesses may occur before these businesses are
even created. Previous research indicates that minorities have limited opportunities to
penetrate networks, such as those in construction (Bates 1993, Feagin and Imani 1994,
Bates and Howell 1997). If minorities cannot acquire valuable work experience in these
industries then it will limit their ability to start and operate successful businesses. There
is also evidence in the literature indicating consumer discrimination against minority-
owned firms. Minority firms may have difficulty selling certain products and services to
non-minority customers limiting the size of their markets and resulting success. Using
microdata from the 1980 Census, Borjas and Bronars (1989) find that African Americans
negatively select into self-employment, with the most able African Americans remaining
in the wage/salary sector, whereas whites positively select into self-employment and
negatively select into wage/salary work. These findings are consistent with
discrimination by white consumers. Kawaguchi (2005) found that among African-
Americans low earners are the most likely to enter into business ownership, whereas both
low and higher earning whites are the most likely to enter self-employment. He notes
that this finding is consistent with the theoretical predictions of consumer and credit
market discrimination against African Americans
More generally, African American-owned firms may face limited market access
for the goods and services that they produce (Bates 1997). This may be partly due to
consumer discrimination by customers, other firms and/or the government, and redlining.
But, it may also be due to the types, scale and locations of African American firms.
Published estimates from the CBO indicate that African American-owned businesses
serve smaller geographical areas than white-owned businesses on average (U.S. Census
18
Bureau 1997). African American firms are more likely than white firms to report that
their neighborhood is the geographic area that best describes where the business's goods
and services are sold. African American owners are less likely to report larger
geographical areas as markets for their goods and services. Furthermore, they are much
more likely to sell to a minority clientele than are white businesses, which may reflect
more limited market access. As expected, market access or penetration is both a cause
and consequence of success in business making it difficult to interpret racial differences
in these measures. More successful African American firms are likely to expand to larger
market areas. Although the research is much more limited on this topic for Latino-owned
businesses, they might face similar discriminatory barriers.
Human Capital Barriers
Education has also been found in the literature to be a determinant of business
ownership.8 Low levels of education obtained by blacks and Latinos are partly
responsible for their lower business ownership rates.9 Using CPS data, Fairlie (2006)
finds that 6.0 percent of the black/white gap in self-employment entry rates is explained
by racial differences in education levels. Similar estimates from the The Panel Study of
Income Dynamics are reported in Fairlie (1999). Mexican-Americans have even lower
levels of education than blacks, which translate into a limiting factor for business
creation. Estimates from the CPS indicate that education differences account for 32.8 to
37.9 percent of the entry rate gap for Mexican-Americans (Fairlie and Woodruff 2010).
8 See van der Sluis, van Praag, and Vijverberg (2005), Parker (2004) and Moutray (2007) for recent reviews of this extensive literature. 9 Minority business owners are found to be less likely to use technology which may be related to lower levels of human capital (Buckley 2002).
19
Lofstrom and Wang (2009) find that education is important in explaining differences is
business creation rates between Mexican-Americans and whites, as well as the types of
businesses entrepreneurs are likely to pursue. The high rate of business ownership by
Asians is in part due to their relatively high levels of education (Fairlie 2006).
Previous research indicates a much stronger relationship between the education
level of the owner and business performance. Businesses with highly educated owners
have higher sales, profits, survival rates, and hire more employees than businesses with
less-educated owners (Bates 1997, Buckley 2002, Astebro and Berhardt 2003, van der
Sluis, van Praag, and Vijverberg 2004). The general and specific knowledge and skills
acquired through formal education may be useful for running a successful business and
the owner's level of education may also serve as a proxy for his/her overall ability or as a
positive signal to potential customers, lenders or other businesses.
Although blacks have made substantial gains in education, racial disparities
remain among business owners. Roughly one-third of white business owners are college
educated whereas only one quarter of black business owners have the same level of
education. These lower levels of education among black business owners translate into
disparities in business performance (Fairlie and Robb 2008).
Relatively low levels of education contribute even more to why Latino businesses
are less successful. Fairlie and Woodruff (2010) find that Mexican-American business
owners have lower incomes than non-Latino white business owners, and that most of the
difference is due to low levels of education among Mexican-American owners. Mexican-
American business owners, especially immigrants, have substantially lower levels of
education. The single largest factor in explaining why Mexican immigrants and U.S.-born
20
Mexican-Americans have lower business income than whites is education. Lower levels
of education account for more than half of the gaps in business income.
Another measure of human capital relevant for Latinos is language ability.
Limited English language ability may make it difficult to communicate with potential
customers and suppliers, and learn about regulations. Indeed, Fairlie and Woodruff
(2010) find that one of the most important factors explaining low business incomes
among Mexican-American businesses is language ability. For Mexican immigrant men,
limited ability speaking English explains roughly one third of the gap in business income.
Davila and Mora (2013) find that having a college education is important for the
success of businesses, and that his holds for Latino businesses and non-Latino businesses.
Given that Latino business owners are found to have lower levels of education it
represents a limiting factor for the success of Latino businesses relative to non-Latino
businesses.
Family Business Background and Social Capital
Research also indicates that the probability of self-employment is substantially
higher among the children of the self-employed (see Lentz and Laband 1990, Fairlie
1999, Dunn and Holtz-Eakin 2000, and Hout and Rosen 2000). These studies generally
find that an individual who had a self-employed parent is roughly two to three times as
likely to be self-employed as someone who did not have a self-employed parent. There is
evidence that this strong intergenerational link in business ownership is detrimental to
disadvantaged minorities. Hout and Rosen (2000) note a "triple disadvantage" faced by
black men in terms of business ownership. They are less likely than white men to have

21
self-employed fathers, to become self-employed if their fathers were not self-employed,
and to follow their father in self-employment. Fairlie (1999) provides evidence from the
PSID that current racial patterns of self-employment are in part determined by racial
patterns of self-employment in the previous generation.
Recent research indicates that family business backgrounds are also extremely
important for the success of businesses (Fairlie and Robb 2007, 2008). More than half of
all business owners had a self-employed family member prior to starting their business
with many of these business owners working in those family businesses. Working in a
family business leads to more successful businesses. Business outcomes are 15 to 27
percent better if the owner worked in a family business prior to starting his or her own
business even after controlling for other factors. Black business owners have a relatively
disadvantaged family business background compared with white business owners. Black
business owners are much less likely than white business owners to have had a self-
employed family member prior to starting their businesses and are less likely to have
worked in that family member's business. Only 12.6 percent of black business owners
had prior work experience in a family member's business compared with 23.3 percent of
white business owners. This lack of prior work experience in family businesses among
future black business owners, perhaps by restricting their acquisition of general and
specific business human capital, limits the successfulness of their businesses relative to
whites. This creates a cycle of low rates of business ownership and relatively worse
business outcomes being passed from one generation of blacks to the next (Fairlie and
Robb 2008).
22
In contrast, Robles (2012) notes the importance of family involvement among
Latina-owned businesses. Survey results from the 2000 National Foundation for
Women Business Owners indicate that three-fourths of Latinas report that family
members help run their businesses, which was higher than for white women and
substantially higher than for African-American women. Robles (2012) notes that family
support for Latina entrepreneurs includes financial, managerial, growth and other general
business advice.
Related to the family business background constraint, previous research also
indicates that the size and composition of social networks are associated with self-
employment (see Allen 2000 for example). If minority firms have limited access to
business, social or family networks or have smaller networks then they may be less likely
to enter business and create successful businesses. These networks may be especially
important in providing financing, customers, technical assistance, role models, and
contracts, but it is difficult to identify their contributions to racial differences in business
performance. Limited networks manifest themselves in many of the factors listed below
such as financial capital, discrimination, and human capital. For example, minority
businesses are known to have limited networks in the investment community resulting in
lower levels of capital use (MBDA 2004). Given these interactions and the inherent
difficult of measuring networks, it is difficult to identify their effects of business
performance.
There is also evidence on whether the Digital Divide (i.e., disparities in access to
technology such as computers and the Internet) represents a barrier to minority business
success. Previous research using earlier data indicated that personal computers were
23
important for starting businesses especially among female entrepreneurs (Fairlie 2006).
More recently, Davila and Mora (2013) find that there is a digital divide between Latino
businesses and non-Latino businesses in terms of technology use in the 2007 SBO, but do
not find evidence of a digital divide in 2004-5 from the SSBF.
3. Data
The dataset that will be used in the proposed study is the latest five-year sample
of the American Community Survey (ACS), 2011-15. The ACS is a household survey
and provides information on business ownership, income, and industries at the owner
level. The ACS also provides information on immigration status. The ACS is one of the
only nationally representative Census Bureau dataset that provides a large sample size of
Latino business owners delineating by immigrant status and gender.10
The ACS includes over 9million observations for working-age adults (ages 20-
64). Even after conditioning on business ownership, the sample size is very large,
allowing one to explore the causes of differences in net business income. The ACS
includes more than half a million observations for business owners. The ACS is also
large enough to examine industrial concentrations for U.S.-born and immigrant Latino
business owners by gender.
In the ACS microdata, business ownership is measured by using the class-of-
worker question that refers to the respondent's main job or business activity (i.e., activity
with the most hours) at the time of the interview. Business owners are individuals who
report that they are 1) "self-employed in own not incorporated business, professional
10 The 2012 SBO microdata also has a large sample of Latino immigrant businesses, but there is a high rate of missing information on the immigrant variable among Latino businesses.
24
practice, or farm," or 2) "self-employed in own incorporated business, professional
practice, or farm." This definition includes owners of all types of businesses—
incorporated, unincorporated, employer, and non-employer firms. The samples used in
this analysis include all business owners ages 20-64 (i.e. working-age adults) who work
15 or more hours per week in their businesses. To rule out very small-scale businesses,
disguised unemployment, or casual sellers of goods and services, only business owners
with 15 or more hours worked are included.11 Fifteen hours per week is chosen as the
cutoff because it represents a reasonable amount of work effort in the business (roughly
two days per week). Note that self-employed business ownership is defined as the
individual's main job activity, thus removing the potential for counting side businesses
owned by wage-and-salary workers. Also, estimates are reported with and without the 15
hour restriction to show the robustness of disparities in business ownership rates. Finally,
the self-employment information is self-reported and not based on tax or business
registration filings, and thus may capture a wide range of self-employment activities
depending on the respondent.
Business income is calculated from survey questions about income sources. The
main question used is "Self-employment income from own nonfarm businesses or farm
businesses, including proprietorships and partnerships. Report NET income after business
expenses." Most business owners report this type of income, but incorporated business
owners report their earnings from the business as wage and salary earnings. For
simplification and consistency in treatment the responses to self-employment income and
11 Some unemployed individuals may report being self-employed if they sell a small quantity of goods or services while not working at their regular jobs.
25
wage and salary earnings are combined for all business owners. The questions refer to
annual income and capture the past 12 months.
The ACS provides the most comprehensive data available on business owners by
the race, ethnicity, immigrant status, and gender of owners.12 Immigrants are defined as
individuals who are born outside of the United States.13 Individuals born in Puerto Rico,
Guam, the U.S. Virgin Islands, Northern Marianas, or abroad of U.S. citizen parents are
defined as U.S.-born. Among individuals born in Puerto Rico (and thus considered U.S
born), 97 percent report being Latino. Three main groups are defined for comparison:
U.S.-born Latinos, immigrant Latinos, and non-Latino whites.14
Where Do Latino Immigrants Come from?
The ACS contains information on the source country of immigrants in the United
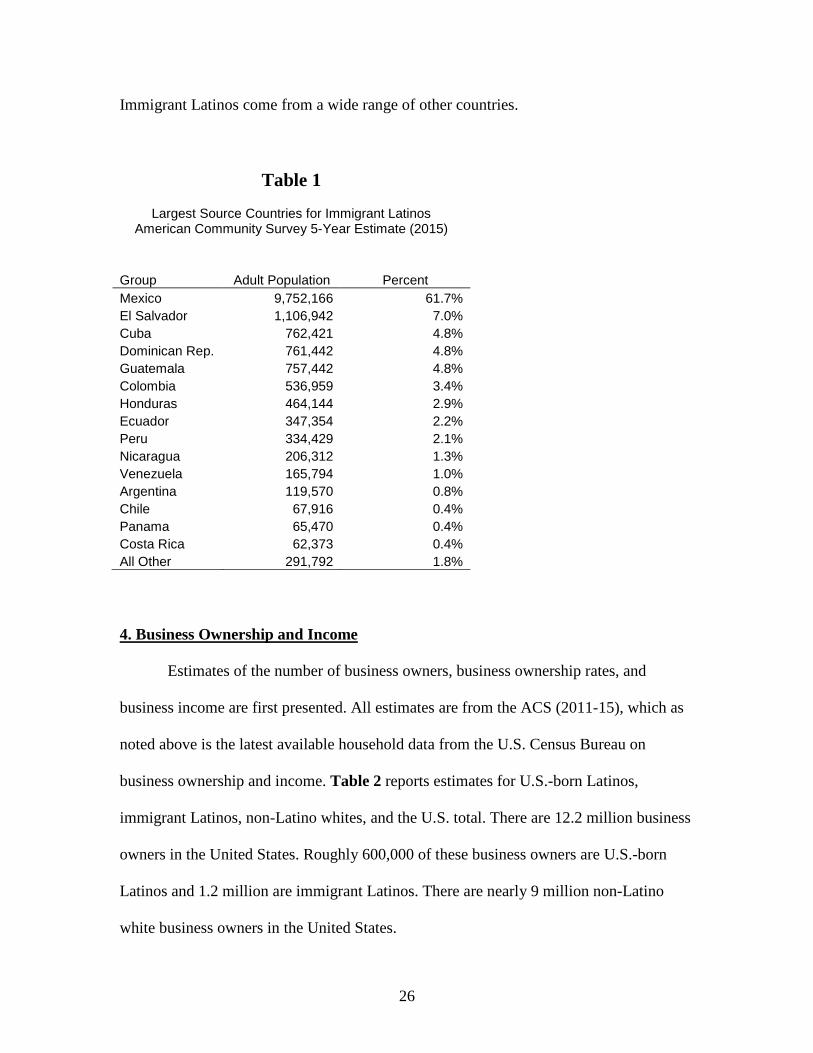
States. Latino immigrants were born in a wide range of countries. Table 1 reports the top
15 source countries for immigrant Latinos. The estimates reported here capture the stock
of immigrants currently residing in the United States and not annual immigration flows.
The largest single source country is Mexico representing 61.7 percent of the total adult
ages 20-64 immigrant Latino population. The next largest source country is El Salvador
representing 7.0 percent of the total immigrant Latino population. Cuba, Dominican
Republic and Guatemala each represent 4.8 percent of the immigrant Latino population.
12 It is assumed that undocumented immigrants are captured in the ACS. The ACS immigrant population is compared to Department of Homeland Security data to estimate the size of the undocumented population in the United States (see Hoefer, Rytina and Baker 2012 for example). 13 The ACS does not provide information on where parents are born, but there is a recent recommendation to include this information in future years (National Academies 2015). 14 U.S.-born Latinos includes second generation and higher descendants of immigrants. There is some concern, however, over the subjective measures of ethnic self-identification used in surveys such as the ACS leading to an undercount of U.S.-born Latinos. Additionally, there is evidence that the attrition leads to underestimating socioeconomic outcomes (Duncan and Trejo 2011, 2012).
26
Immigrant Latinos come from a wide range of other countries.
Table 1
Largest Source Countries for Immigrant Latinos American Community Survey 5-Year Estimate (2015)
Group Adult Population Percent Mexico 9,752,166 61.7% El Salvador 1,106,942 7.0% Cuba 762,421 4.8% Dominican Rep. 761,442 4.8% Guatemala 757,442 4.8% Colombia 536,959 3.4% Honduras 464,144 2.9% Ecuador 347,354 2.2% Peru 334,429 2.1% Nicaragua 206,312 1.3% Venezuela 165,794 1.0% Argentina 119,570 0.8% Chile 67,916 0.4% Panama 65,470 0.4% Costa Rica 62,373 0.4% All Other 291,792 1.8%
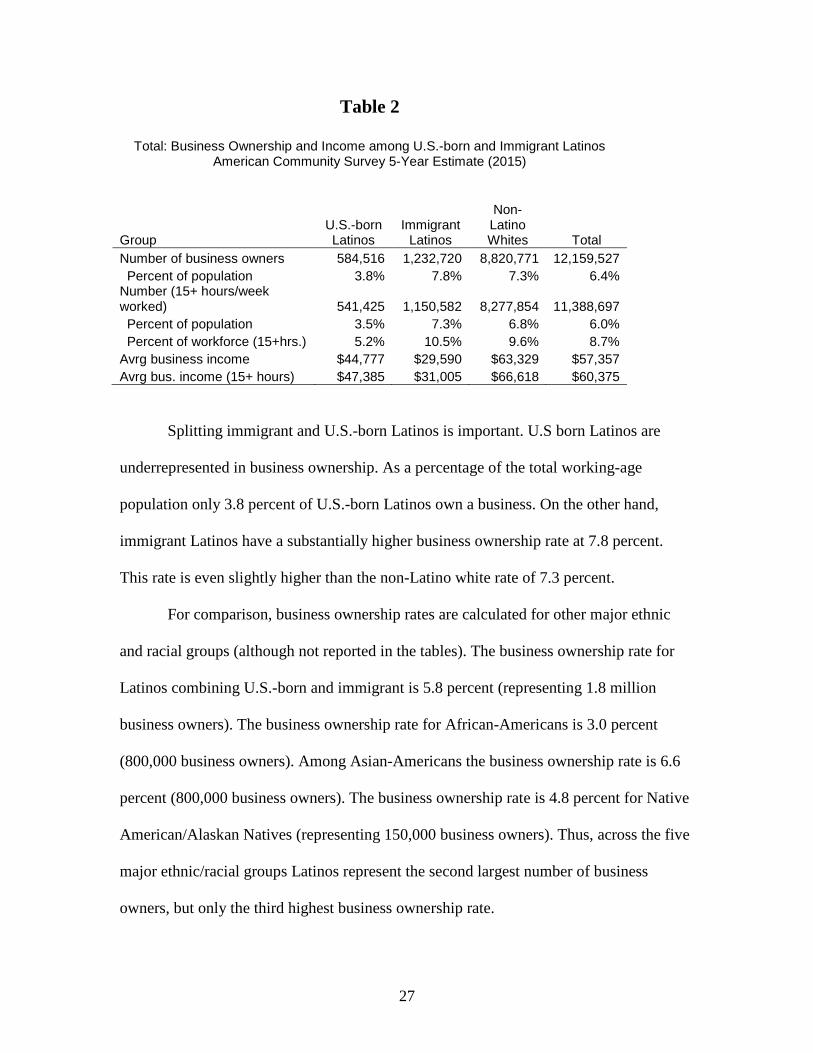
4. Business Ownership and Income Estimates of the number of business owners, business ownership rates, and
business income are first presented. All estimates are from the ACS (2011-15), which as
noted above is the latest available household data from the U.S. Census Bureau on
business ownership and income. Table 2 reports estimates for U.S.-born Latinos,
immigrant Latinos, non-Latino whites, and the U.S. total. There are 12.2 million business
owners in the United States. Roughly 600,000 of these business owners are U.S.-born
Latinos and 1.2 million are immigrant Latinos. There are nearly 9 million non-Latino
white business owners in the United States.
27
Table 2
Total: Business Ownership and Income among U.S.-born and Immigrant Latinos American Community Survey 5-Year Estimate (2015)
Non- U.S.-born Immigrant Latino
Group Latinos Latinos Whites Total Number of business owners 584,516 1,232,720 8,820,771 12,159,527 Percent of population 3.8% 7.8% 7.3% 6.4% Number (15+ hours/week worked) 541,425 1,150,582 8,277,854 11,388,697 Percent of population 3.5% 7.3% 6.8% 6.0% Percent of workforce (15+hrs.) 5.2% 10.5% 9.6% 8.7% Avrg business income $44,777 $29,590 $63,329 $57,357 Avrg bus. income (15+ hours) $47,385 $31,005 $66,618 $60,375
Splitting immigrant and U.S.-born Latinos is important. U.S born Latinos are
underrepresented in business ownership. As a percentage of the total working-age
population only 3.8 percent of U.S.-born Latinos own a business. On the other hand,
immigrant Latinos have a substantially higher business ownership rate at 7.8 percent.
This rate is even slightly higher than the non-Latino white rate of 7.3 percent.
For comparison, business ownership rates are calculated for other major ethnic
and racial groups (although not reported in the tables). The business ownership rate for
Latinos combining U.S.-born and immigrant is 5.8 percent (representing 1.8 million
business owners). The business ownership rate for African-Americans is 3.0 percent
(800,000 business owners). Among Asian-Americans the business ownership rate is 6.6
percent (800,000 business owners). The business ownership rate is 4.8 percent for Native
American/Alaskan Natives (representing 150,000 business owners). Thus, across the five
major ethnic/racial groups Latinos represent the second largest number of business
owners, but only the third highest business ownership rate.
28
Focusing on business owners with a work commitment of 15 or more hours
worked per week, the total number of business owners is lower, but not substantially
lower. There are 541,000 U.S.-born Latino business owners and 1.15 million immigrant
Latino business owners after using this restriction. The total number of business owners
in the United States that work 15+ hours per week is 11.4 million. As a percent of the
population, business ownership is lower with the hours worked restriction, but not much
lower. Business ownership rates remain lower for U.S.-born Latinos and higher for
immigrant Latinos than non-Latino whites.
Another commonly-used measure of the rate of business ownership conditions on
being in the workforce. The percent of the workforce that owns a business among U.S.-
born Latinos is 5.2 percent, and the percent of the workforce owning a business among
immigrant Latinos is 10.5 percent.15 The non-Latino white rate is 9.6 percent. The
similarity of these differences and the ranking across groups indicates that the relatively
low rates of business ownership among U.S.-born Latinos and high rates of business
ownership among immigrant Latinos are not due to higher or lower levels of
unemployment or not being in the labor force.16 Instead, the differences are driven by
lower and higher propensities to own businesses.
Among business owners a few interesting patterns emerge for business income.
Table 2 also reports estimates of business income across groups. Both Latino groups have
substantially lower levels of business income than non-Latino whites. U.S.-born Latinos
have average business income that is roughly $20,000 lower than the average business
15 Although not directly comparable from using slightly different definitions, Davila and Mora (2013) find that the self-employment rate for Hispanics increased from 7.9 percent in 2000 to 9.1 percent in 2010. 16 It is not clear how informal business activity, which is shown to be relevant (e.g. see Richardson and Pisani 2012) is captured in the ACS data, as self-employment, unemployment or some other labor force activity.
29
income among non-Latino whites. In contrast to the relatively high rates of business
ownership, immigrant Latino business owners have lower levels of business income than
U.S.-born Latinos. Among business owners working 15+ hours per week, U.S.-born
Latinos have average income of $47,385. Average business income among immigrant
Latinos is much lower at $31,005.
The finding that immigrant Latinos are much more likely to own businesses than
U.S.-born Latinos has not been well documented. One exception is that Davila and Mora
(2013) find using data from the 2007 SBO find that immigrants owned 56 percent of
Latino owned businesses. There are some concerns, however, about high rates of missing
values for immigrant status in the SBO. Additionally, the SBO does not provide data on
non-business owners making it more difficult to estimate the percentage of owners
relative to the population or workforce from the same data source. It is also not well
known that the businesses owned by immigrant Latinos are much less successful on
average than those owned by U.S.-born Latinos. Again, Davila and Mora (2013) provide
an exception in the previous literature showing that immigrant Latino-owned businesses
have lower average sales than U.S.-born Latino-owned businesses using data from the
SBO. Immigrant Latinos appear to be more likely to start smaller scale businesses that
have limited opportunities for growth (at least on average). I next explore whether the
patterns in disparities in business ownership and income by race and immigrant status are
similar when focusing on men and women separately.

30
Patterns among Latino Men and Latina Women
Tables 3 and 4 report estimates of business ownership and income for men and
women, respectively. Overall, men have higher rates of business ownership and higher
business income on average than women, but the focus here is on ethnic/racial
differences and not on gender differences. The business ownership patterns are similar to
the total for both men and women. U.S.-born Latinos are less likely to be business owners
than are immigrant Latinos. Relative to non-Latino whites, both male and female U.S.-
born Latinos are less likely to be business owners. For men, immigrant Latinos have
similar business ownership rates as white men. For women, immigrant Latinas have
higher rates of business ownership.
Table 3
Male: Business Ownership and Earnings among US Born and Immigrant Latinos American Community Survey 5-Year Estimate (2015)
Non- U.S.-born Immigrant Latino
Group Latinos Latinos Whites Total Number of business owners 367,125 767,103 5,683,362 7,720,540 Percent of population 4.8% 9.3% 9.4% 8.2% Number (15+ hours/week worked) 349,465 740,837 5,503,856 7,451,838 Percent of population 4.53% 8.97% 9.07% 7.92% Percent of workforce (15+hrs.) 6.4% 10.8% 11.9% 10.7% Avrg business income $51,719 $35,511 $75,744 $68,480 Avrg bus. income (15+ hours) $53,567 $36,264 $77,593 $70,312
31
Table 4
Female: Business Ownership and Earnings among U.S.-born and Immigrant Latinas American Community Survey 5-Year Estimate (2015)
Group U.S.-born
Latinas
Immigrant
Latinas
Non-Latino Whites Total
Number of business owners 217,391 465,617 3,137,409 4,438,987 Percent of population 2.8% 6.2% 5.2% 4.7% Number (15+ hours/week worked) 191,960 409,745 2,773,998 3,936,859 Percent of population 2.48% 5.43% 4.56% 4.1% Percent of workforce (15+hrs.) 3.9% 10.0% 6.9% 6.4% Avrg business income $33,053 $19,837 $40,838 $38,010 Avrg bus. income (15+ hours) $36,129 $21,494 $44,842 $41,567
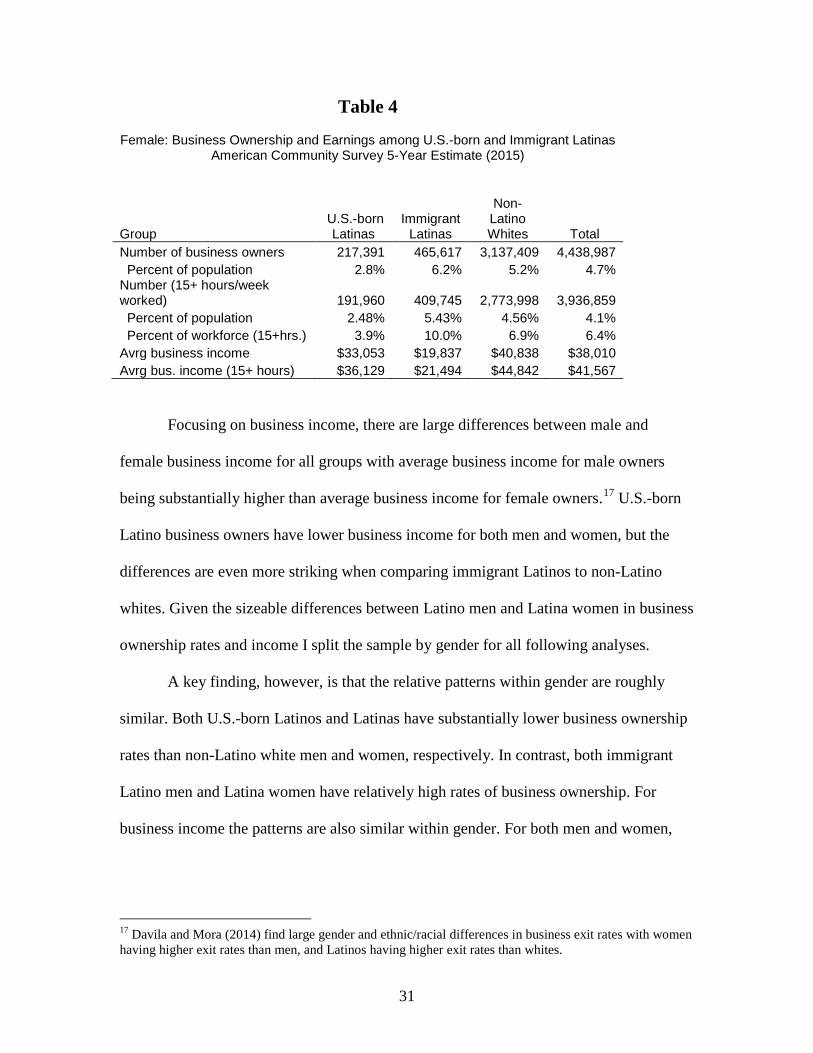
Focusing on business income, there are large differences between male and
female business income for all groups with average business income for male owners
being substantially higher than average business income for female owners.17 U.S.-born
Latino business owners have lower business income for both men and women, but the
differences are even more striking when comparing immigrant Latinos to non-Latino
whites. Given the sizeable differences between Latino men and Latina women in business
ownership rates and income I split the sample by gender for all following analyses.
A key finding, however, is that the relative patterns within gender are roughly
similar. Both U.S.-born Latinos and Latinas have substantially lower business ownership
rates than non-Latino white men and women, respectively. In contrast, both immigrant
Latino men and Latina women have relatively high rates of business ownership. For
business income the patterns are also similar within gender. For both men and women,
17 Davila and Mora (2014) find large gender and ethnic/racial differences in business exit rates with women having higher exit rates than men, and Latinos having higher exit rates than whites.
32
immigrant Latinos have very low levels of average business income and U.S.-born
Latinos have low levels of average business income relative to non-Latino whites.
Industry Distributions of Business Owners
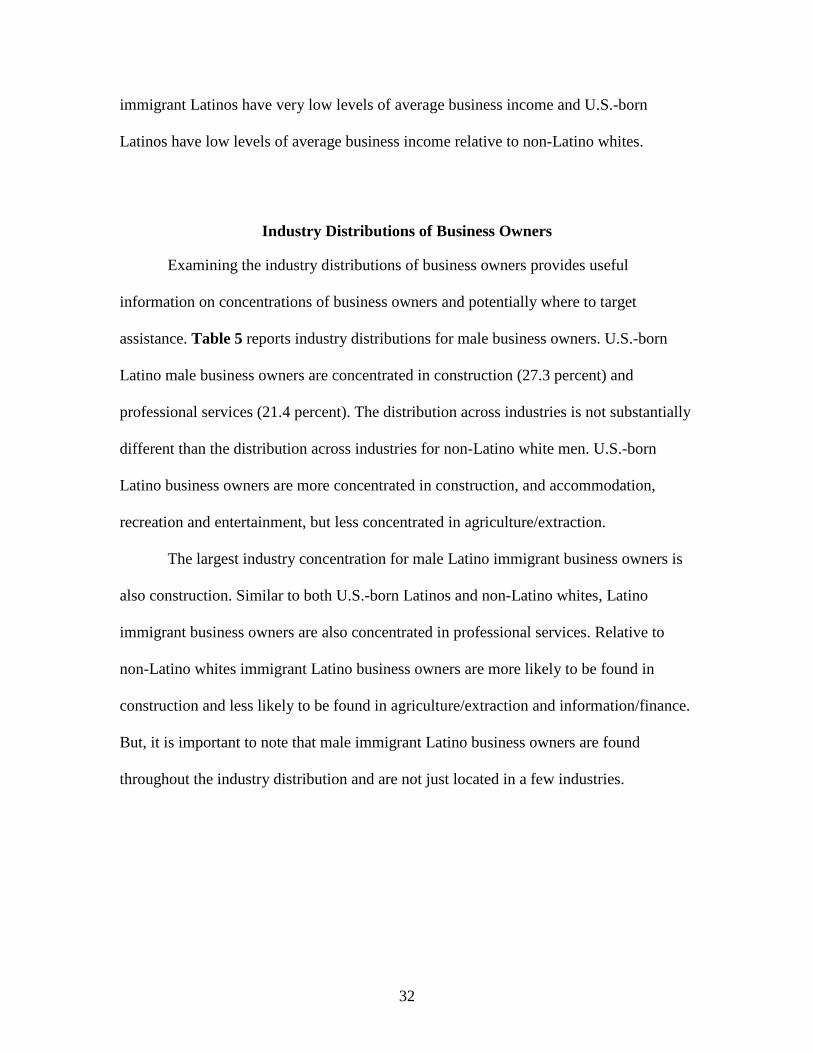
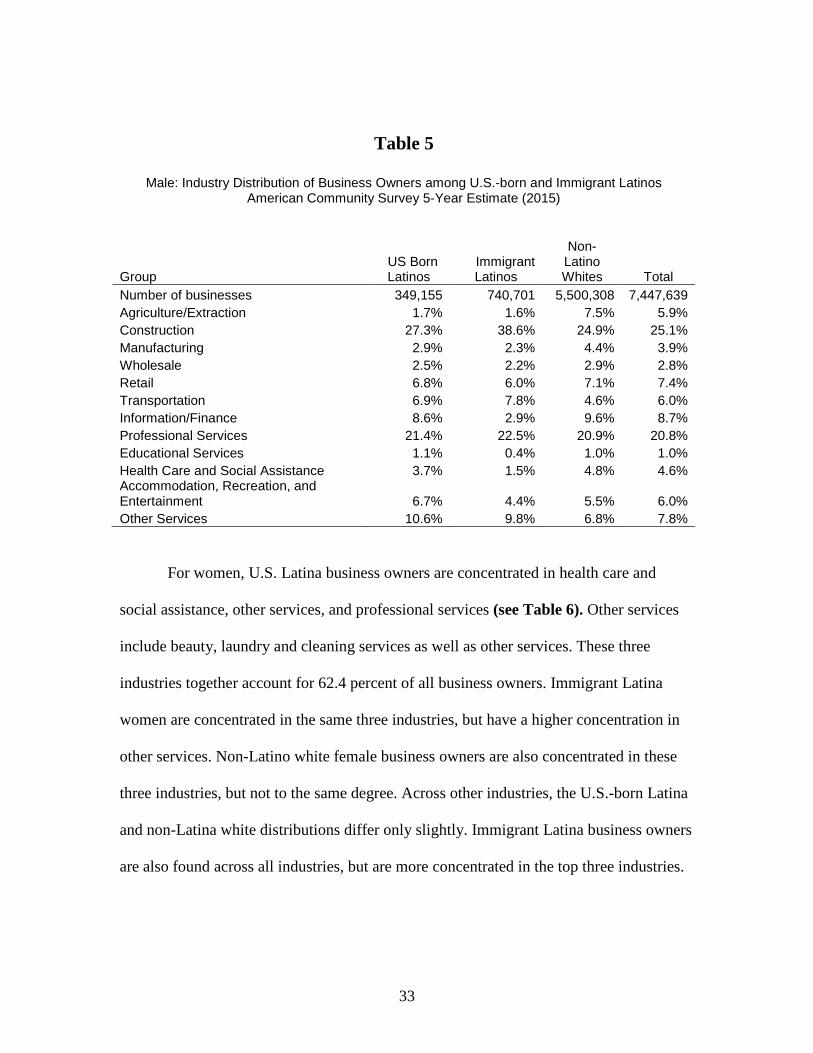
Examining the industry distributions of business owners provides useful
information on concentrations of business owners and potentially where to target
assistance. Table 5 reports industry distributions for male business owners. U.S.-born
Latino male business owners are concentrated in construction (27.3 percent) and
professional services (21.4 percent). The distribution across industries is not substantially
different than the distribution across industries for non-Latino white men. U.S.-born
Latino business owners are more concentrated in construction, and accommodation,
recreation and entertainment, but less concentrated in agriculture/extraction.
The largest industry concentration for male Latino immigrant business owners is
also construction. Similar to both U.S.-born Latinos and non-Latino whites, Latino
immigrant business owners are also concentrated in professional services. Relative to
non-Latino whites immigrant Latino business owners are more likely to be found in
construction and less likely to be found in agriculture/extraction and information/finance.
But, it is important to note that male immigrant Latino business owners are found
throughout the industry distribution and are not just located in a few industries.
33
Table 5
Male: Industry Distribution of Business Owners among U.S.-born and Immigrant Latinos American Community Survey 5-Year Estimate (2015)
Group US Born Latinos
Immigrant Latinos
Non-Latino Whites Total
Number of businesses 349,155 740,701 5,500,308 7,447,639 Agriculture/Extraction 1.7% 1.6% 7.5% 5.9% Construction 27.3% 38.6% 24.9% 25.1% Manufacturing 2.9% 2.3% 4.4% 3.9% Wholesale 2.5% 2.2% 2.9% 2.8% Retail 6.8% 6.0% 7.1% 7.4% Transportation 6.9% 7.8% 4.6% 6.0% Information/Finance 8.6% 2.9% 9.6% 8.7% Professional Services 21.4% 22.5% 20.9% 20.8% Educational Services 1.1% 0.4% 1.0% 1.0% Health Care and Social Assistance 3.7% 1.5% 4.8% 4.6% Accommodation, Recreation, and Entertainment 6.7% 4.4% 5.5% 6.0% Other Services 10.6% 9.8% 6.8% 7.8%
For women, U.S. Latina business owners are concentrated in health care and
social assistance, other services, and professional services (see Table 6). Other services
include beauty, laundry and cleaning services as well as other services. These three
industries together account for 62.4 percent of all business owners. Immigrant Latina
women are concentrated in the same three industries, but have a higher concentration in
other services. Non-Latino white female business owners are also concentrated in these
three industries, but not to the same degree. Across other industries, the U.S.-born Latina
and non-Latina white distributions differ only slightly. Immigrant Latina business owners
are also found across all industries, but are more concentrated in the top three industries.
34
Table 6
Female: Industry Distribution of Business Owners among U.S.-born and Immigrant Latinos American Community Survey 5-Year Estimate (2015)
Group US Born Latinos
Immigrant Latinos
Non-Latino Whites Total
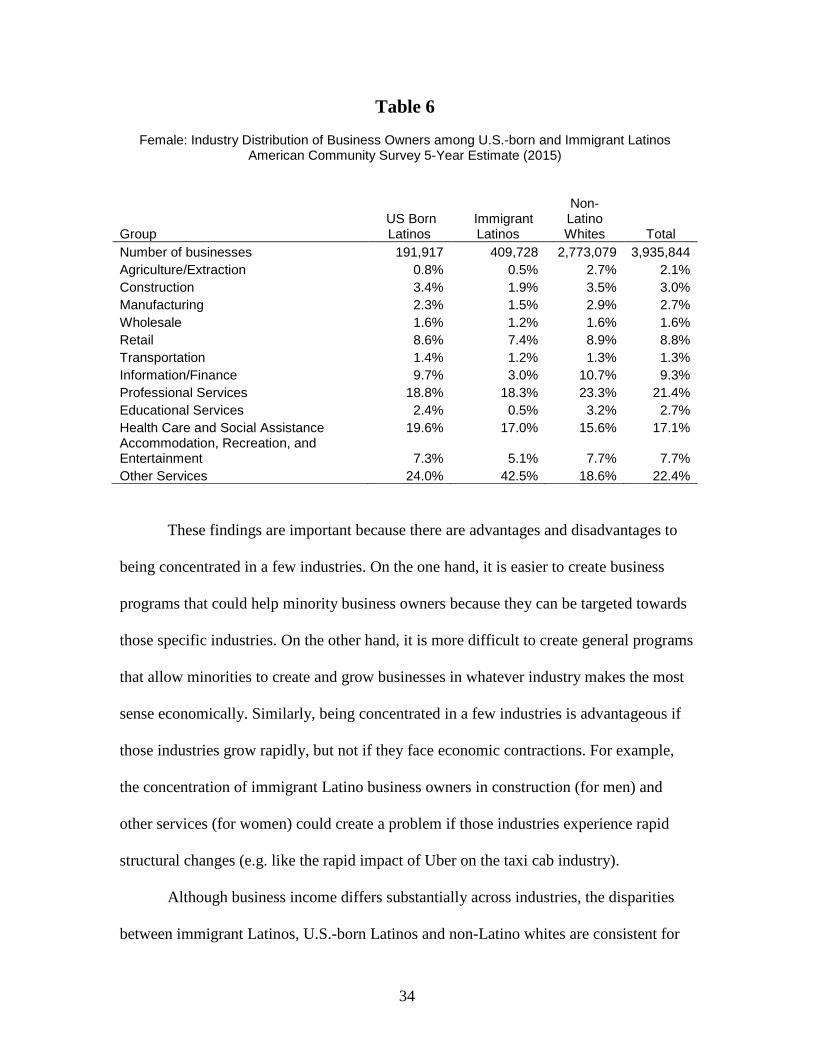
Number of businesses 191,917 409,728 2,773,079 3,935,844 Agriculture/Extraction 0.8% 0.5% 2.7% 2.1% Construction 3.4% 1.9% 3.5% 3.0% Manufacturing 2.3% 1.5% 2.9% 2.7% Wholesale 1.6% 1.2% 1.6% 1.6% Retail 8.6% 7.4% 8.9% 8.8% Transportation 1.4% 1.2% 1.3% 1.3% Information/Finance 9.7% 3.0% 10.7% 9.3% Professional Services 18.8% 18.3% 23.3% 21.4% Educational Services 2.4% 0.5% 3.2% 2.7% Health Care and Social Assistance 19.6% 17.0% 15.6% 17.1% Accommodation, Recreation, and Entertainment 7.3% 5.1% 7.7% 7.7% Other Services 24.0% 42.5% 18.6% 22.4%
These findings are important because there are advantages and disadvantages to
being concentrated in a few industries. On the one hand, it is easier to create business
programs that could help minority business owners because they can be targeted towards
those specific industries. On the other hand, it is more difficult to create general programs
that allow minorities to create and grow businesses in whatever industry makes the most
sense economically. Similarly, being concentrated in a few industries is advantageous if
those industries grow rapidly, but not if they face economic contractions. For example,
the concentration of immigrant Latino business owners in construction (for men) and
other services (for women) could create a problem if those industries experience rapid
structural changes (e.g. like the rapid impact of Uber on the taxi cab industry).
Although business income differs substantially across industries, the disparities
between immigrant Latinos, U.S.-born Latinos and non-Latino whites are consistent for
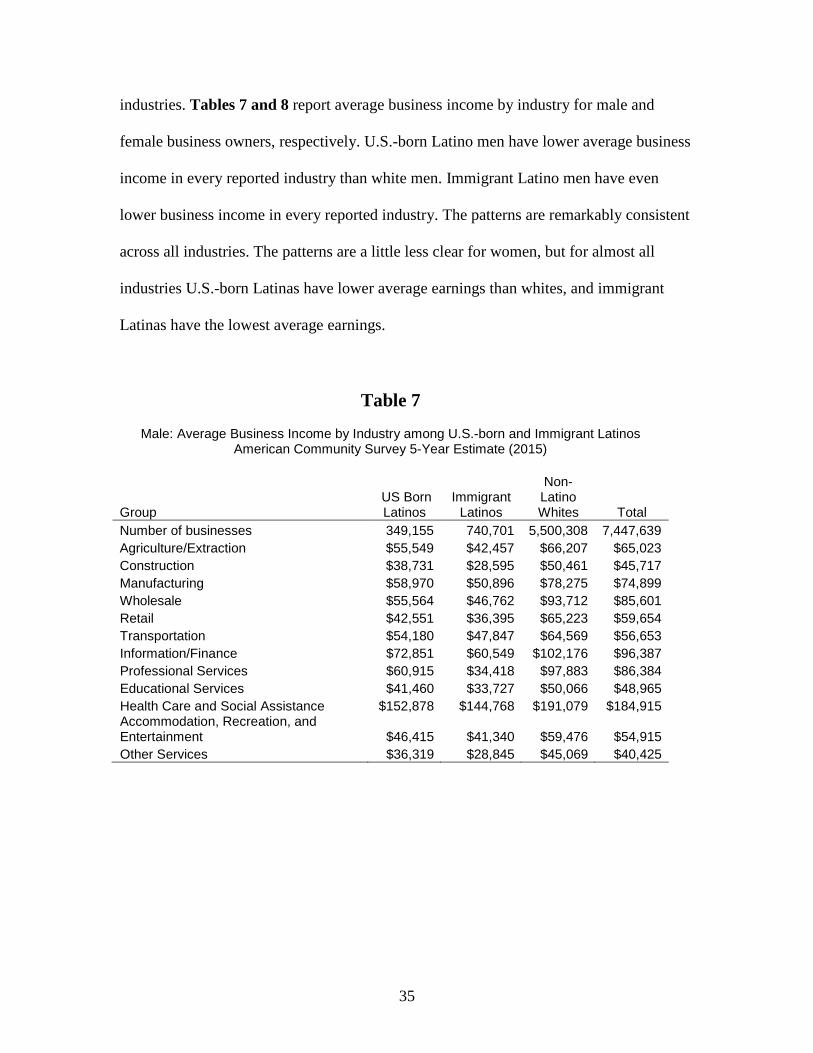
35
industries. Tables 7 and 8 report average business income by industry for male and
female business owners, respectively. U.S.-born Latino men have lower average business
income in every reported industry than white men. Immigrant Latino men have even
lower business income in every reported industry. The patterns are remarkably consistent
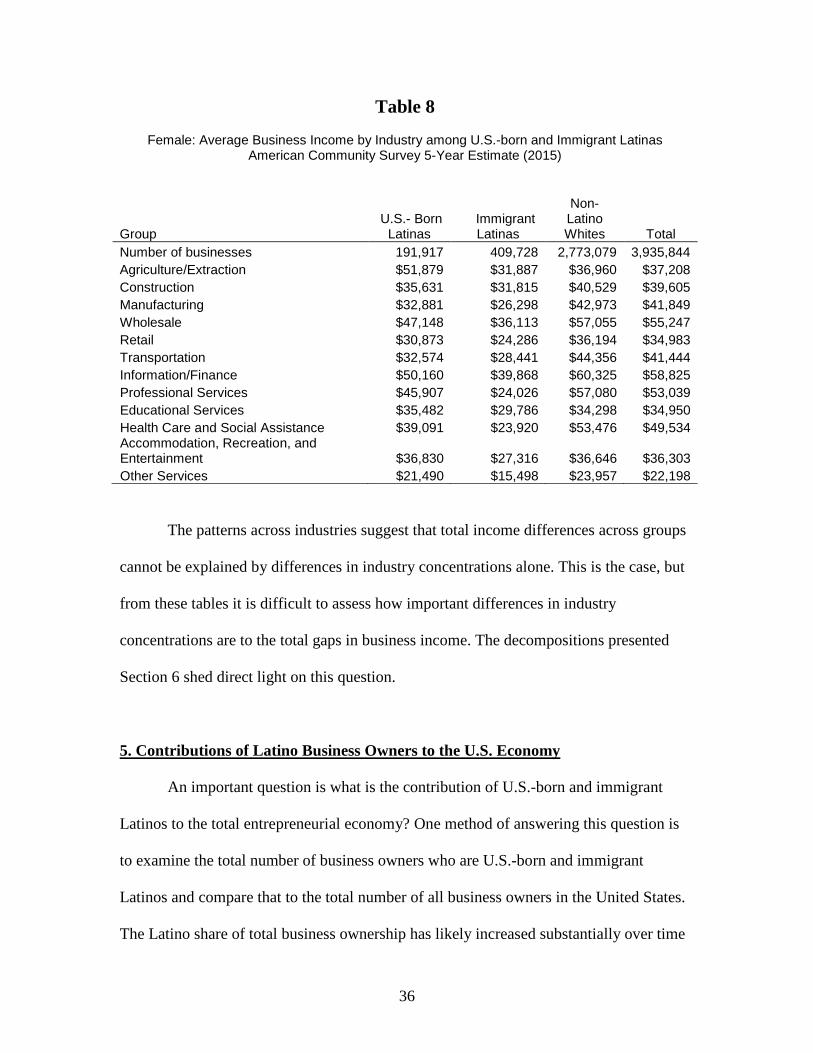
across all industries. The patterns are a little less clear for women, but for almost all
industries U.S.-born Latinas have lower average earnings than whites, and immigrant
Latinas have the lowest average earnings.
Table 7
Male: Average Business Income by Industry among U.S.-born and Immigrant Latinos American Community Survey 5-Year Estimate (2015)
Non- US Born Immigrant Latino
Group Latinos Latinos Whites Total Number of businesses 349,155 740,701 5,500,308 7,447,639 Agriculture/Extraction $55,549 $42,457 $66,207 $65,023 Construction $38,731 $28,595 $50,461 $45,717 Manufacturing $58,970 $50,896 $78,275 $74,899 Wholesale $55,564 $46,762 $93,712 $85,601 Retail $42,551 $36,395 $65,223 $59,654 Transportation $54,180 $47,847 $64,569 $56,653 Information/Finance $72,851 $60,549 $102,176 $96,387 Professional Services $60,915 $34,418 $97,883 $86,384 Educational Services $41,460 $33,727 $50,066 $48,965 Health Care and Social Assistance $152,878 $144,768 $191,079 $184,915 Accommodation, Recreation, and Entertainment $46,415 $41,340 $59,476 $54,915 Other Services $36,319 $28,845 $45,069 $40,425
36
Table 8
Female: Average Business Income by Industry among U.S.-born and Immigrant Latinas American Community Survey 5-Year Estimate (2015)
Non- U.S.- Born Immigrant Latino
Group Latinas Latinas Whites Total Number of businesses 191,917 409,728 2,773,079 3,935,844 Agriculture/Extraction $51,879 $31,887 $36,960 $37,208 Construction $35,631 $31,815 $40,529 $39,605 Manufacturing $32,881 $26,298 $42,973 $41,849 Wholesale $47,148 $36,113 $57,055 $55,247 Retail $30,873 $24,286 $36,194 $34,983 Transportation $32,574 $28,441 $44,356 $41,444 Information/Finance $50,160 $39,868 $60,325 $58,825 Professional Services $45,907 $24,026 $57,080 $53,039 Educational Services $35,482 $29,786 $34,298 $34,950 Health Care and Social Assistance $39,091 $23,920 $53,476 $49,534 Accommodation, Recreation, and Entertainment $36,830 $27,316 $36,646 $36,303 Other Services $21,490 $15,498 $23,957 $22,198
The patterns across industries suggest that total income differences across groups
cannot be explained by differences in industry concentrations alone. This is the case, but
from these tables it is difficult to assess how important differences in industry
concentrations are to the total gaps in business income. The decompositions presented
Section 6 shed direct light on this question.
5. Contributions of Latino Business Owners to the U.S. Economy An important question is what is the contribution of U.S.-born and immigrant
Latinos to the total entrepreneurial economy? One method of answering this question is
to examine the total number of business owners who are U.S.-born and immigrant
Latinos and compare that to the total number of all business owners in the United States.
The Latino share of total business ownership has likely increased substantially over time
37
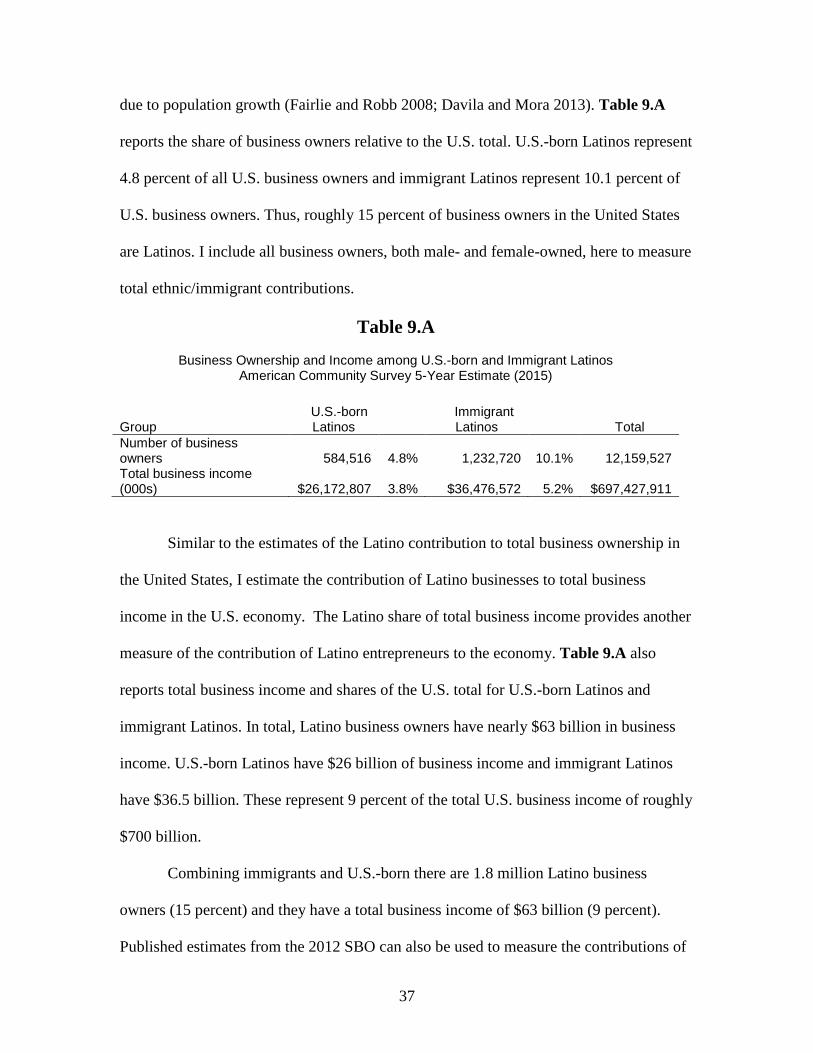
due to population growth (Fairlie and Robb 2008; Davila and Mora 2013). Table 9.A
reports the share of business owners relative to the U.S. total. U.S.-born Latinos represent
4.8 percent of all U.S. business owners and immigrant Latinos represent 10.1 percent of
U.S. business owners. Thus, roughly 15 percent of business owners in the United States
are Latinos. I include all business owners, both male- and female-owned, here to measure
total ethnic/immigrant contributions.
Table 9.A
Business Ownership and Income among U.S.-born and Immigrant Latinos American Community Survey 5-Year Estimate (2015)
U.S.-born Immigrant Group Latinos Latinos Total Number of business owners 584,516 4.8% 1,232,720 10.1% 12,159,527 Total business income (000s) $26,172,807 3.8% $36,476,572 5.2% $697,427,911
Similar to the estimates of the Latino contribution to total business ownership in
the United States, I estimate the contribution of Latino businesses to total business
income in the U.S. economy. The Latino share of total business income provides another
measure of the contribution of Latino entrepreneurs to the economy. Table 9.A also
reports total business income and shares of the U.S. total for U.S.-born Latinos and
immigrant Latinos. In total, Latino business owners have nearly $63 billion in business
income. U.S.-born Latinos have $26 billion of business income and immigrant Latinos
have $36.5 billion. These represent 9 percent of the total U.S. business income of roughly
$700 billion.
Combining immigrants and U.S.-born there are 1.8 million Latino business
owners (15 percent) and they have a total business income of $63 billion (9 percent).
Published estimates from the 2012 SBO can also be used to measure the contributions of
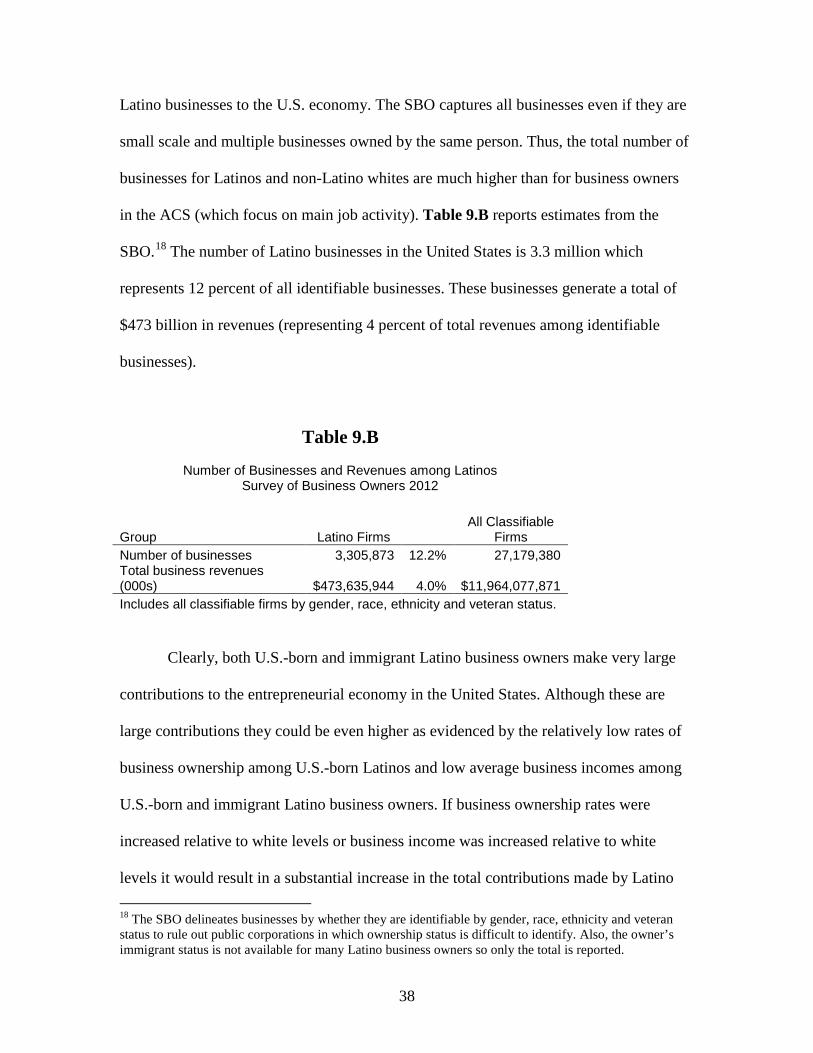
38
Latino businesses to the U.S. economy. The SBO captures all businesses even if they are
small scale and multiple businesses owned by the same person. Thus, the total number of
businesses for Latinos and non-Latino whites are much higher than for business owners
in the ACS (which focus on main job activity). Table 9.B reports estimates from the
SBO.18 The number of Latino businesses in the United States is 3.3 million which
represents 12 percent of all identifiable businesses. These businesses generate a total of
$473 billion in revenues (representing 4 percent of total revenues among identifiable
businesses).
Table 9.B
Number of Businesses and Revenues among Latinos Survey of Business Owners 2012
All Classifiable Group Latino Firms Firms Number of businesses 3,305,873 12.2% 27,179,380 Total business revenues (000s) $473,635,944 4.0% $11,964,077,871 Includes all classifiable firms by gender, race, ethnicity and veteran status.
Clearly, both U.S.-born and immigrant Latino business owners make very large
contributions to the entrepreneurial economy in the United States. Although these are
large contributions they could be even higher as evidenced by the relatively low rates of
business ownership among U.S.-born Latinos and low average business incomes among
U.S.-born and immigrant Latino business owners. If business ownership rates were
increased relative to white levels or business income was increased relative to white
levels it would result in a substantial increase in the total contributions made by Latino 18 The SBO delineates businesses by whether they are identifiable by gender, race, ethnicity and veteran status to rule out public corporations in which ownership status is difficult to identify. Also, the owner’s immigrant status is not available for many Latino business owners so only the total is reported.
39
entrepreneurs to the U.S. economy. In the next section, I investigate the potential barriers
to Latino business ownership and income.
6. Explanations for Differences in Business Ownership Rates and Income To investigate what causes differences in business ownership rates I first examine
differences in population characteristics. Differences in population characteristics such as
education and wealth levels may explain why U.S.-born Latinos have much lower
business ownership rates than whites. Furthermore, differences in these same
characteristics among business owners might explain why U.S.-born Latinos and
immigrant Latinos have lower business income. Some of these characteristics may be
more important in contributing to the disadvantages for U.S.-born Latinos than for
immigrant Latinos.
Differences in Education, Wealth and Other Characteristics
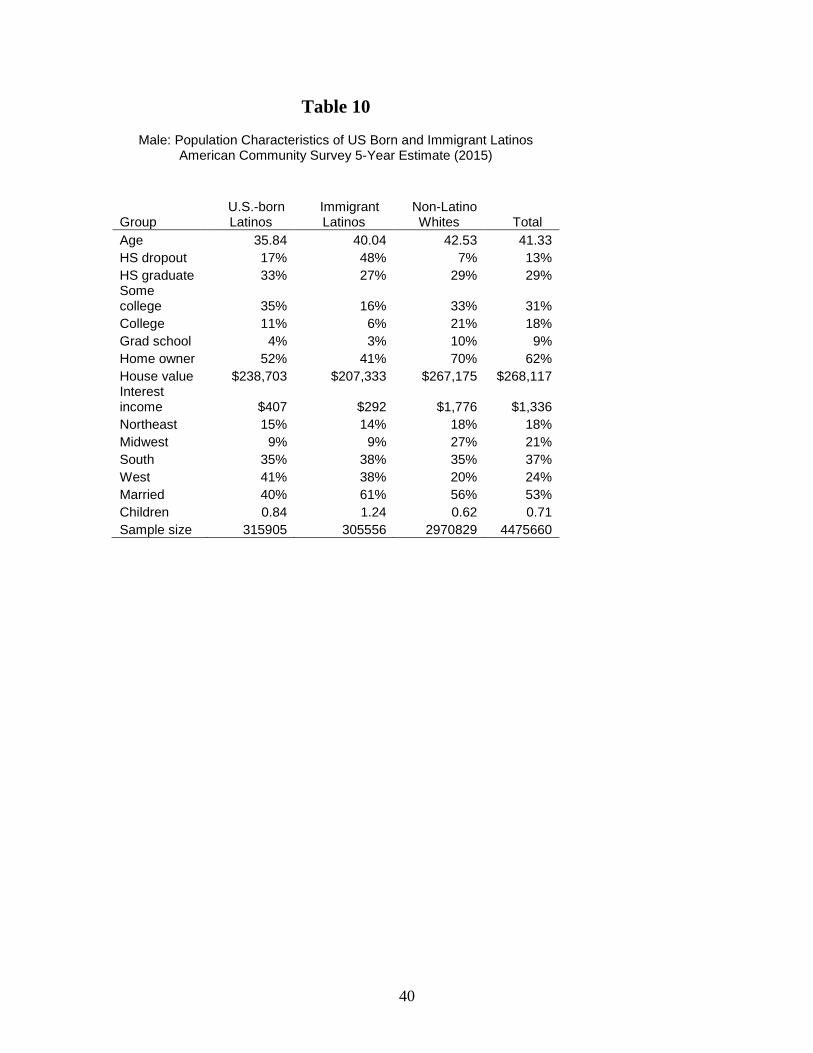
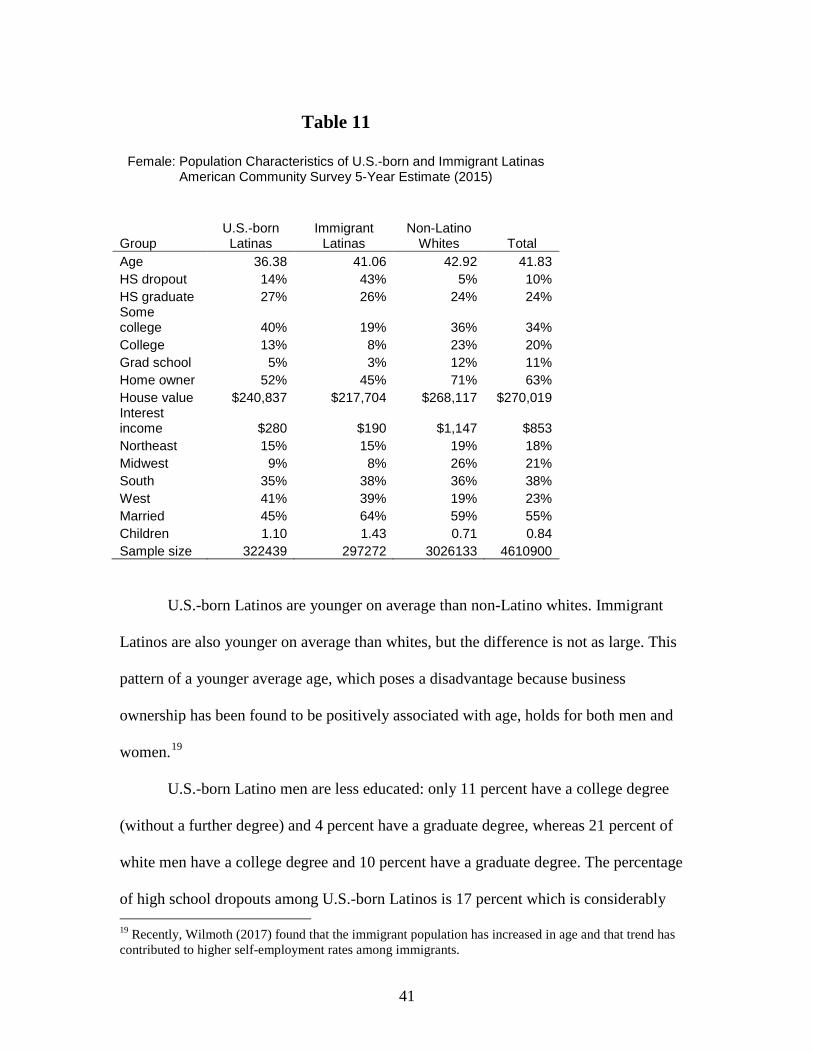
Table 10 presents differences in education, wealth and other characteristics for
the male working-age population by ethnic/racial group. Table 11 presents differences in
the same characteristics for working-age women. For both the men and women, there are
major differences in characteristics between U.S.-born Latinos and non-Latino whites.
There are also major differences between immigrant Latinos and non-Latino whites, and
in most cases these differences are larger.
40
Table 10
Male: Population Characteristics of US Born and Immigrant Latinos American Community Survey 5-Year Estimate (2015)
U.S.-born Immigrant Non-Latino Group Latinos Latinos Whites Total Age 35.84 40.04 42.53 41.33 HS dropout 17% 48% 7% 13% HS graduate 33% 27% 29% 29% Some college 35% 16% 33% 31% College 11% 6% 21% 18% Grad school 4% 3% 10% 9% Home owner 52% 41% 70% 62% House value $238,703 $207,333 $267,175 $268,117 Interest income $407 $292 $1,776 $1,336 Northeast 15% 14% 18% 18% Midwest 9% 9% 27% 21% South 35% 38% 35% 37% West 41% 38% 20% 24% Married 40% 61% 56% 53% Children 0.84 1.24 0.62 0.71 Sample size 315905 305556 2970829 4475660
41
Table 11
Female: Population Characteristics of U.S.-born and Immigrant Latinas
American Community Survey 5-Year Estimate (2015)
Group
U.S.-born Latinas
Immigrant Latinas
Non-Latino Whites Total
Age 36.38 41.06 42.92 41.83 HS dropout 14% 43% 5% 10% HS graduate 27% 26% 24% 24% Some college 40% 19% 36% 34% College 13% 8% 23% 20% Grad school 5% 3% 12% 11% Home owner 52% 45% 71% 63% House value $240,837 $217,704 $268,117 $270,019 Interest income $280 $190 $1,147 $853 Northeast 15% 15% 19% 18% Midwest 9% 8% 26% 21% South 35% 38% 36% 38% West 41% 39% 19% 23% Married 45% 64% 59% 55% Children 1.10 1.43 0.71 0.84 Sample size 322439 297272 3026133 4610900
U.S.-born Latinos are younger on average than non-Latino whites. Immigrant
Latinos are also younger on average than whites, but the difference is not as large. This
pattern of a younger average age, which poses a disadvantage because business
ownership has been found to be positively associated with age, holds for both men and
women.19
U.S.-born Latino men are less educated: only 11 percent have a college degree
(without a further degree) and 4 percent have a graduate degree, whereas 21 percent of
white men have a college degree and 10 percent have a graduate degree. The percentage
of high school dropouts among U.S.-born Latinos is 17 percent which is considerably 19 Recently, Wilmoth (2017) found that the immigrant population has increased in age and that trend has contributed to higher self-employment rates among immigrants.
42
higher than for whites. Immigrant Latino men have even lower levels of education than
U.S.-born Latinos. Among Latino immigrants only 6 percent have a college degree and 3
percent have a graduate degree.
Although education levels are slightly higher, U.S.-born Latino women also have
lower education levels than white women. Among women, 18 percent of U.S.-born
Latina women either have a college degree (only) and a graduate degree compared with
35 percent of white women. Among immigrant Latina women, 11 percent have a college
degree or graduate degree.
Another major difference between U.S.-born and immigrant Latinos and non-
Latino whites is wealth. The ACS includes information on home ownership, house values
and interest/dividend income. Home values represent the largest component of wealth for
most individuals. Interest and dividend income represents another good measure of
wealth.20 U.S.-born Latinos are much less likely than whites to own houses, and the
houses they own have lower values on average. The disparities are substantial with only
52 percent of U.S.-born Latino men owning a house with those houses being worth
$239,000 on average. In contrast, 70 percent of white men own a house and those houses
are worth $267,000 on average. Immigrant Latino men have even lower rates of home
ownership (41 percent) and home values (at $207,000). Both U.S.-born and immigrant
Latinos have much less interest and dividend income than whites. Levels and differences
are roughly similar for women for housing, but levels are lower for interest and dividend
income.
20 The survey question asks about income from "Interest, dividends, net rental income, royalty income, or income from estates and trusts. Report even small amounts credited to an account."
43
Another major difference between U.S.-born and immigrant Latinos and whites is
their geographical concentrations across the country. Latinos are more likely to live in
Western states and less likely to live in Midwest states than are whites. The regional
patterns are similar for U.S.-born and immigrant Latinos.
Focusing on family characteristics in Tables 10 and 11, marriage rates are lower
among U.S.-born Latinos than whites, but higher among immigrant Latinos than whites.
The average number of children is higher among U.S.-born and immigrant Latinos than
non-Latino whites.
Overall, there exist major differences in education, wealth, geography and other
characteristics between U.S.-born, immigrant Latinos and non-Latino whites. Both
immigrant Latinos and U.S.-born Latinos generally have disadvantaged socioeconomic
characteristics, with immigrant Latinos have the most disadvantaged characteristics.
Previous research indicates that many of these characteristics are important in
determining business ownership and outcomes.21 Also, as noted above in the literature
review, previous research indicates that many of these factors represent barriers for
Latino business ownership and outcomes.
Decomposition Technique
The comparison of average characteristics across ethnic/racial groups identifies
several potential barriers to business ownership and income. Although there are large
differences in many of these characteristics we do not know how much they contribute
21 See Hundley (2000), Zissimopoulos and Karoly (2003), van der Sluis, van Praag and Vijverberg (2005), Moutray (2007), and Fairlie and Krashinsky (2012) for few examples, and Parker (2007) for an overall review of the literature.
44
directly to business ownership and income disparities. To explore this question I perform
a decomposition technique that allows one to estimate the separate contributions from
differences between Latinos and whites in education, home ownership and other
characteristics to the racial gaps in business ownership rates and income.
The advantage of this technique is that it allows for a precise estimate of how
much a factor contributes to the disparity. For example, the technique can answer the
question of what percentage of the gap in business ownership between U.S.-born Latinos
and whites is due to education disparities.22 Similarly, the technique can estimate this
percentage for each of the other factors included in the multivariate regression model.
The decomposition technique is extremely useful for identifying causes of group
disparities in outcome variables such as business ownership and income. Specifically, we
"decompose" inter-group differences in a dependent variable into those due to different
observable characteristics across groups (sometime referred to as the endowment effect)
and those due to different ”prices” of characteristics of groups (see Blinder 1973 and
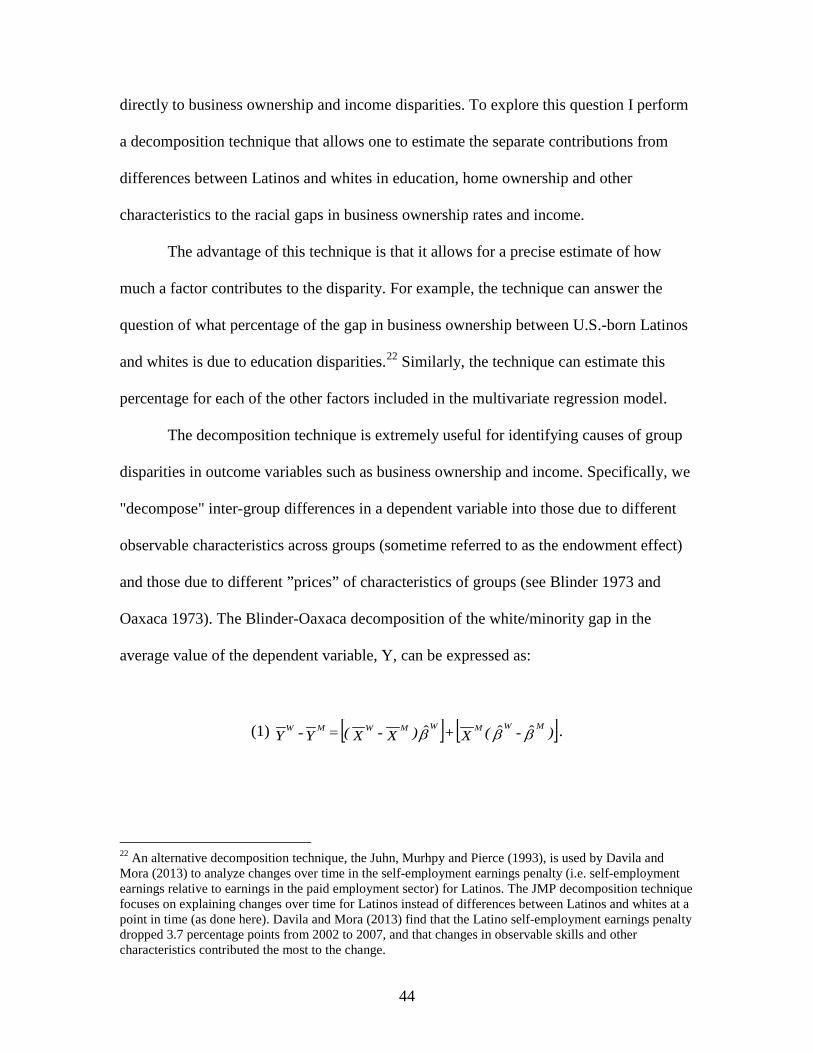
Oaxaca 1973). The Blinder-Oaxaca decomposition of the white/minority gap in the
average value of the dependent variable, Y, can be expressed as:
(1) [ ] [ ])-(X + )X-X( = Y-YMWMWMWMW βββ ˆˆˆ .
22 An alternative decomposition technique, the Juhn, Murhpy and Pierce (1993), is used by Davila and Mora (2013) to analyze changes over time in the self-employment earnings penalty (i.e. self-employment earnings relative to earnings in the paid employment sector) for Latinos. The JMP decomposition technique focuses on explaining changes over time for Latinos instead of differences between Latinos and whites at a point in time (as done here). Davila and Mora (2013) find that the Latino self-employment earnings penalty dropped 3.7 percentage points from 2002 to 2007, and that changes in observable skills and other characteristics contributed the most to the change.
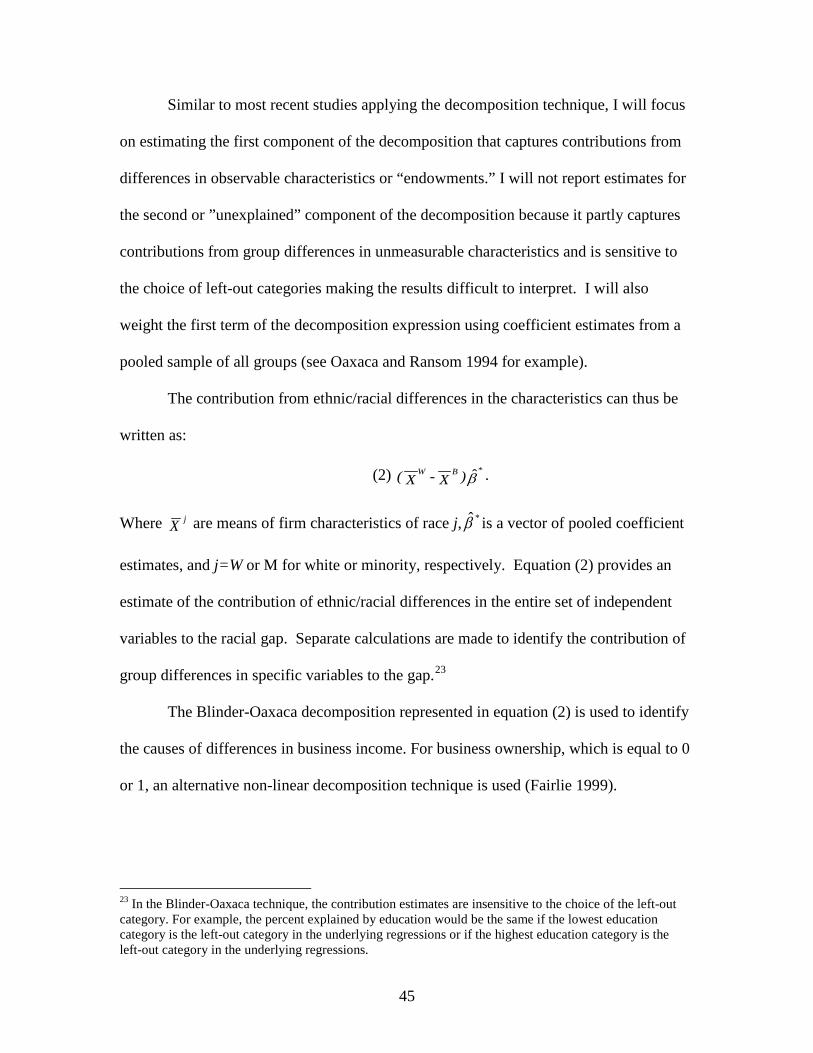
45
Similar to most recent studies applying the decomposition technique, I will focus
on estimating the first component of the decomposition that captures contributions from
differences in observable characteristics or “endowments.” I will not report estimates for
the second or ”unexplained” component of the decomposition because it partly captures
contributions from group differences in unmeasurable characteristics and is sensitive to
the choice of left-out categories making the results difficult to interpret. I will also
weight the first term of the decomposition expression using coefficient estimates from a
pooled sample of all groups (see Oaxaca and Ransom 1994 for example).
The contribution from ethnic/racial differences in the characteristics can thus be
written as:
(2) .
Where X j are means of firm characteristics of race j, *β̂ is a vector of pooled coefficient
estimates, and j=W or M for white or minority, respectively. Equation (2) provides an
estimate of the contribution of ethnic/racial differences in the entire set of independent
variables to the racial gap. Separate calculations are made to identify the contribution of
group differences in specific variables to the gap.23
The Blinder-Oaxaca decomposition represented in equation (2) is used to identify
the causes of differences in business income. For business ownership, which is equal to 0
or 1, an alternative non-linear decomposition technique is used (Fairlie 1999).
23 In the Blinder-Oaxaca technique, the contribution estimates are insensitive to the choice of the left-out category. For example, the percent explained by education would be the same if the lowest education category is the left-out category in the underlying regressions or if the highest education category is the left-out category in the underlying regressions.
β̂*)X-X( BW
46
Decomposition Results for Business Ownership
Table 12 reports estimates from the procedure for decomposing the white/Latino
gaps in business ownership into differences in characteristics for U.S.-born and
immigrant Latino men and Latina women. The decompositions are calculated separately
for men and women because of the large differences by gender. Column 1 reports
estimates for the factors contributing to the difference in business ownership rates
between non-Latino whites and U.S.-born Latinos. For convenience, the first two rows
repeat group business ownership rates previously reported in Table 1. The U.S.-born
Latino business ownership rate is 4.53 percent and the white rate is 9.07 percent forming
a gap of 4.55 percentage points. The decomposition reveals that one the most important
contributing factors is wealth. Relatively low levels of wealth among U.S.-born Latino
men explain 16 percent of why business ownership rates are lower for this group. The
most important factor, however, is age. The younger average age of U.S.-born Latino
men in the working-age population contributes to why they have lower business
ownership rates than whites. Business ownership increases with age as individuals gain
experience and general skills. Interestingly, education disparities do not contribute to why
U.S.-born Latinos are less likely to own businesses. This is because higher education is
not found to be a strong predictor of business ownership rates. Family characteristics also
do not contribute to the gap. It is important to keep in mind that these results hold for
business ownership which for many individuals captures a form of "necessity"
employment. Many individuals turn to business ownership when they cannot find a job in
the wage and salary sector. The results are likely to differ for business income, especially
for education (as we show below).
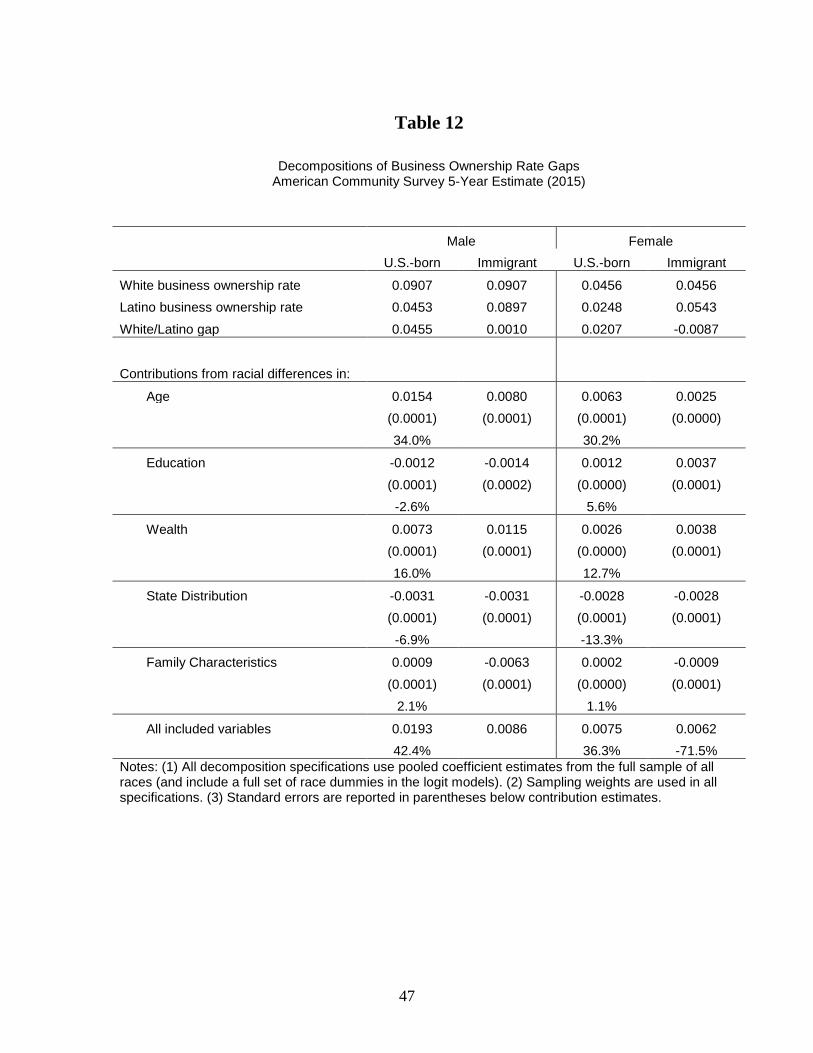
47
Table 12
Decompositions of Business Ownership Rate Gaps American Community Survey 5-Year Estimate (2015)
Male Female U.S.-born Immigrant U.S.-born Immigrant
White business ownership rate 0.0907 0.0907 0.0456 0.0456 Latino business ownership rate 0.0453 0.0897 0.0248 0.0543 White/Latino gap 0.0455 0.0010 0.0207 -0.0087
Contributions from racial differences in:
Age 0.0154 0.0080 0.0063 0.0025
(0.0001) (0.0001) (0.0001) (0.0000)
34.0% 30.2%
Education -0.0012 -0.0014 0.0012 0.0037
(0.0001) (0.0002) (0.0000) (0.0001)
-2.6% 5.6%
Wealth 0.0073 0.0115 0.0026 0.0038
(0.0001) (0.0001) (0.0000) (0.0001)
16.0% 12.7%
State Distribution -0.0031 -0.0031 -0.0028 -0.0028
(0.0001) (0.0001) (0.0001) (0.0001)
-6.9% -13.3%
Family Characteristics 0.0009 -0.0063 0.0002 -0.0009
(0.0001) (0.0001) (0.0000) (0.0001)
2.1% 1.1%
All included variables 0.0193 0.0086 0.0075 0.0062
42.4%
36.3% -71.5%
Notes: (1) All decomposition specifications use pooled coefficient estimates from the full sample of all races (and include a full set of race dummies in the logit models). (2) Sampling weights are used in all specifications. (3) Standard errors are reported in parentheses below contribution estimates.
48
Interestingly, U.S.-born Latinos live in “favorable” states that have higher than
average business ownership rates. Evidence of this favorable geographical distribution
across states is provided by the negative contribution. In a decomposition negative
contributions imply factors that work in the opposite direction of those contributing to
inequality. U.S.-born Latinos live in states that have relatively high rates of business
ownership. If instead U.S.-born Latinos had the same geographical distribution across
states as whites their business ownership rates would actually be lower than what they
current are (which is implied by the negative contribution).
For completeness Column 2 of Table 12 reports estimates for the factors
contributing to the difference in business ownership rates between non-Latino whites and
immigrant Latino men. There is no gap in business ownership rates between immigrant
Latino men and white men. To avoid misinterpretation of the results I do not report
percentage contributions because they could be misleadingly large (i.e. calculating the
percentage of a very small difference). Although there is no gap in business ownership
rates to explain, the decomposition might reveal offsetting factors that advantage or
disadvantage immigrant Latino men in business ownership. The only factor that provides
a non-trivial contribution to the gap is the wealth disparity. Lower levels of wealth among
immigrant Latino men hold them back relative to white men in business ownership. In
other words, the immigrant Latino male business ownership rate would be 1.12
percentage points higher than it currently is, and thus higher than for whites, if immigrant
Latinos had wealth levels that were comparable to white levels. Similar for the results for
U.S.-born Latinos, immigrant Latinos live in states that have relatively high rates of
business ownership.
49
The decomposition results for U.S.-born Latina women are reported in Column 3
of Table 12. The gap between U.S.-born Latina women and white women in business
ownership rates is 2.07 percentage points. Wealth is an important factor limiting business
ownership among U.S.-born Latina women. Relatively low levels of wealth explain 13
percent of the gap in business ownership rates. A younger population among U.S.-born
Latinas, however, provides the largest contribution to why this group has lower business
ownership rates. Low levels of education among U.S.-born Latinas also explains part of
the gap at 6 percent. U.S.-born Latinas live in “favorable” regions of the country with
higher business ownership rates than white women, thus resulting in a -13 percent
contribution to the gap. If U.S.-born Latinas had the same regional distribution as white
women their business ownership rates would actually be lower than what they current
are.
For immigrant Latina women, there is no gap in business ownership rates.
Actually, immigrant Latina women have a slightly higher rate of business ownership than
white women. But, similar to the findings for men there might be factors influencing the
gap either positively or negatively. The decomposition technique is useful for revealing
these types of examples. The results are somewhat similar to those for U.S.-born Latinas.
I find that relatively low levels of education and wealth among immigrant Latinas
contribute to lower business ownership rates. Immigrant Latinas are found to have a
“favorable” regional distribution relative to white women for business ownership, but are
younger on average which partly holds down business ownership rates.
50
Decomposition Results for Business Income
I now turn to discussing the decomposition results for business income. The
business income gaps were consistently large. Table 13 reports estimates from the
procedure for decomposing the white-Latino gaps in business ownership into differences
in characteristics for U.S.-born and immigrant Latino men and women. The included
variables are the same as before with two important exceptions. First, wealth is not
included in the models for business income because more successful business owners are
likely to accumulate more wealth. Thus, this reverse causality would create a problem for
estimating the effects of differences in wealth on differences in business income. Second,
industry was not included in the models for business ownership because starting a
business and its industry is a joint decision, whereas for business income the decision has
already been made and there are important differences in income levels across industries
as shown above. The decompositions include the same 12 industry classifications as
listed in Tables 5-8.
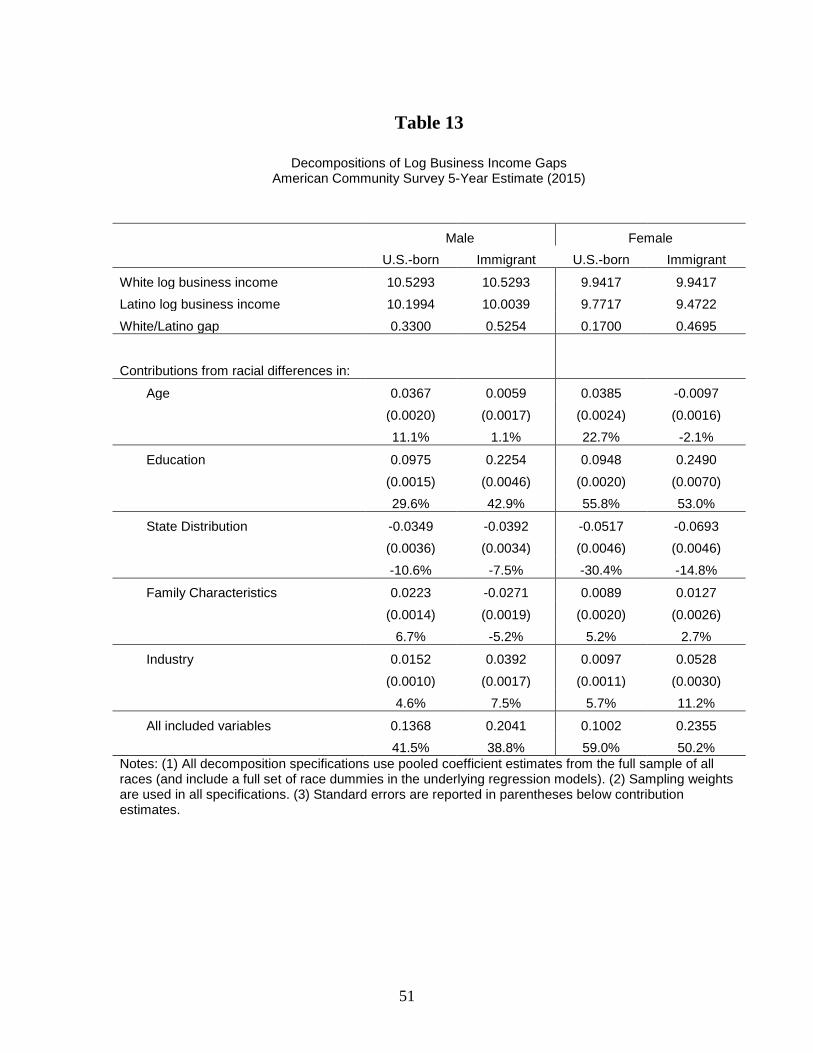
51
Table 13
Decompositions of Log Business Income Gaps American Community Survey 5-Year Estimate (2015)
Male Female U.S.-born Immigrant U.S.-born Immigrant
White log business income 10.5293 10.5293 9.9417 9.9417 Latino log business income 10.1994 10.0039 9.7717 9.4722 White/Latino gap 0.3300 0.5254 0.1700 0.4695
Contributions from racial differences in:
Age 0.0367 0.0059 0.0385 -0.0097
(0.0020) (0.0017) (0.0024) (0.0016)
11.1% 1.1% 22.7% -2.1%
Education 0.0975 0.2254 0.0948 0.2490
(0.0015) (0.0046) (0.0020) (0.0070)
29.6% 42.9% 55.8% 53.0%
State Distribution -0.0349 -0.0392 -0.0517 -0.0693
(0.0036) (0.0034) (0.0046) (0.0046)
-10.6% -7.5% -30.4% -14.8%
Family Characteristics 0.0223 -0.0271 0.0089 0.0127
(0.0014) (0.0019) (0.0020) (0.0026)
6.7% -5.2% 5.2% 2.7%
Industry 0.0152 0.0392 0.0097 0.0528
(0.0010) (0.0017) (0.0011) (0.0030)
4.6% 7.5% 5.7% 11.2%
All included variables 0.1368 0.2041 0.1002 0.2355
41.5% 38.8% 59.0% 50.2%
Notes: (1) All decomposition specifications use pooled coefficient estimates from the full sample of all races (and include a full set of race dummies in the underlying regression models). (2) Sampling weights are used in all specifications. (3) Standard errors are reported in parentheses below contribution estimates.
52
Column 1 reports estimates for U.S.-born Latino men. The underlying regression
models estimated for the decompositions use log business income which is common in
working with earnings or income data because it improves the fit of the model and limits
the influence of large outliers.24 The log business income of U.S.-born Latino men is
10.20 which is 33 log points (or roughly 33 percent) lower than the white level of 10.53.
The most important factor explaining the business income difference is education. Low
levels of education among U.S.-born Latinos explain 30 percent of the gap in business
income. The relative youth of U.S.-born Latino men also contributes to the gap in
business income, explaining 11 percentage points of the gap. The geographical
distribution is “favorable” for Latinos in terms of business income: Latinos are relatively
more likely to live in high business income states. Industry concentrations and family
differences only make small contributions to the gap. The finding for industry is
important and confirms the finding above that U.S.-born Latinos have lower business
incomes in all industries.
Among immigrant Latino men the business income gap is larger at 53 log points
(53 percent), which is reported in Column 2. Similar to the results for U.S.-born Latinos
education explains a very large part of the gap in business income. Immigrant Latino men
have lower levels of education and this contributes to why they have lower average
business income than non-Latino whites. It explains 44 percent of the gap. Industry
differences also contribute to the gap explaining 8 percent of the disparity in log income. 24 One problem, however, with using logs is that very small and zero income observations tend to overly influence the estimates. To address this issue I right and left censor the data at + or - $1,000. Thus, any business income value from 0 to 1,000 is given a value of log(1,000) and from -1,000 and 0 is given a value of –log(1,000). Negative values of income are reversed in sign prior to taking logs to avoid problems with taking logs of negative values (e.g. -10,000 would be –log(10,000) In no case do I remove any business income observations. The general idea is that a business owner with less than $1,000 in business income has business income that is indistinguishable from $0. I find that using alternative cutoffs does not change the results.
53
Immigrant Latino men are somewhat concentrated in lower paying industries, but the
explanatory power is still under 10 percent of the gap.
Column 3 reports decomposition estimates for U.S.-born Latina women. The
business income gap is 17 log points for this group compared to non-Latino white
women. More than one half (57 percent) of the business income gap is due to U.S.-born
Latino women having lower education levels than white women. The younger age of
U.S.-born Latino women also contributes to the gap explaining 23 percent of the business
income disparity. The negative contribution on region suggest that U.S.-born Latina
owners have a “favorable” geographical distribution across states. For this group, the
difference is large.
The results for immigrant Latina women indicate two important findings. First,
relatively low levels of education among immigrant Latina business owners constricts
their business income compared with white female business owners. This is the single
most important factor explaining the majority of the gap (54 percent). Second, of all the
groups for business income, the less favorable industry concentration of immigrant,
female Latino business owners suppresses their business income the most. Industry
concentrations explain 11 percent of the business income gap between immigrant Latinas
and white women.
7. Discussion and Conclusions
The analysis of the latest available household microdata from the U.S. Census
Bureau provides several new findings on Latino business ownership and success. Both
U.S.-born and immigrant Latinos make large contributions to business ownership and
54
income. Among the 12.2 million business owners in the United States roughly 600,000
are U.S.-born Latinos and 1.2 million are immigrant Latinos. Business owners who are
U.S.-born Latino and immigrant Latino generate a total of $26 billion and $36.5 billion in
business income, respectively. Published estimates from the 2012 SBO indicate that
Latino-owned businesses as a whole contribute $474 billion to the U.S. economy.
Focusing on U.S.-born Latinos the analysis reveals that business ownership is
substantially lower among U.S.-born Latinos than non-Latino whites. Business income is
also found to be substantially lower among U.S.-born Latinos. Using a decomposition
technique that simultaneously explores various potential barriers to Latino business
success, I find that the two most important factors limiting business ownership among
U.S.-born Latinos are relatively young age and lack of wealth. The most important factor
limiting business income among U.S.-born Latinos is low levels of education. The
relatively young age of U.S.-born Latinos also contributes to lower incomes.
Turning to immigrant Latinos, the results indicate that business ownership is
higher among immigrant Latinos than U.S.-born Latinos, and in fact, is comparable to
business ownership rates among non-Latino whites. Business income, however, is
substantially lower among immigrant Latino business owners than among both U.S.-born
Latino business owners and non-Latino white business owners. The largest constraint for
even higher rates of business ownership among immigrant Latinos is low levels of
wealth, and the largest constraint for business income is low levels of education. Limited
wealth and human capital are clearly creating large barriers to success among immigrant
Latino business owners.
55
This study reveals several interesting findings regarding the patterns and causes of
differences in business ownership and income. But, with any analysis of quantitative data
many questions remain and require further analysis. The evidence presented here, which
is consistent with the findings in previous studies, indicates that financing constraints
may severely limit Latino-owned business ownership. Policies to improve wealth, credit
scores and the general financial health of Latino entrepreneurs, both U.S.-born and
immigrant, may be helpful. Wealth inequality may be directly addressed through
expanding asset building programs such as financial education programs, individual
development accounts (IDAs), and first-time home ownership programs. Access to
financial capital can be increased through government programs and community banks.
Policies to promote educational attainment in general and among business owners
more specifically would also be helpful. Education is found to a major constraint to why
Latino business owners, both U.S.-born and immigrant, have relatively low business
incomes. Programs targeted at increasing educational opportunities for Latinos may result
in better business outcomes among Latino business owners. These policies are also likely
to have an indirect long-term effect on business ownership and success through reducing
wealth inequality. Higher levels of education are associated with higher levels of wealth.
More research on the impacts of specific educational programs, however, is needed. But,
certainly any polices that increase high school and college graduation rates will not only
be useful in increasing business income directly, but also indirectly through their impacts
on wealth.
56
Age is found to be an important factor in the decompositions for U.S.-born
Latinos. Older workers have more work and business experience which is valuable in
business ownership and outcomes, and U.S.-born Latinos are young relative to whites.
But, age differs from traditional constraints related to inequality such as financial capital
and human capital. As the U.S.-born Latino population ages we are likely to see resulting
improvements in business ownership and income.
In evaluating the potential effectiveness of specific policies, an important
distinction is needed between the goal of increasing the number of Latino business
owners and the goal of improving the success of Latino business owners. Although
several constraints to Latino business ownership have been identified, it is difficult to
know what the optimal level of business ownership would be given the risky nature of
entrepreneurship. In fact, business ownership rates are just as high among immigrant
Latinos as non-Latino whites. On the other hand, there is no disagreement over the
importance of improving Latino business outcomes — better performing businesses
unambiguously make Latinos better off. In this case, both U.S.-born Latino and
immigrant Latino business owners have substantially lower business incomes. Thus, to
address the problem of racial and ethnic inequality, we need policies that focus on
relaxing the constraints to successful business ownership instead of simply increasing the
number of business owners. Addressing these constraints will be important for future
growth of the U.S. economy.
57
References Allen, W. David. 2000. "Social Networks and Self-Employment," Journal of Socio-Economics, 29: 487-501. Astebro Thomas and Irwin Bernhardt. 2003. Start-Up Financing, Owner Characteristics and Survival, Journal of Economics and Business, 55(4), 303-320. Avery, Robert B., Raphael W. Bostic, and Katherine A. Samolyk. 1998. "The Role of Personal Wealth in Small Business Finance," Journal of Banking and Finance, 22: 1019-1061. Baron, Salo W., Arcadius Kahan, and Nachum Gross. 1975. Economic History of the Jews. New York: Schocken Books. Bates, Timothy. 1993. Banking on Black Enterprise. Washington, D.C.: Joint Center for Political and Economic Studies. Bates, Timothy. 1997. Race, Self-Employment & Upward Mobility: An Illusive American Dream, Washington, D.C.: Woodrow Wilson Center Press and Baltimore: John Hopkins University Press. Bates, Timothy. 2011. "Minority Entrepreneurship." Foundations and Trends in Entrepreneurship. 7.3–4: 151-311. Bates, Timothy, and William D. Bradford. 2008. " Venture-Capital Investment in Minority Business," Journal of Money Credit and Banking, Volume 40, Issue 2-3, Date: March/April 2008, Pages: 489-504. Bates, Timothy, and David Howell. 1997. "The Declining Status of African American Men in the New York City Construction Industry. In Race, Markets, and Social Outcomes, edited by Patrick Mason and Rhonda Williams. Boston: Kluwer. Bates, Timothy, and Alicia Robb. 2015. “Has the Community Reinvestment Act Increased Loan Availability among Small Businesses Operating in Minority Neighborhoods?” Urban Studies, 52, 1702-1721. Becker, G. 1971. The Economics of Discrimination. [1957], Chicago: University of Chicago Press. Blanchard, Lloyd, John Yinger and Bo Zhao. 2008. "Do Lenders Discriminate Against Minority and Women Entrepreneurs?" Journal of Urban Economics, 63(2): 467-497. Blanchflower, David G, P. Levine and D. Zimmerman. 2003. "Discrimination in the Small Business Credit Market", Review of Economics and Statistics, November, 85(4), pp. 930-943.
58
Blanchflower, David G. and Oswald, Andrew J. “What Makes and Entrepreneur?” Journal of Labor Economics, 16(1), January, 1998: 26-60. Blinder, Alan S. 1973. "Wage Discrimination: Reduced Form and Structural Variables." Journal of Human Resources 8: 436-455. Bonacich, Edna and John Modell. 1980. The Economic Basis of Ethnic Solidarity in the Japanese American Community. Berkeley: University of California Press. Borjas, George J. 1999. "The Wage Structure and Self-Selection into Self-Employment," Harvard University working paper. Borjas, George, and Stephen Bronars. 1989. "Consumer Discrimination and Self-Employment," Journal of Political Economy, 97, pp. 581-605. Bostic, R., & Lampani, P. 1999. Racial Differences in Patterns of Small Business Finance. In J. Blanton, A. Williams & S. Rhine (Eds.), Business Access to Capital and Credit (pp. 253-276). Washington, DC: Federal Reserve System. Boston, Thomas D. 1999. “Generating Jobs Through African American Business Development”, in J. Whitehead and C. Harris, eds. Readings in Black Political Economy (Dubuque: Kendall-Hunt). Boston, Thomas D. 2006. “The Role of Black-owned Businesses in Black Community Development” ed. Paul Ong, Jobs and Economic Development in Minority Communities: Realities, Challenges, and Innovation. Temple University Press. Bradford, William D. 2003. "The Wealth Dynamics of Entrepreneurship for Black and White Families in the U.S.," Review of Income and Wealth, 49(1): 89-116. Buckley, Patricia. 2002. Keys to Minority Entrepreneurial Success: Capital, Education and Technology, U.S. Department of Commerce, Economics and Statistics Administration and the Minority Business Development Agency Report, Washington, D.C. Bucks, Brian K., Arthur B. Kennickell, and Kevin B.Moore. 2006. "Recent Changes in U.S. Family Finances: Evidence from the 2001 and 2004 Survey of Consumer Finances," Federal Reserve Bulletin, Washington, D.C.: Board of Governors of the Federal Reserve System. Cavalluzzo, Ken, Linda Cavalluzzo, and John Wolken. 2002. “Competition, Small
Business Financing, and Discrimination: Evidence from a New Survey,” Journal of Business, Vol. 75(4): 641-679.
59
Cavalluzzo, Ken and John Wolken. 2005. "Small Business Loan Turndowns, Personal Wealth and Discrimination." Journal of Business, 78(6): 2153-2177. Coleman, Susan. 2002. "The Borrowing Experience of Black and Hispanic-Owned Small Firms: Evidence from the 1998 Survey of Small Business Finances." The Academy of Entrepreneurship Journal 8, no. 1: 1-20. Coleman, Susan. 2003. "Borrowing Patterns for Small Firms: A Comparison by Race and Ethnicity." The Journal of Entrepreneurial Finance & Business Ventures 7, no. 3: 87-108. Chatterji, Aaron, Kenneth Y. Chay and Robert W. Fairlie. 2014. "The Impact of City Contracting Set-Asides on Black Self-Employment and Employment," (with). Journal of Labor Economics, 32(3): 507-561. Dávila, Alberto, and Marie Mora. 2013. Hispanic Entrepreneurs in the 2000s: An Economic Profile and Policy Implications. Stanford University Press, Stanford. Mora, Marie T., and Alberto Dávila. 2014. "Gender and business outcomes of Black and Hispanic new entrepreneurs in the United States." American Economic Review. 104.5: 245-249. Duncan, Brian, and Stephen J. Trejo. 2011. "Tracking Intergenerational Progress for Immigrant Groups: The Problem of Ethnic Attrition." The American Economic Review 101.3: 603-608. Duncan, Brian, and Stephen J. Trejo. 2012. "The Complexity of Immigrant Generations: Implications for Assessing the Socioeconomic Integration of Hispanics and Asians." Industrial Labor Relations Review. Dunn, Thomas A. and Douglas J. Holtz-Eakin. 2000. "Financial Capital, Human Capital, and the Transition to Self-Employment: Evidence from Intergenerational Links," Journal of Labor Economics 18 (2): 282-305. Elitcha, Koffi, and Raquel Fonseca. 2016. Self-Employment, Wealth and Start-up Costs: Evidence from a Financial Crisis, Cahier de Recherche Working Paper. Evans, David S. and Leighton, Linda S. “Some Empirical Aspects of Entrepreneurship.” American Economic Review, 79(3), June, 1989: 519-535. Evans, David S. and Jovanovic, Boyan. “An Estimated Model of Entrepreneurial Choice under Liquidity Constraints.” Journal of Political Economy, 97(4), August, 1989: 808-827.
60
Fairlie, Robert W. 1999. "The Absence of the African-American Owned Business: An Analysis of the Dynamics of Self-Employment." Journal of Labor Economics, 17(1): 80-108. Fairlie, Robert W. 2006. "The Personal Computer and Entrepreneurship." Management Science 52.2: 187-203. Fairlie, Robert W. 2006. "Entrepreneurship among Disadvantaged Groups: An Analysis of the Dynamics of Self-Employment by Gender, Race and Education," The Life Cycle of Entrepreneurial Ventures, International Handbook Series on Entrepreneurship, Vol. 3, ed. Simon Parker. Springer: New York. Fairlie, Robert W. 2004. "Does Business Ownership Provide a Source of Upward Mobility for Blacks and Hispanics?" Public Policy and the Economics of Entrepreneurship, eds., Doug Holtz-Eakin and Harvey S. Rosen, Cambridge: MIT Press. Fairlie, Robert W., and Harry A. Krashinsky. 2012. "Liquidity Constraints, Household Wealth, and Entrepreneurship Revisited." Review of Income and Wealth 58.2: 279-306. Fairlie, Robert W., and Bruce D. Meyer. 2000. "Trends in Self-Employment among Black and White Men: 1910-1990." Journal of Human Resources, 35(4): 643-669. Fairlie, Robert W., and Alicia Robb. 2007. "Families, Human Capital, and Small Business: Evidence from the Characteristics of Business Owners Survey." Industrial & Labor Relations Review 60.2: 225-245. Fairlie, Robert W., and Alicia M. Robb. 2007. "Why are Black-Owned Businesses Less Successful than White-Owned Businesses: The Role of Families, Inheritances, and Business Human Capital," Journal of Labor Economics, 25(2): 289-323. Fairlie, Robert W., and Alicia M. Robb. 2008. Race and Entrepreneurial Success: Black-, Asian-, and White-Owned Businesses in the United States, Cambridge: MIT Press. Fairlie, Robert W., Alicia Robb and David Robinson. 2015. "Black and White: Access to Capital among Minority-Owned Startups," Working Paper. Fairlie, Robert, and Christopher M. Woodruff. 2010. "Mexican-American Entrepreneurship." The BE Journal of Economic Analysis & Policy 10.1. Feagin, Joe R., and Nikitah Imani. 1994. "Racial Barriers to African American Entrepreneurship: an Exploratory Study," Social Problems, November, 41(4): 562-585. Glazer, Nathan and Daniel P. Moynihan. 1970. Beyond the Melting Pot: the Negroes, Puerto Ricans, Jews, Italians, and Irish of New York City, 2nd Edition. Cambridge: MIT Press.
61
Hoefer, Michael, Nancy Francis Rytina, and Brian Baker. 2012. Estimates of the Unauthorized Immigrant Population Residing in the United States: January 2011. Washington, DC: Department of Homeland Security, Office of Immigration Statistics. Holtz-Eakin, Douglas, David Joulfaian and Harvey S. Rosen. “Entrepreneurial Decisions and Liquidity Constraints.” RAND Journal of Economics, 25(2), Summer, 1994(a): 334-347. Holtz-Eakin, Douglas, Harvey S. Rosen, and Robert Weathers. 2000. "Horatio Alger Meets the Mobility Tables." Small Business Economics, 14: 243-274. Holtz-Eakin, Douglas, and Harvey S. Rosen (2005): "Cash Constraints and Business Start-Ups: Deutschmarks Versus Dollars," Contributions to Economic Analysis & Policy: Vol. 4: No. 1, Article 1. Hout, Michael and Harvey S. Rosen. 2000. "Self-Employment, Family Background, and Race," Journal of Human Resources, 35 (4): 670-692. Hsieh, Chang-Tai, Erik Hurst, Charles I. Jones, and Peter J. Klenow. 2016. “The Allocation of Talent and U.S. economic growth.” Stanford University working paper. Hundley, Greg. 2000. "Male/Female Earnings Differences in Self-Employment: The Effects of Marriage, Children, and the Household Division of Labor." Industrial & Labor Relations Review 54.1: 95-114. Insight Center. 2013. "The Economic Impact of U.S. Microbusinesses." Insight Center for Community Economic Development. Joint Center for Political and Economic Studies. 1994. Assessment of Minority Business Development Programs, Report to the U.S. Department of Commerce Minority Business Development Agency, Washington, D.C. Juhn, Chinhui, Kevin M. Murphy, and Brooks Pierce. 1993. "Wage inequality and the rise in returns to skill." Journal of Political Economy 101.3: 410-442. Kawaguchi, Daiji. 2005. "Negative Self Selection into Self-Employment among African Americans," Topics in Economic Analysis & Policy, Berkeley Electronic Press Journals, 5(1): Article 9, 1-25. Koellinger, Phillipp, and Maria Minniti. 2006. "Not for Lack of Trying: American Entrepreneurship in Black and White." Small Business Economics 27, no. 1:59–79. Kymn, Christine. 2014. “Access to Capital for Women- and Minority-Owned Businesses: Revisiting Key Variables,” U.S. Small Business Administration, Office of Advocacy, Issue Brief Number 3.
62
Lentz, Bernard, and David Laband. 1990. "Entrepreneurial Success and Occupational Inheritance among Proprietors," Canadian Journal of Economics, 23, No. 3, pp. 563-579. Light, Ivan. 1972. Ethnic Enterprise in America. Berkeley: University of California Press. Light, Ivan. 1979. "Disadvantaged Minorities in Self Employment." International Journal of Comparative Sociology 20(1-2):31-45. Loewen, James W. 1971. The Mississippi Chinese: Between Black and White. Cambridge: Harvard University Press. Lofstrom, Magnus, and Chunbei Wang. 2009. "Mexican-American Self-Employment: a Dynamic Analysis of Business Ownership." Research in Labor Economics 29: 197-227. McManus, Michael. 2016. “Minority Business Ownership: Data from the 2012 Survey of Business Owners,” U.S. Small Business Administration, Office of Advocacy, Issue Brief Number 12. Meyer, Bruce 1990. "Why Are There So Few Black Entrepreneurs?" National Bureau of Economic Research, Working Paper No. 3537. Minority Business Development Agency. 2004. Accelerating Job Creation and Economic Productivity: Expanding Financing Opportunities for Minority Businesses, Washington, D.C.: MBDA. Mitchell, K. and D.K. Pearce. 2004. “Availability of Financing to Small Firms using the Survey of Small Business Finances,” United States Small Business Administration, Office of Advocacy. Mitchell, K., & Pearce, D. 2011. “Lending Technologies, Lending Specialization, and Minority Access to Small Business Loans. Small Business Economics, 37, 277-304. Moutray, C. 2007. “Educational Attainment and other Characteristics of the Self-Employed: An Examination using the Panel Study of Income Dynamics Data.” U.S. Small Business Administration, Office of Advocacy, working paper. National Academies. 2015. The Integration of Immigrants into American Society, Committee on Population, Division of Social Sciences and Education, National Academies of Sciences, Engineering, and Medicine. Oaxaca, Ronald. 1973. "Male-Female Wage Differentials in Urban Labor Markets," International Economic Review, 14 (October), 693-709. Oaxaca, Ronald, and Michael Ransom. 1994. "On Discrimination and the Decomposition of Wage Differentials," Journal of Econometrics, 61, 5-21.
63
Parker, Simon C. 2007. The Economics of Self-Employment and Entrepreneurship. Cambridge: Cambridge University Press. Reynolds, Paul. 2005. Entrepreneurship in the US: The Future is Now. Springer. Robles, Bárbara J. 2012. "Emergent entrepreneurs: Latina-owned businesses in the borderlands." Richardson, Chad, and Michael J. Pisani. 2012. The informal and underground economy of the South Texas border. University of Texas Press. Sohl, Jeffrey. 2008. "The Angel Investor Market in 2008: A Down Year In Investment Dollars But Not In Deals", Center for Venture Research, March 26, 2008, http://wsbe.unh.edu/files/2008_Analysis_Report_Final.pdf. Sowell, Thomas. 1981. Markets and Minorities. New York: Basic Books. Stanford Center on Poverty and Inequality. 2017. “State of the Union 2017,” Pathways: A magazine on poverty, inequality, and social policy, June 2017. Stanford Latino Entrepreneurship Initiative. 2015. The State of Latino Entrepreneurship Research Report 2015. U.S. Census Bureau. 1997. “1992 Economic Census: Characteristics of Business Owners” Washington, D.C.: U.S. Government Printing Office. U.S. Census Bureau. 2017. Wealth, Asset Ownership, & Debt of Households Detailed Tables: 2013, https://www.census.gov/data/tables/2013/demo/wealth/wealth-asset-ownership.html. U.S. Census Bureau. 2015. Survey of Business Owners 2012, http://www.census.gov/econ/sbo/. U.S. Census Bureau. 2016. Survey of Business Owners (SBO) - Characteristics of Businesses: 2012 Tables. U.S. Department of Commerce, Minority Business Development Agency. 2008. Characteristics of Minority Businesses and Entrepreneurs, An Analysis of the 2002 Survey of Business Owners, Washington, D.C. Van der Sluis, J., Van Praag, M., and Vijverberg, W. 2005. "Education and Entrepreneurship in Industrialized Countries: A Meta-Analysis," World Bank Economic Review, 19(2): 225-261.
64
Walstad, William B. and Marilyn L. Kourilsky. 1998. "Entrepreneurial Attitudes and Knowledge of Black Youth," Entrepreneurship Theory & Practice, 23(2): 5-18. Wilmoth, Daniel. 2017. “Explaining the Emergence of the Immigrant Entrepreneur.” U.S. Small Business Administration, Office of Advocacy, Economic Research Series, Trends in Entrepreneurship. Yago, Glenn, and Aaron Pankrat. 2000. “The Minority Business Challenge: Democratizing Capital for Emerging Domestic Markets,” Minority Business Development Agency and Milken Institute, Research Report. Zissimopoulos, Julie, and Lynn Karoly. 2003. "Transitions to Self-Employment at Older Ages," RAND Working Paper.