Embed Size (px)
Citation preview
Las Virgenes Municipal Water DistrictComprehensive Annual Financial ReportFor Fiscal Year Ended - June 30, 2016
4232 Las Virgenes Road, CalabasasLos Angeles County, California
Delara Barahman, 4th grade, Bay Laurel Elementary
For Fiscal Years Ended - June 30, 2016 and 2015

Las Virgenes Municipal Water District
Table of Contents
Page INTRODUCTORY SECTION (Unaudited) Letter of Transmittal ................................................................................................................................................ i GFOA Certificate of Achievement ....................................................................................................................... v Organization Chart ................................................................................................................................................. vi Maps of Service Area .......................................................................................................................................... vii
FINANCIAL SECTION Independent Auditors’ Reports:
Report on Financial Statements .................................................................................................................... 1 Report on Internal Control Over Financial Reporting and on Compliance and Other Matters Based on an Audit of Financial Statements Performed in Accordance with Government Auditing Standards ..................................................................................................... 3
Management’s Discussion and Analysis (Required Supplementary Information) (Unaudited) ................... 5
Basic Financial Statements: Statements of Net Position ............................................................................................................................. 14 Statements of Revenues, Expenses, and Changes in Net Position ................................................................. 16 Statements of Cash Flows .............................................................................................................................. 18 Notes to the Basic Financial Statements ........................................................................................................ 21
Required Supplementary Information (Unaudited): Schedule of Changes in Net Pension Liability and Related Ratios – CalPERS Pension Plan ....................... 53 Schedule of Contributions – CalPERS Pension Plan ..................................................................................... 54 Schedule of Funding Progress – Other Post-Employment Benefits Plan ....................................................... 55
STATISTICAL SECTION (Unaudited) Index to Statistical Section ............................................................................................................................. 57 Net Position .................................................................................................................................................... 58 Changes in Net Position ................................................................................................................................. 60 Revenue Base ................................................................................................................................................. 62 Revenue Rates ................................................................................................................................................ 63 Principal Revenue Payers ............................................................................................................................... 65 Property Tax Levies, Special Assessment and Collections ............................................................................ 66 Ratios of Outstanding Debt by Type .............................................................................................................. 67 Ratios of General Bonded Debt Outstanding ................................................................................................. 68 Direct and Overlapping District Debt ............................................................................................................ 69 Pledged-Revenue Coverage ........................................................................................................................... 71 Demographic and Economic Statistics ........................................................................................................... 72 Principal Employers ....................................................................................................................................... 73 Full-Time Equivalent District Employees by Function.................................................................................. 74 Operating Indicators by Function ................................................................................................................... 75 Capital Assets Statistics by Function ............................................................................................................. 76 Annual Water and Sewer Capacity Fee Deposits Report ............................................................................... 77

i
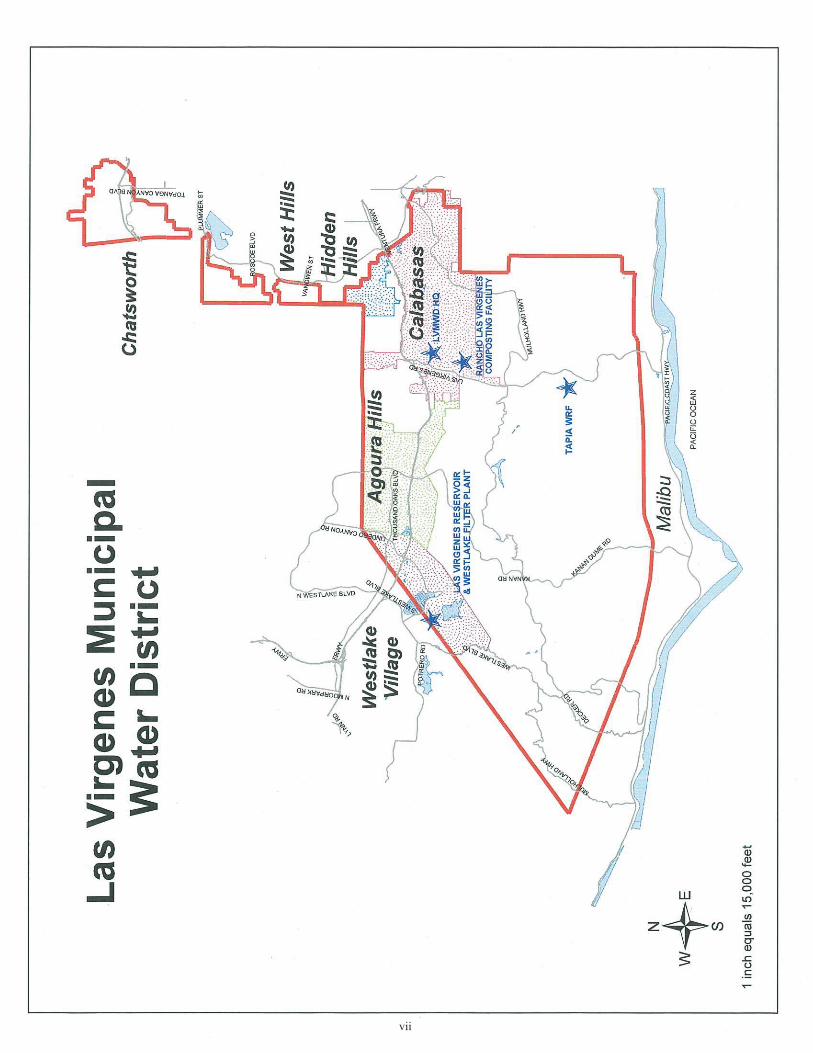
November 8, 2016 To: Board of Directors From: David W. Pedersen, General Manager Donald Patterson, Director of Finance & Administration Subject: COMPREHENSIVE ANNUAL FINANCIAL REPORT FOR FISCAL YEAR 2015-16 California law requires that every local government publish within six months of the close of each fiscal year a complete set of audited financial statements. This report is published to fulfill that requirement for the fiscal year ended June 30, 2016. Management assumes full responsibility for the completeness and reliability of the information contained in this report, based upon a comprehensive framework of internal control that has been established for this purpose. Because the cost of internal control should not exceed anticipated benefits, the objective is to provide reasonable, rather than absolute, assurance that the financial statements are free of any material misstatements. The Pun Group, LLP, Accountants and Advisors, have issued an unmodified (“clean”) opinion on the Las Virgenes Municipal Water District’s financial statements for the years ended June 30, 2016 and 2015. The independent auditor’s report is located at the front of the financial section of this report. Management’s discussion and analysis (MD&A) immediately follows the independent auditor’s report and provides a narrative introduction, overview and analysis of the basic financial statements. The MD&A complements this letter of transmittal and should be read in conjunction with it. Profile of the Government Las Virgenes Municipal Water District (LVMWD or District), incorporated in 1958, is located on the western edge of Los Angeles County, California, and includes the cities of Agoura Hills, Calabasas, Hidden Hills and Westlake Village, and adjacent areas of Los Angeles County. LVMWD occupies 122 square miles and serves a population of approximately 70,000. LVMWD is also the administering agent for the Las Virgenes – Triunfo Joint Powers Authority (JPA), which provides sanitation services to approximately 100,000 people within 172 square miles of western Los Angeles County and southeastern Ventura County. LVMWD is empowered to levy an assessment on real property located within its boundaries, up to $10 per parcel, and has a miniscule share of the property tax assessment. The majority of revenue is from user fees for service. LVMWD also is empowered by state statute to extend its corporate limits by annexation, which it has done from time to time.
ii
LVMWD has operated under the board-general manager form of government since its inception. Policy-making and legislative authority are vested in a governing board (Board) consisting of five members elected by division on a non-partisan basis. The Board appoints the general manager, who in turn appoints the heads of the various departments. Board members serve overlapping four-year terms, and every two years -- concurrent with installation of the newly elected board -- select board officers. A District representative to the board of directors of Metropolitan Water District of Southern California is appointed to serve an indefinite term. LVMWD provides potable water, wastewater and recycled water services to its customers. Wastewater and recycled water services are provided in conjunction with Triunfo Sanitation District through the JPA. Although not required by law, the Board adopts a final budget for the next fiscal year by the close of the current fiscal year. This annual budget serves as the foundation for the LVMWD’s financial planning and control. The budget is prepared by enterprise, function (e.g. system operations) and department (e.g. Facilities and Operations). Department heads may transfer resources within a department or enterprise as they see fit, but transfers between departments or enterprises need special approval from the Board. Local Economy The region is highly desirable for both residences and businesses, with exceptional natural attributes. Much of the service area lies within the Santa Monica Mountains with the associated hilly terrain, mountain and ocean views and moderate climate. Open space and recreational opportunities are abound with considerable local acreage dedicated as national and state parkland via the 244.5 square mile Santa Monica Mountains National Recreation Area. Beaches lie within minutes of any location in the area. Varied academic institutions are proximate and easily accessible, including Pepperdine University's Malibu campus, California Lutheran University in Thousand Oaks, and California State University, Northridge. The service area contains some of the highest assessed values for property in the county. All are relatively new communities with recent infrastructure and an award-winning, highly sought school system. More than 80% of local housing is single-family dwellings, in sharp contrast to the countywide average of 56%. Median home prices in the District considerably exceed county averages. New businesses are taking over the commercial spaces vacated during the last five years at an increasing rate, and most commercial and retail businesses are doing better than those in other areas. The District has no major industrial customers. Primarily residential, LVMWD is also a home to notable corporations and commercial activities. Located within the service area are several significant employers including Las Virgenes Unified School District, Bank of America Home Loans, the national headquarters of The Cheesecake Factory, Four Seasons Hotel, Move, Inc., iPayment, Inc., Dole Food Company, and Viewpoint Education Foundation. There has been significant retail growth along the freeway corridor, most notably in Westlake Village. Shopping areas, such as The Commons in Calabasas and Shoppes at Westlake, reflect the taste and demographics of the population they serve.
iii
Financial Condition and Outlook Over recent years, the District successfully weathered the financial downturn and subsequent multi-year drought through prudent management of its resources, minimizing employee compensation increases and eliminating and downgrading positions. The District has also been successful at minimizing impacts to ratepayers by utilizing working capital for major construction projects. Although the overall financial position of the District is stable, the economic downturn and the multi-year drought have impacted operations and water sales. Potable water production during Fiscal Year 2015-16 was reduced 17% from Fiscal Year 2014-15. Production of recycled water during the same period was reduced by 7.5%. These reductions were anticipated in the Fiscal Year 2015-16 budget that utilized $2.7 million in Rate Stabilization Funds to minimize the short-term impact to ratepayers from the corresponding reduction in water sales. If the drought continues into Fiscal Year 2016-17, the District may face increasing revenue pressure associated with reductions in water use and sales. Long Term Financial Planning On July 8, 2014, the Board approved an agreement with Raftelis Financial Consultants, Inc. to complete a comprehensive financial analysis, cost of service, and rate study. On October 26, 2015, the Board approved a five-year rate plan for all three District enterprises (potable water, recycled water, and sanitation), which adjusts rates each January 1st from 2016 through 2020. At the same time, the Board adopted a new water budget-based rate structure that increases financial stability and encourages efficient water use. Under water budgets, customers are allocated a budget based on several, state and scientifically-supported factors including number of persons per household, landscape area, and an evapotranspiration factor to account for each day’s weather condition. The Board also adopted a strategy that increases the recovery of fixed cost through fixed fees by increasing the “readiness to serve” charge each year over the five-year period and by implementing a new readiness to serve charge for recycled water service. Relevant financial policies Since 1999, the District has utilized a broad-based set of Board-adopted financial policies to guide it in making important financial decisions. The policies are reviewed and updated periodically to address changing conditions and adopted annually as an integral part of the budget. On July 14, 2015, the Board adopted revised Financial Policies that modified reserve requirements related to capital projects, specified an $8 million target for the Rate Stabilization Fund, and clarified the District’s source of funds for insurance claims under the self-insured retention limit. Major Initiatives During Fiscal Year 2015-16, the District continued its work on the multi- year, $29 million Backbone Improvements Program. This program, which included completion of transmission main improvements in Calabasas and a five-million gallon tank in Westlake Village, continued in Fiscal Year 2015-16 with the start of construction of improvements to the District’s Westlake Pump Station and Filtration Plant. These projects, when completed, will improve system reliability by modernizing and expanding facilities to better meet current and future demands.
iv
The District also supported the Las Virgenes – Triunfo Joint Powers Authority in an extensive stakeholder-driven process to identify the best means to maximize the beneficial reuse of treated effluent from the Tapia Water Reclamation Facility. During Fiscal Year 2015-16, numerous stakeholder workshops were held to explore options including building seasonal storage for recycled water, repurposing Los Angeles Department of Water and Power’s Encino Reservoir to store recycled water, enhancing the treatment process for effluent discharged to Malibu Creek, and implementing potable reuse. The project ultimately developed as a result of this process has the potential to impact all three District enterprises. Awards The Government Finance Officers Association of the United States and Canada (GFOA) awarded LVMWD the Certificate of Achievement for Excellence in Financial Reporting for its Comprehensive Annual Financial Report for the Fiscal Year ended June 30, 2015. This was the 18th consecutive year that LVMWD received this prestigious award. In order to be awarded a Certificate of Achievement, a government agency must publish an easily readable and efficiently organized comprehensive annual financial report that satisfies both generally accepted accounting principles and applicable legal requirements. A Certificate of Achievement is only valid for a period of one year. Staff believes that its current comprehensive annual financial report continues to meet the Certificate of Achievement Program’s requirements and will submit it to the GFOA to determine its eligibility for another certificate. In addition, LVMWD also received the GFOA’s Distinguished Budget Presentation Award for its annual budget document and the Award for Outstanding Achievement in Popular Annual Financial Reporting in fiscal year 2014-15. The District posts all of its financial documents on its public website at http://www.lvmwd.com/about-us/adopted-budget-and-annual-financial-reports. Acknowledgements The preparation and development of this report would not have been possible without the year-round work of the Finance Division staff and their special efforts, working in conjunction with the District’s independent auditors. We would also like to thank the Board for its continued interest and support in managing the District’s financial resources in a responsible manner that ensures transparency and proper stewardship of ratepayer’s money. Respectfully submitted,
David W. Pedersen General Manager
Donald Patterson Director of Finance & Administration
v
Revised June 30, 2015
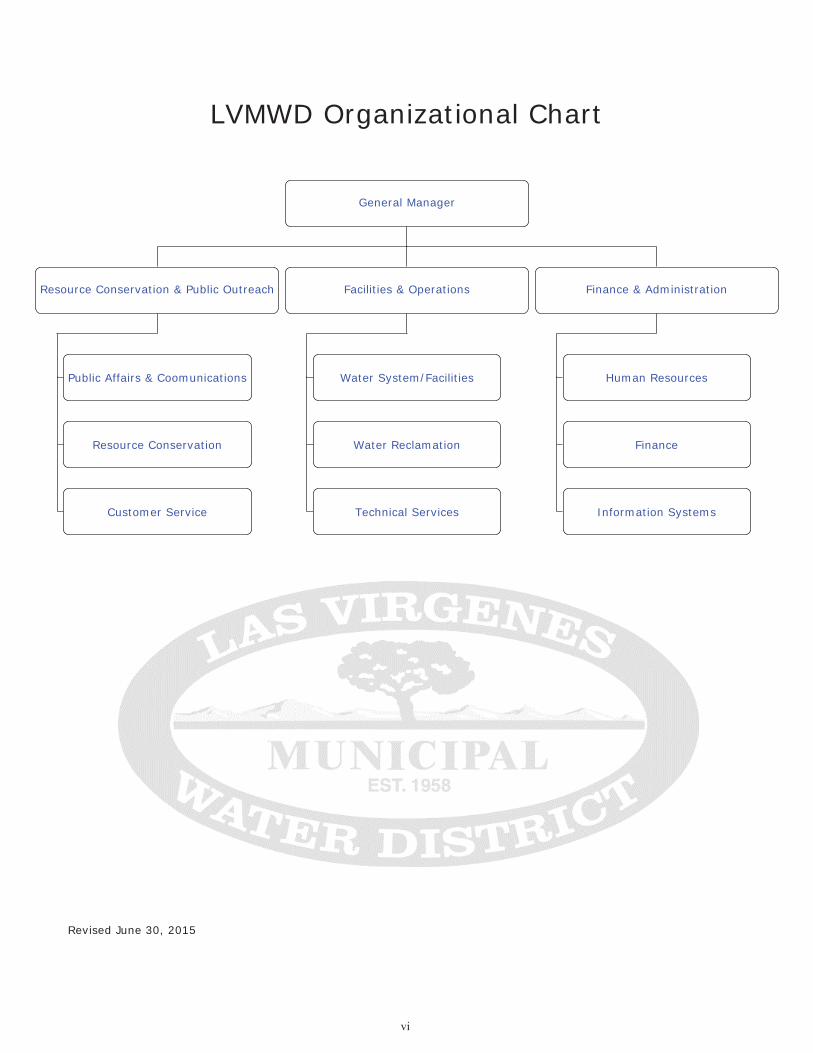
LVMWD Organizational Chart
General Manager
Resource Conservation & Public Outreach
Public Affairs & Coomunications
Resource Conservation
Customer Service
Facilities & Operations
Water System/Facilities
Water Reclamation
Technical Services
Finance & Administration
Human Resources
Finance
Information Systems
vi
vii

viii
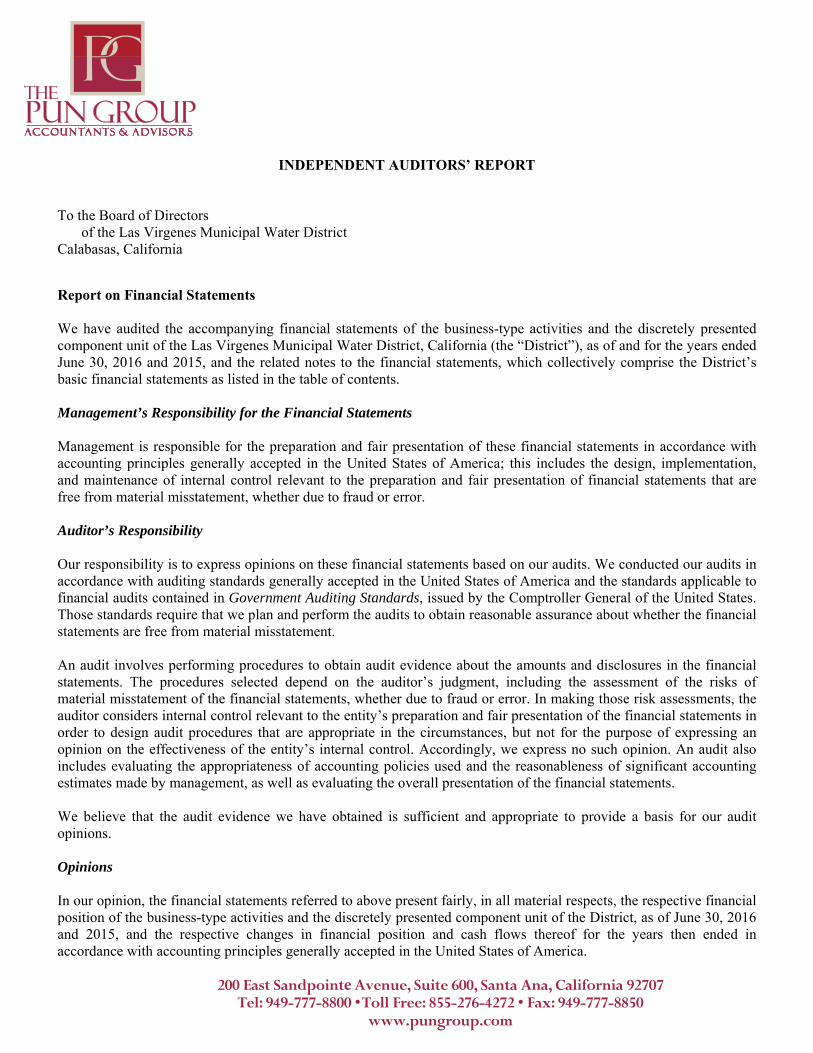
INDEPENDENT AUDITORS’ REPORT
To the Board of Directors
of the Las Virgenes Municipal Water District Calabasas, California
Report on Financial Statements We have audited the accompanying financial statements of the business-type activities and the discretely presented component unit of the Las Virgenes Municipal Water District, California (the “District”), as of and for the years ended June 30, 2016 and 2015, and the related notes to the financial statements, which collectively comprise the District’s basic financial statements as listed in the table of contents. Management’s Responsibility for the Financial Statements Management is responsible for the preparation and fair presentation of these financial statements in accordance with accounting principles generally accepted in the United States of America; this includes the design, implementation, and maintenance of internal control relevant to the preparation and fair presentation of financial statements that are free from material misstatement, whether due to fraud or error. Auditor’s Responsibility Our responsibility is to express opinions on these financial statements based on our audits. We conducted our audits in accordance with auditing standards generally accepted in the United States of America and the standards applicable to financial audits contained in Government Auditing Standards, issued by the Comptroller General of the United States. Those standards require that we plan and perform the audits to obtain reasonable assurance about whether the financial statements are free from material misstatement. An audit involves performing procedures to obtain audit evidence about the amounts and disclosures in the financial statements. The procedures selected depend on the auditor’s judgment, including the assessment of the risks of material misstatement of the financial statements, whether due to fraud or error. In making those risk assessments, the auditor considers internal control relevant to the entity’s preparation and fair presentation of the financial statements in order to design audit procedures that are appropriate in the circumstances, but not for the purpose of expressing an opinion on the effectiveness of the entity’s internal control. Accordingly, we express no such opinion. An audit also includes evaluating the appropriateness of accounting policies used and the reasonableness of significant accounting estimates made by management, as well as evaluating the overall presentation of the financial statements. We believe that the audit evidence we have obtained is sufficient and appropriate to provide a basis for our audit opinions. Opinions In our opinion, the financial statements referred to above present fairly, in all material respects, the respective financial position of the business-type activities and the discretely presented component unit of the District, as of June 30, 2016 and 2015, and the respective changes in financial position and cash flows thereof for the years then ended in accordance with accounting principles generally accepted in the United States of America.
200 East Sandpointe Avenue, Suite 600, Santa Ana, California 92707 Tel: 949-777-8800 • Toll Free: 855-276-4272 • Fax: 949-777-8850
www.pungroup.com
3939352 Pun & McGeady_L_final.pdf 1 1/14/14 3:48 PM
To the Board of Directors of the Las Virgenes Municipal Water District
Calabasas, California Page 2
2
Other Matters Required Supplementary Information Accounting principles generally accepted in the United States of America require that the Management’s Discussion and Analysis, the Schedule of Changes in Net Pension Liability and Related Ratios for CalPERS Pension Plan, the Schedule of Contribution – CalPERS Pension Plan, and the Schedules of Funding Progress for Other Post-Employment Benefits plan on pages 5 through 11 and 53 through 55, be presented to supplement the basic financial statements. Such information, although not a part of the basic financial statements, is required by the Governmental Accounting Standards Board who considers it to be an essential part of financial reporting for placing the basic financial statements in an appropriate operational, economic, or historical context. We have applied certain limited procedures to the required supplementary information in accordance with auditing standards generally accepted in the United States of America, which consisted of inquiries of management about the methods of preparing the information and comparing the information for consistency with management’s responses to our inquiries, the basic financial statements, and other knowledge we obtained during our audit of the basic financial statements. We do not express an opinion or provide any assurance on the information because the limited procedures do not provide us with sufficient evidence to express an opinion or provide any assurance. Other Information Our audits were conducted for the purpose of forming opinions on the financial statements that collectively comprise the District’s basic financial statements. The Introductory and Statistical Sections are presented for purposes of additional analysis and are not a required part of the basic financial statements. The Introductory and Statistical Sections have not been subjected to the auditing procedures applied in the audit of the basic financial statements, and accordingly, we do not express an opinion or provide any assurance on them. Other Reporting Required by Government Auditing Standards In accordance with Government Auditing Standards, we have also issued our report dated October 31, 2016 on our consideration of the District’s internal control over financial reporting and on our tests of its compliance with certain provisions of laws, regulations, contracts, and grant agreements and other matters. The purpose of that report is to describe the scope of our testing of internal control over financial reporting and compliance and the results of that testing, and not to provide an opinion on internal control over financial reporting or on compliance. That report is an integral part of an audit performed in accordance with Government Auditing Standards in considering the District’s internal control over financial reporting and compliance.
Santa Ana, California Kenneth H. Pun, CPA, CGMA October 31, 2016 CPA Number: 88316
REPORT ON INTERNAL CONTROL OVER FINANCIAL REPORTING AND ON COMPLIANCE AND OTHER MATTERS BASED ON AN AUDIT OF FINANCIAL STATEMENTS PERFORMED IN
ACCORDANCE WITH GOVERNMENT AUDITING STANDARDS
Independent Auditors’ Report
To the Board of Directors
of the Las Virgenes Municipal Water District Calabasas, California We have audited, in accordance with the auditing standards generally accepted in the United States of America and the standards applicable to financial audits contained in Government Auditing Standards issued by the Comptroller General of the United States, the financial statements of the business-type activities and the discretely presented component unit of the Las Virgenes Municipal Water District, California (the “District”), as of and for the years ended June 30, 2016 and 2015, and the related notes to the financial statements, which collectively comprise the District’s basic financial statements, and have issued our report thereon dated October 31, 2016. Internal Control over Financial Reporting In planning and performing our audits of the financial statements, we considered the District’s internal control over financial reporting (“internal control”) to determine the audit procedures that are appropriate in the circumstances for the purpose of expressing our opinions on the financial statements, but not for the purpose of expressing an opinion on the effectiveness of the District’s internal control. Accordingly, we do not express an opinion on the effectiveness of the District’s internal control. A deficiency in internal control exists when the design or operation of a control does not allow management or employees, in the normal course of performing their assigned functions, to prevent, or detect and correct, misstatements on a timely basis. A material weakness is a deficiency, or a combination of deficiencies, in internal control, such that there is a reasonable possibility that a material misstatement of the entity’s financial statements will not be prevented, or detected and corrected on a timely basis. A significant deficiency is a deficiency, or a combination of deficiencies, in internal control that is less severe than a material weakness, yet important enough to merit attention by those charged with governance. Our consideration of internal control was for the limited purpose described in the first paragraph of this section and was not designed to identify all deficiencies in internal control that might be material weaknesses or significant deficiencies. Given these limitations, during our audit we did not identify any deficiencies in internal control that we consider to be material weaknesses. However, material weaknesses may exist that have not been identified. Compliance and Other Matters As part of obtaining reasonable assurance about whether the District’s financial statements are free from material misstatement, we performed tests of its compliance with certain provisions of laws, regulations, contracts, and grant agreements, noncompliance with which could have a direct and material effect on the determination of financial statement amounts. However, providing an opinion on compliance with those provisions was not an objective of our audit, and accordingly, we do not express such an opinion. The results of our tests disclosed no instances of noncompliance or other matters that are required to be reported under Government Auditing Standards.
200 East Sandpointe Avenue, Suite 600, Santa Ana, California 92707 Tel: 949-777-8800 • Toll Free: 855-276-4272 • Fax: 949-777-8850
www.pungroup.com
3939352 Pun & McGeady_L_final.pdf 1 1/14/14 3:48 PM
To the Board of Directors of the Las Virgenes Municipal Water District
Calabasas, California Page 2
4
Purpose of this Report The purpose of this report is solely to describe the scope of our testing of internal control and compliance and the results of that testing, and not to provide an opinion on the effectiveness of the entity’s internal control or on compliance. This report is an integral part of an audit performed in accordance with Government Auditing Standards in considering the entity’s internal control and compliance. Accordingly, this communication is not suitable for any other purpose.
Santa Ana, California Kenneth H. Pun, CPA, CGMA October 31, 2016 CPA Number: 88316
5
LAS VIRGENES MUNICIPAL WATER DISTRICT
MANAGEMENT’S DISCUSSION AND ANALYSIS
JUNE 30, 2016 and 2015
This section of the District’s annual financial report presents management’s analysis of the District’s financial performance during the Fiscal Years that ended on June 30, 2016 and 2015. Please read it in conjunction with the Financial Statements, which follow this section. FINANCIAL HIGHLIGHTS
The District’s 2016 net position increased by $0.8 million to $215.1 million, while the 2015 net position decreased by $0.3 million to $214.3 million
During FY 2016, the District’s revenues decreased by 4.5% to $55.3 million, while
expenses decreased by 7.3% to $54.9 million. During FY 2015, the District’s revenues decreased by 4.5% to $57.9 million, while expenses increased by 0.7% to $59.2 million.
In FY 2016, capital contributions to the District decreased to $0.4 million or 62% less than FY 2015. In FY 2015, capital contributions to the District decreased to $1.0 million or 36% less than FY 2014.
OVERVIEW OF THE FINANCIAL STATEMENTS The discussion and analysis serves as an introduction to Las Virgenes Municipal Water District’s basic financial statements. The District’s basic financial statements are comprised of two components: Financial Statements and Notes to the Financial Statements. This report also contains other supplementary information in addition to the basic financial statements themselves. CHANGES TO THE FINANCIAL STATEMENTS Governmental Accounting Standards Board (GASB) Statement 72 GASB 72, dated November 2015, was issued to improve the comparability of financial statements between different agencies by requiring the measurement of certain assets, such as investments, at fair value should the asset be sold. Implementation of GASB 72 had minimum impact on the Financial Statements of the District due to the nature of the District’s assets. BASIC FINANCIAL STATEMENTS Because the District is comprised of three business type enterprises, potable water, recycled water, and sanitation, the Financial Statements of the District report information about the District using accounting methods similar to those used by private sector companies. These statements offer short- and long-term financial information about its activities. The Statement of Net Position includes all of the District’s assets, deferred outflow of resources, liabilities and provides information about the nature and amounts of investments in resources (assets) and the obligations to District creditors (liabilities). It also provides the basis for computing rate of return, evaluating the capital structure of the District and assessing the liquidity and financial flexibility of the District.
6
All of the current year’s revenues and expenses are accounted for in the Statements of Revenues, Expenses and Changes in Net Position. This statement measures the success of the District’s operations over the past year and can be used to determine the District’s credit worthiness and whether the District has successfully recovered all its costs through its user fees and other charges. The final required Financial Statement is the Statement of Cash Flows. The primary purpose of this statement is to provide information about the District’s cash receipts and cash payments during the reporting period. The statement reports cash receipts, cash payments, and net changes in cash resulting from operations and investments. It also provides answers to such questions as where did cash come from, what was cash used for, and what was the change in cash balance during the reporting period. FINANCIAL ANALYSIS OF THE DISTRICT The analysis of the District begins on with the Financial Statements. The statements provide information on whether the District, as a whole, is in a stronger or weaker financial position compared to the last year. The Statement of Net Position and the Statement of Revenues, Expenses, and Changes in Net Position provide a means to measure the District’s financial health or financial position. Over time, increases or decreases in the District’s net position are one indicator of whether its financial health is improving or deteriorating. However, you will need to consider other non-financial factors such as changes in economic conditions, population growth, zoning, and new or changed government legislation. Fiscal Year 2014-15 saw the beginning of water conservations and other increased conservation measures resulting from the continuing drought. Fiscal Year 2015-16 saw a continuation of water restrictions and other increased conservation measures as the State’s drought entered its fifth year. Additionally, in January 2016, the District implemented a new water budget based rate structure that provides water budgets based on specific factors such as number of people in the household, landscape area, and evapotranspiration rates. This new rate structure also increases the portion of the District’s fixed cost recovered through its fixed fees which should improve long term financial resiliency by reducing the District’s dependence on water sales to cover its fixed cost necessary to provide reliable service. These factors contributed to changes in the District’s net position noted below. Las Virgenes Municipal Water District operates a Joint Powers Authority (JPA) with Triunfo Sanitation District for the transmission and treatment of sanitation. In conformance with GASB 61, the JPA is presented in the District’s Financial Statements as a Discretely Presented Component Unit. The JPA annually issues an Independent Auditors’ Report and Financial Statements that includes a Management Discussion and Analysis. It is recommended to review this document for additional information on the financial condition of the JPA.
7
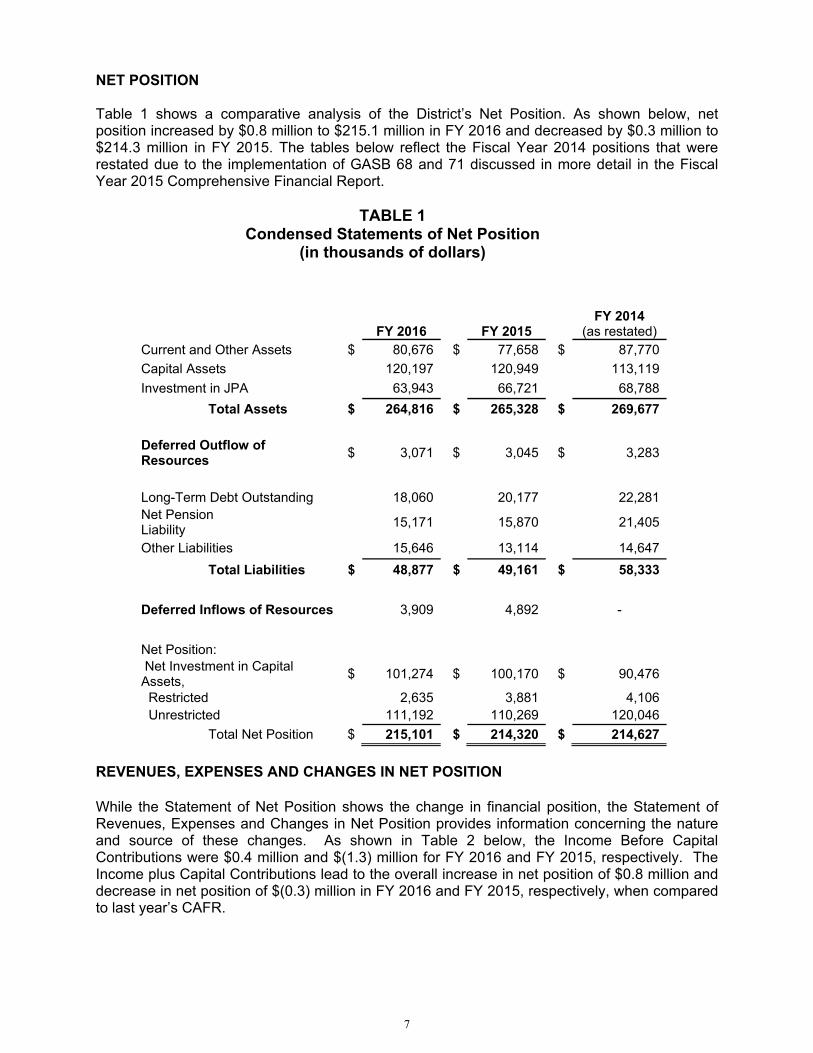
NET POSITION Table 1 shows a comparative analysis of the District’s Net Position. As shown below, net position increased by $0.8 million to $215.1 million in FY 2016 and decreased by $0.3 million to $214.3 million in FY 2015. The tables below reflect the Fiscal Year 2014 positions that were restated due to the implementation of GASB 68 and 71 discussed in more detail in the Fiscal Year 2015 Comprehensive Financial Report.
TABLE 1 Condensed Statements of Net Position
(in thousands of dollars)
FY 2016 FY 2015 FY 2014
(as restated) Current and Other Assets $ 80,676 $ 77,658 $ 87,770Capital Assets 120,197 120,949 113,119Investment in JPA 63,943 66,721 68,788
Total Assets $ 264,816 $ 265,328 $ 269,677
Deferred Outflow of Resources $ 3,071 $ 3,045 $ 3,283
Long-Term Debt Outstanding 18,060 20,177 22,281Net Pension Liability
15,171 15,870 21,405
Other Liabilities 15,646 13,114 14,647Total Liabilities $ 48,877 $ 49,161 $ 58,333
Deferred Inflows of Resources 3,909 4,892 -
Net Position: Net Investment in Capital Assets, $ 101,274 $ 100,170 $ 90,476
Restricted 2,635 3,881 4,106 Unrestricted 111,192 110,269 120,046
Total Net Position $ 215,101 $ 214,320 $ 214,627 REVENUES, EXPENSES AND CHANGES IN NET POSITION While the Statement of Net Position shows the change in financial position, the Statement of Revenues, Expenses and Changes in Net Position provides information concerning the nature and source of these changes. As shown in Table 2 below, the Income Before Capital Contributions were $0.4 million and $(1.3) million for FY 2016 and FY 2015, respectively. The Income plus Capital Contributions lead to the overall increase in net position of $0.8 million and decrease in net position of $(0.3) million in FY 2016 and FY 2015, respectively, when compared to last year’s CAFR.
8
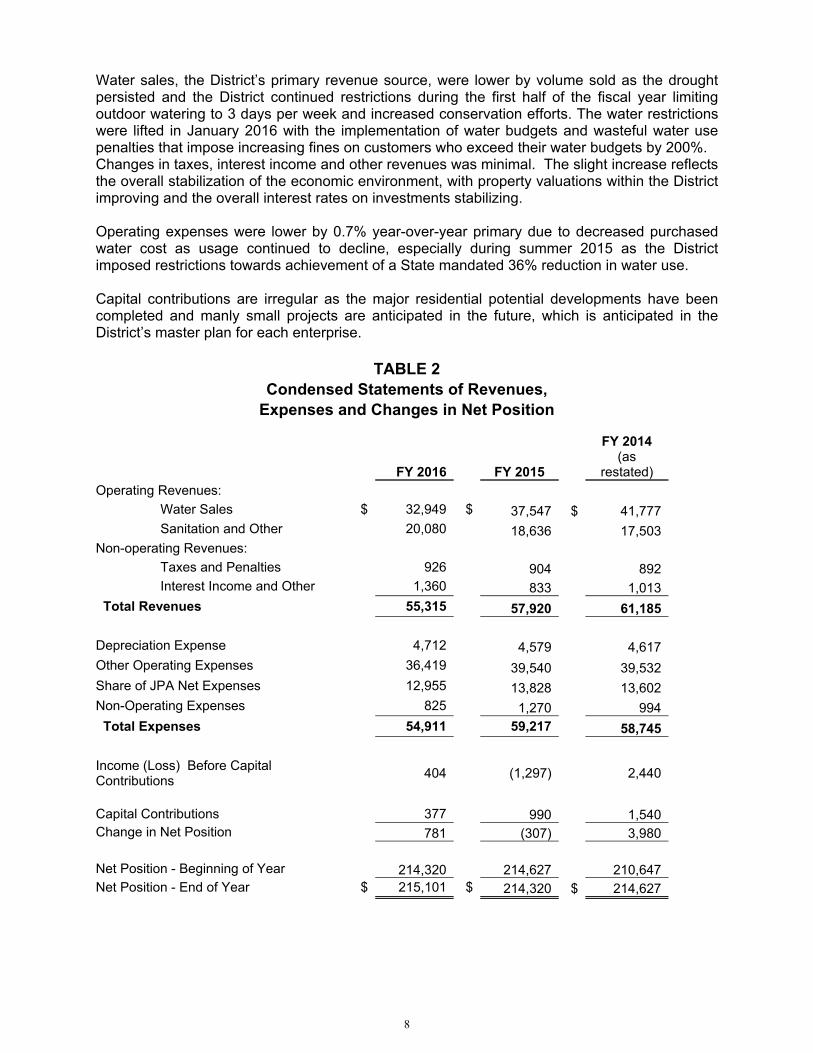
Water sales, the District’s primary revenue source, were lower by volume sold as the drought persisted and the District continued restrictions during the first half of the fiscal year limiting outdoor watering to 3 days per week and increased conservation efforts. The water restrictions were lifted in January 2016 with the implementation of water budgets and wasteful water use penalties that impose increasing fines on customers who exceed their water budgets by 200%. Changes in taxes, interest income and other revenues was minimal. The slight increase reflects the overall stabilization of the economic environment, with property valuations within the District improving and the overall interest rates on investments stabilizing. Operating expenses were lower by 0.7% year-over-year primary due to decreased purchased water cost as usage continued to decline, especially during summer 2015 as the District imposed restrictions towards achievement of a State mandated 36% reduction in water use. Capital contributions are irregular as the major residential potential developments have been completed and manly small projects are anticipated in the future, which is anticipated in the District’s master plan for each enterprise.
TABLE 2 Condensed Statements of Revenues,
Expenses and Changes in Net Position
FY 2016 FY 2015
FY 2014 (as
restated) Operating Revenues:
Water Sales $ 32,949 $ 37,547 $ 41,777 Sanitation and Other 20,080 18,636 17,503
Non-operating Revenues: Taxes and Penalties 926 904 892 Interest Income and Other 1,360 833 1,013
Total Revenues 55,315 57,920 61,185
Depreciation Expense 4,712 4,579 4,617 Other Operating Expenses 36,419 39,540 39,532 Share of JPA Net Expenses 12,955 13,828 13,602 Non-Operating Expenses 825 1,270 994 Total Expenses 54,911 59,217 58,745
Income (Loss) Before Capital Contributions 404 (1,297) 2,440
Capital Contributions 377 990 1,540 Change in Net Position 781 (307) 3,980
Net Position - Beginning of Year 214,320 214,627 210,647 Net Position - End of Year $ 215,101 $ 214,320 $ 214,627
9
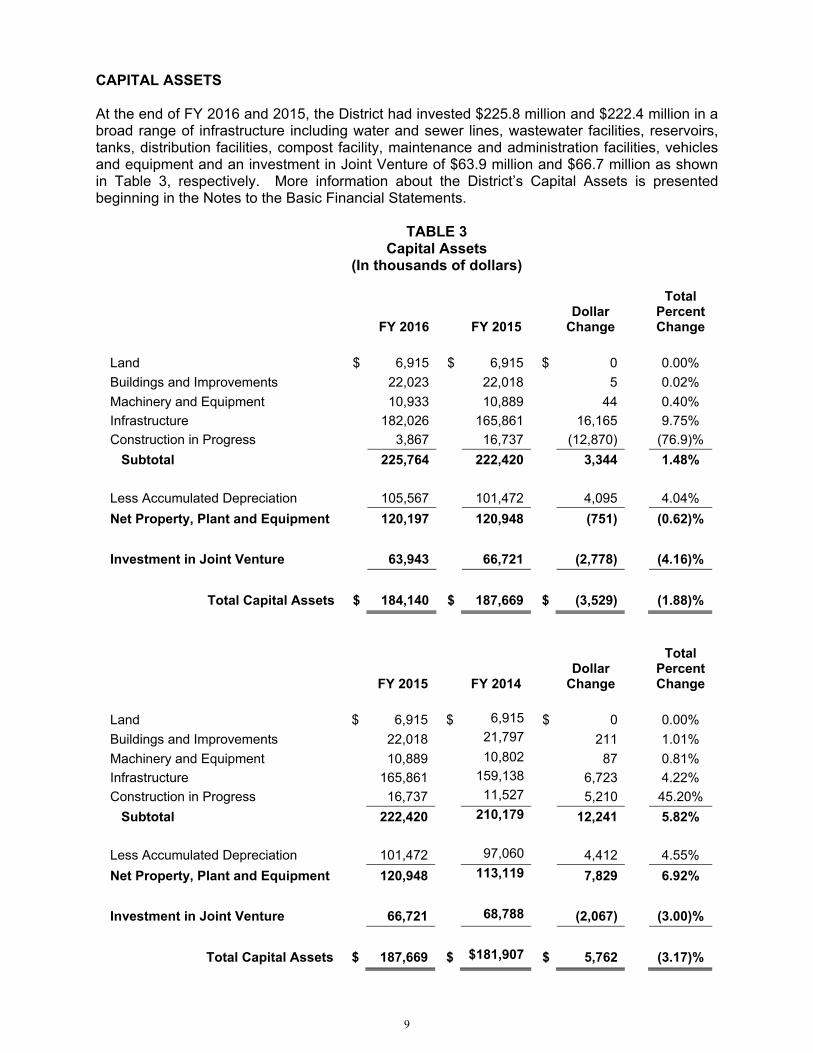
CAPITAL ASSETS At the end of FY 2016 and 2015, the District had invested $225.8 million and $222.4 million in a broad range of infrastructure including water and sewer lines, wastewater facilities, reservoirs, tanks, distribution facilities, compost facility, maintenance and administration facilities, vehicles and equipment and an investment in Joint Venture of $63.9 million and $66.7 million as shown in Table 3, respectively. More information about the District’s Capital Assets is presented beginning in the Notes to the Basic Financial Statements.
TABLE 3 Capital Assets
(In thousands of dollars)
FY 2016 FY 2015
Dollar Change
Total Percent Change
Land $ 6,915 $ 6,915 $ 0 0.00% Buildings and Improvements 22,023 22,018 5 0.02% Machinery and Equipment 10,933 10,889 44 0.40% Infrastructure 182,026 165,861 16,165 9.75% Construction in Progress 3,867 16,737 (12,870) (76.9)% Subtotal 225,764 222,420 3,344 1.48%
Less Accumulated Depreciation 105,567 101,472 4,095 4.04% Net Property, Plant and Equipment 120,197 120,948 (751) (0.62)%
Investment in Joint Venture 63,943 66,721 (2,778) (4.16)%
Total Capital Assets $ 184,140 $ 187,669 $ (3,529) (1.88)%
FY 2015 FY 2014
Dollar Change
Total Percent Change
Land $ 6,915 $ 6,915 $ 0 0.00% Buildings and Improvements 22,018 21,797 211 1.01% Machinery and Equipment 10,889 10,802 87 0.81% Infrastructure 165,861 159,138 6,723 4.22% Construction in Progress 16,737 11,527 5,210 45.20% Subtotal 222,420 210,179 12,241 5.82%
Less Accumulated Depreciation 101,472 97,060 4,412 4.55% Net Property, Plant and Equipment 120,948 113,119 7,829 6.92%
Investment in Joint Venture 66,721 68,788 (2,067) (3.00)%
Total Capital Assets $ 187,669 $ $181,907 $ 5,762 (3.17)%
10
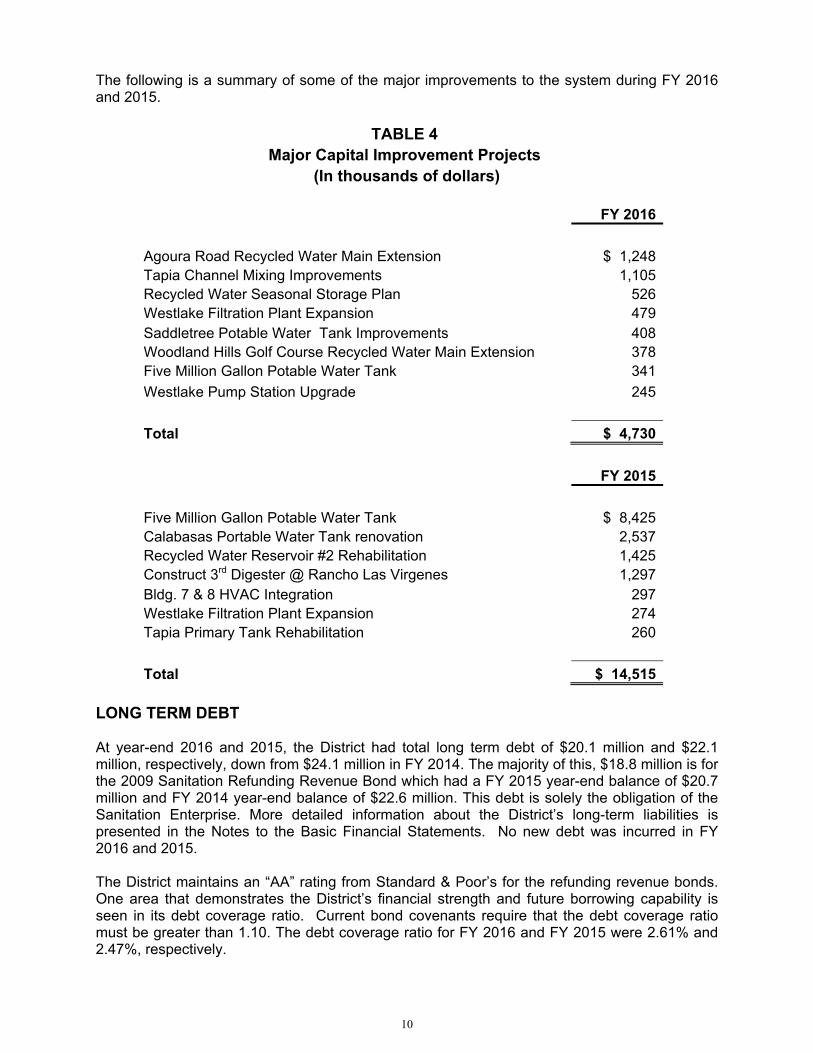
The following is a summary of some of the major improvements to the system during FY 2016 and 2015.
TABLE 4 Major Capital Improvement Projects
(In thousands of dollars)
FY 2016
Agoura Road Recycled Water Main Extension $ 1,248 Tapia Channel Mixing Improvements 1,105 Recycled Water Seasonal Storage Plan 526 Westlake Filtration Plant Expansion 479 Saddletree Potable Water Tank Improvements 408 Woodland Hills Golf Course Recycled Water Main Extension 378 Five Million Gallon Potable Water Tank 341 Westlake Pump Station Upgrade 245
Total $ 4,730
FY 2015
Five Million Gallon Potable Water Tank $ 8,425 Calabasas Portable Water Tank renovation 2,537 Recycled Water Reservoir #2 Rehabilitation 1,425 Construct 3rd Digester @ Rancho Las Virgenes 1,297 Bldg. 7 & 8 HVAC Integration 297 Westlake Filtration Plant Expansion 274 Tapia Primary Tank Rehabilitation 260
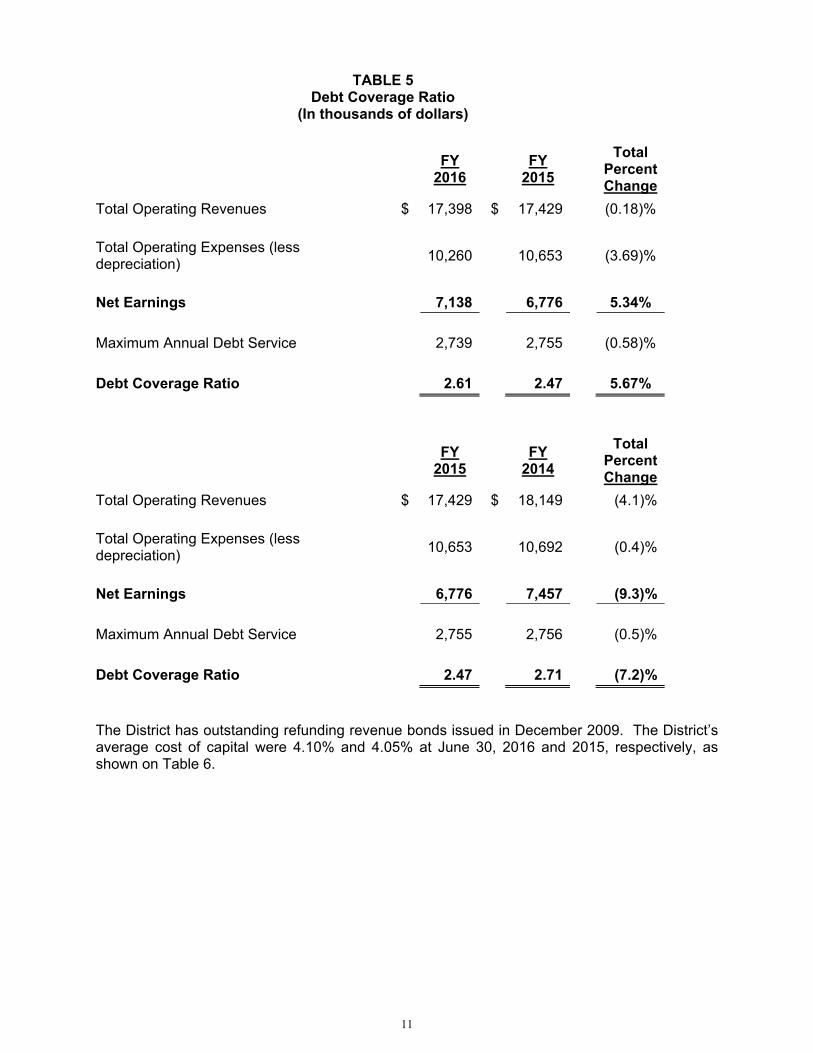
Total $ 14,515 LONG TERM DEBT At year-end 2016 and 2015, the District had total long term debt of $20.1 million and $22.1 million, respectively, down from $24.1 million in FY 2014. The majority of this, $18.8 million is for the 2009 Sanitation Refunding Revenue Bond which had a FY 2015 year-end balance of $20.7 million and FY 2014 year-end balance of $22.6 million. This debt is solely the obligation of the Sanitation Enterprise. More detailed information about the District’s long-term liabilities is presented in the Notes to the Basic Financial Statements. No new debt was incurred in FY 2016 and 2015. The District maintains an “AA” rating from Standard & Poor’s for the refunding revenue bonds. One area that demonstrates the District’s financial strength and future borrowing capability is seen in its debt coverage ratio. Current bond covenants require that the debt coverage ratio must be greater than 1.10. The debt coverage ratio for FY 2016 and FY 2015 were 2.61% and 2.47%, respectively.
11
TABLE 5 Debt Coverage Ratio
(In thousands of dollars)
FY
2016 FY
2015 Total
Percent Change
Total Operating Revenues $ 17,398 $ 17,429 (0.18)%
Total Operating Expenses (less depreciation) 10,260 10,653 (3.69)%
Net Earnings 7,138 6,776 5.34%
Maximum Annual Debt Service 2,739 2,755 (0.58)%
Debt Coverage Ratio 2.61 2.47 5.67%
FY
2015 FY
2014 Total
Percent Change
Total Operating Revenues $ 17,429 $ 18,149 (4.1)%
Total Operating Expenses (less depreciation) 10,653 10,692 (0.4)%
Net Earnings 6,776 7,457 (9.3)%
Maximum Annual Debt Service 2,755 2,756 (0.5)%
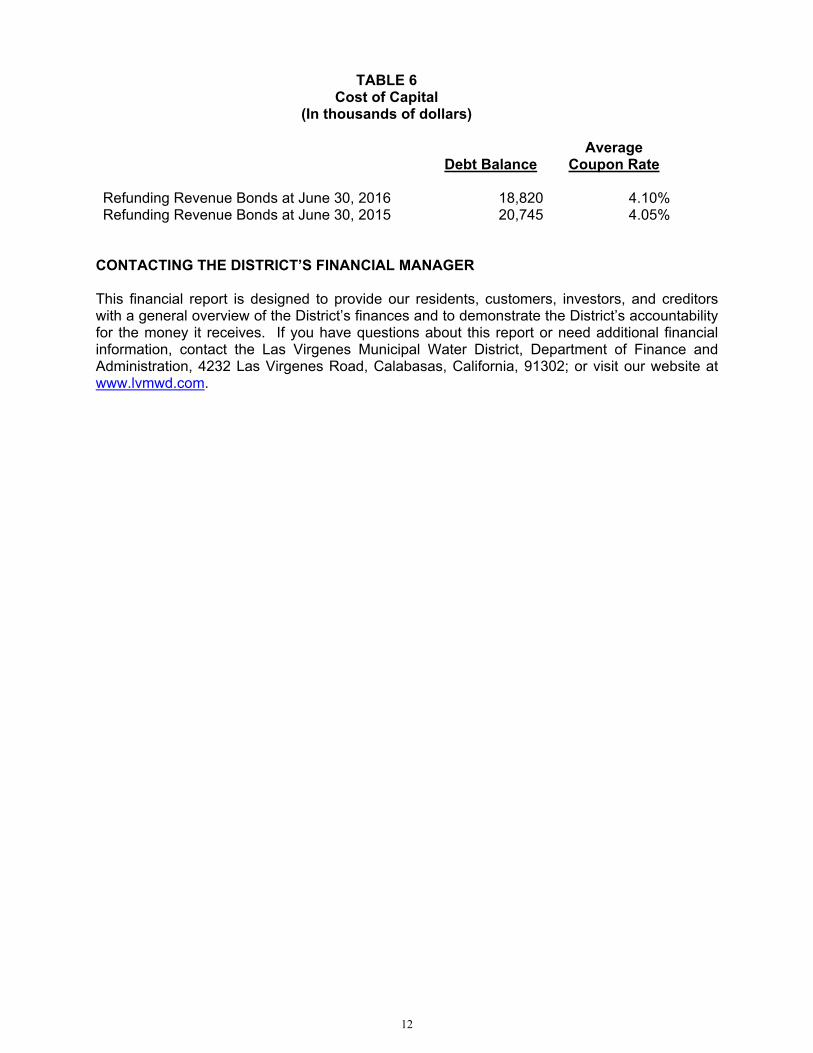
Debt Coverage Ratio 2.47 2.71 (7.2)% The District has outstanding refunding revenue bonds issued in December 2009. The District’s average cost of capital were 4.10% and 4.05% at June 30, 2016 and 2015, respectively, as shown on Table 6.
12
TABLE 6 Cost of Capital
(In thousands of dollars)
Debt Balance Average
Coupon Rate Refunding Revenue Bonds at June 30, 2016 18,820 4.10%Refunding Revenue Bonds at June 30, 2015 20,745 4.05%
CONTACTING THE DISTRICT’S FINANCIAL MANAGER This financial report is designed to provide our residents, customers, investors, and creditors with a general overview of the District’s finances and to demonstrate the District’s accountability for the money it receives. If you have questions about this report or need additional financial information, contact the Las Virgenes Municipal Water District, Department of Finance and Administration, 4232 Las Virgenes Road, Calabasas, California, 91302; or visit our website at www.lvmwd.com.
BASIC FINANCIAL STATEMENTS
13
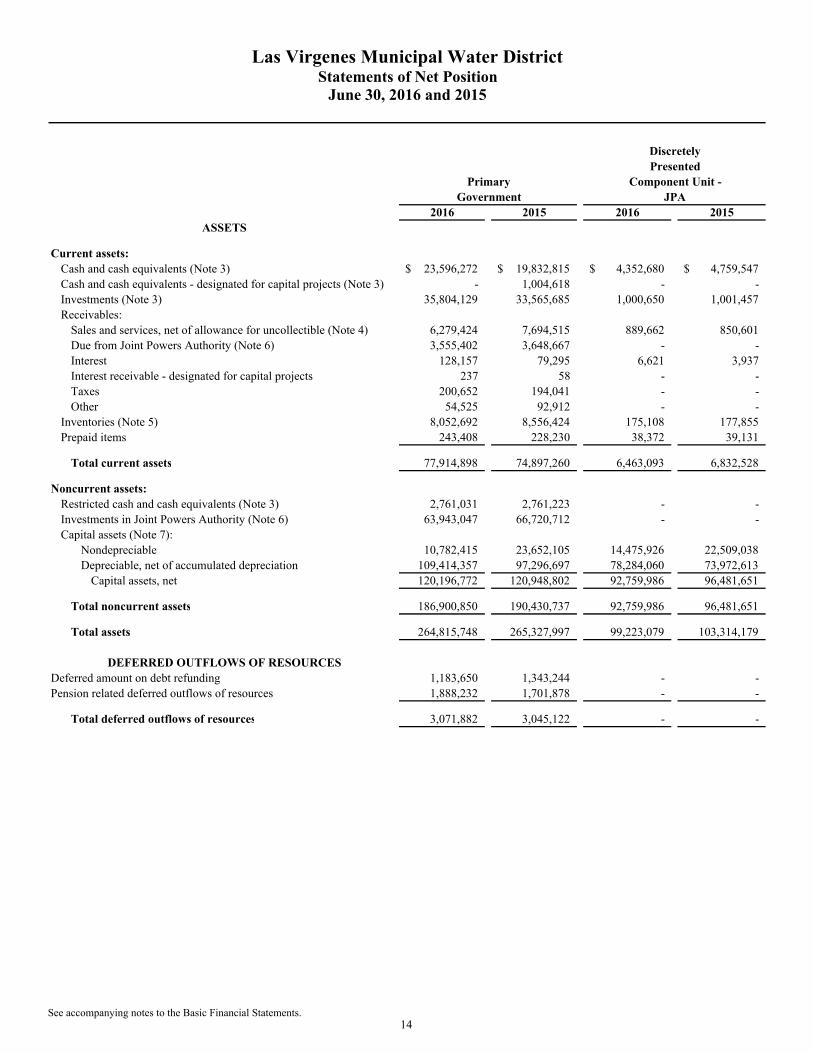
2016 2015 2016 2015ASSETS
Current assets:Cash and cash equivalents (Note 3) 23,596,272$ 19,832,815$ 4,352,680$ 4,759,547$ Cash and cash equivalents - designated for capital projects (Note 3) - 1,004,618 - - Investments (Note 3) 35,804,129 33,565,685 1,000,650 1,001,457 Receivables:
Sales and services, net of allowance for uncollectible (Note 4) 6,279,424 7,694,515 889,662 850,601 Due from Joint Powers Authority (Note 6) 3,555,402 3,648,667 - - Interest 128,157 79,295 6,621 3,937 Interest receivable - designated for capital projects 237 58 - - Taxes 200,652 194,041 - - Other 54,525 92,912 - -
Inventories (Note 5) 8,052,692 8,556,424 175,108 177,855 Prepaid items 243,408 228,230 38,372 39,131
Total current assets 77,914,898 74,897,260 6,463,093 6,832,528
Noncurrent assets:Restricted cash and cash equivalents (Note 3) 2,761,031 2,761,223 - - Investments in Joint Powers Authority (Note 6) 63,943,047 66,720,712 - - Capital assets (Note 7):
Nondepreciable 10,782,415 23,652,105 14,475,926 22,509,038 Depreciable, net of accumulated depreciation 109,414,357 97,296,697 78,284,060 73,972,613
Capital assets, net 120,196,772 120,948,802 92,759,986 96,481,651
Total noncurrent assets 186,900,850 190,430,737 92,759,986 96,481,651
Total assets 264,815,748 265,327,997 99,223,079 103,314,179
DEFERRED OUTFLOWS OF RESOURCESDeferred amount on debt refunding 1,183,650 1,343,244 - - Pension related deferred outflows of resources 1,888,232 1,701,878 - -
Total deferred outflows of resources 3,071,882 3,045,122 - -
June 30, 2016 and 2015Statements of Net Position
Las Virgenes Municipal Water District
DiscretelyPresented
Component Unit -JPA
PrimaryGovernment
See accompanying notes to the Basic Financial Statements.14
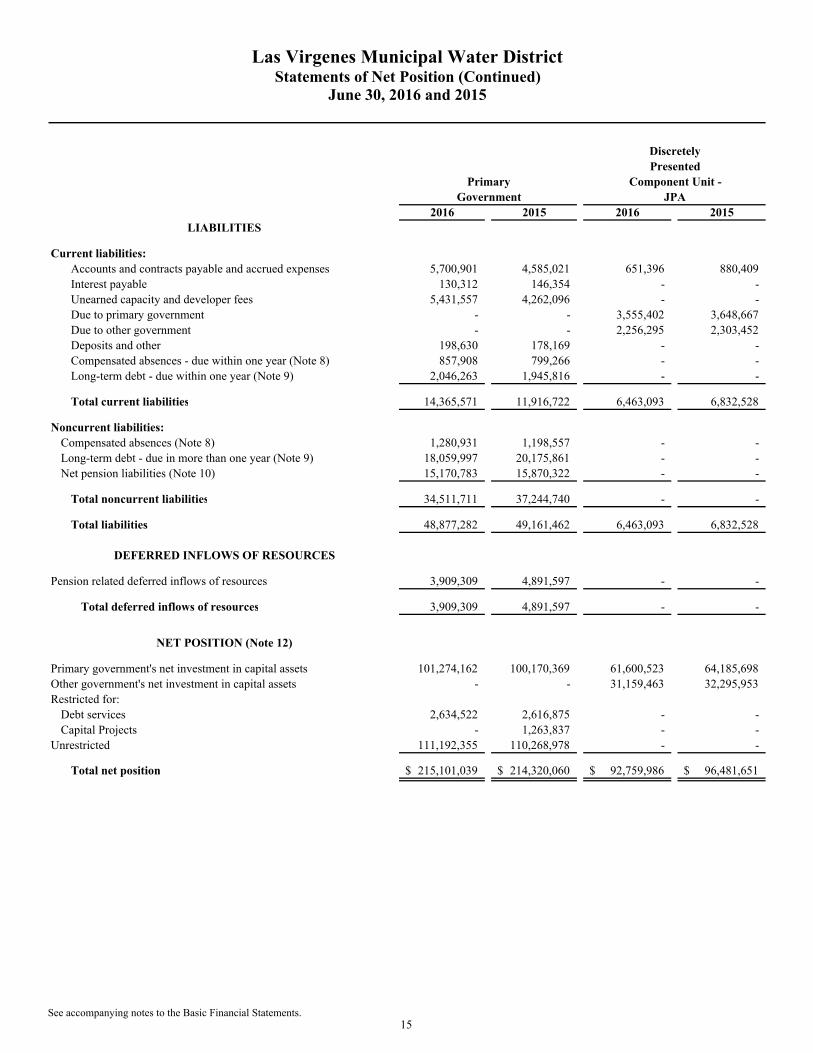
2016 2015 2016 2015LIABILITIES
Current liabilities:Accounts and contracts payable and accrued expenses 5,700,901 4,585,021 651,396 880,409 Interest payable 130,312 146,354 - - Unearned capacity and developer fees 5,431,557 4,262,096 - - Due to primary government - - 3,555,402 3,648,667 Due to other government - - 2,256,295 2,303,452 Deposits and other 198,630 178,169 - - Compensated absences - due within one year (Note 8) 857,908 799,266 - - Long-term debt - due within one year (Note 9) 2,046,263 1,945,816 - -
Total current liabilities 14,365,571 11,916,722 6,463,093 6,832,528
Noncurrent liabilities:Compensated absences (Note 8) 1,280,931 1,198,557 - - Long-term debt - due in more than one year (Note 9) 18,059,997 20,175,861 - - Net pension liabilities (Note 10) 15,170,783 15,870,322 - -
Total noncurrent liabilities 34,511,711 37,244,740 - -
Total liabilities 48,877,282 49,161,462 6,463,093 6,832,528
DEFERRED INFLOWS OF RESOURCES
Pension related deferred inflows of resources 3,909,309 4,891,597 - -
Total deferred inflows of resources 3,909,309 4,891,597 - -
NET POSITION (Note 12)
Primary government's net investment in capital assets 101,274,162 100,170,369 61,600,523 64,185,698 Other government's net investment in capital assets - - 31,159,463 32,295,953 Restricted for:
Debt services 2,634,522 2,616,875 - - Capital Projects - 1,263,837 - -
Unrestricted 111,192,355 110,268,978 - -
Total net position 215,101,039$ 214,320,060$ 92,759,986$ 96,481,651$
DiscretelyPresented
Primary Component Unit -Government JPA
June 30, 2016 and 2015Statements of Net Position (Continued)
Las Virgenes Municipal Water District
See accompanying notes to the Basic Financial Statements.15
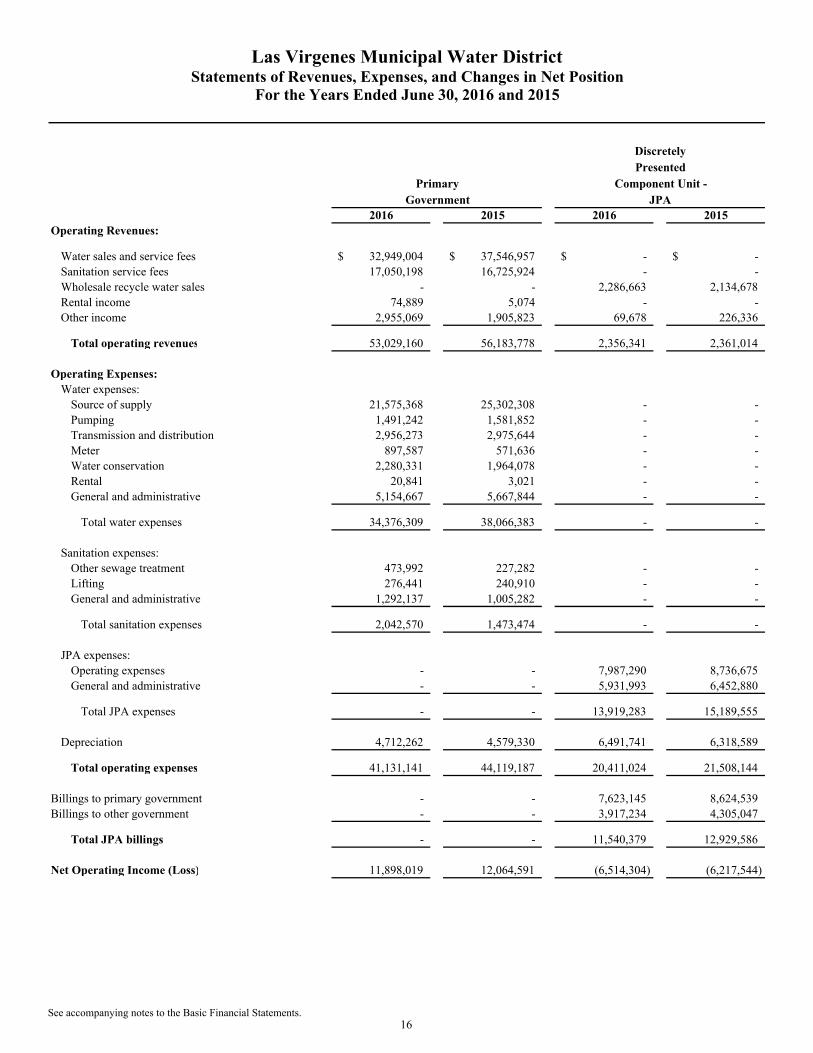
2016 2015 2016 2015Operating Revenues:
Water sales and service fees 32,949,004$ 37,546,957$ -$ -$ Sanitation service fees 17,050,198 16,725,924 - - Wholesale recycle water sales - - 2,286,663 2,134,678 Rental income 74,889 5,074 - - Other income 2,955,069 1,905,823 69,678 226,336
Total operating revenues 53,029,160 56,183,778 2,356,341 2,361,014
Operating Expenses:Water expenses:
Source of supply 21,575,368 25,302,308 - - Pumping 1,491,242 1,581,852 - - Transmission and distribution 2,956,273 2,975,644 - - Meter 897,587 571,636 - - Water conservation 2,280,331 1,964,078 - - Rental 20,841 3,021 - - General and administrative 5,154,667 5,667,844 - -
Total water expenses 34,376,309 38,066,383 - -
Sanitation expenses:Other sewage treatment 473,992 227,282 - - Lifting 276,441 240,910 - - General and administrative 1,292,137 1,005,282 - -
Total sanitation expenses 2,042,570 1,473,474 - -
JPA expenses:Operating expenses - - 7,987,290 8,736,675 General and administrative - - 5,931,993 6,452,880
Total JPA expenses - - 13,919,283 15,189,555
Depreciation 4,712,262 4,579,330 6,491,741 6,318,589
Total operating expenses 41,131,141 44,119,187 20,411,024 21,508,144
Billings to primary government - - 7,623,145 8,624,539 Billings to other government - - 3,917,234 4,305,047
Total JPA billings - - 11,540,379 12,929,586
Net Operating Income (Loss) 11,898,019 12,064,591 (6,514,304) (6,217,544)
PresentedPrimary Component Unit -
Government JPA
Las Virgenes Municipal Water DistrictStatements of Revenues, Expenses, and Changes in Net Position
For the Years Ended June 30, 2016 and 2015
Discretely
See accompanying notes to the Basic Financial Statements.16
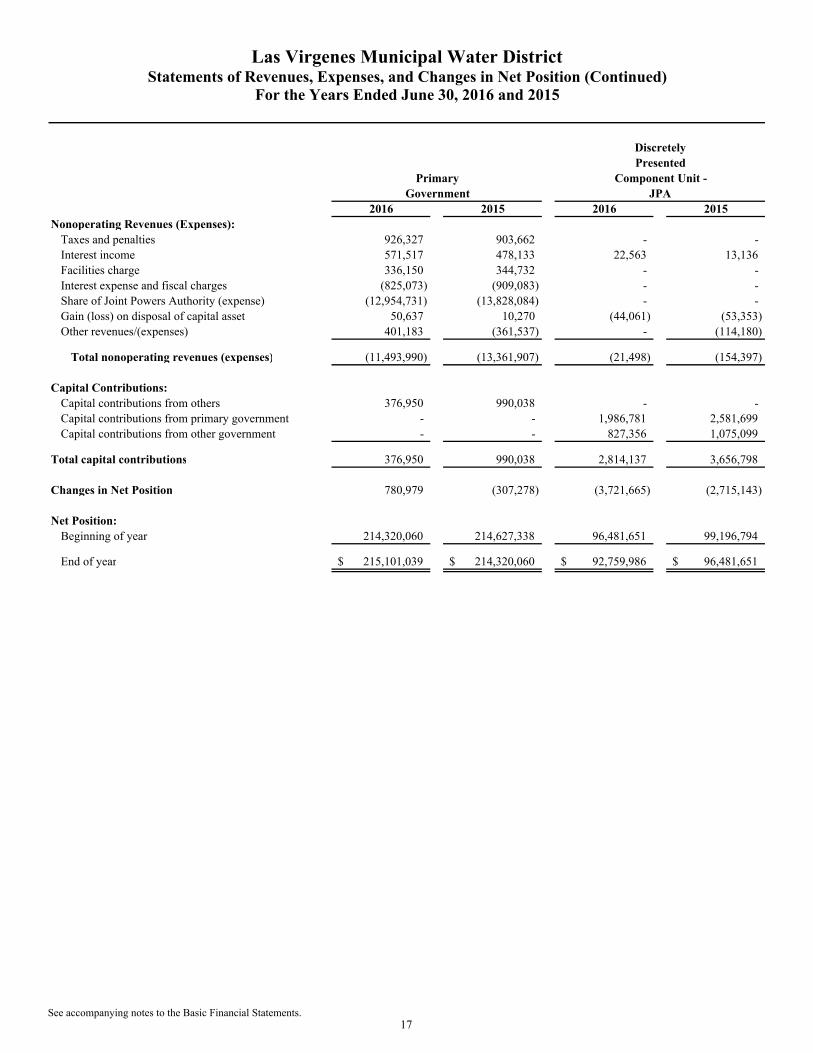
2016 2015 2016 2015Nonoperating Revenues (Expenses):
Taxes and penalties 926,327 903,662 - - Interest income 571,517 478,133 22,563 13,136 Facilities charge 336,150 344,732 - - Interest expense and fiscal charges (825,073) (909,083) - - Share of Joint Powers Authority (expense) (12,954,731) (13,828,084) - - Gain (loss) on disposal of capital asset 50,637 10,270 (44,061) (53,353) Other revenues/(expenses) 401,183 (361,537) - (114,180)
Total nonoperating revenues (expenses) (11,493,990) (13,361,907) (21,498) (154,397)
Capital Contributions:Capital contributions from others 376,950 990,038 - - Capital contributions from primary government - - 1,986,781 2,581,699 Capital contributions from other government - - 827,356 1,075,099
Total capital contributions 376,950 990,038 2,814,137 3,656,798
Changes in Net Position 780,979 (307,278) (3,721,665) (2,715,143)
Net Position:Beginning of year 214,320,060 214,627,338 96,481,651 99,196,794
End of year 215,101,039$ 214,320,060$ 92,759,986$ 96,481,651$
Primary Component Unit -Government JPA
Statements of Revenues, Expenses, and Changes in Net Position (Continued)For the Years Ended June 30, 2016 and 2015
DiscretelyPresented
Las Virgenes Municipal Water District
See accompanying notes to the Basic Financial Statements.17
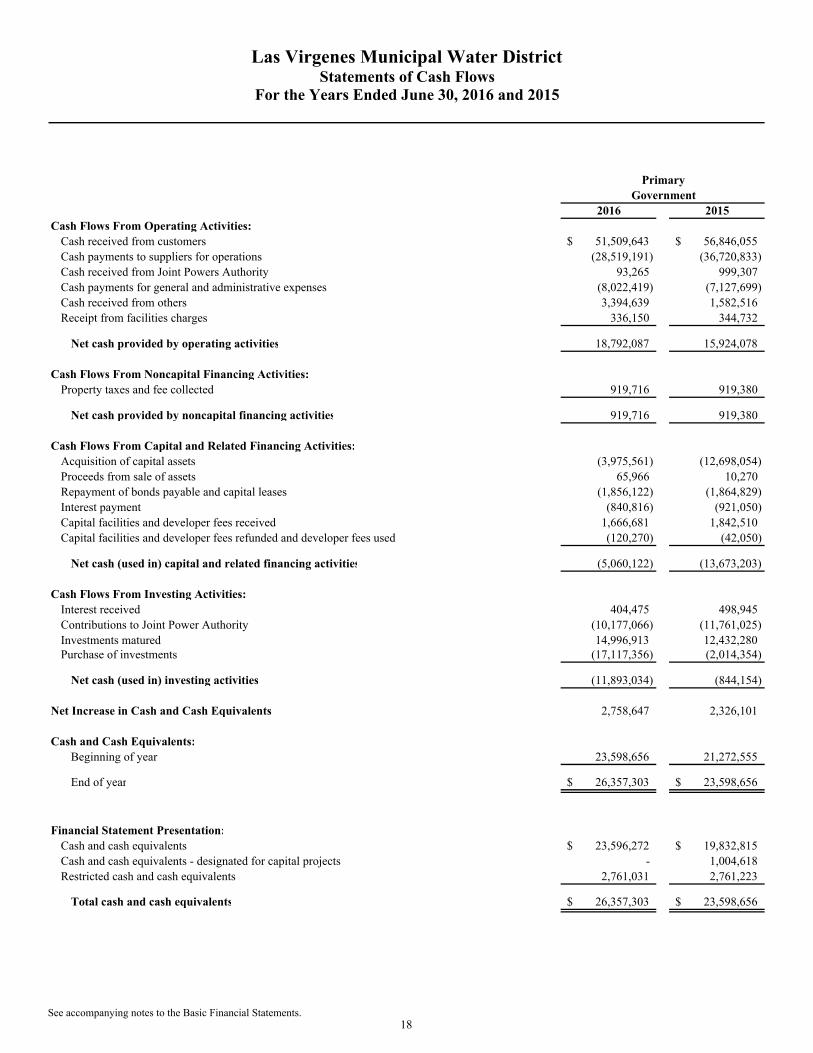
2016 2015Cash Flows From Operating Activities:
Cash received from customers 51,509,643$ 56,846,055$ Cash payments to suppliers for operations (28,519,191) (36,720,833) Cash received from Joint Powers Authority 93,265 999,307 Cash payments for general and administrative expenses (8,022,419) (7,127,699) Cash received from others 3,394,639 1,582,516 Receipt from facilities charges 336,150 344,732
Net cash provided by operating activities 18,792,087 15,924,078
Cash Flows From Noncapital Financing Activities:Property taxes and fee collected 919,716 919,380
Net cash provided by noncapital financing activities 919,716 919,380
Cash Flows From Capital and Related Financing Activities:Acquisition of capital assets (3,975,561) (12,698,054) Proceeds from sale of assets 65,966 10,270 Repayment of bonds payable and capital leases (1,856,122) (1,864,829) Interest payment (840,816) (921,050) Capital facilities and developer fees received 1,666,681 1,842,510 Capital facilities and developer fees refunded and developer fees used (120,270) (42,050)
Net cash (used in) capital and related financing activities (5,060,122) (13,673,203)
Cash Flows From Investing Activities:Interest received 404,475 498,945 Contributions to Joint Power Authority (10,177,066) (11,761,025) Investments matured 14,996,913 12,432,280 Purchase of investments (17,117,356) (2,014,354)
Net cash (used in) investing activities (11,893,034) (844,154)
Net Increase in Cash and Cash Equivalents 2,758,647 2,326,101
Cash and Cash Equivalents:Beginning of year 23,598,656 21,272,555
End of year 26,357,303$ 23,598,656$
Financial Statement Presentation:Cash and cash equivalents 23,596,272$ 19,832,815$ Cash and cash equivalents - designated for capital projects - 1,004,618 Restricted cash and cash equivalents 2,761,031 2,761,223
Total cash and cash equivalents 26,357,303$ 23,598,656$
Las Virgenes Municipal Water DistrictStatements of Cash Flows
For the Years Ended June 30, 2016 and 2015
PrimaryGovernment
See accompanying notes to the Basic Financial Statements.18
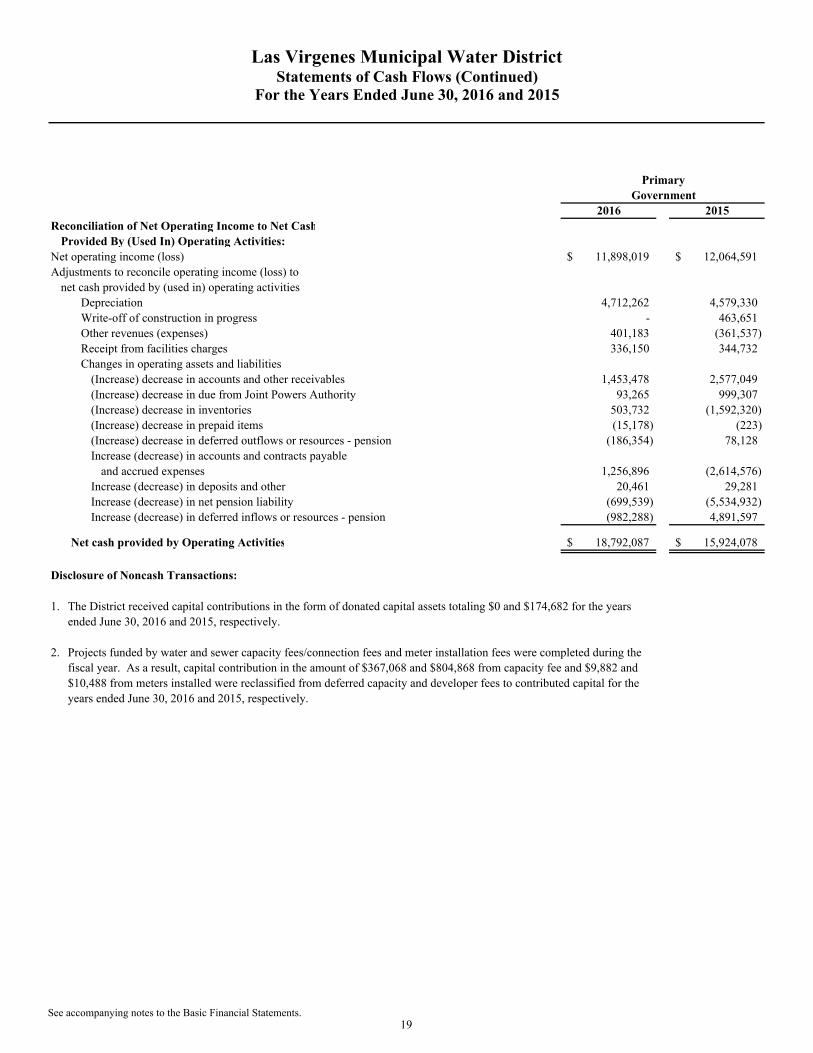
2016 2015Reconciliation of Net Operating Income to Net Cash
Provided By (Used In) Operating Activities:Net operating income (loss) 11,898,019$ 12,064,591$ Adjustments to reconcile operating income (loss) to
net cash provided by (used in) operating activitiesDepreciation 4,712,262 4,579,330 Write-off of construction in progress - 463,651 Other revenues (expenses) 401,183 (361,537) Receipt from facilities charges 336,150 344,732 Changes in operating assets and liabilities
(Increase) decrease in accounts and other receivables 1,453,478 2,577,049 (Increase) decrease in due from Joint Powers Authority 93,265 999,307 (Increase) decrease in inventories 503,732 (1,592,320) (Increase) decrease in prepaid items (15,178) (223) (Increase) decrease in deferred outflows or resources - pension (186,354) 78,128 Increase (decrease) in accounts and contracts payable
and accrued expenses 1,256,896 (2,614,576) Increase (decrease) in deposits and other 20,461 29,281 Increase (decrease) in net pension liability (699,539) (5,534,932) Increase (decrease) in deferred inflows or resources - pension (982,288) 4,891,597
Net cash provided by Operating Activities 18,792,087$ 15,924,078$
Disclosure of Noncash Transactions:
1.
2.
Las Virgenes Municipal Water District
Projects funded by water and sewer capacity fees/connection fees and meter installation fees were completed during the fiscal year. As a result, capital contribution in the amount of $367,068 and $804,868 from capacity fee and $9,882 and $10,488 from meters installed were reclassified from deferred capacity and developer fees to contributed capital for the years ended June 30, 2016 and 2015, respectively.
Statements of Cash Flows (Continued)For the Years Ended June 30, 2016 and 2015
GovernmentPrimary
The District received capital contributions in the form of donated capital assets totaling $0 and $174,682 for the years ended June 30, 2016 and 2015, respectively.
See accompanying notes to the Basic Financial Statements.19

20
Las Virgenes Municipal Water District Notes to the Basic Financial Statements
For the Years Ended June 30, 2016 and 2015
21
Note 1 – Reporting Entity Las Virgenes Municipal Water District (the “District”) is organized under the Municipal Water District Act of 1911 (California Water Code 71000). A five-member board of directors, who are elected by geographic divisions, provide governance. The District was formed to secure a high quality, reliable source of water for areas which include the cities of Agoura Hills, Calabasas, Hidden Hills and Westlake Village, plus surrounding unincorporated portions of western Los Angeles County. Discretely Presented Component Unit The Las Virgenes-Triunfo Joint Powers Authority (“JPA”) was created on October 12, 1964 between the District and Triunfo Sanitation District (“TSD”) for the purpose of constructing, operating, maintaining and providing for the replacement of a joint sewage system to serve the Malibu Canyon drainage area. The JPA consists of ten board members where five of them are the board members of the District and the other five are the board members of TSD. The JPA is fiscally dependent on the District and there is a financial benefit and burden relationship between the District and the JPA. The JPA issues a separate financial report that is available upon request from the District. The financial statements of the JPA are included as a discretely presented component of the District’s financial statements. Note 2 – Summary of Significant Accounting Policies Basis of Presentation Financial statement presentation follows the recommendations promulgated by the Governmental Accounting Standards Board (“GASB”) commonly referred to as accounting principles generally accepted in the United States of America (“U.S. GAAP”). GASB is the accepted standard-setting body for establishing governmental accounting and financial reporting standards. Measurement Focus, Basis of Accounting, and Financial Statement Presentation The financial statements (i.e., the statement of net position, the statement of revenues, expenses and changes in net position, and statement of cash flows) report information on all of the activities of the District. The financial statements are reported using the “economic resources” measurement focus and the accrual basis of accounting. Revenues are recorded when earned and expenses are recorded when a liability is incurred, regardless of the timing of related cash flows. Grants and similar items are recognized as revenue as all eligibility requirements have been met. Interest associated with the current fiscal period is considered to be susceptible to accrual and so has been recognized as revenue of the current fiscal period. In accordance with GASB Statement No. 63, Financial Reporting of Deferred Outflows of Resources, Deferred Inflows of Resources, and Net Position, the Statement of Net Position reports separate sections for Deferred Outflows of Resources, and Deferred Inflows of Resources, when applicable.
Deferred Outflows of Resources represent outflows of resources (consumption of net position) that apply to future periods and that, therefore, will not be recognized as an expense until that time. Deferred Inflows of Resources represent inflows of resources (acquisition of net position) that apply to future periods and that, therefore, are not recognized as a revenue until that time.
Las Virgenes Municipal Water District Notes to the Basic Financial Statements (Continued)
For the Years Ended June 30, 2016 and 2015
22
Note 2 – Summary of Significant Accounting Policies (Continued)
Measurement Focus, Basis of Accounting, and Financial Statement Presentation (Continued)
Operating revenues are those revenues that are generated from the primary operations of the District. The District reports a measure of operations by presenting the change in net assets from operations as "operating income" in the statement of revenues, expenses, and changes in net assets. Operating activities are defined by the District as all activities other than financing and investing activities (interest expense and investment income), grants and subsidies, settlement receivable allowance, and other infrequently occurring transaction of a non-operating nature. Operating expenses are those expenses that are essential to the primary operations of the District. All other expenses are reported as non-operating expenses.
Cash, Cash Equivalents, and Investments
Cash and cash equivalents include all highly liquid investments with original maturities of 90 days or less and are carried at cost, which approximates fair value.
The District participates in an investment pool managed by the State of California titled Local Agency Investment Fund (“LAIF”), which has invested a portion of the pool funds in structured notes and asset-backed securities. LAIF’s investments are subject to credit risk with the full faith and credit of the State of California collateralizing these investments. In addition, these structured notes and assets-backed securities are subject to market risk and to change in interest rates. The reported value of the pool is the same as the fair value of the pool shares.
Certain disclosure requirements, if applicable for deposit and investment risk, are specified for the following areas:
Interest Rate Risk Credit Risk
Overall Custodial Credit Risk Concentration of Credit Risk
Foreign Currency Risk
Restricted Cash and Investments
Cash and investments with fiscal agents are restricted due to limitations on their use by bond covenants or donor limitations. Fiscal agents acting on behalf of the District hold investment funds arising from the proceeds of long-term debt issuances. The funds may be used for specific capital outlays or for the payment of certain bonds, and have been invested only as permitted by specific State statutes or applicable District ordinance, resolution or bond indenture.
Fair Value Measurements
In accordance with GASB Statement No. 72, Fair Value Measurement and Application, defines fair value, establishes a framework for measuring fair value and establishes disclosures about fair value measurement. Investments, unless otherwise specified, recorded at fair value in the Statements of Net Position, are categorized based upon the level of judgment associated with the inputs used to measure their fair value. Levels of inputs are as follows:
Level 1 — Inputs are unadjusted, quoted prices for identical assets and liabilities in active markets at the measurement date.
Level 2 — Inputs, other than quoted prices included in Level 1, that are observable for the asset or liability through corroboration with market data at the measurement date.
Level 3 — Unobservable inputs that reflect management's best estimate of what market participants would use
in pricing the asset or liability at the measurement date.
Las Virgenes Municipal Water District Notes to the Basic Financial Statements (Continued)
For the Years Ended June 30, 2016 and 2015
23
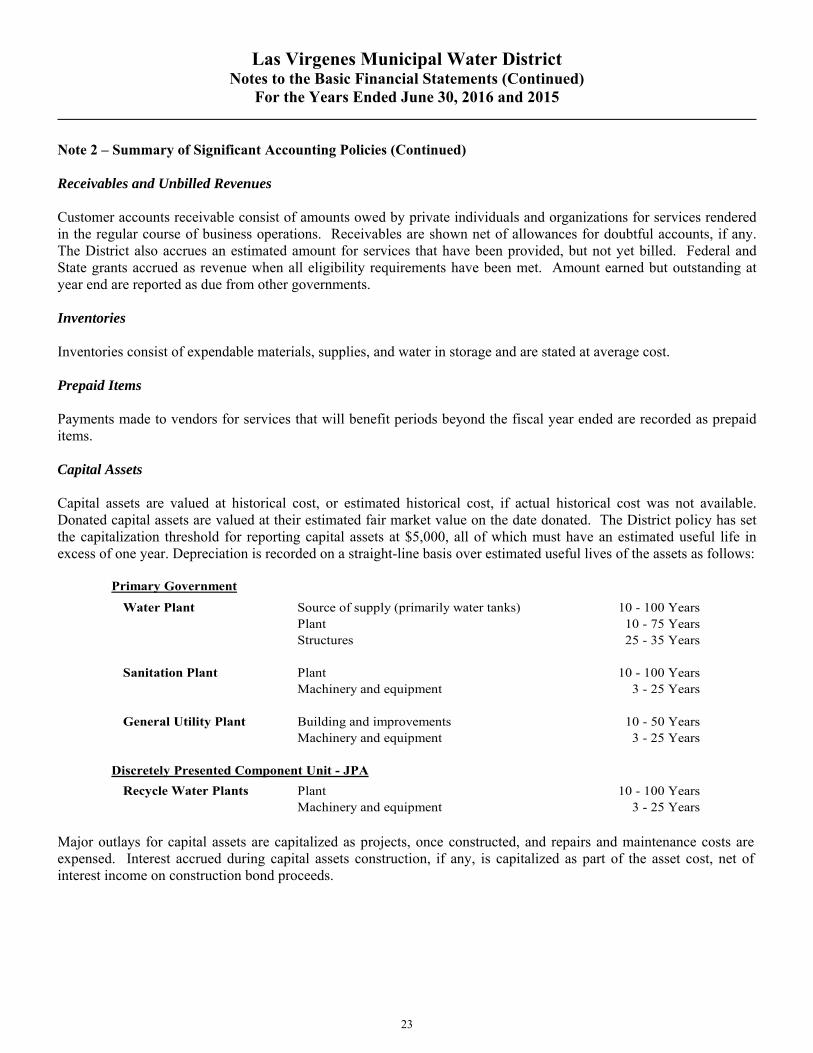
Note 2 – Summary of Significant Accounting Policies (Continued) Receivables and Unbilled Revenues Customer accounts receivable consist of amounts owed by private individuals and organizations for services rendered in the regular course of business operations. Receivables are shown net of allowances for doubtful accounts, if any. The District also accrues an estimated amount for services that have been provided, but not yet billed. Federal and State grants accrued as revenue when all eligibility requirements have been met. Amount earned but outstanding at year end are reported as due from other governments. Inventories Inventories consist of expendable materials, supplies, and water in storage and are stated at average cost. Prepaid Items Payments made to vendors for services that will benefit periods beyond the fiscal year ended are recorded as prepaid items. Capital Assets Capital assets are valued at historical cost, or estimated historical cost, if actual historical cost was not available. Donated capital assets are valued at their estimated fair market value on the date donated. The District policy has set the capitalization threshold for reporting capital assets at $5,000, all of which must have an estimated useful life in excess of one year. Depreciation is recorded on a straight-line basis over estimated useful lives of the assets as follows:
Primary Government
Water Plant Source of supply (primarily water tanks) 10 - 100 YearsPlant 10 - 75 YearsStructures 25 - 35 Years
Sanitation Plant Plant 10 - 100 YearsMachinery and equipment 3 - 25 Years
General Utility Plant Building and improvements 10 - 50 YearsMachinery and equipment 3 - 25 Years
Discretely Presented Component Unit - JPA
Recycle Water Plants Plant 10 - 100 YearsMachinery and equipment 3 - 25 Years
Major outlays for capital assets are capitalized as projects, once constructed, and repairs and maintenance costs are expensed. Interest accrued during capital assets construction, if any, is capitalized as part of the asset cost, net of interest income on construction bond proceeds.
Las Virgenes Municipal Water District Notes to the Basic Financial Statements (Continued)
For the Years Ended June 30, 2016 and 2015
24
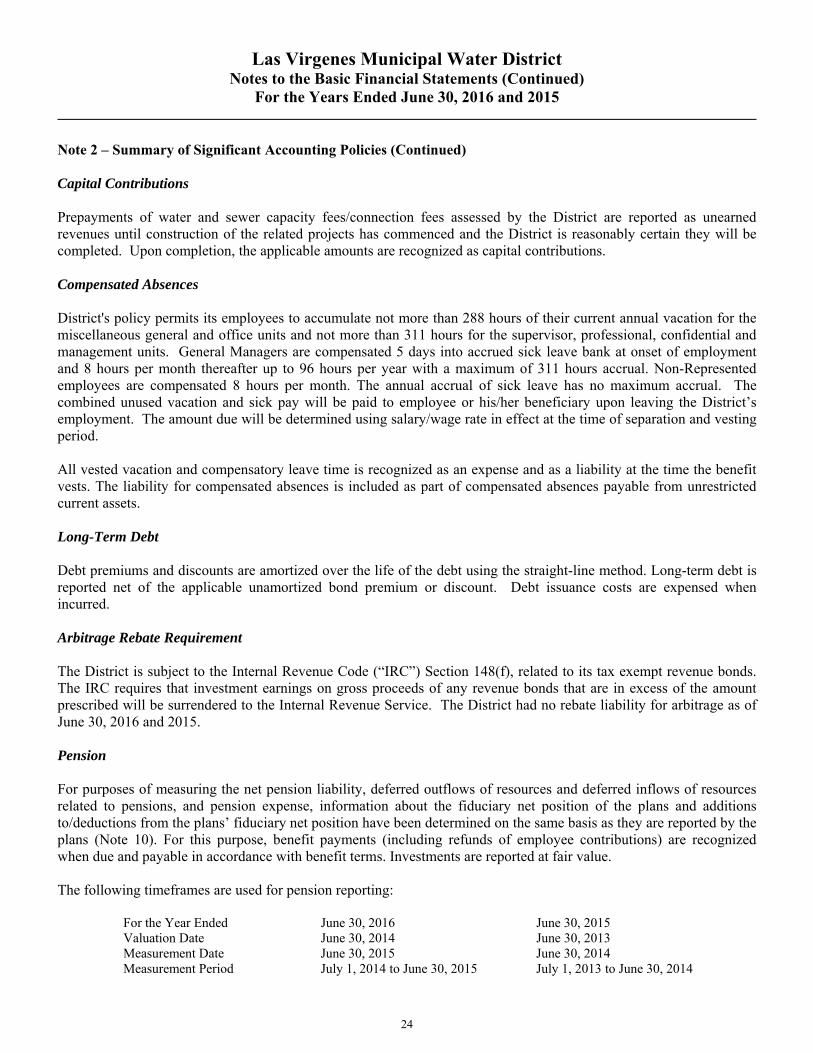
Note 2 – Summary of Significant Accounting Policies (Continued) Capital Contributions Prepayments of water and sewer capacity fees/connection fees assessed by the District are reported as unearned revenues until construction of the related projects has commenced and the District is reasonably certain they will be completed. Upon completion, the applicable amounts are recognized as capital contributions. Compensated Absences District's policy permits its employees to accumulate not more than 288 hours of their current annual vacation for the miscellaneous general and office units and not more than 311 hours for the supervisor, professional, confidential and management units. General Managers are compensated 5 days into accrued sick leave bank at onset of employment and 8 hours per month thereafter up to 96 hours per year with a maximum of 311 hours accrual. Non-Represented employees are compensated 8 hours per month. The annual accrual of sick leave has no maximum accrual. The combined unused vacation and sick pay will be paid to employee or his/her beneficiary upon leaving the District’s employment. The amount due will be determined using salary/wage rate in effect at the time of separation and vesting period. All vested vacation and compensatory leave time is recognized as an expense and as a liability at the time the benefit vests. The liability for compensated absences is included as part of compensated absences payable from unrestricted current assets. Long-Term Debt Debt premiums and discounts are amortized over the life of the debt using the straight-line method. Long-term debt is reported net of the applicable unamortized bond premium or discount. Debt issuance costs are expensed when incurred. Arbitrage Rebate Requirement The District is subject to the Internal Revenue Code (“IRC”) Section 148(f), related to its tax exempt revenue bonds. The IRC requires that investment earnings on gross proceeds of any revenue bonds that are in excess of the amount prescribed will be surrendered to the Internal Revenue Service. The District had no rebate liability for arbitrage as of June 30, 2016 and 2015. Pension For purposes of measuring the net pension liability, deferred outflows of resources and deferred inflows of resources related to pensions, and pension expense, information about the fiduciary net position of the plans and additions to/deductions from the plans’ fiduciary net position have been determined on the same basis as they are reported by the plans (Note 10). For this purpose, benefit payments (including refunds of employee contributions) are recognized when due and payable in accordance with benefit terms. Investments are reported at fair value. The following timeframes are used for pension reporting:
For the Year Ended June 30, 2016 June 30, 2015 Valuation Date June 30, 2014 June 30, 2013 Measurement Date June 30, 2015 June 30, 2014 Measurement Period July 1, 2014 to June 30, 2015 July 1, 2013 to June 30, 2014
Las Virgenes Municipal Water District Notes to the Basic Financial Statements (Continued)
For the Years Ended June 30, 2016 and 2015
25
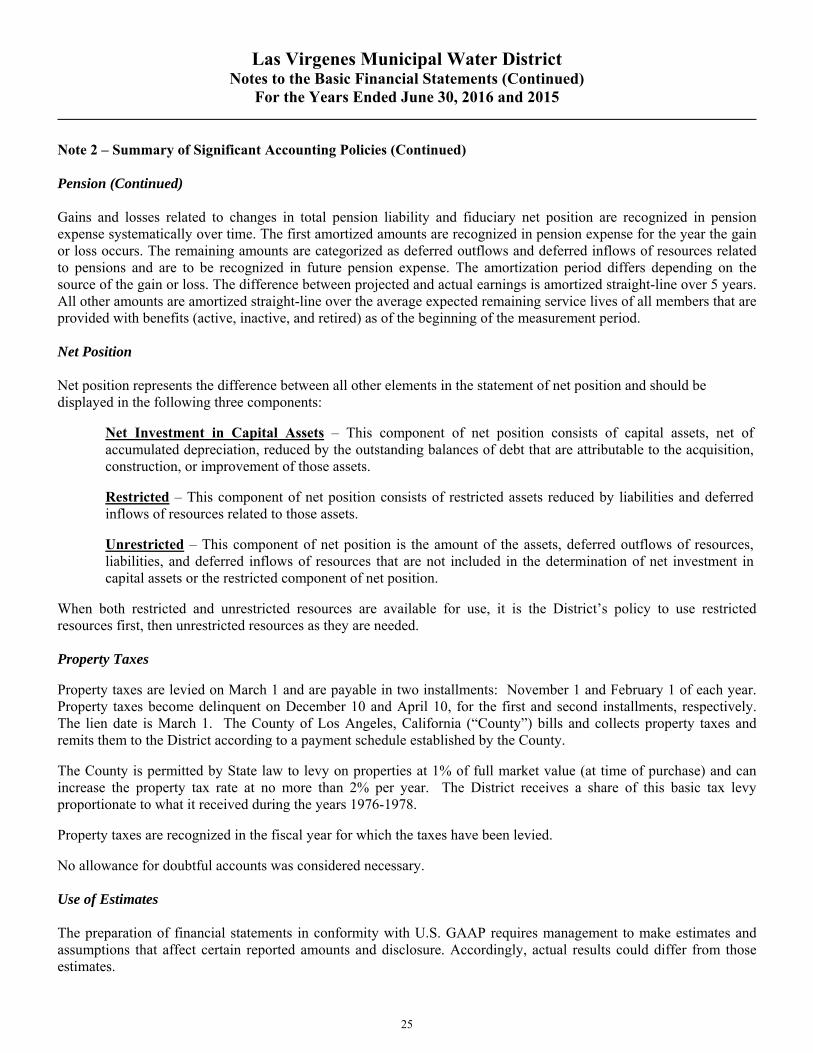
Note 2 – Summary of Significant Accounting Policies (Continued) Pension (Continued) Gains and losses related to changes in total pension liability and fiduciary net position are recognized in pension expense systematically over time. The first amortized amounts are recognized in pension expense for the year the gain or loss occurs. The remaining amounts are categorized as deferred outflows and deferred inflows of resources related to pensions and are to be recognized in future pension expense. The amortization period differs depending on the source of the gain or loss. The difference between projected and actual earnings is amortized straight-line over 5 years. All other amounts are amortized straight-line over the average expected remaining service lives of all members that are provided with benefits (active, inactive, and retired) as of the beginning of the measurement period. Net Position Net position represents the difference between all other elements in the statement of net position and should be displayed in the following three components:
Net Investment in Capital Assets – This component of net position consists of capital assets, net of accumulated depreciation, reduced by the outstanding balances of debt that are attributable to the acquisition, construction, or improvement of those assets. Restricted – This component of net position consists of restricted assets reduced by liabilities and deferred inflows of resources related to those assets. Unrestricted – This component of net position is the amount of the assets, deferred outflows of resources, liabilities, and deferred inflows of resources that are not included in the determination of net investment in capital assets or the restricted component of net position.
When both restricted and unrestricted resources are available for use, it is the District’s policy to use restricted resources first, then unrestricted resources as they are needed. Property Taxes Property taxes are levied on March 1 and are payable in two installments: November 1 and February 1 of each year. Property taxes become delinquent on December 10 and April 10, for the first and second installments, respectively. The lien date is March 1. The County of Los Angeles, California (“County”) bills and collects property taxes and remits them to the District according to a payment schedule established by the County. The County is permitted by State law to levy on properties at 1% of full market value (at time of purchase) and can increase the property tax rate at no more than 2% per year. The District receives a share of this basic tax levy proportionate to what it received during the years 1976-1978. Property taxes are recognized in the fiscal year for which the taxes have been levied. No allowance for doubtful accounts was considered necessary. Use of Estimates The preparation of financial statements in conformity with U.S. GAAP requires management to make estimates and assumptions that affect certain reported amounts and disclosure. Accordingly, actual results could differ from those estimates.
Las Virgenes Municipal Water District Notes to the Basic Financial Statements (Continued)
For the Years Ended June 30, 2016 and 2015
26
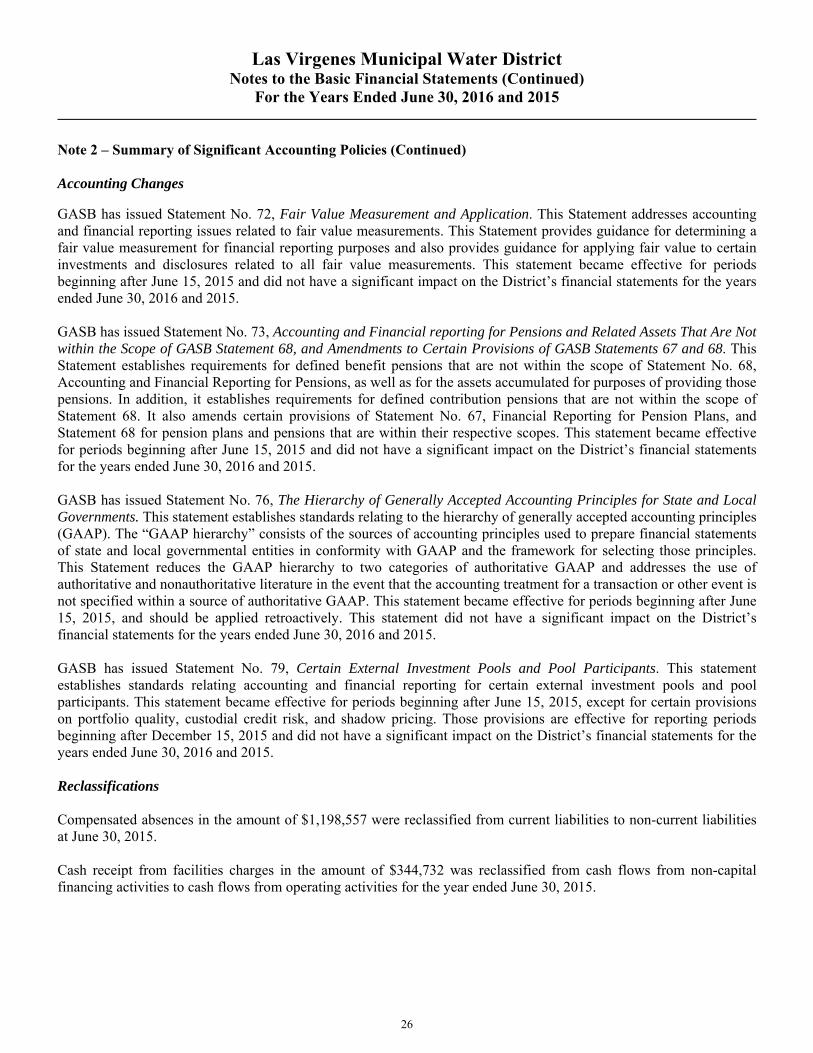
Note 2 – Summary of Significant Accounting Policies (Continued) Accounting Changes GASB has issued Statement No. 72, Fair Value Measurement and Application. This Statement addresses accounting and financial reporting issues related to fair value measurements. This Statement provides guidance for determining a fair value measurement for financial reporting purposes and also provides guidance for applying fair value to certain investments and disclosures related to all fair value measurements. This statement became effective for periods beginning after June 15, 2015 and did not have a significant impact on the District’s financial statements for the years ended June 30, 2016 and 2015. GASB has issued Statement No. 73, Accounting and Financial reporting for Pensions and Related Assets That Are Not within the Scope of GASB Statement 68, and Amendments to Certain Provisions of GASB Statements 67 and 68. This Statement establishes requirements for defined benefit pensions that are not within the scope of Statement No. 68, Accounting and Financial Reporting for Pensions, as well as for the assets accumulated for purposes of providing those pensions. In addition, it establishes requirements for defined contribution pensions that are not within the scope of Statement 68. It also amends certain provisions of Statement No. 67, Financial Reporting for Pension Plans, and Statement 68 for pension plans and pensions that are within their respective scopes. This statement became effective for periods beginning after June 15, 2015 and did not have a significant impact on the District’s financial statements for the years ended June 30, 2016 and 2015. GASB has issued Statement No. 76, The Hierarchy of Generally Accepted Accounting Principles for State and Local Governments. This statement establishes standards relating to the hierarchy of generally accepted accounting principles (GAAP). The “GAAP hierarchy” consists of the sources of accounting principles used to prepare financial statements of state and local governmental entities in conformity with GAAP and the framework for selecting those principles. This Statement reduces the GAAP hierarchy to two categories of authoritative GAAP and addresses the use of authoritative and nonauthoritative literature in the event that the accounting treatment for a transaction or other event is not specified within a source of authoritative GAAP. This statement became effective for periods beginning after June 15, 2015, and should be applied retroactively. This statement did not have a significant impact on the District’s financial statements for the years ended June 30, 2016 and 2015. GASB has issued Statement No. 79, Certain External Investment Pools and Pool Participants. This statement establishes standards relating accounting and financial reporting for certain external investment pools and pool participants. This statement became effective for periods beginning after June 15, 2015, except for certain provisions on portfolio quality, custodial credit risk, and shadow pricing. Those provisions are effective for reporting periods beginning after December 15, 2015 and did not have a significant impact on the District’s financial statements for the years ended June 30, 2016 and 2015. Reclassifications Compensated absences in the amount of $1,198,557 were reclassified from current liabilities to non-current liabilities at June 30, 2015. Cash receipt from facilities charges in the amount of $344,732 was reclassified from cash flows from non-capital financing activities to cash flows from operating activities for the year ended June 30, 2015.
Las Virgenes Municipal Water District Notes to the Basic Financial Statements (Continued)
For the Years Ended June 30, 2016 and 2015
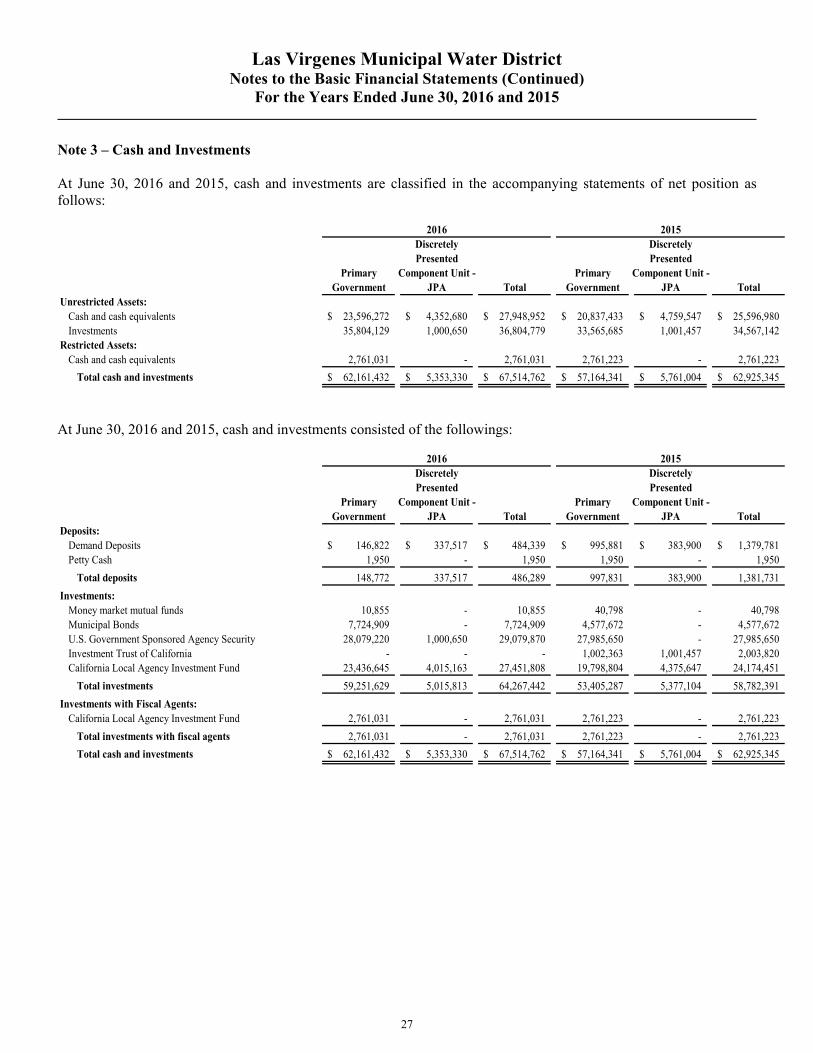
27
Note 3 – Cash and Investments At June 30, 2016 and 2015, cash and investments are classified in the accompanying statements of net position as follows:
Discretely DiscretelyPresented Presented
Primary Component Unit - Primary Component Unit -Government JPA Total Government JPA Total
Unrestricted Assets:Cash and cash equivalents 23,596,272$ 4,352,680$ 27,948,952$ 20,837,433$ 4,759,547$ 25,596,980$ Investments 35,804,129 1,000,650 36,804,779 33,565,685 1,001,457 34,567,142
Restricted Assets:Cash and cash equivalents 2,761,031 - 2,761,031 2,761,223 - 2,761,223
Total cash and investments 62,161,432$ 5,353,330$ 67,514,762$ 57,164,341$ 5,761,004$ 62,925,345$
20152016
At June 30, 2016 and 2015, cash and investments consisted of the followings:
Discretely DiscretelyPresented Presented
Primary Component Unit - Primary Component Unit -Government JPA Total Government JPA Total
Deposits:Demand Deposits 146,822$ 337,517$ 484,339$ 995,881$ 383,900$ 1,379,781$ Petty Cash 1,950 - 1,950 1,950 - 1,950
Total deposits 148,772 337,517 486,289 997,831 383,900 1,381,731
Investments:Money market mutual funds 10,855 - 10,855 40,798 - 40,798 Municipal Bonds 7,724,909 - 7,724,909 4,577,672 - 4,577,672 U.S. Government Sponsored Agency Security 28,079,220 1,000,650 29,079,870 27,985,650 - 27,985,650 Investment Trust of California - - - 1,002,363 1,001,457 2,003,820 California Local Agency Investment Fund 23,436,645 4,015,163 27,451,808 19,798,804 4,375,647 24,174,451
Total investments 59,251,629 5,015,813 64,267,442 53,405,287 5,377,104 58,782,391
Investments with Fiscal Agents:California Local Agency Investment Fund 2,761,031 - 2,761,031 2,761,223 - 2,761,223
Total investments with fiscal agents 2,761,031 - 2,761,031 2,761,223 - 2,761,223
Total cash and investments 62,161,432$ 5,353,330$ 67,514,762$ 57,164,341$ 5,761,004$ 62,925,345$
20152016

Las Virgenes Municipal Water District Notes to the Basic Financial Statements (Continued)
For the Years Ended June 30, 2016 and 2015
28
Note 3 – Cash and Investments (Continued)
The statements of cash flows for the years ended June 30, 2016 and 2015 have been prepared by considering the following deposits and investment instruments to be cash and cash equivalents:
Discretely DiscretelyPresented Presented
Primary Component Unit - Primary Component Unit -Government JPA Total Government JPA Total
Demand Deposits 146,822$ 337,517$ 484,339$ 995,881$ 383,900$ 1,379,781$ Petty Cash 1,950 - 1,950 1,950 - 1,950 Money market mutual funds 10,855 - 10,855 40,798 - 40,798 California Local Agency Investment Fund 26,197,676 4,015,163 30,212,839 22,560,027 4,375,647 26,935,674
Total cash and cash and cash equivalents 26,357,303$ 4,352,680$ 30,709,983$ 23,598,656$ 4,759,547$ 28,358,203$
20152016
Demand Deposits Demand deposits are held in pool by the District. The carrying amounts of cash deposits were $484,339 and $1,379,781 at June 30, 2016 and 2015, respectively. Bank balance at June 30, 2016 and 2015 were was $1,010,158 and $1,683,812, respectively, which were fully insured and/or collateralized with securities held by the pledging financial institutions in the District’s name as discussed below. The California Government Code requires California banks and savings and loan associations to secure the District’s cash deposits by pledging securities as collateral. This Code states that collateral pledged in this manner shall have the effect of perfecting a security interest in such collateral superior to those of a general creditor. Thus, collateral for cash deposits is considered to be held in the District’s name. The fair value of pledged securities must equal at least 110% of the District’s cash deposits. California law also allows institutions to secure the District’s deposits by pledging first trust deed mortgage notes having a value of 150% of the District’s total cash deposits. The District may waive collateral requirements for cash deposits, which are fully insured up to $250,000 by the Federal Deposit Insurance Corporation. The District, however, has not waived the collateralization requirements. California Local Agency Investment Funds The District is a voluntary participant in the California Local Agency Investment Fund (“LAIF”) that is regulated by California Government Code Section 18429 under the oversight of the Treasurer of the State of California. LAIF is overseen by the Local Agency Investment Advisory Board, which consists of five members, in accordance with State statute. The District’s investments with LAIF include a portion of the pool funds invested in Structured Notes and Asset-Backed Securities. These investments include the following:
Structured Notes - debt securities (other than asset-backed securities) whose cash flow characteristics (coupon rate, redemption amount, or stated maturity) depend upon one or more indices and/or that have embedded forwards or options.
Asset-Backed Securities - the bulk of which are mortgage-backed securities, entitle their purchasers to receive a share of the cash flows from a pool of assets such as principal and interest repayments from a pool of mortgages (such as CMO’s) or credit card receivables.
Las Virgenes Municipal Water District Notes to the Basic Financial Statements (Continued)
For the Years Ended June 30, 2016 and 2015
29
Note 3 – Cash and Investments (Continued) California Local Agency Investment Funds (Continued) JPA’s investment in LAIF was pooled with the District. As of June 30, 2016 and 2015, the District had $30,212,839 and $26,935,674 invested in LAIF, which had invested 2.81% and 2.08% of the pool investment funds in Structured Notes and Asset-Backed Securities, respectively. The fair value of the investment in this pool is reported in the accompanying financial statements at amounts based upon the District’s pro-rata share of the fair value provided by LAIF for the entire portfolio (in relation to the amortized cost of that portfolio). The balance available for withdrawal is based on the accounting records maintained by LAIF, which are reported at fair market value. Investments Authorized by the California Code and The District’s Investment Policy The table below identifies the investment types that are authorized for the District by the California Government Code (or the District’s investment policy, where more restrictive). The table also identifies certain provisions of the California Government Code (or the District’s investment policy, where more restrictive) that address interest rate risk, credit risk, and concentration of credit risk. This table does not address investments of debt proceeds held by bond trustees that are governed by the provisions of debt agreements of the District, rather than the general provisions of the California Government Code or the District’s investment policy.
Percentage MaximumMaximum of Investment
Authorized Investment Type Maturity Portfolio in One Issuer
United States Treasury Bills, Bonds and Notes 5 years None NoneUnited States Government Sponsored Agency Securities 5 years None NoneTime Deposits 1 year 25% NoneRepurchase Agreements 30 days 10% NoneCalifornia Local Agency Investment Fund (LAIF) None None $50,000,000Local Government Investment Pools None None NoneBonds Issue by Local Agencies or States 5 years None None
Investments Authorized by Debt Agreements Investments of debt proceeds held by bond trustees are governed by provisions of the debt agreements, rather than the general provisions of the California Government Code or the District’s investment policy. The table below identifies the investment types that are authorized for investments held by bond trustees. The table also identifies certain provisions of these debt agreements that address interest rate risk and concentration of risk.
Percentage MaximumMaximum of Investment
Authorized Investment Type Maturity Portfolio in One Issuer
United States Treasury Obligations None None NoneUnited States Government Sponsored Agency Securities 3 years None NoneTime Deposits 360 days None NoneBanker's Acceptances 360 days None NoneMoney Market Mutual Fund None None NoneLocal Agency Fund None None NoneCommercial Paper 270 days None NoneInvestment Agreement None None NoneOther investments approved by bond insurer None None None
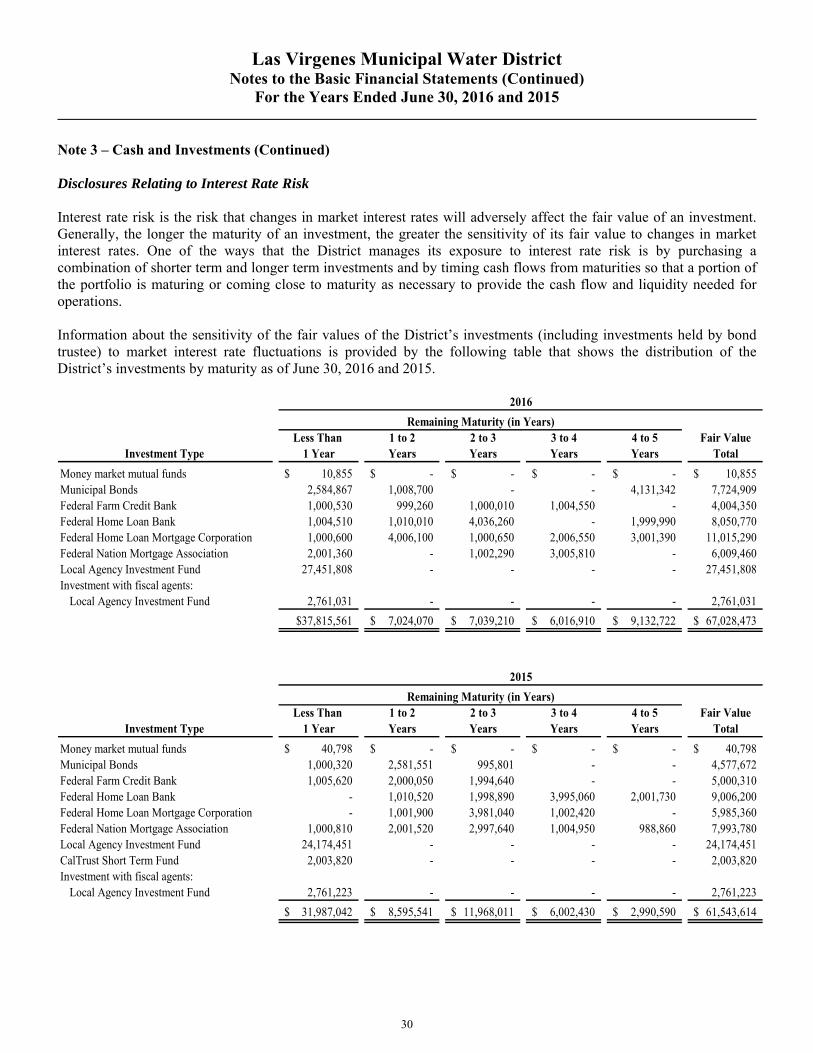
Las Virgenes Municipal Water District Notes to the Basic Financial Statements (Continued)
For the Years Ended June 30, 2016 and 2015
30
Note 3 – Cash and Investments (Continued)
Disclosures Relating to Interest Rate Risk Interest rate risk is the risk that changes in market interest rates will adversely affect the fair value of an investment. Generally, the longer the maturity of an investment, the greater the sensitivity of its fair value to changes in market interest rates. One of the ways that the District manages its exposure to interest rate risk is by purchasing a combination of shorter term and longer term investments and by timing cash flows from maturities so that a portion of the portfolio is maturing or coming close to maturity as necessary to provide the cash flow and liquidity needed for operations. Information about the sensitivity of the fair values of the District’s investments (including investments held by bond trustee) to market interest rate fluctuations is provided by the following table that shows the distribution of the District’s investments by maturity as of June 30, 2016 and 2015.
Less Than 1 to 2 2 to 3 3 to 4 4 to 5 Fair ValueInvestment Type 1 Year Years Years Years Years Total
Money market mutual funds 10,855$ -$ -$ -$ -$ 10,855$ Municipal Bonds 2,584,867 1,008,700 - - 4,131,342 7,724,909 Federal Farm Credit Bank 1,000,530 999,260 1,000,010 1,004,550 - 4,004,350 Federal Home Loan Bank 1,004,510 1,010,010 4,036,260 - 1,999,990 8,050,770 Federal Home Loan Mortgage Corporation 1,000,600 4,006,100 1,000,650 2,006,550 3,001,390 11,015,290 Federal Nation Mortgage Association 2,001,360 - 1,002,290 3,005,810 - 6,009,460 Local Agency Investment Fund 27,451,808 - - - - 27,451,808 Investment with fiscal agents:
Local Agency Investment Fund 2,761,031 - - - - 2,761,031
$37,815,561 7,024,070$ 7,039,210$ 6,016,910$ 9,132,722$ 67,028,473$
2016
Remaining Maturity (in Years)
Less Than 1 to 2 2 to 3 3 to 4 4 to 5 Fair ValueInvestment Type 1 Year Years Years Years Years Total
Money market mutual funds 40,798$ -$ -$ -$ -$ 40,798$ Municipal Bonds 1,000,320 2,581,551 995,801 - - 4,577,672 Federal Farm Credit Bank 1,005,620 2,000,050 1,994,640 - - 5,000,310 Federal Home Loan Bank - 1,010,520 1,998,890 3,995,060 2,001,730 9,006,200 Federal Home Loan Mortgage Corporation - 1,001,900 3,981,040 1,002,420 - 5,985,360 Federal Nation Mortgage Association 1,000,810 2,001,520 2,997,640 1,004,950 988,860 7,993,780 Local Agency Investment Fund 24,174,451 - - - - 24,174,451 CalTrust Short Term Fund 2,003,820 - - - - 2,003,820 Investment with fiscal agents:
Local Agency Investment Fund 2,761,223 - - - - 2,761,223
31,987,042$ 8,595,541$ 11,968,011$ 6,002,430$ 2,990,590$ 61,543,614$
2015
Remaining Maturity (in Years)
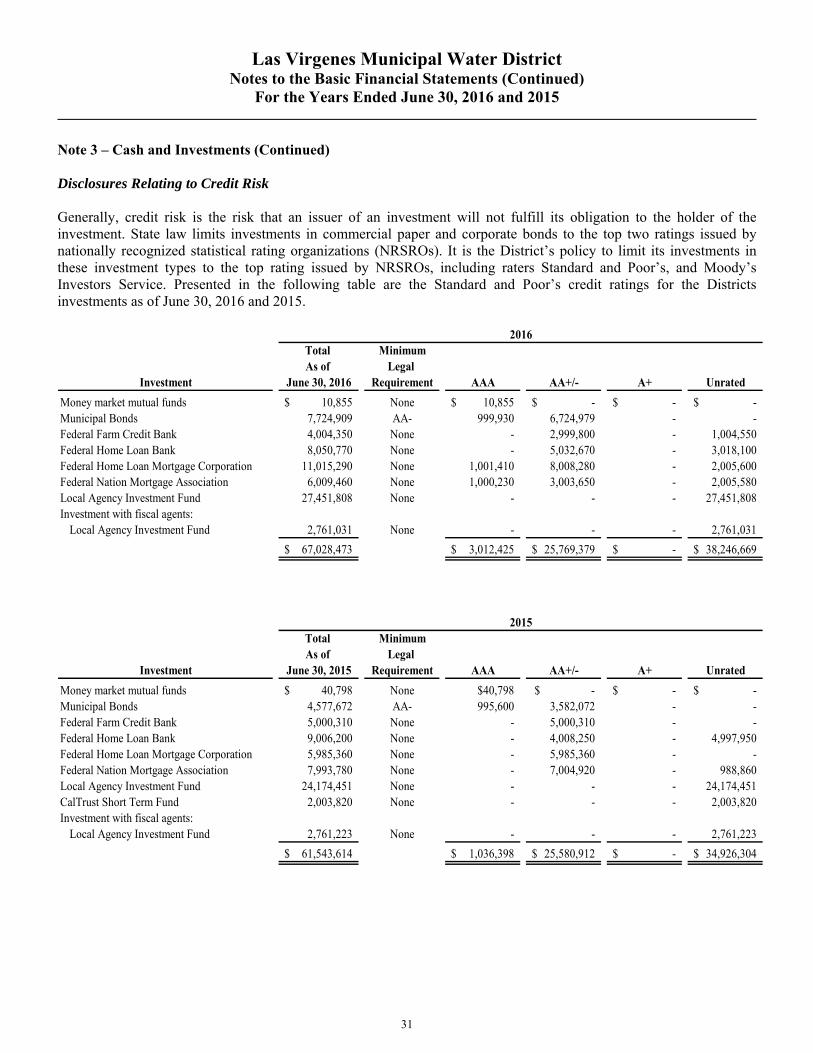
Las Virgenes Municipal Water District Notes to the Basic Financial Statements (Continued)
For the Years Ended June 30, 2016 and 2015
31
Note 3 – Cash and Investments (Continued)
Disclosures Relating to Credit Risk Generally, credit risk is the risk that an issuer of an investment will not fulfill its obligation to the holder of the investment. State law limits investments in commercial paper and corporate bonds to the top two ratings issued by nationally recognized statistical rating organizations (NRSROs). It is the District’s policy to limit its investments in these investment types to the top rating issued by NRSROs, including raters Standard and Poor’s, and Moody’s Investors Service. Presented in the following table are the Standard and Poor’s credit ratings for the Districts investments as of June 30, 2016 and 2015.
Total MinimumAs of Legal
Investment June 30, 2016 Requirement AAA AA+/- A+ Unrated
Money market mutual funds 10,855$ None 10,855$ -$ -$ -$ Municipal Bonds 7,724,909 AA- 999,930 6,724,979 - - Federal Farm Credit Bank 4,004,350 None - 2,999,800 - 1,004,550 Federal Home Loan Bank 8,050,770 None - 5,032,670 - 3,018,100 Federal Home Loan Mortgage Corporation 11,015,290 None 1,001,410 8,008,280 - 2,005,600 Federal Nation Mortgage Association 6,009,460 None 1,000,230 3,003,650 - 2,005,580 Local Agency Investment Fund 27,451,808 None - - - 27,451,808 Investment with fiscal agents:
Local Agency Investment Fund 2,761,031 None - - - 2,761,031
67,028,473$ 3,012,425$ 25,769,379$ -$ 38,246,669$
2016
Total MinimumAs of Legal
Investment June 30, 2015 Requirement AAA AA+/- A+ Unrated
Money market mutual funds 40,798$ None $40,798 $ - -$ -$ Municipal Bonds 4,577,672 AA- 995,600 3,582,072 - - Federal Farm Credit Bank 5,000,310 None - 5,000,310 - - Federal Home Loan Bank 9,006,200 None - 4,008,250 - 4,997,950 Federal Home Loan Mortgage Corporation 5,985,360 None - 5,985,360 - - Federal Nation Mortgage Association 7,993,780 None - 7,004,920 - 988,860 Local Agency Investment Fund 24,174,451 None - - - 24,174,451 CalTrust Short Term Fund 2,003,820 None - - - 2,003,820 Investment with fiscal agents:
Local Agency Investment Fund 2,761,223 None - - - 2,761,223
61,543,614$ 1,036,398$ 25,580,912$ -$ 34,926,304$
2015
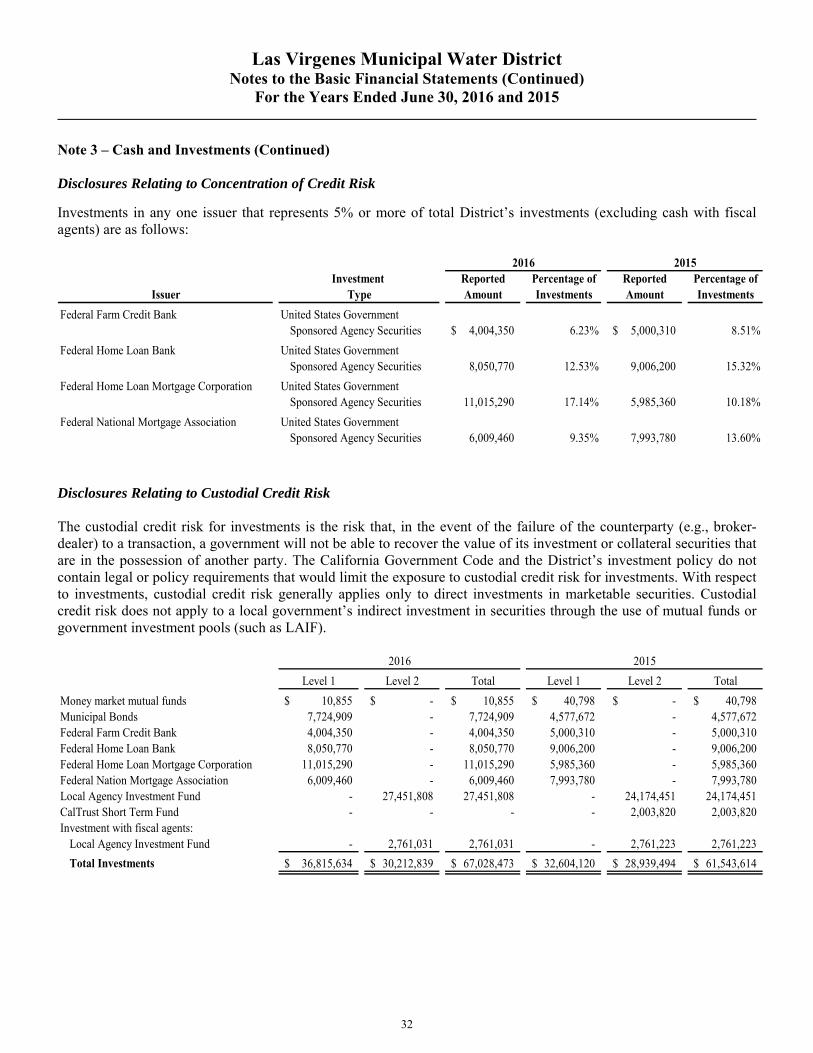
Las Virgenes Municipal Water District Notes to the Basic Financial Statements (Continued)
For the Years Ended June 30, 2016 and 2015
32
Note 3 – Cash and Investments (Continued) Disclosures Relating to Concentration of Credit Risk
Investments in any one issuer that represents 5% or more of total District’s investments (excluding cash with fiscal agents) are as follows:
Reported Percentage of Reported Percentage ofIssuer Amount Investments Amount Investments
Federal Farm Credit Bank United States Government Sponsored Agency Securities 4,004,350$ 6.23% 5,000,310$ 8.51%
Federal Home Loan Bank United States Government Sponsored Agency Securities 8,050,770 12.53% 9,006,200 15.32%
Federal Home Loan Mortgage Corporation United States Government Sponsored Agency Securities 11,015,290 17.14% 5,985,360 10.18%
Federal National Mortgage Association United States Government Sponsored Agency Securities 6,009,460 9.35% 7,993,780 13.60%
2016 2015Investment
Type
Disclosures Relating to Custodial Credit Risk The custodial credit risk for investments is the risk that, in the event of the failure of the counterparty (e.g., broker-dealer) to a transaction, a government will not be able to recover the value of its investment or collateral securities that are in the possession of another party. The California Government Code and the District’s investment policy do not contain legal or policy requirements that would limit the exposure to custodial credit risk for investments. With respect to investments, custodial credit risk generally applies only to direct investments in marketable securities. Custodial credit risk does not apply to a local government’s indirect investment in securities through the use of mutual funds or government investment pools (such as LAIF).
Level 1 Level 2 Total Level 1 Level 2 Total
Money market mutual funds 10,855$ -$ 10,855$ 40,798$ -$ 40,798$ Municipal Bonds 7,724,909 - 7,724,909 4,577,672 - 4,577,672 Federal Farm Credit Bank 4,004,350 - 4,004,350 5,000,310 - 5,000,310 Federal Home Loan Bank 8,050,770 - 8,050,770 9,006,200 - 9,006,200 Federal Home Loan Mortgage Corporation 11,015,290 - 11,015,290 5,985,360 - 5,985,360 Federal Nation Mortgage Association 6,009,460 - 6,009,460 7,993,780 - 7,993,780 Local Agency Investment Fund - 27,451,808 27,451,808 - 24,174,451 24,174,451 CalTrust Short Term Fund - - - - 2,003,820 2,003,820 Investment with fiscal agents:
Local Agency Investment Fund - 2,761,031 2,761,031 - 2,761,223 2,761,223
Total Investments 36,815,634$ 30,212,839$ 67,028,473$ 32,604,120$ 28,939,494$ 61,543,614$
2016 2015
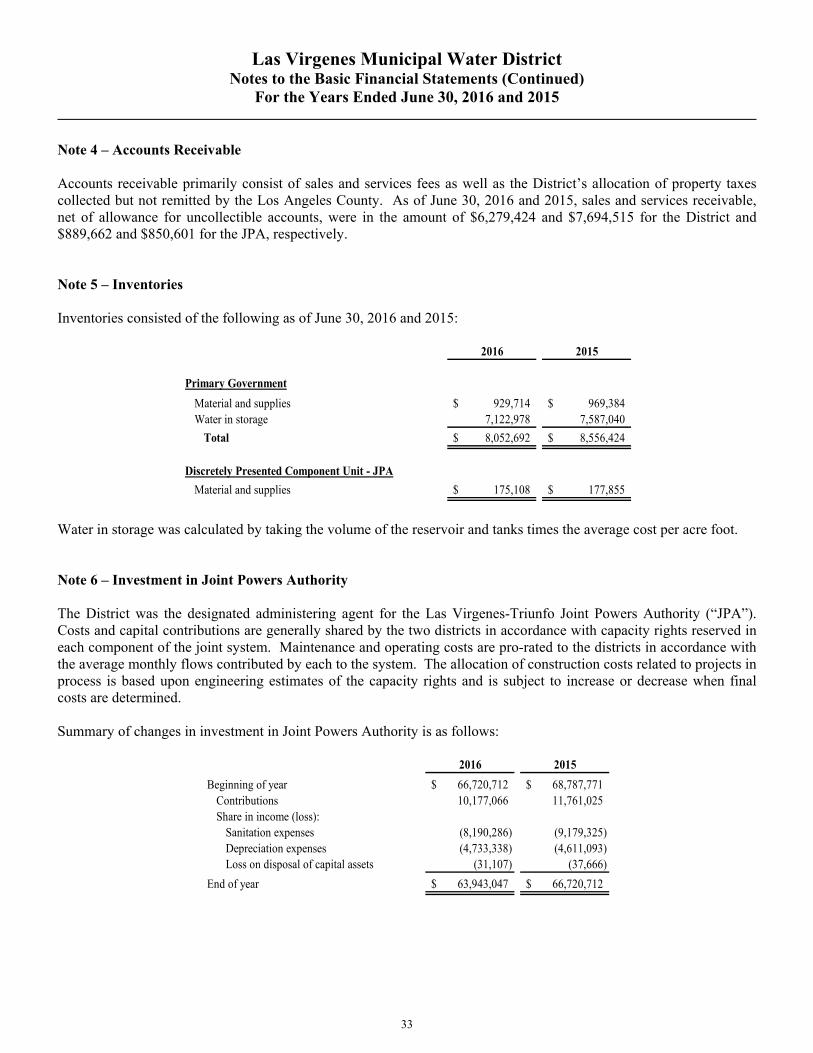
Las Virgenes Municipal Water District Notes to the Basic Financial Statements (Continued)
For the Years Ended June 30, 2016 and 2015
33
Note 4 – Accounts Receivable Accounts receivable primarily consist of sales and services fees as well as the District’s allocation of property taxes collected but not remitted by the Los Angeles County. As of June 30, 2016 and 2015, sales and services receivable, net of allowance for uncollectible accounts, were in the amount of $6,279,424 and $7,694,515 for the District and $889,662 and $850,601 for the JPA, respectively. Note 5 – Inventories Inventories consisted of the following as of June 30, 2016 and 2015:
2016 2015
Primary Government
Material and supplies 929,714$ 969,384$ Water in storage 7,122,978 7,587,040
Total 8,052,692$ 8,556,424$
Discretely Presented Component Unit - JPA
Material and supplies 175,108$ 177,855$
Water in storage was calculated by taking the volume of the reservoir and tanks times the average cost per acre foot. Note 6 – Investment in Joint Powers Authority The District was the designated administering agent for the Las Virgenes-Triunfo Joint Powers Authority (“JPA”). Costs and capital contributions are generally shared by the two districts in accordance with capacity rights reserved in each component of the joint system. Maintenance and operating costs are pro-rated to the districts in accordance with the average monthly flows contributed by each to the system. The allocation of construction costs related to projects in process is based upon engineering estimates of the capacity rights and is subject to increase or decrease when final costs are determined. Summary of changes in investment in Joint Powers Authority is as follows:
2016 2015
Beginning of year 66,720,712$ 68,787,771$ Contributions 10,177,066 11,761,025 Share in income (loss):
Sanitation expenses (8,190,286) (9,179,325) Depreciation expenses (4,733,338) (4,611,093) Loss on disposal of capital assets (31,107) (37,666)
End of year 63,943,047$ 66,720,712$
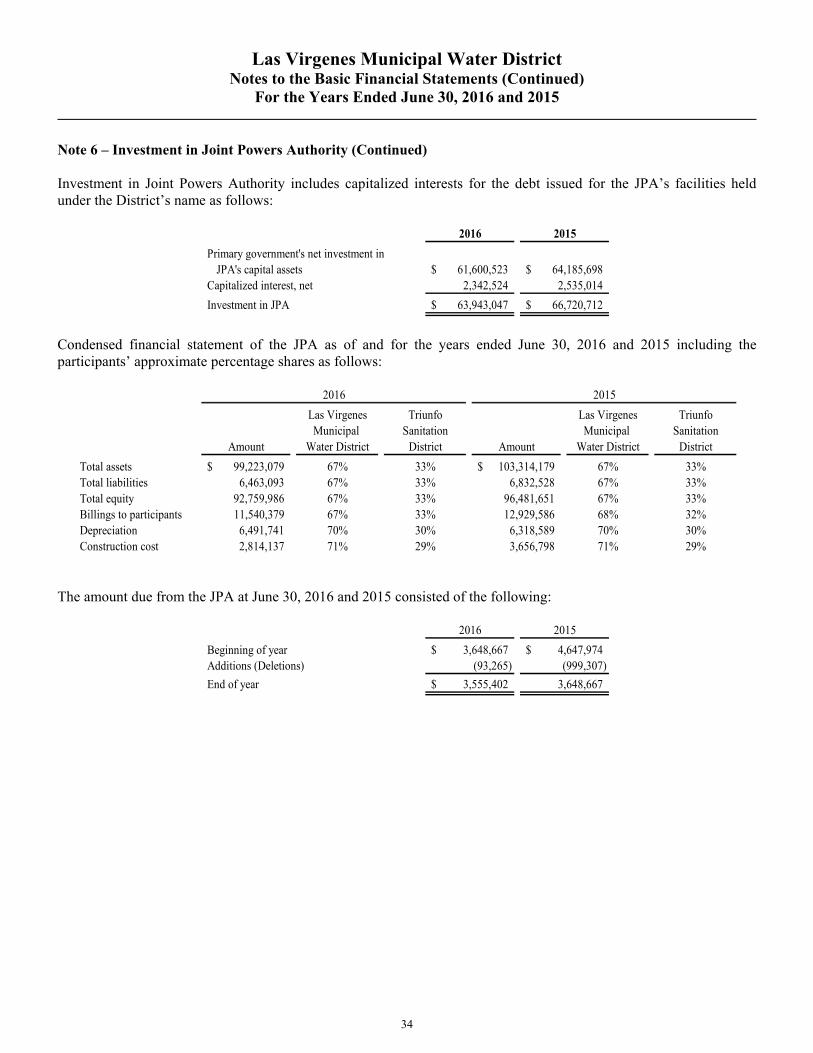
Las Virgenes Municipal Water District Notes to the Basic Financial Statements (Continued)
For the Years Ended June 30, 2016 and 2015
34
Note 6 – Investment in Joint Powers Authority (Continued) Investment in Joint Powers Authority includes capitalized interests for the debt issued for the JPA’s facilities held under the District’s name as follows:
2016 2015
Primary government's net investment in JPA's capital assets 61,600,523$ 64,185,698$
Capitalized interest, net 2,342,524 2,535,014
Investment in JPA 63,943,047$ 66,720,712$
Condensed financial statement of the JPA as of and for the years ended June 30, 2016 and 2015 including the participants’ approximate percentage shares as follows:
Las Virgenes Triunfo Las Virgenes TriunfoMunicipal Sanitation Municipal Sanitation
Amount Water District District Amount Water District District
Total assets 99,223,079$ 67% 33% 103,314,179$ 67% 33%Total liabilities 6,463,093 67% 33% 6,832,528 67% 33%Total equity 92,759,986 67% 33% 96,481,651 67% 33%Billings to participants 11,540,379 67% 33% 12,929,586 68% 32%Depreciation 6,491,741 70% 30% 6,318,589 70% 30%Construction cost 2,814,137 71% 29% 3,656,798 71% 29%
2016 2015
The amount due from the JPA at June 30, 2016 and 2015 consisted of the following:
2016 2015
Beginning of year 3,648,667$ 4,647,974$ Additions (Deletions) (93,265) (999,307)
End of year 3,555,402$ 3,648,667
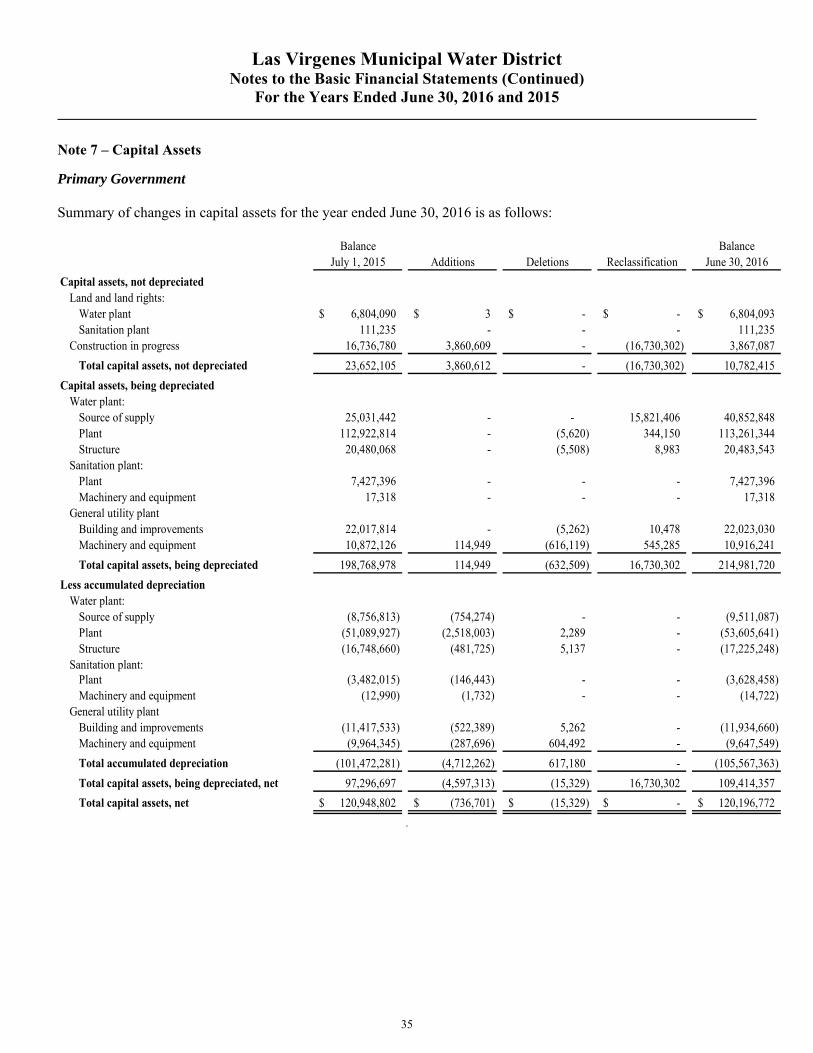
Las Virgenes Municipal Water District Notes to the Basic Financial Statements (Continued)
For the Years Ended June 30, 2016 and 2015
35
Note 7 – Capital Assets
Primary Government Summary of changes in capital assets for the year ended June 30, 2016 is as follows:
Balance BalanceJuly 1, 2015 Additions Deletions Reclassification June 30, 2016
Capital assets, not depreciatedLand and land rights:
Water plant 6,804,090$ 3$ -$ -$ 6,804,093$ Sanitation plant 111,235 - - - 111,235
Construction in progress 16,736,780 3,860,609 - (16,730,302) 3,867,087
Total capital assets, not depreciated 23,652,105 3,860,612 - (16,730,302) 10,782,415
Capital assets, being depreciatedWater plant:
Source of supply 25,031,442 - - 15,821,406 40,852,848 Plant 112,922,814 - (5,620) 344,150 113,261,344 Structure 20,480,068 - (5,508) 8,983 20,483,543
Sanitation plant:Plant 7,427,396 - - - 7,427,396 Machinery and equipment 17,318 - - - 17,318
General utility plantBuilding and improvements 22,017,814 - (5,262) 10,478 22,023,030 Machinery and equipment 10,872,126 114,949 (616,119) 545,285 10,916,241
Total capital assets, being depreciated 198,768,978 114,949 (632,509) 16,730,302 214,981,720
Less accumulated depreciationWater plant:
Source of supply (8,756,813) (754,274) - - (9,511,087) Plant (51,089,927) (2,518,003) 2,289 - (53,605,641) Structure (16,748,660) (481,725) 5,137 - (17,225,248)
Sanitation plant:Plant (3,482,015) (146,443) - - (3,628,458) Machinery and equipment (12,990) (1,732) - - (14,722)
General utility plantBuilding and improvements (11,417,533) (522,389) 5,262 - (11,934,660) Machinery and equipment (9,964,345) (287,696) 604,492 - (9,647,549)
Total accumulated depreciation (101,472,281) (4,712,262) 617,180 - (105,567,363)
Total capital assets, being depreciated, net 97,296,697 (4,597,313) (15,329) 16,730,302 109,414,357
Total capital assets, net 120,948,802$ (736,701)$ (15,329)$ -$ 120,196,772$
.
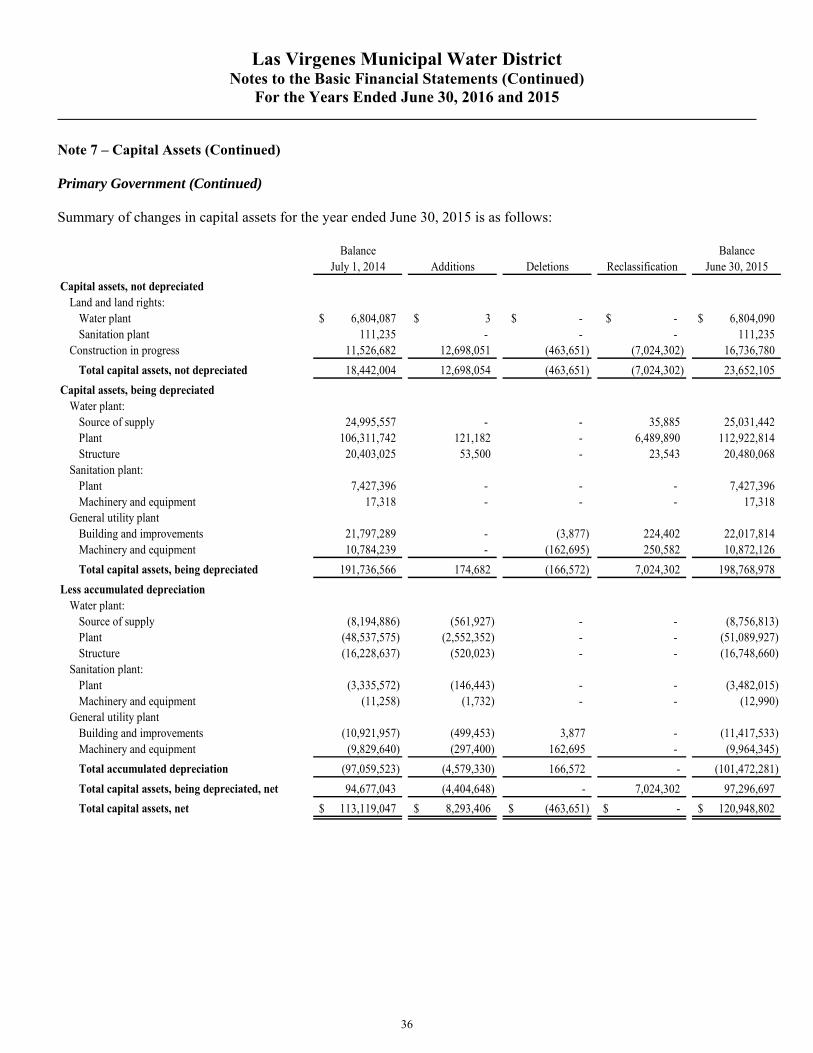
Las Virgenes Municipal Water District Notes to the Basic Financial Statements (Continued)
For the Years Ended June 30, 2016 and 2015
36
Note 7 – Capital Assets (Continued) Primary Government (Continued) Summary of changes in capital assets for the year ended June 30, 2015 is as follows:
Balance BalanceJuly 1, 2014 Additions Deletions Reclassification June 30, 2015
Capital assets, not depreciatedLand and land rights:
Water plant 6,804,087$ 3$ $ - $ - 6,804,090$ Sanitation plant 111,235 - - - 111,235
Construction in progress 11,526,682 12,698,051 (463,651) (7,024,302) 16,736,780
Total capital assets, not depreciated 18,442,004 12,698,054 (463,651) (7,024,302) 23,652,105
Capital assets, being depreciatedWater plant:
Source of supply 24,995,557 - - 35,885 25,031,442 Plant 106,311,742 121,182 - 6,489,890 112,922,814 Structure 20,403,025 53,500 - 23,543 20,480,068
Sanitation plant:Plant 7,427,396 - - - 7,427,396 Machinery and equipment 17,318 - - - 17,318
General utility plantBuilding and improvements 21,797,289 - (3,877) 224,402 22,017,814 Machinery and equipment 10,784,239 - (162,695) 250,582 10,872,126
Total capital assets, being depreciated 191,736,566 174,682 (166,572) 7,024,302 198,768,978
Less accumulated depreciationWater plant:
Source of supply (8,194,886) (561,927) - - (8,756,813) Plant (48,537,575) (2,552,352) - - (51,089,927) Structure (16,228,637) (520,023) - - (16,748,660)
Sanitation plant:Plant (3,335,572) (146,443) - - (3,482,015) Machinery and equipment (11,258) (1,732) - - (12,990)
General utility plantBuilding and improvements (10,921,957) (499,453) 3,877 - (11,417,533) Machinery and equipment (9,829,640) (297,400) 162,695 - (9,964,345)
Total accumulated depreciation (97,059,523) (4,579,330) 166,572 - (101,472,281)
Total capital assets, being depreciated, net 94,677,043 (4,404,648) - 7,024,302 97,296,697
Total capital assets, net 113,119,047$ 8,293,406$ (463,651)$ -$ 120,948,802$
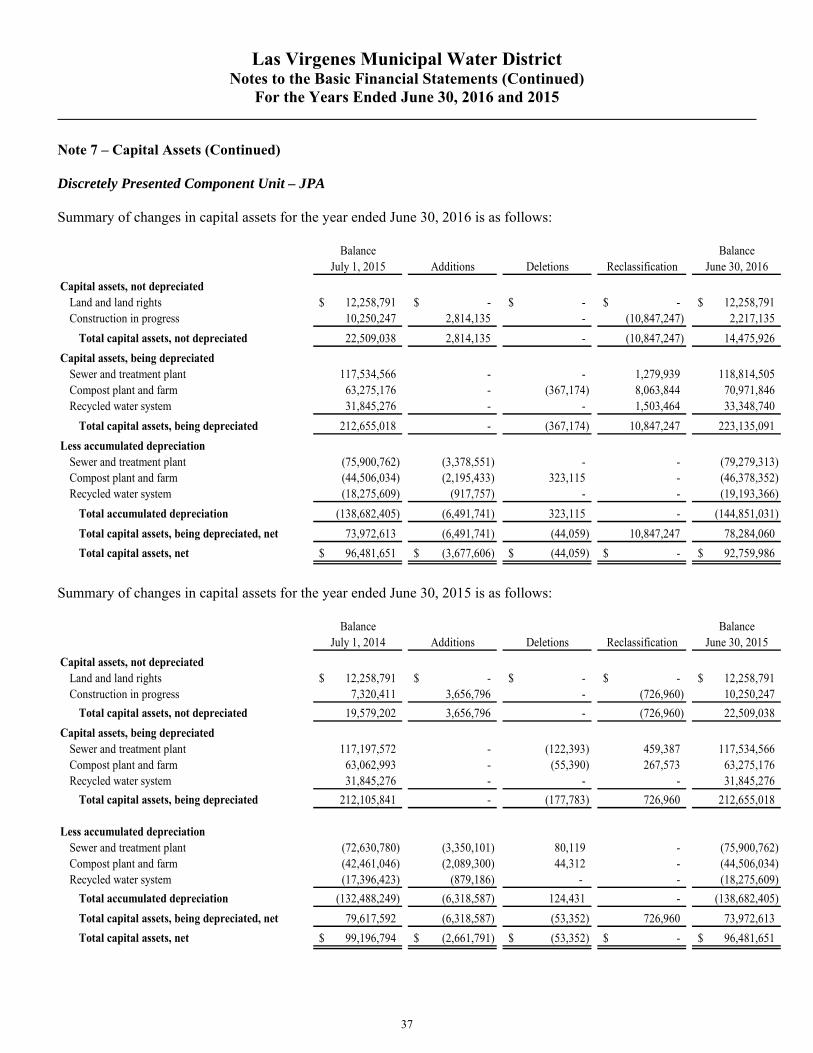
Las Virgenes Municipal Water District Notes to the Basic Financial Statements (Continued)
For the Years Ended June 30, 2016 and 2015
37
Note 7 – Capital Assets (Continued) Discretely Presented Component Unit – JPA Summary of changes in capital assets for the year ended June 30, 2016 is as follows:
Balance BalanceJuly 1, 2015 Additions Deletions Reclassification June 30, 2016
Capital assets, not depreciatedLand and land rights 12,258,791$ -$ -$ -$ 12,258,791$ Construction in progress 10,250,247 2,814,135 - (10,847,247) 2,217,135
Total capital assets, not depreciated 22,509,038 2,814,135 - (10,847,247) 14,475,926
Capital assets, being depreciatedSewer and treatment plant 117,534,566 - - 1,279,939 118,814,505 Compost plant and farm 63,275,176 - (367,174) 8,063,844 70,971,846 Recycled water system 31,845,276 - - 1,503,464 33,348,740
Total capital assets, being depreciated 212,655,018 - (367,174) 10,847,247 223,135,091
Less accumulated depreciationSewer and treatment plant (75,900,762) (3,378,551) - - (79,279,313) Compost plant and farm (44,506,034) (2,195,433) 323,115 - (46,378,352) Recycled water system (18,275,609) (917,757) - - (19,193,366)
Total accumulated depreciation (138,682,405) (6,491,741) 323,115 - (144,851,031)
Total capital assets, being depreciated, net 73,972,613 (6,491,741) (44,059) 10,847,247 78,284,060
Total capital assets, net 96,481,651$ (3,677,606)$ (44,059)$ -$ 92,759,986$
Summary of changes in capital assets for the year ended June 30, 2015 is as follows:
Balance BalanceJuly 1, 2014 Additions Deletions Reclassification June 30, 2015
Capital assets, not depreciatedLand and land rights 12,258,791$ -$ -$ -$ 12,258,791$ Construction in progress 7,320,411 3,656,796 - (726,960) 10,250,247
Total capital assets, not depreciated 19,579,202 3,656,796 - (726,960) 22,509,038
Capital assets, being depreciatedSewer and treatment plant 117,197,572 - (122,393) 459,387 117,534,566 Compost plant and farm 63,062,993 - (55,390) 267,573 63,275,176 Recycled water system 31,845,276 - - - 31,845,276
Total capital assets, being depreciated 212,105,841 - (177,783) 726,960 212,655,018
Less accumulated depreciationSewer and treatment plant (72,630,780) (3,350,101) 80,119 - (75,900,762) Compost plant and farm (42,461,046) (2,089,300) 44,312 - (44,506,034) Recycled water system (17,396,423) (879,186) - - (18,275,609)
Total accumulated depreciation (132,488,249) (6,318,587) 124,431 - (138,682,405)
Total capital assets, being depreciated, net 79,617,592 (6,318,587) (53,352) 726,960 73,972,613
Total capital assets, net 99,196,794$ (2,661,791)$ (53,352)$ -$ 96,481,651$
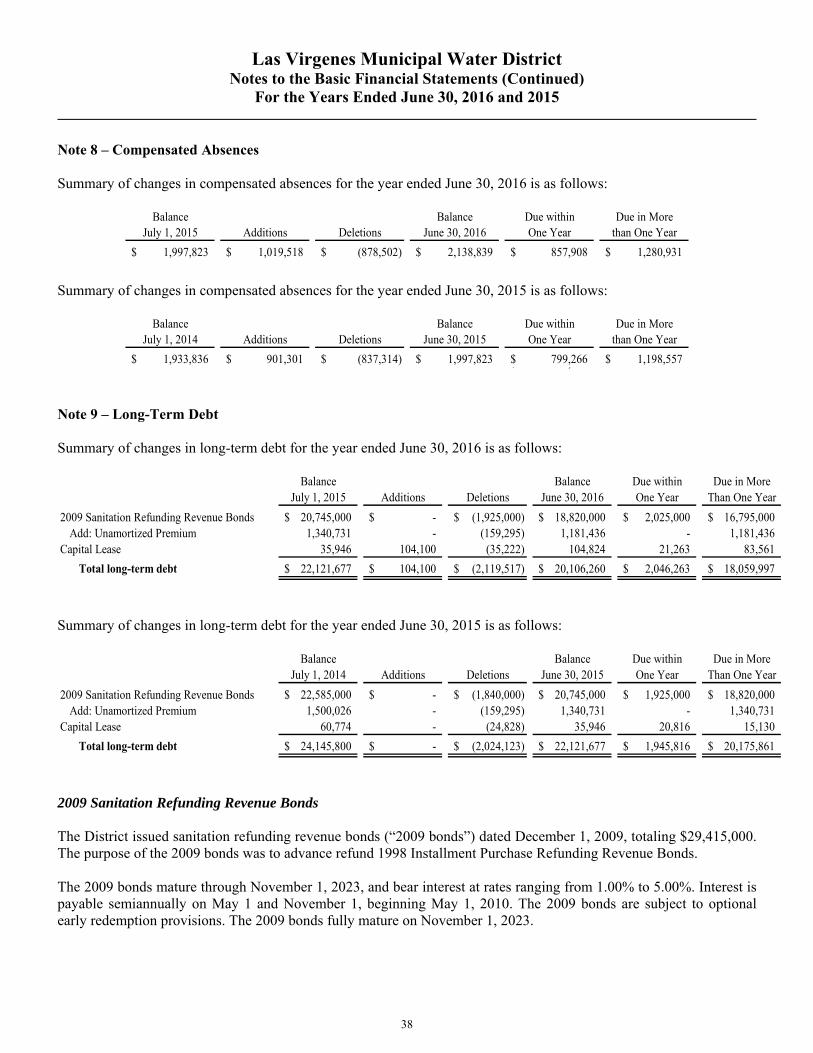
Las Virgenes Municipal Water District Notes to the Basic Financial Statements (Continued)
For the Years Ended June 30, 2016 and 2015
38
Note 8 – Compensated Absences Summary of changes in compensated absences for the year ended June 30, 2016 is as follows:
Balance Balance Due within Due in MoreJuly 1, 2015 Additions Deletions June 30, 2016 One Year than One Year
1,997,823$ 1,019,518$ (878,502)$ 2,138,839$ 857,908$ 1,280,931$
Summary of changes in compensated absences for the year ended June 30, 2015 is as follows:
Balance Balance Due within Due in MoreJuly 1, 2014 Additions Deletions June 30, 2015 One Year than One Year
1,933,836$ 901,301$ (837,314)$ 1,997,823$ 799,266$ 1,198,557$ ,$
Note 9 – Long-Term Debt Summary of changes in long-term debt for the year ended June 30, 2016 is as follows:
Balance Balance Due within Due in MoreJuly 1, 2015 Additions Deletions June 30, 2016 One Year Than One Year
2009 Sanitation Refunding Revenue Bonds 20,745,000$ -$ (1,925,000)$ 18,820,000$ 2,025,000$ 16,795,000$ Add: Unamortized Premium 1,340,731 - (159,295) 1,181,436 - 1,181,436
Capital Lease 35,946 104,100 (35,222) 104,824 21,263 83,561
Total long-term debt 22,121,677$ 104,100$ (2,119,517)$ 20,106,260$ 2,046,263$ 18,059,997$
Summary of changes in long-term debt for the year ended June 30, 2015 is as follows:
Balance Balance Due within Due in MoreJuly 1, 2014 Additions Deletions June 30, 2015 One Year Than One Year
2009 Sanitation Refunding Revenue Bonds 22,585,000$ -$ (1,840,000)$ 20,745,000$ 1,925,000$ 18,820,000$ Add: Unamortized Premium 1,500,026 - (159,295) 1,340,731 - 1,340,731
Capital Lease 60,774 - (24,828) 35,946 20,816 15,130
Total long-term debt 24,145,800$ -$ (2,024,123)$ 22,121,677$ 1,945,816$ 20,175,861$
2009 Sanitation Refunding Revenue Bonds The District issued sanitation refunding revenue bonds (“2009 bonds”) dated December 1, 2009, totaling $29,415,000. The purpose of the 2009 bonds was to advance refund 1998 Installment Purchase Refunding Revenue Bonds. The 2009 bonds mature through November 1, 2023, and bear interest at rates ranging from 1.00% to 5.00%. Interest is payable semiannually on May 1 and November 1, beginning May 1, 2010. The 2009 bonds are subject to optional early redemption provisions. The 2009 bonds fully mature on November 1, 2023.
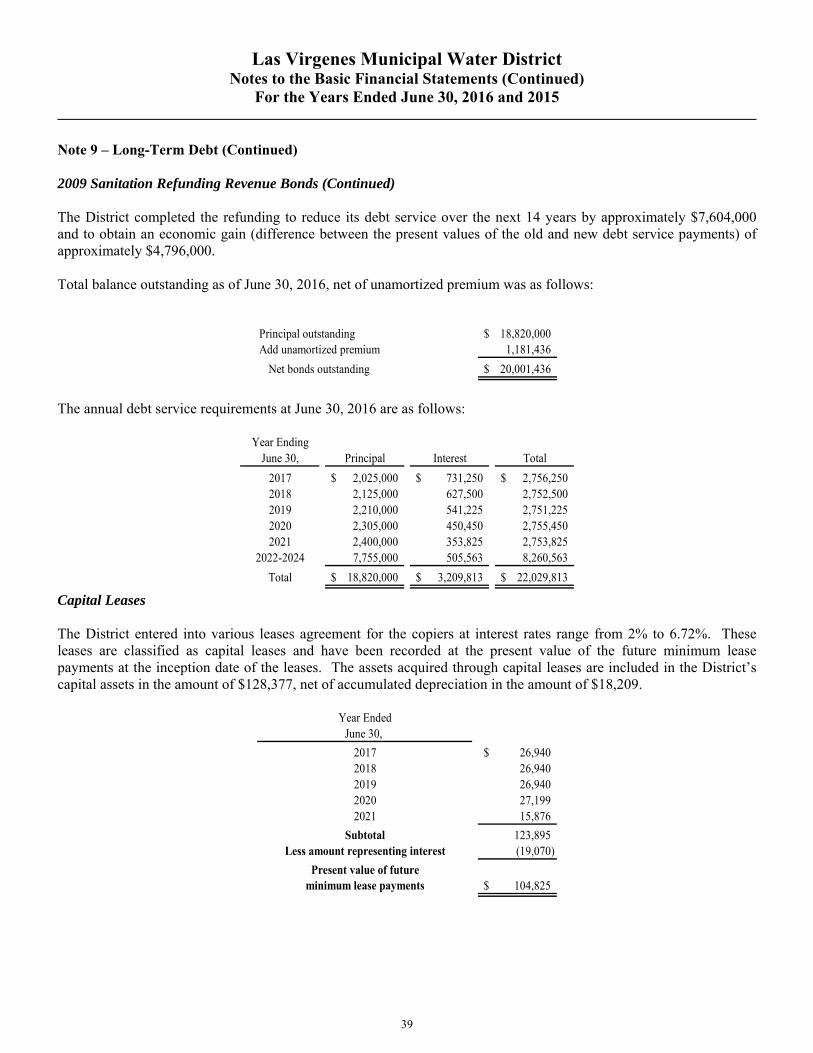
Las Virgenes Municipal Water District Notes to the Basic Financial Statements (Continued)
For the Years Ended June 30, 2016 and 2015
39
Note 9 – Long-Term Debt (Continued) 2009 Sanitation Refunding Revenue Bonds (Continued) The District completed the refunding to reduce its debt service over the next 14 years by approximately $7,604,000 and to obtain an economic gain (difference between the present values of the old and new debt service payments) of approximately $4,796,000. Total balance outstanding as of June 30, 2016, net of unamortized premium was as follows:
Principal outstanding 18,820,000$ Add unamortized premium 1,181,436
Net bonds outstanding 20,001,436$
The annual debt service requirements at June 30, 2016 are as follows:
Year EndingJune 30, Principal Interest Total
2017 2,025,000$ 731,250$ 2,756,250$ 2018 2,125,000 627,500 2,752,500 2019 2,210,000 541,225 2,751,225 2020 2,305,000 450,450 2,755,450 2021 2,400,000 353,825 2,753,825
2022-2024 7,755,000 505,563 8,260,563
Total 18,820,000$ 3,209,813$ 22,029,813$
Capital Leases The District entered into various leases agreement for the copiers at interest rates range from 2% to 6.72%. These leases are classified as capital leases and have been recorded at the present value of the future minimum lease payments at the inception date of the leases. The assets acquired through capital leases are included in the District’s capital assets in the amount of $128,377, net of accumulated depreciation in the amount of $18,209.
Year EndedJune 30,
2017 26,940$ 2018 26,940 2019 26,940 2020 27,199 2021 15,876
Subtotal 123,895 Less amount representing interest (19,070)
Present value of futureminimum lease payments 104,825$
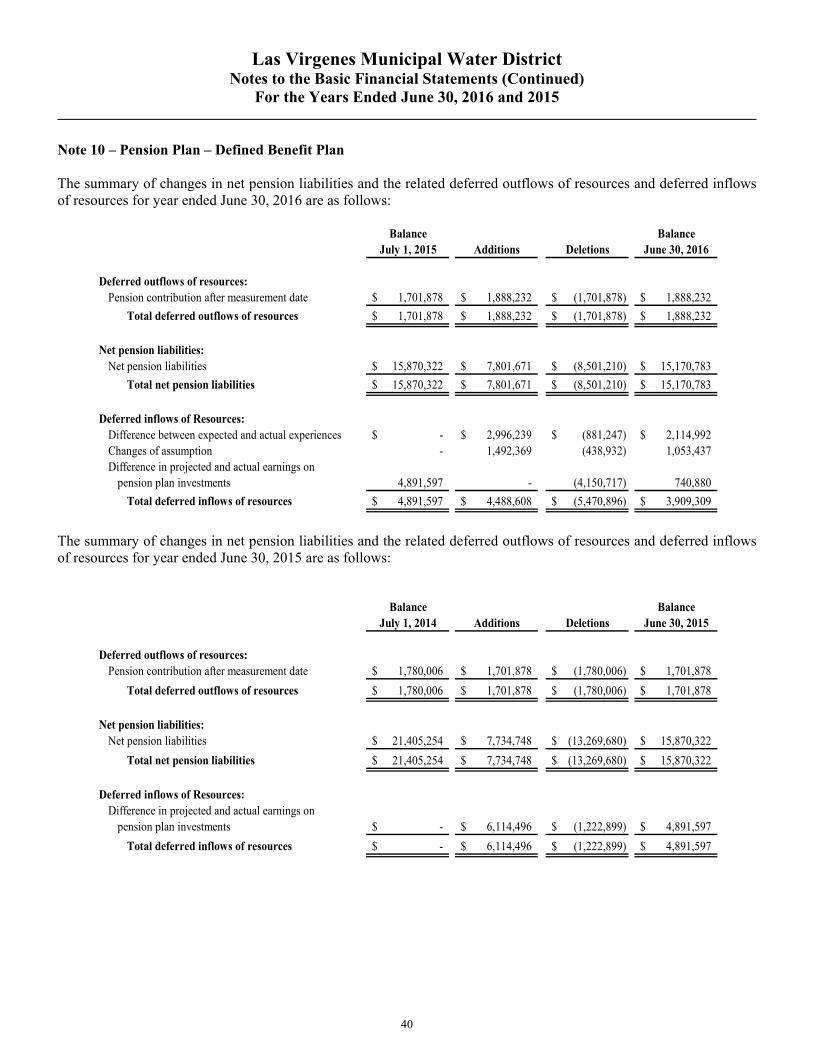
Las Virgenes Municipal Water District Notes to the Basic Financial Statements (Continued)
For the Years Ended June 30, 2016 and 2015
40
Note 10 – Pension Plan – Defined Benefit Plan The summary of changes in net pension liabilities and the related deferred outflows of resources and deferred inflows of resources for year ended June 30, 2016 are as follows:
Balance BalanceJuly 1, 2015 Additions Deletions June 30, 2016
Deferred outflows of resources:Pension contribution after measurement date 1,701,878$ 1,888,232$ (1,701,878)$ 1,888,232$
Total deferred outflows of resources 1,701,878$ 1,888,232$ (1,701,878)$ 1,888,232$
Net pension liabilities:Net pension liabilities 15,870,322$ 7,801,671$ (8,501,210)$ 15,170,783$
Total net pension liabilities 15,870,322$ 7,801,671$ (8,501,210)$ 15,170,783$
Deferred inflows of Resources:Difference between expected and actual experiences -$ 2,996,239$ (881,247)$ 2,114,992$ Changes of assumption - 1,492,369 (438,932) 1,053,437 Difference in projected and actual earnings on
pension plan investments 4,891,597 - (4,150,717) 740,880
Total deferred inflows of resources 4,891,597$ 4,488,608$ (5,470,896)$ 3,909,309$
The summary of changes in net pension liabilities and the related deferred outflows of resources and deferred inflows of resources for year ended June 30, 2015 are as follows:
Balance BalanceJuly 1, 2014 Additions Deletions June 30, 2015
Deferred outflows of resources:Pension contribution after measurement date 1,780,006$ 1,701,878$ (1,780,006)$ 1,701,878$
Total deferred outflows of resources 1,780,006$ 1,701,878$ (1,780,006)$ 1,701,878$
Net pension liabilities:Net pension liabilities 21,405,254$ 7,734,748$ (13,269,680)$ 15,870,322$
Total net pension liabilities 21,405,254$ 7,734,748$ (13,269,680)$ 15,870,322$
Deferred inflows of Resources:Difference in projected and actual earnings on
pension plan investments -$ 6,114,496$ (1,222,899)$ 4,891,597$
Total deferred inflows of resources -$ 6,114,496$ (1,222,899)$ 4,891,597$
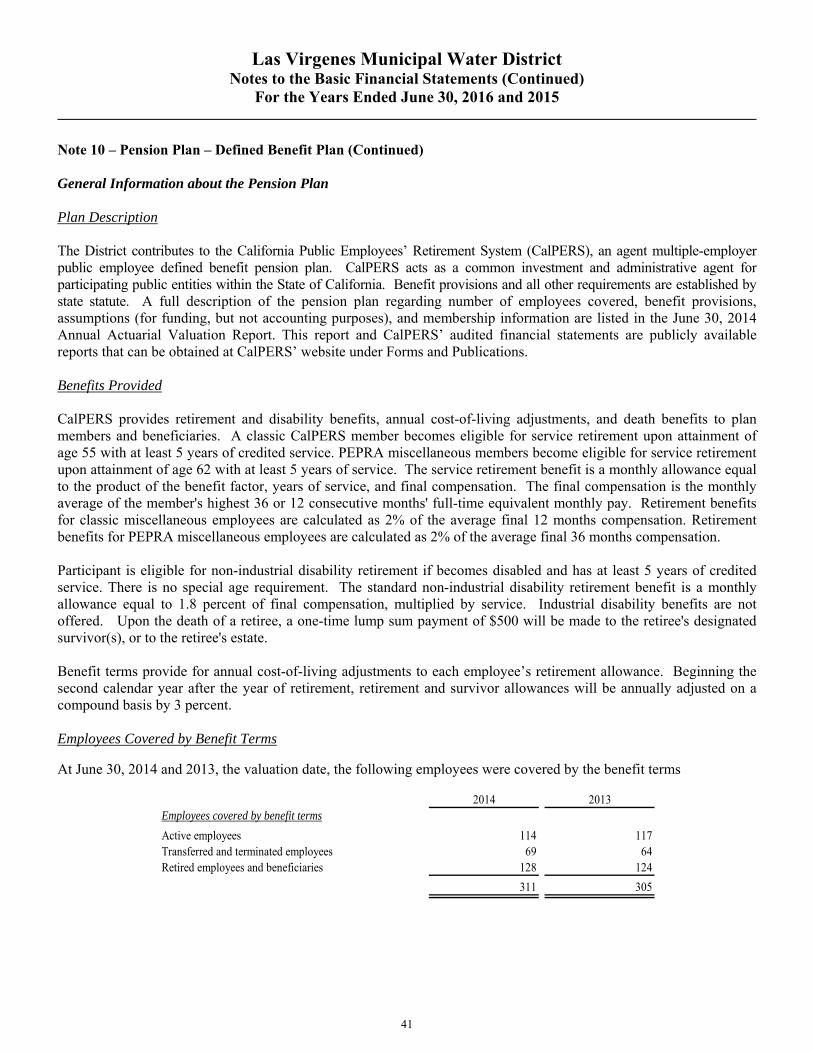
Las Virgenes Municipal Water District Notes to the Basic Financial Statements (Continued)
For the Years Ended June 30, 2016 and 2015
41
Note 10 – Pension Plan – Defined Benefit Plan (Continued) General Information about the Pension Plan Plan Description The District contributes to the California Public Employees’ Retirement System (CalPERS), an agent multiple-employer public employee defined benefit pension plan. CalPERS acts as a common investment and administrative agent for participating public entities within the State of California. Benefit provisions and all other requirements are established by state statute. A full description of the pension plan regarding number of employees covered, benefit provisions, assumptions (for funding, but not accounting purposes), and membership information are listed in the June 30, 2014 Annual Actuarial Valuation Report. This report and CalPERS’ audited financial statements are publicly available reports that can be obtained at CalPERS’ website under Forms and Publications. Benefits Provided CalPERS provides retirement and disability benefits, annual cost-of-living adjustments, and death benefits to plan members and beneficiaries. A classic CalPERS member becomes eligible for service retirement upon attainment of age 55 with at least 5 years of credited service. PEPRA miscellaneous members become eligible for service retirement upon attainment of age 62 with at least 5 years of service. The service retirement benefit is a monthly allowance equal to the product of the benefit factor, years of service, and final compensation. The final compensation is the monthly average of the member's highest 36 or 12 consecutive months' full-time equivalent monthly pay. Retirement benefits for classic miscellaneous employees are calculated as 2% of the average final 12 months compensation. Retirement benefits for PEPRA miscellaneous employees are calculated as 2% of the average final 36 months compensation. Participant is eligible for non-industrial disability retirement if becomes disabled and has at least 5 years of credited service. There is no special age requirement. The standard non-industrial disability retirement benefit is a monthly allowance equal to 1.8 percent of final compensation, multiplied by service. Industrial disability benefits are not offered. Upon the death of a retiree, a one-time lump sum payment of $500 will be made to the retiree's designated survivor(s), or to the retiree's estate. Benefit terms provide for annual cost-of-living adjustments to each employee’s retirement allowance. Beginning the second calendar year after the year of retirement, retirement and survivor allowances will be annually adjusted on a compound basis by 3 percent. Employees Covered by Benefit Terms At June 30, 2014 and 2013, the valuation date, the following employees were covered by the benefit terms
2014 2013Employees covered by benefit terms
Active employees 114 117Transferred and terminated employees 69 64Retired employees and beneficiaries 128 124
311 305
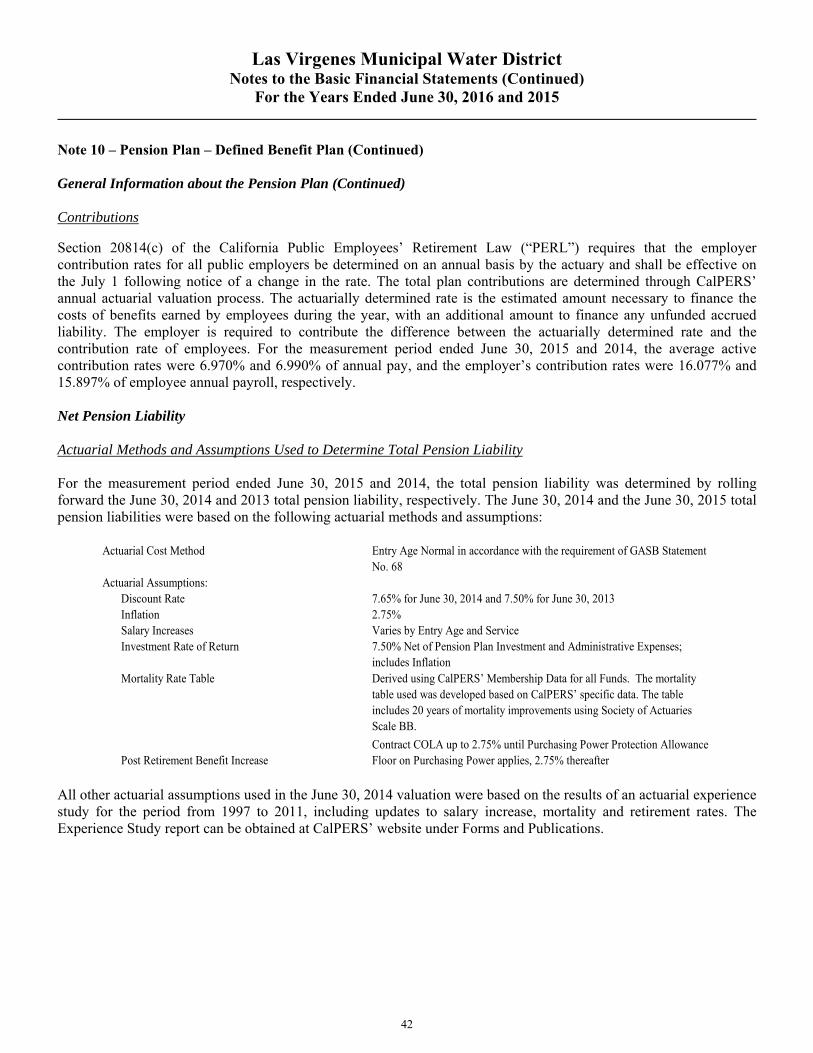
Las Virgenes Municipal Water District Notes to the Basic Financial Statements (Continued)
For the Years Ended June 30, 2016 and 2015
42
Note 10 – Pension Plan – Defined Benefit Plan (Continued) General Information about the Pension Plan (Continued) Contributions Section 20814(c) of the California Public Employees’ Retirement Law (“PERL”) requires that the employer contribution rates for all public employers be determined on an annual basis by the actuary and shall be effective on the July 1 following notice of a change in the rate. The total plan contributions are determined through CalPERS’ annual actuarial valuation process. The actuarially determined rate is the estimated amount necessary to finance the costs of benefits earned by employees during the year, with an additional amount to finance any unfunded accrued liability. The employer is required to contribute the difference between the actuarially determined rate and the contribution rate of employees. For the measurement period ended June 30, 2015 and 2014, the average active contribution rates were 6.970% and 6.990% of annual pay, and the employer’s contribution rates were 16.077% and 15.897% of employee annual payroll, respectively. Net Pension Liability Actuarial Methods and Assumptions Used to Determine Total Pension Liability For the measurement period ended June 30, 2015 and 2014, the total pension liability was determined by rolling forward the June 30, 2014 and 2013 total pension liability, respectively. The June 30, 2014 and the June 30, 2015 total pension liabilities were based on the following actuarial methods and assumptions:
Actuarial Cost Method
Actuarial Assumptions:Discount RateInflationSalary IncreasesInvestment Rate of Return
Mortality Rate Table
Post Retirement Benefit Increase
7.50% Net of Pension Plan Investment and Administrative Expenses; includes Inflation
Varies by Entry Age and Service2.75%
Entry Age Normal in accordance with the requirement of GASB Statement No. 68
Derived using CalPERS’ Membership Data for all Funds. The mortality table used was developed based on CalPERS’ specific data. The table includes 20 years of mortality improvements using Society of Actuaries Scale BB.
Contract COLA up to 2.75% until Purchasing Power Protection Allowance Floor on Purchasing Power applies, 2.75% thereafter
7.65% for June 30, 2014 and 7.50% for June 30, 2013
All other actuarial assumptions used in the June 30, 2014 valuation were based on the results of an actuarial experience study for the period from 1997 to 2011, including updates to salary increase, mortality and retirement rates. The Experience Study report can be obtained at CalPERS’ website under Forms and Publications.
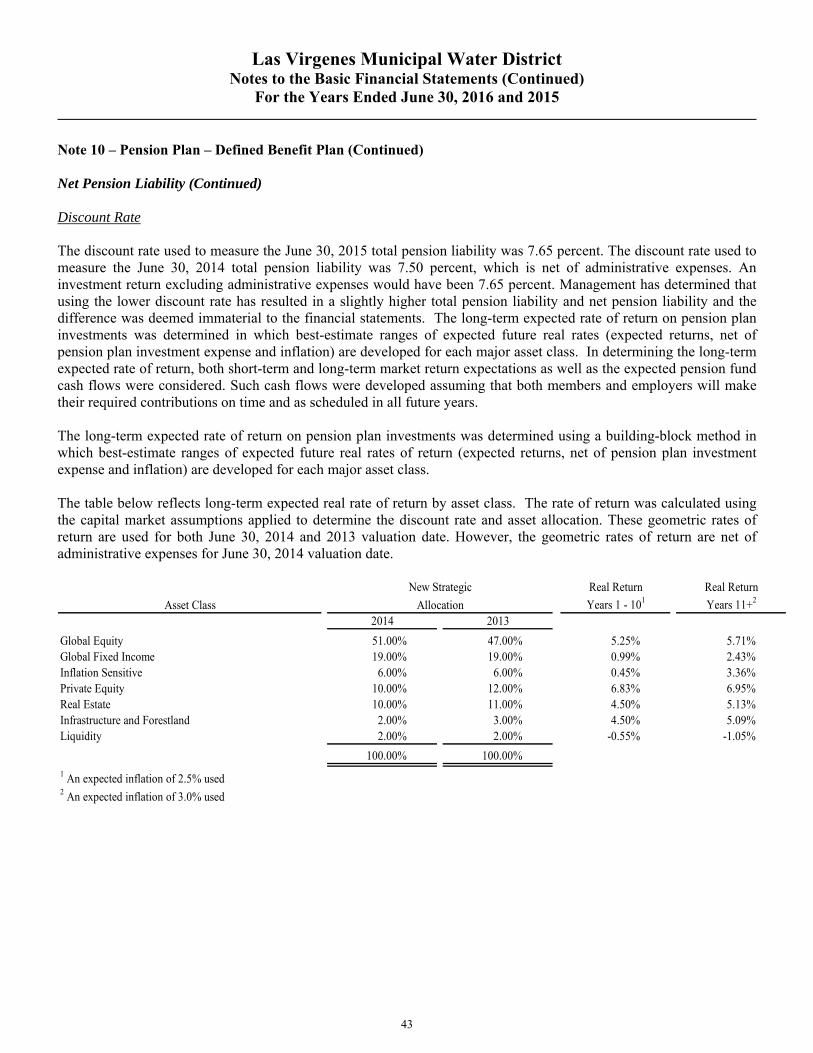
Las Virgenes Municipal Water District Notes to the Basic Financial Statements (Continued)
For the Years Ended June 30, 2016 and 2015
43
Note 10 – Pension Plan – Defined Benefit Plan (Continued) Net Pension Liability (Continued) Discount Rate The discount rate used to measure the June 30, 2015 total pension liability was 7.65 percent. The discount rate used to measure the June 30, 2014 total pension liability was 7.50 percent, which is net of administrative expenses. An investment return excluding administrative expenses would have been 7.65 percent. Management has determined that using the lower discount rate has resulted in a slightly higher total pension liability and net pension liability and the difference was deemed immaterial to the financial statements. The long-term expected rate of return on pension plan investments was determined in which best-estimate ranges of expected future real rates (expected returns, net of pension plan investment expense and inflation) are developed for each major asset class. In determining the long-term expected rate of return, both short-term and long-term market return expectations as well as the expected pension fund cash flows were considered. Such cash flows were developed assuming that both members and employers will make their required contributions on time and as scheduled in all future years. The long-term expected rate of return on pension plan investments was determined using a building-block method in which best-estimate ranges of expected future real rates of return (expected returns, net of pension plan investment expense and inflation) are developed for each major asset class. The table below reflects long-term expected real rate of return by asset class. The rate of return was calculated using the capital market assumptions applied to determine the discount rate and asset allocation. These geometric rates of return are used for both June 30, 2014 and 2013 valuation date. However, the geometric rates of return are net of administrative expenses for June 30, 2014 valuation date.
Real Return Real Return
Asset Class Years 1 - 101 Years 11+2
2014 2013
Global Equity 51.00% 47.00% 5.25% 5.71%Global Fixed Income 19.00% 19.00% 0.99% 2.43%Inflation Sensitive 6.00% 6.00% 0.45% 3.36%Private Equity 10.00% 12.00% 6.83% 6.95%Real Estate 10.00% 11.00% 4.50% 5.13%Infrastructure and Forestland 2.00% 3.00% 4.50% 5.09%Liquidity 2.00% 2.00% -0.55% -1.05%
100.00% 100.00%1 An expected inflation of 2.5% used2 An expected inflation of 3.0% used
Allocation
New Strategic
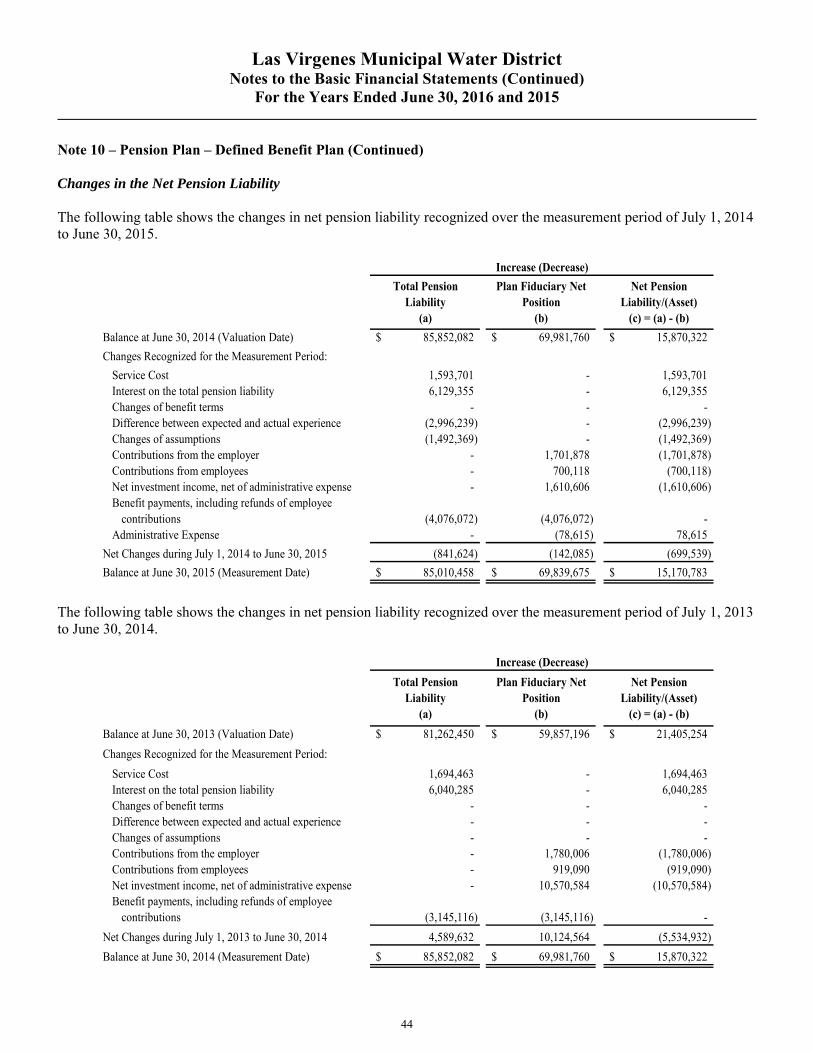
Las Virgenes Municipal Water District Notes to the Basic Financial Statements (Continued)
For the Years Ended June 30, 2016 and 2015
44
Note 10 – Pension Plan – Defined Benefit Plan (Continued) Changes in the Net Pension Liability The following table shows the changes in net pension liability recognized over the measurement period of July 1, 2014 to June 30, 2015.
Total Pension Plan Fiduciary Net Net PensionLiability Position Liability/(Asset)
(a) (b) (c) = (a) - (b)
Balance at June 30, 2014 (Valuation Date) 85,852,082$ 69,981,760$ 15,870,322$
Changes Recognized for the Measurement Period:
Service Cost 1,593,701 - 1,593,701 Interest on the total pension liability 6,129,355 - 6,129,355 Changes of benefit terms - - - Difference between expected and actual experience (2,996,239) - (2,996,239) Changes of assumptions (1,492,369) - (1,492,369) Contributions from the employer - 1,701,878 (1,701,878) Contributions from employees - 700,118 (700,118) Net investment income, net of administrative expense - 1,610,606 (1,610,606) Benefit payments, including refunds of employee
contributions (4,076,072) (4,076,072) - Administrative Expense - (78,615) 78,615
Net Changes during July 1, 2014 to June 30, 2015 (841,624) (142,085) (699,539)
Balance at June 30, 2015 (Measurement Date) 85,010,458$ 69,839,675$ 15,170,783$
Increase (Decrease)
The following table shows the changes in net pension liability recognized over the measurement period of July 1, 2013 to June 30, 2014.
Total Pension Plan Fiduciary Net Net PensionLiability Position Liability/(Asset)
(a) (b) (c) = (a) - (b)
Balance at June 30, 2013 (Valuation Date) 81,262,450$ 59,857,196$ 21,405,254$
Changes Recognized for the Measurement Period:
Service Cost 1,694,463 - 1,694,463 Interest on the total pension liability 6,040,285 - 6,040,285 Changes of benefit terms - - - Difference between expected and actual experience - - - Changes of assumptions - - - Contributions from the employer - 1,780,006 (1,780,006) Contributions from employees - 919,090 (919,090) Net investment income, net of administrative expense - 10,570,584 (10,570,584) Benefit payments, including refunds of employee
contributions (3,145,116) (3,145,116) -
Net Changes during July 1, 2013 to June 30, 2014 4,589,632 10,124,564 (5,534,932)
Balance at June 30, 2014 (Measurement Date) 85,852,082$ 69,981,760$ 15,870,322$
Increase (Decrease)
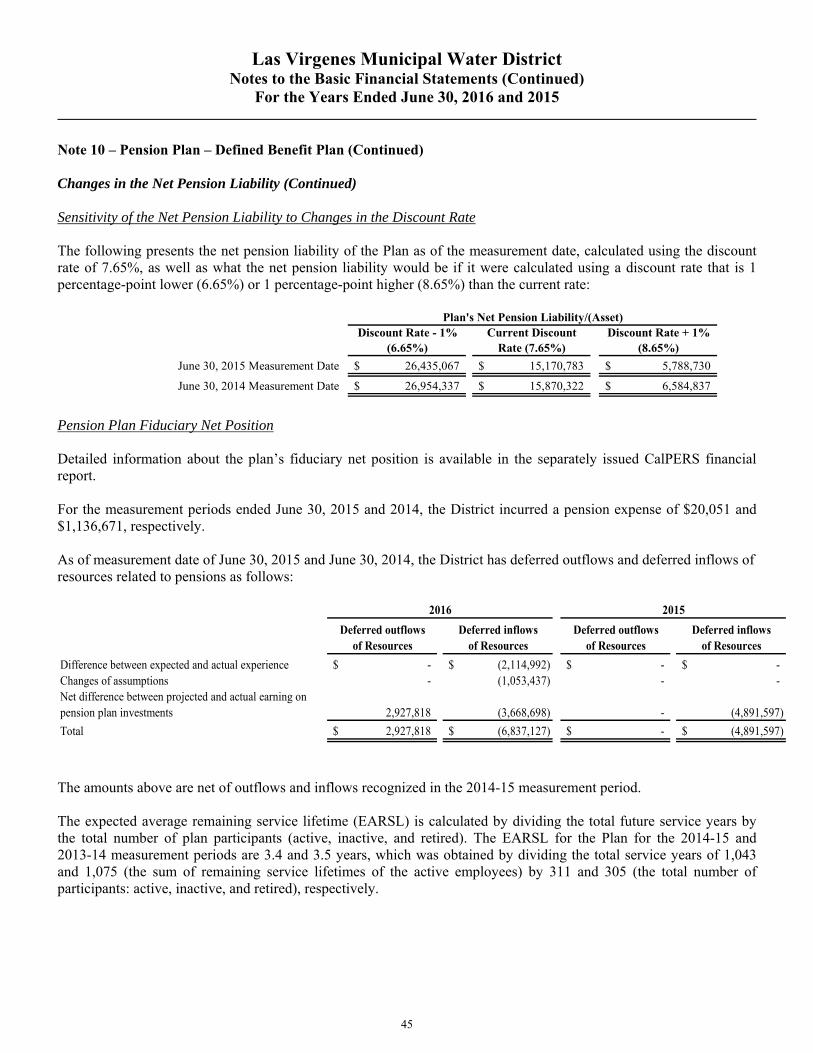
Las Virgenes Municipal Water District Notes to the Basic Financial Statements (Continued)
For the Years Ended June 30, 2016 and 2015
45
Note 10 – Pension Plan – Defined Benefit Plan (Continued) Changes in the Net Pension Liability (Continued) Sensitivity of the Net Pension Liability to Changes in the Discount Rate The following presents the net pension liability of the Plan as of the measurement date, calculated using the discount rate of 7.65%, as well as what the net pension liability would be if it were calculated using a discount rate that is 1 percentage-point lower (6.65%) or 1 percentage-point higher (8.65%) than the current rate:
Discount Rate - 1% Current Discount Discount Rate + 1%(6.65%) Rate (7.65%) (8.65%)
June 30, 2015 Measurement Date 26,435,067$ 15,170,783$ 5,788,730$
June 30, 2014 Measurement Date 26,954,337$ 15,870,322$ 6,584,837$
Plan's Net Pension Liability/(Asset)
Pension Plan Fiduciary Net Position Detailed information about the plan’s fiduciary net position is available in the separately issued CalPERS financial report. For the measurement periods ended June 30, 2015 and 2014, the District incurred a pension expense of $20,051 and $1,136,671, respectively. As of measurement date of June 30, 2015 and June 30, 2014, the District has deferred outflows and deferred inflows of resources related to pensions as follows:
Deferred outflows Deferred inflows Deferred outflows Deferred inflowsof Resources of Resources of Resources of Resources
Difference between expected and actual experience -$ (2,114,992)$ -$ -$ Changes of assumptions - (1,053,437) - - Net difference between projected and actual earning on pension plan investments 2,927,818 (3,668,698) - (4,891,597)
Total 2,927,818$ (6,837,127)$ -$ (4,891,597)$
20152016
The amounts above are net of outflows and inflows recognized in the 2014-15 measurement period. The expected average remaining service lifetime (EARSL) is calculated by dividing the total future service years by the total number of plan participants (active, inactive, and retired). The EARSL for the Plan for the 2014-15 and 2013-14 measurement periods are 3.4 and 3.5 years, which was obtained by dividing the total service years of 1,043 and 1,075 (the sum of remaining service lifetimes of the active employees) by 311 and 305 (the total number of participants: active, inactive, and retired), respectively.
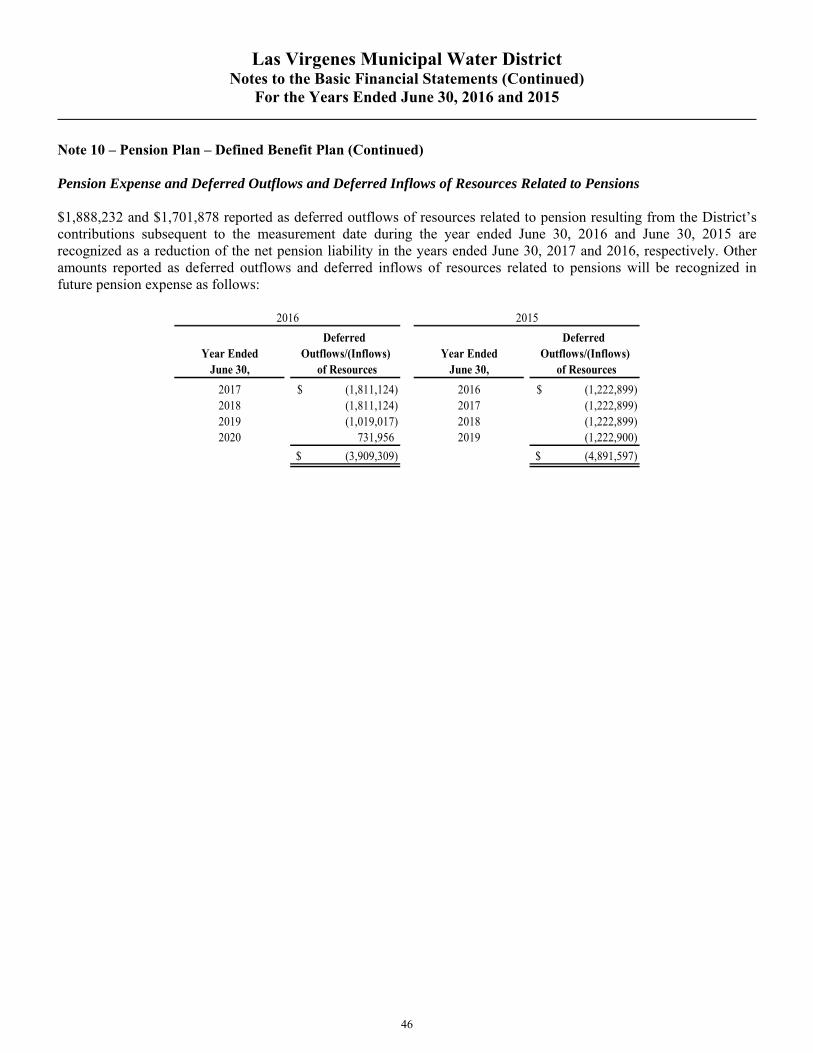
Las Virgenes Municipal Water District Notes to the Basic Financial Statements (Continued)
For the Years Ended June 30, 2016 and 2015
46
Note 10 – Pension Plan – Defined Benefit Plan (Continued) Pension Expense and Deferred Outflows and Deferred Inflows of Resources Related to Pensions $1,888,232 and $1,701,878 reported as deferred outflows of resources related to pension resulting from the District’s contributions subsequent to the measurement date during the year ended June 30, 2016 and June 30, 2015 are recognized as a reduction of the net pension liability in the years ended June 30, 2017 and 2016, respectively. Other amounts reported as deferred outflows and deferred inflows of resources related to pensions will be recognized in future pension expense as follows:
Deferred Year Ended Outflows/(Inflows)
June 30, of Resources
2017 (1,811,124)$ 2018 (1,811,124) 2019 (1,019,017) 2020 731,956
(3,909,309)$
2016
Deferred Year Ended Outflows/(Inflows)
June 30, of Resources
2016 (1,222,899)$ 2017 (1,222,899) 2018 (1,222,899) 2019 (1,222,900)
(4,891,597)$
2015
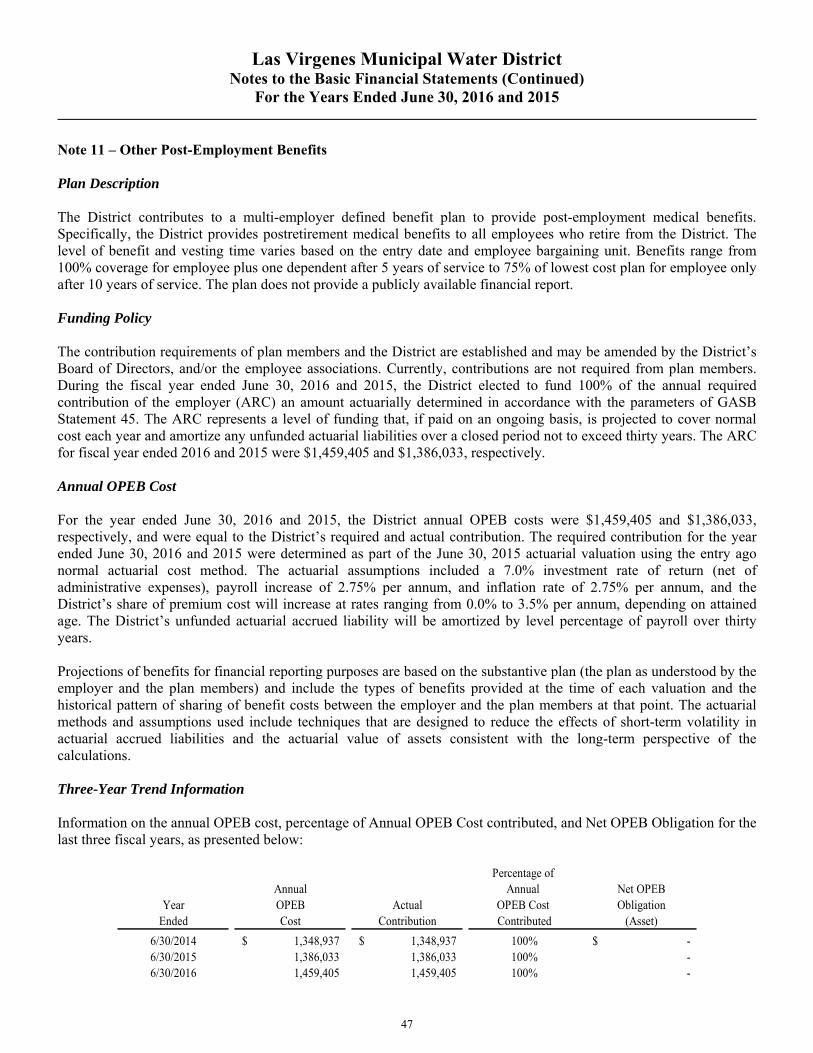
Las Virgenes Municipal Water District Notes to the Basic Financial Statements (Continued)
For the Years Ended June 30, 2016 and 2015
47
Note 11 – Other Post-Employment Benefits Plan Description The District contributes to a multi-employer defined benefit plan to provide post-employment medical benefits. Specifically, the District provides postretirement medical benefits to all employees who retire from the District. The level of benefit and vesting time varies based on the entry date and employee bargaining unit. Benefits range from 100% coverage for employee plus one dependent after 5 years of service to 75% of lowest cost plan for employee only after 10 years of service. The plan does not provide a publicly available financial report. Funding Policy The contribution requirements of plan members and the District are established and may be amended by the District’s Board of Directors, and/or the employee associations. Currently, contributions are not required from plan members. During the fiscal year ended June 30, 2016 and 2015, the District elected to fund 100% of the annual required contribution of the employer (ARC) an amount actuarially determined in accordance with the parameters of GASB Statement 45. The ARC represents a level of funding that, if paid on an ongoing basis, is projected to cover normal cost each year and amortize any unfunded actuarial liabilities over a closed period not to exceed thirty years. The ARC for fiscal year ended 2016 and 2015 were $1,459,405 and $1,386,033, respectively. Annual OPEB Cost For the year ended June 30, 2016 and 2015, the District annual OPEB costs were $1,459,405 and $1,386,033, respectively, and were equal to the District’s required and actual contribution. The required contribution for the year ended June 30, 2016 and 2015 were determined as part of the June 30, 2015 actuarial valuation using the entry ago normal actuarial cost method. The actuarial assumptions included a 7.0% investment rate of return (net of administrative expenses), payroll increase of 2.75% per annum, and inflation rate of 2.75% per annum, and the District’s share of premium cost will increase at rates ranging from 0.0% to 3.5% per annum, depending on attained age. The District’s unfunded actuarial accrued liability will be amortized by level percentage of payroll over thirty years. Projections of benefits for financial reporting purposes are based on the substantive plan (the plan as understood by the employer and the plan members) and include the types of benefits provided at the time of each valuation and the historical pattern of sharing of benefit costs between the employer and the plan members at that point. The actuarial methods and assumptions used include techniques that are designed to reduce the effects of short-term volatility in actuarial accrued liabilities and the actuarial value of assets consistent with the long-term perspective of the calculations. Three-Year Trend Information Information on the annual OPEB cost, percentage of Annual OPEB Cost contributed, and Net OPEB Obligation for the last three fiscal years, as presented below:
Percentage of Annual Annual Net OPEB
Year OPEB Actual OPEB Cost ObligationEnded Cost Contribution Contributed (Asset)
6/30/2014 1,348,937$ 1,348,937$ 100% -$ 6/30/2015 1,386,033 1,386,033 100% - 6/30/2016 1,459,405 1,459,405 100% -
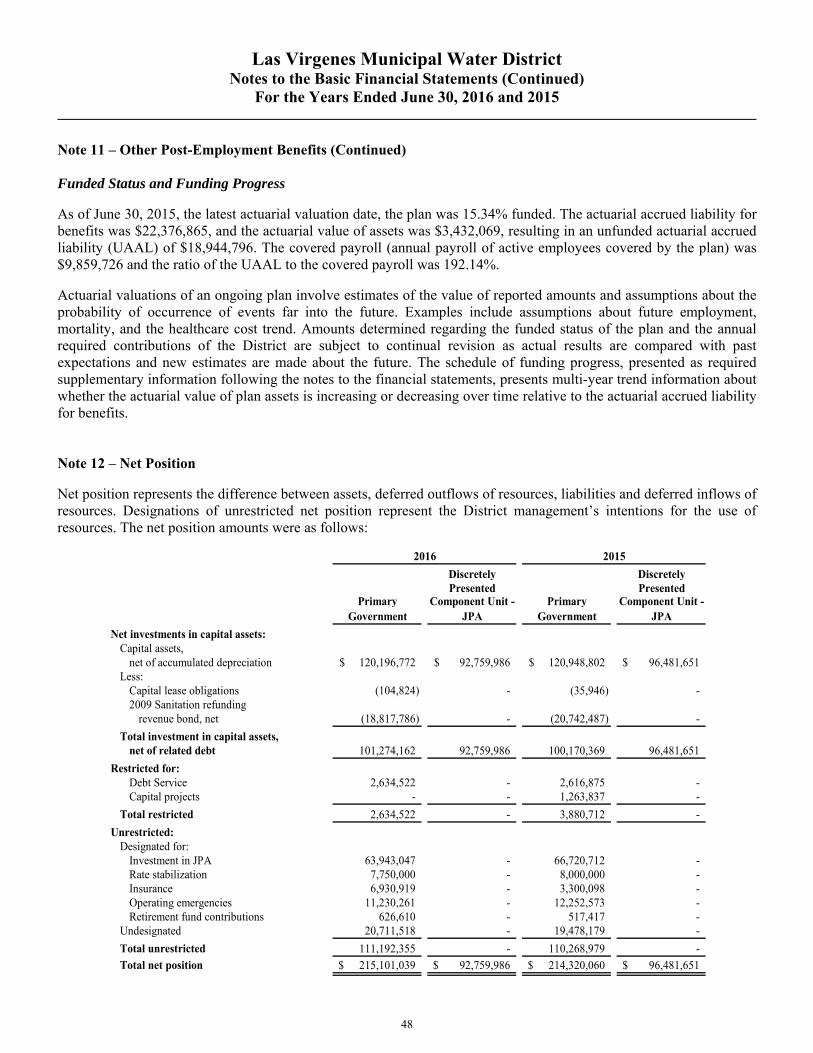
Las Virgenes Municipal Water District Notes to the Basic Financial Statements (Continued)
For the Years Ended June 30, 2016 and 2015
48
Note 11 – Other Post-Employment Benefits (Continued) Funded Status and Funding Progress As of June 30, 2015, the latest actuarial valuation date, the plan was 15.34% funded. The actuarial accrued liability for benefits was $22,376,865, and the actuarial value of assets was $3,432,069, resulting in an unfunded actuarial accrued liability (UAAL) of $18,944,796. The covered payroll (annual payroll of active employees covered by the plan) was $9,859,726 and the ratio of the UAAL to the covered payroll was 192.14%. Actuarial valuations of an ongoing plan involve estimates of the value of reported amounts and assumptions about the probability of occurrence of events far into the future. Examples include assumptions about future employment, mortality, and the healthcare cost trend. Amounts determined regarding the funded status of the plan and the annual required contributions of the District are subject to continual revision as actual results are compared with past expectations and new estimates are made about the future. The schedule of funding progress, presented as required supplementary information following the notes to the financial statements, presents multi-year trend information about whether the actuarial value of plan assets is increasing or decreasing over time relative to the actuarial accrued liability for benefits. Note 12 – Net Position Net position represents the difference between assets, deferred outflows of resources, liabilities and deferred inflows of resources. Designations of unrestricted net position represent the District management’s intentions for the use of resources. The net position amounts were as follows:
Discretely DiscretelyPresented Presented
Primary Component Unit - Primary Component Unit -Government JPA Government JPA
Net investments in capital assets: Capital assets,
net of accumulated depreciation 120,196,772$ 92,759,986$ 120,948,802$ 96,481,651$ Less:
Capital lease obligations (104,824) - (35,946) - 2009 Sanitation refunding
revenue bond, net (18,817,786) - (20,742,487) -
Total investment in capital assets, net of related debt 101,274,162 92,759,986 100,170,369 96,481,651
Restricted for: Debt Service 2,634,522 - 2,616,875 - Capital projects - - 1,263,837 -
Total restricted 2,634,522 - 3,880,712 -
Unrestricted:Designated for:
Investment in JPA 63,943,047 - 66,720,712 - Rate stabilization 7,750,000 - 8,000,000 - Insurance 6,930,919 - 3,300,098 - Operating emergencies 11,230,261 - 12,252,573 - Retirement fund contributions 626,610 - 517,417 -
Undesignated 20,711,518 - 19,478,179 -
Total unrestricted 111,192,355 - 110,268,979 -
Total net position 215,101,039$ 92,759,986$ 214,320,060$ 96,481,651$
2016 2015
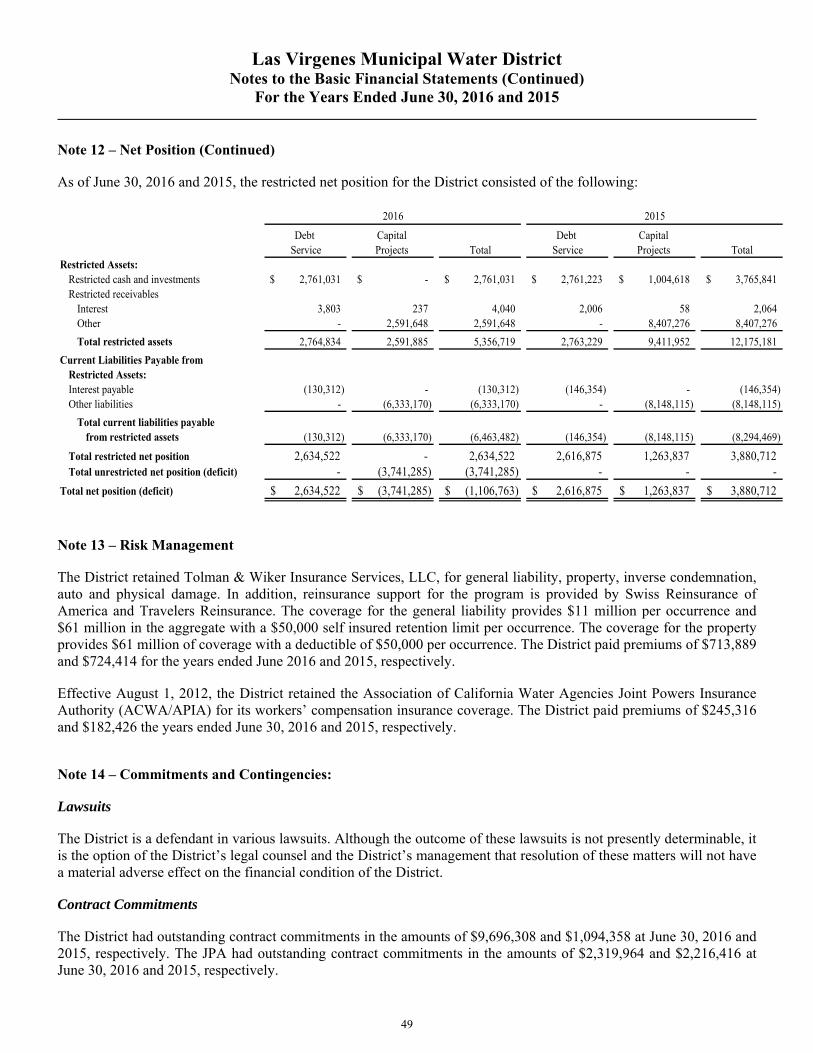
Las Virgenes Municipal Water District Notes to the Basic Financial Statements (Continued)
For the Years Ended June 30, 2016 and 2015
49
Note 12 – Net Position (Continued) As of June 30, 2016 and 2015, the restricted net position for the District consisted of the following:
Debt Capital Debt Capital Service Projects Total Service Projects Total
Restricted Assets: Restricted cash and investments 2,761,031$ -$ 2,761,031$ 2,761,223$ 1,004,618$ 3,765,841$ Restricted receivables
Interest 3,803 237 4,040 2,006 58 2,064 Other - 2,591,648 2,591,648 - 8,407,276 8,407,276
Total restricted assets 2,764,834 2,591,885 5,356,719 2,763,229 9,411,952 12,175,181
Current Liabilities Payable from Restricted Assets:Interest payable (130,312) - (130,312) (146,354) - (146,354) Other liabilities - (6,333,170) (6,333,170) - (8,148,115) (8,148,115)
Total current liabilities payablefrom restricted assets (130,312) (6,333,170) (6,463,482) (146,354) (8,148,115) (8,294,469)
Total restricted net position 2,634,522 - 2,634,522 2,616,875 1,263,837 3,880,712 Total unrestricted net position (deficit) - (3,741,285) (3,741,285) - - -
Total net position (deficit) 2,634,522$ (3,741,285)$ (1,106,763)$ 2,616,875$ 1,263,837$ 3,880,712$
20152016
Note 13 – Risk Management The District retained Tolman & Wiker Insurance Services, LLC, for general liability, property, inverse condemnation, auto and physical damage. In addition, reinsurance support for the program is provided by Swiss Reinsurance of America and Travelers Reinsurance. The coverage for the general liability provides $11 million per occurrence and $61 million in the aggregate with a $50,000 self insured retention limit per occurrence. The coverage for the property provides $61 million of coverage with a deductible of $50,000 per occurrence. The District paid premiums of $713,889 and $724,414 for the years ended June 2016 and 2015, respectively. Effective August 1, 2012, the District retained the Association of California Water Agencies Joint Powers Insurance Authority (ACWA/APIA) for its workers’ compensation insurance coverage. The District paid premiums of $245,316 and $182,426 the years ended June 30, 2016 and 2015, respectively. Note 14 – Commitments and Contingencies: Lawsuits The District is a defendant in various lawsuits. Although the outcome of these lawsuits is not presently determinable, it is the option of the District’s legal counsel and the District’s management that resolution of these matters will not have a material adverse effect on the financial condition of the District. Contract Commitments The District had outstanding contract commitments in the amounts of $9,696,308 and $1,094,358 at June 30, 2016 and 2015, respectively. The JPA had outstanding contract commitments in the amounts of $2,319,964 and $2,216,416 at June 30, 2016 and 2015, respectively.

50
REQUIRED SUPPLEMENTARY INFORMATION (UNAUDITED)
51

52
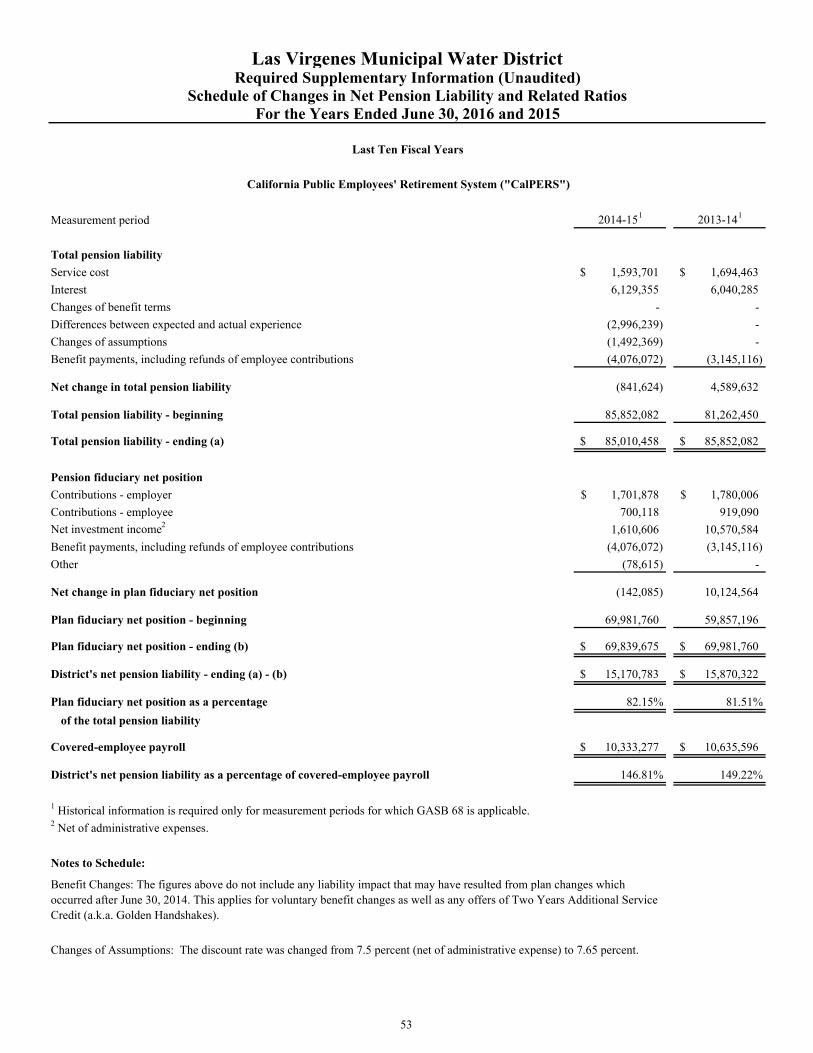
Measurement period 2014-151 2013-141
Total pension liability
Service cost 1,593,701$ 1,694,463$
Interest 6,129,355 6,040,285
Changes of benefit terms - -
Differences between expected and actual experience (2,996,239) -
Changes of assumptions (1,492,369) -
Benefit payments, including refunds of employee contributions (4,076,072) (3,145,116)
Net change in total pension liability (841,624) 4,589,632
Total pension liability - beginning 85,852,082 81,262,450
Total pension liability - ending (a) 85,010,458$ 85,852,082$
Pension fiduciary net position
Contributions - employer 1,701,878$ 1,780,006$
Contributions - employee 700,118 919,090
Net investment income2 1,610,606 10,570,584
Benefit payments, including refunds of employee contributions (4,076,072) (3,145,116)
Other (78,615) -
Net change in plan fiduciary net position (142,085) 10,124,564
Plan fiduciary net position - beginning 69,981,760 59,857,196
Plan fiduciary net position - ending (b) 69,839,675$ 69,981,760$
District's net pension liability - ending (a) - (b) 15,170,783$ 15,870,322$
Plan fiduciary net position as a percentage 82.15% 81.51%
of the total pension liability
Covered-employee payroll 10,333,277$ 10,635,596$
District's net pension liability as a percentage of covered-employee payroll 146.81% 149.22%
1 Historical information is required only for measurement periods for which GASB 68 is applicable.2 Net of administrative expenses.
Notes to Schedule:
Benefit Changes: The figures above do not include any liability impact that may have resulted from plan changes which occurred after June 30, 2014. This applies for voluntary benefit changes as well as any offers of Two Years Additional Service Credit (a.k.a. Golden Handshakes).
Changes of Assumptions: The discount rate was changed from 7.5 percent (net of administrative expense) to 7.65 percent.
Las Virgenes Municipal Water DistrictRequired Supplementary Information (Unaudited)
Schedule of Changes in Net Pension Liability and Related RatiosFor the Years Ended June 30, 2016 and 2015
Last Ten Fiscal Years
California Public Employees' Retirement System ("CalPERS")
53
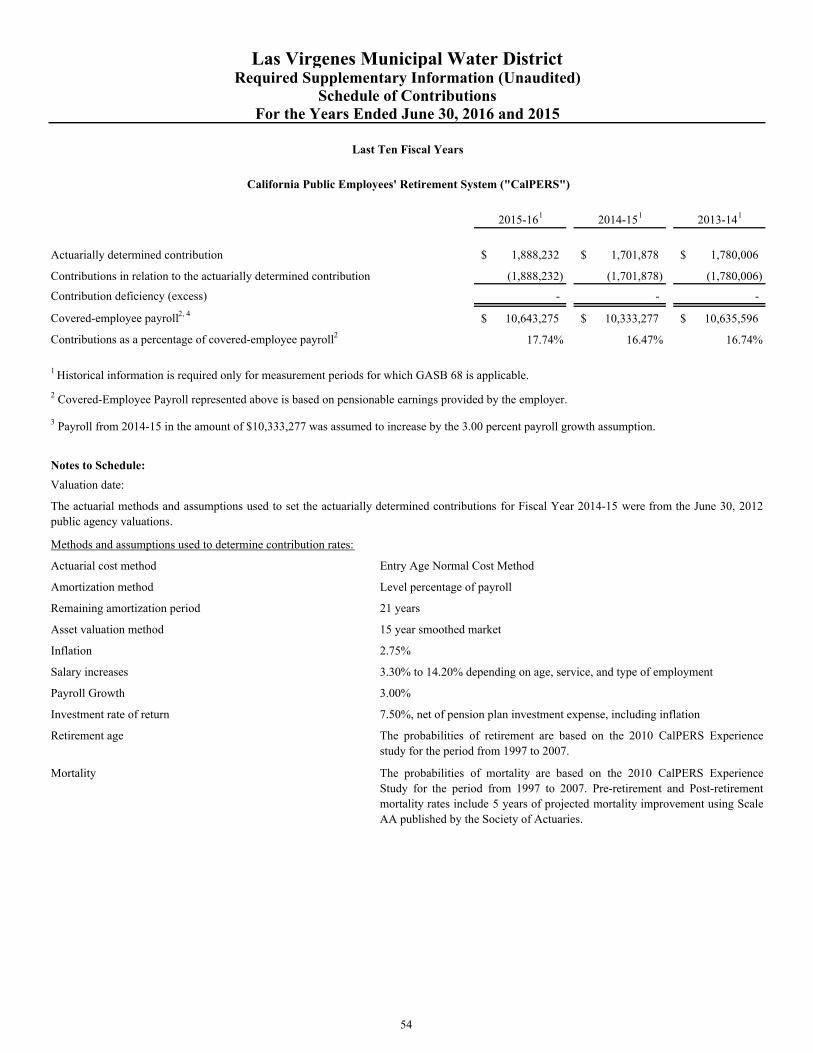
2015-161 2014-151 2013-141
Actuarially determined contribution 1,888,232$ 1,701,878$ 1,780,006$
Contributions in relation to the actuarially determined contribution (1,888,232) (1,701,878) (1,780,006)
Contribution deficiency (excess) - - -
Covered-employee payroll2, 4 10,643,275$ 10,333,277$ 10,635,596$
Contributions as a percentage of covered-employee payroll2 17.74% 16.47% 16.74%
Notes to Schedule:
Valuation date:
Methods and assumptions used to determine contribution rates:
Actuarial cost method Entry Age Normal Cost Method
Amortization method Level percentage of payroll
Remaining amortization period 21 years
Asset valuation method 15 year smoothed market
Inflation 2.75%
Salary increases 3.30% to 14.20% depending on age, service, and type of employment
Payroll Growth 3.00%
Investment rate of return 7.50%, net of pension plan investment expense, including inflation
Retirement age
Mortality
Las Virgenes Municipal Water DistrictRequired Supplementary Information (Unaudited)
Schedule of ContributionsFor the Years Ended June 30, 2016 and 2015
Last Ten Fiscal Years
California Public Employees' Retirement System ("CalPERS")
1 Historical information is required only for measurement periods for which GASB 68 is applicable.
2 Covered-Employee Payroll represented above is based on pensionable earnings provided by the employer.
3 Payroll from 2014-15 in the amount of $10,333,277 was assumed to increase by the 3.00 percent payroll growth assumption.
The actuarial methods and assumptions used to set the actuarially determined contributions for Fiscal Year 2014-15 were from the June 30, 2012public agency valuations.
The probabilities of retirement are based on the 2010 CalPERS Experiencestudy for the period from 1997 to 2007.
The probabilities of mortality are based on the 2010 CalPERS ExperienceStudy for the period from 1997 to 2007. Pre-retirement and Post-retirementmortality rates include 5 years of projected mortality improvement using ScaleAA published by the Society of Actuaries.
54
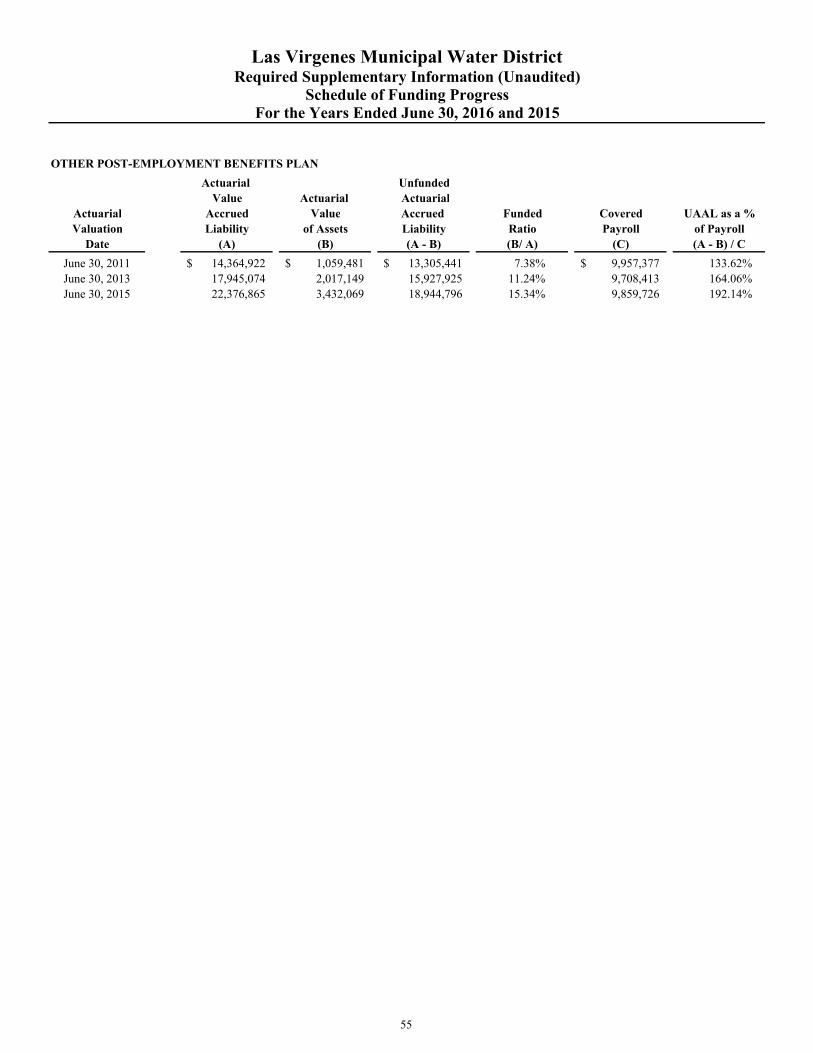
OTHER POST-EMPLOYMENT BENEFITS PLAN
Actuarial UnfundedValue Actuarial Actuarial
Actuarial Accrued Value Accrued Funded Covered UAAL as a %Valuation Liability of Assets Liability Ratio Payroll of Payroll
Date (A) (B) (A - B) (B/ A) (C) (A - B) / C
June 30, 2011 14,364,922$ 1,059,481$ 13,305,441$ 7.38% 9,957,377$ 133.62%June 30, 2013 17,945,074 2,017,149 15,927,925 11.24% 9,708,413 164.06%June 30, 2015 22,376,865 3,432,069 18,944,796 15.34% 9,859,726 192.14%
Las Virgenes Municipal Water DistrictRequired Supplementary Information (Unaudited)
Schedule of Funding ProgressFor the Years Ended June 30, 2016 and 2015
55

56
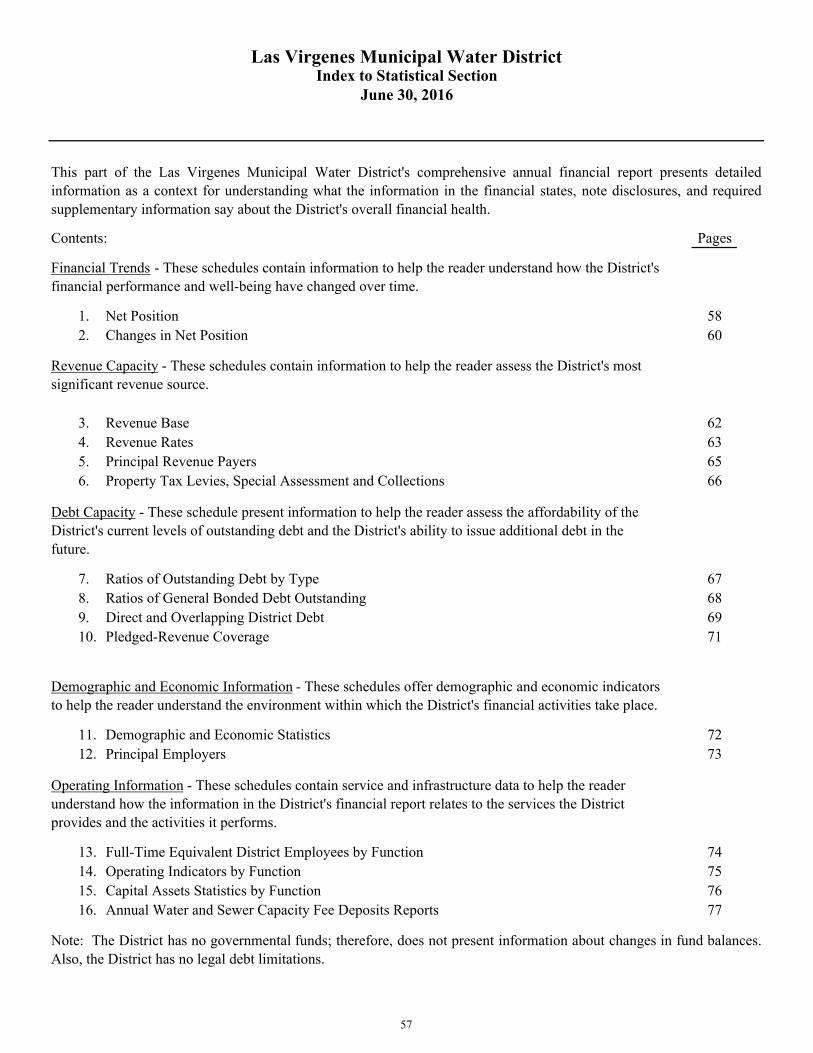
Contents: Pages
1. Net Position 582. Changes in Net Position 60
3. Revenue Base 624. Revenue Rates 635. Principal Revenue Payers 656. Property Tax Levies, Special Assessment and Collections 66
7. Ratios of Outstanding Debt by Type 678. Ratios of General Bonded Debt Outstanding 689. Direct and Overlapping District Debt 6910. Pledged-Revenue Coverage 71
11. Demographic and Economic Statistics 7212. Principal Employers 73
13. Full-Time Equivalent District Employees by Function 7414. Operating Indicators by Function 7515. Capital Assets Statistics by Function 7616. Annual Water and Sewer Capacity Fee Deposits Reports 77
Las Virgenes Municipal Water District
June 30, 2016
This part of the Las Virgenes Municipal Water District's comprehensive annual financial report presents detailedinformation as a context for understanding what the information in the financial states, note disclosures, and requiredsupplementary information say about the District's overall financial health.
Financial Trends - These schedules contain information to help the reader understand how the District's financial performance and well-being have changed over time.
Revenue Capacity - These schedules contain information to help the reader assess the District's most significant revenue source.
Debt Capacity - These schedule present information to help the reader assess the affordability of the District's current levels of outstanding debt and the District's ability to issue additional debt in the future.
Demographic and Economic Information - These schedules offer demographic and economic indicators to help the reader understand the environment within which the District's financial activities take place.
Operating Information - These schedules contain service and infrastructure data to help the reader understand how the information in the District's financial report relates to the services the District provides and the activities it performs.
Note: The District has no governmental funds; therefore, does not present information about changes in fund balances.Also, the District has no legal debt limitations.
Index to Statistical Section
57
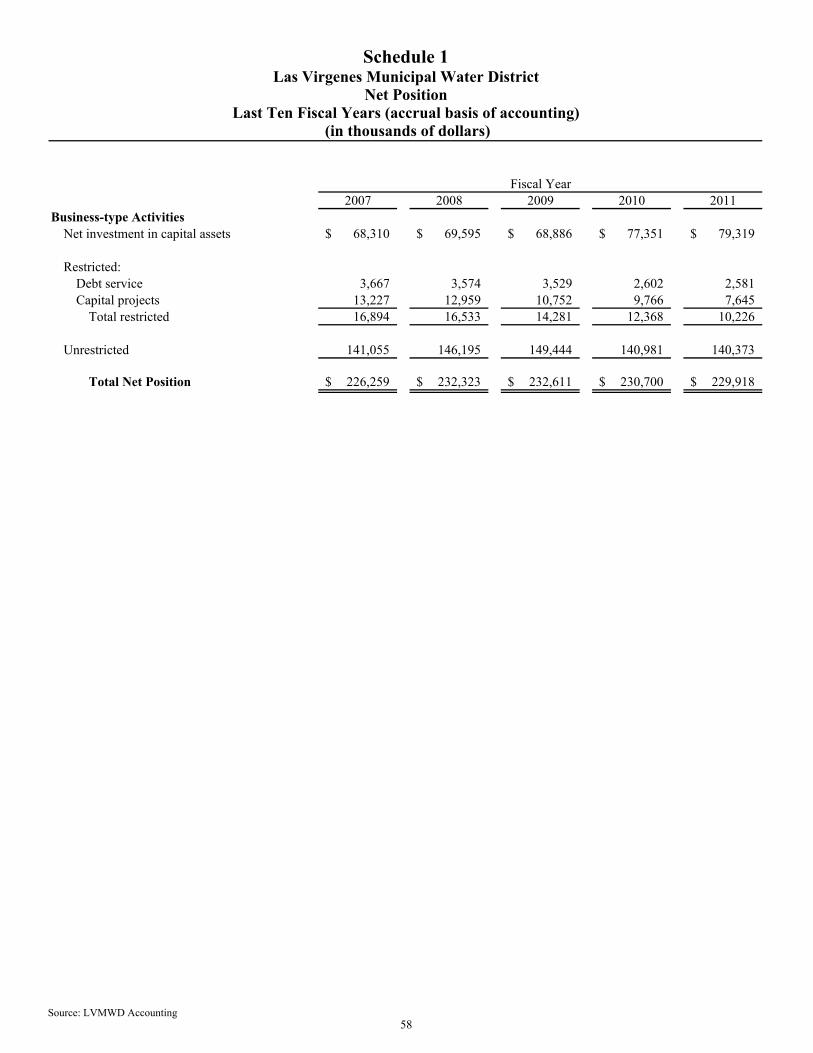
2007 2008 2009 2010 2011Business-type Activities
Net investment in capital assets 68,310$ 69,595$ 68,886$ 77,351$ 79,319$
Restricted:Debt service 3,667 3,574 3,529 2,602 2,581 Capital projects 13,227 12,959 10,752 9,766 7,645
Total restricted 16,894 16,533 14,281 12,368 10,226
Unrestricted 141,055 146,195 149,444 140,981 140,373
Total Net Position 226,259$ 232,323$ 232,611$ 230,700$ 229,918$
Fiscal Year
Schedule 1Las Virgenes Municipal Water District
Net PositionLast Ten Fiscal Years (accrual basis of accounting)
(in thousands of dollars)
Source: LVMWD Accounting58
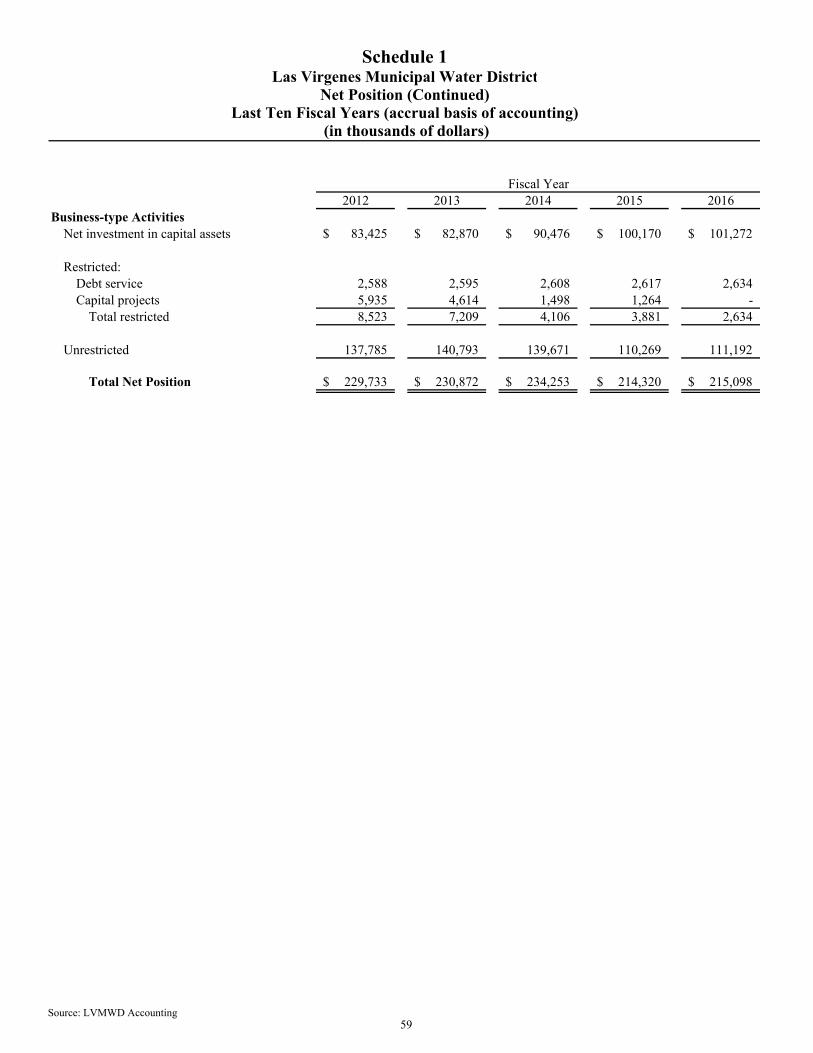
2012 2013 2014 2015 2016Business-type Activities
Net investment in capital assets 83,425$ 82,870$ 90,476$ 100,170$ 101,272$
Restricted:Debt service 2,588 2,595 2,608 2,617 2,634 Capital projects 5,935 4,614 1,498 1,264 -
Total restricted 8,523 7,209 4,106 3,881 2,634
Unrestricted 137,785 140,793 139,671 110,269 111,192
Total Net Position 229,733$ 230,872$ 234,253$ 214,320$ 215,098$
Fiscal Year
Schedule 1Las Virgenes Municipal Water District
Net Position (Continued)Last Ten Fiscal Years (accrual basis of accounting)
(in thousands of dollars)
Source: LVMWD Accounting59
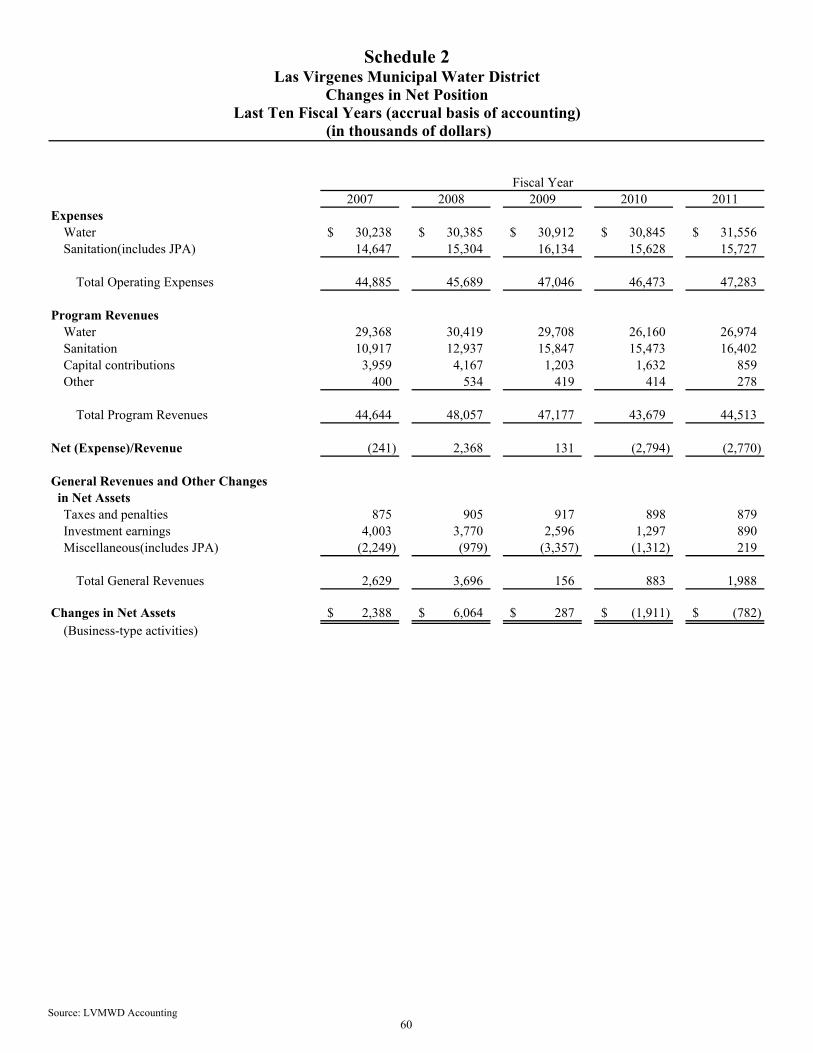
2007 2008 2009 2010 2011Expenses
Water 30,238$ 30,385$ 30,912$ 30,845$ 31,556$ Sanitation(includes JPA) 14,647 15,304 16,134 15,628 15,727
Total Operating Expenses 44,885 45,689 47,046 46,473 47,283
Program RevenuesWater 29,368 30,419 29,708 26,160 26,974 Sanitation 10,917 12,937 15,847 15,473 16,402 Capital contributions 3,959 4,167 1,203 1,632 859 Other 400 534 419 414 278
Total Program Revenues 44,644 48,057 47,177 43,679 44,513
Net (Expense)/Revenue (241) 2,368 131 (2,794) (2,770)
General Revenues and Other Changes in Net Assets
Taxes and penalties 875 905 917 898 879 Investment earnings 4,003 3,770 2,596 1,297 890 Miscellaneous(includes JPA) (2,249) (979) (3,357) (1,312) 219
Total General Revenues 2,629 3,696 156 883 1,988
Changes in Net Assets 2,388$ 6,064$ 287$ (1,911)$ (782)$ (Business-type activities)
Fiscal Year
Schedule 2Las Virgenes Municipal Water District
Changes in Net PositionLast Ten Fiscal Years (accrual basis of accounting)
(in thousands of dollars)
Source: LVMWD Accounting60
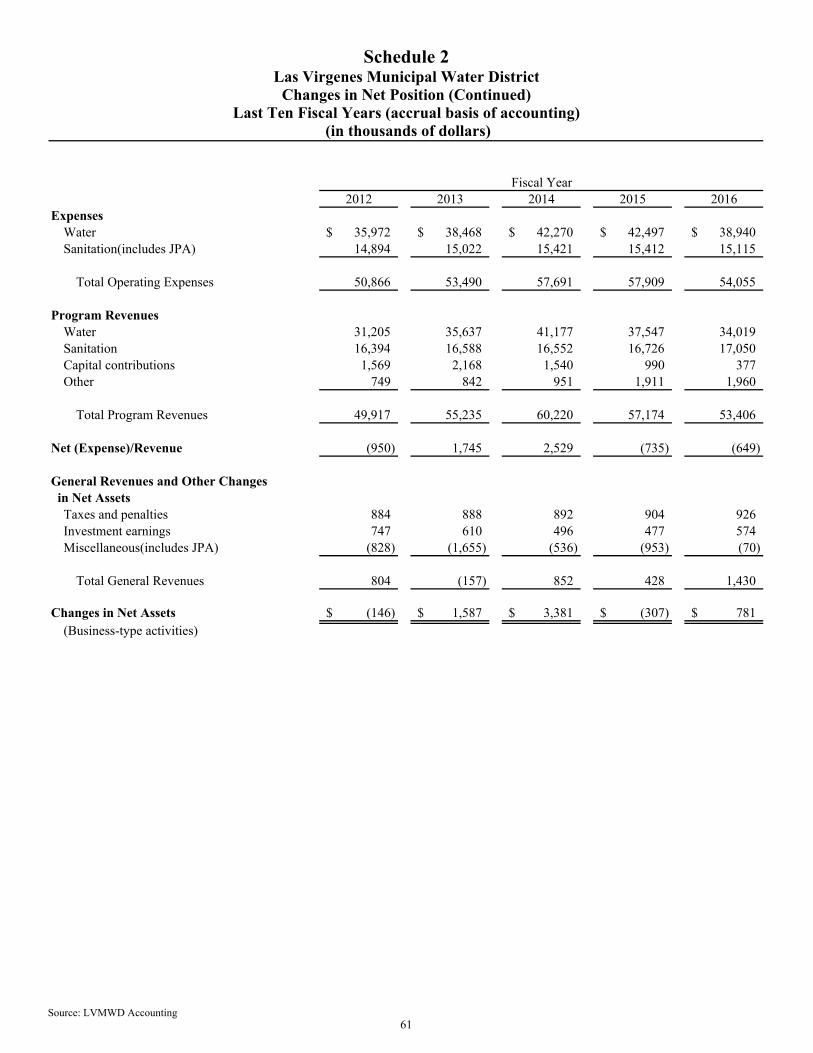
2012 2013 2014 2015 2016Expenses
Water 35,972$ 38,468$ 42,270$ 42,497$ 38,940$ Sanitation(includes JPA) 14,894 15,022 15,421 15,412 15,115
Total Operating Expenses 50,866 53,490 57,691 57,909 54,055
Program RevenuesWater 31,205 35,637 41,177 37,547 34,019 Sanitation 16,394 16,588 16,552 16,726 17,050 Capital contributions 1,569 2,168 1,540 990 377 Other 749 842 951 1,911 1,960
Total Program Revenues 49,917 55,235 60,220 57,174 53,406
Net (Expense)/Revenue (950) 1,745 2,529 (735) (649)
General Revenues and Other Changes in Net Assets
Taxes and penalties 884 888 892 904 926 Investment earnings 747 610 496 477 574 Miscellaneous(includes JPA) (828) (1,655) (536) (953) (70)
Total General Revenues 804 (157) 852 428 1,430
Changes in Net Assets (146)$ 1,587$ 3,381$ (307)$ 781$ (Business-type activities)
Fiscal Year
Schedule 2Las Virgenes Municipal Water District
Changes in Net Position (Continued)Last Ten Fiscal Years (accrual basis of accounting)
(in thousands of dollars)
Source: LVMWD Accounting61
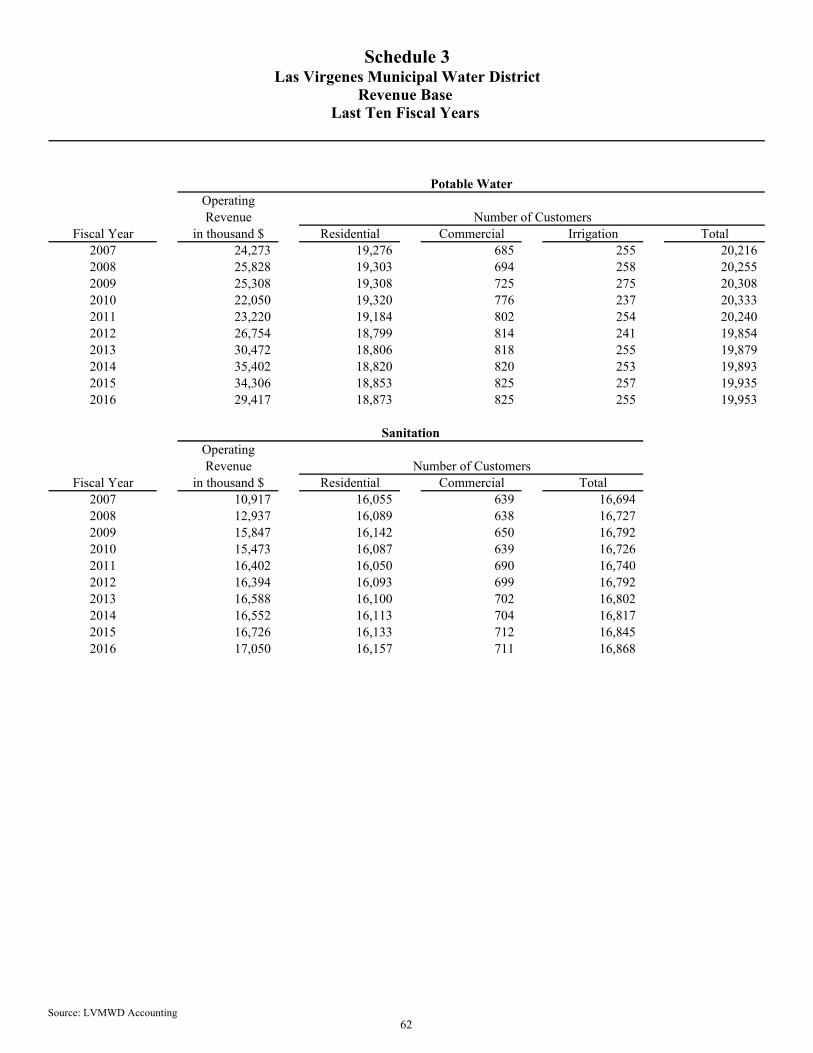
Potable WaterOperatingRevenue Number of Customers
Fiscal Year in thousand $ Residential Commercial Irrigation Total2007 24,273 19,276 685 255 20,216 2008 25,828 19,303 694 258 20,255 2009 25,308 19,308 725 275 20,308 2010 22,050 19,320 776 237 20,333 2011 23,220 19,184 802 254 20,240 2012 26,754 18,799 814 241 19,854 2013 30,472 18,806 818 255 19,879 2014 35,402 18,820 820 253 19,893 2015 34,306 18,853 825 257 19,935 2016 29,417 18,873 825 255 19,953
SanitationOperatingRevenue Number of Customers
Fiscal Year in thousand $ Residential Commercial Total2007 10,917 16,055 639 16,694 2008 12,937 16,089 638 16,727 2009 15,847 16,142 650 16,792 2010 15,473 16,087 639 16,726 2011 16,402 16,050 690 16,740 2012 16,394 16,093 699 16,792 2013 16,588 16,100 702 16,802 2014 16,552 16,113 704 16,817 2015 16,726 16,133 712 16,845 2016 17,050 16,157 711 16,868
Last Ten Fiscal Years Revenue Base
Las Virgenes Municipal Water DistrictSchedule 3
Source: LVMWD Accounting62
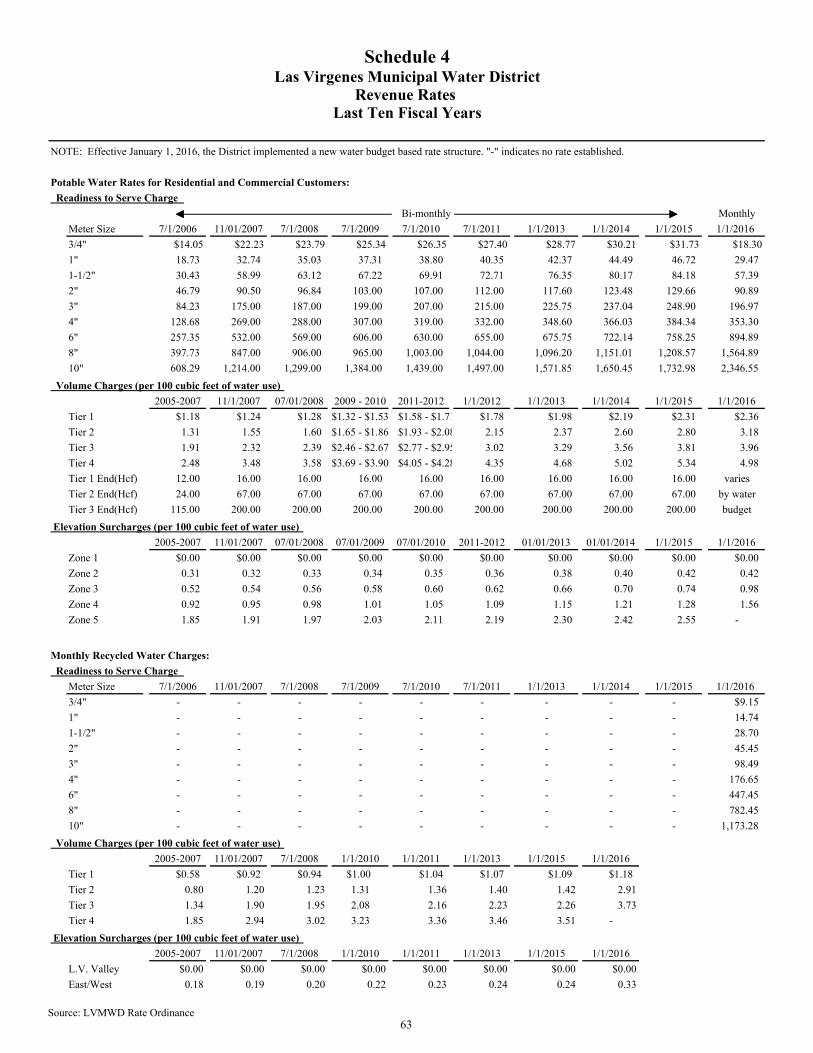
NOTE: Effective January 1, 2016, the District implemented a new water budget based rate structure. "-" indicates no rate established.
Potable Water Rates for Residential and Commercial Customers:
Readiness to Serve Charge
Monthly
Meter Size 7/1/2006 11/01/2007 7/1/2008 7/1/2009 7/1/2010 7/1/2011 1/1/2013 1/1/2014 1/1/2015 1/1/2016
3/4" $14.05 $22.23 $23.79 $25.34 $26.35 $27.40 $28.77 $30.21 $31.73 $18.30
1" 18.73 32.74 35.03 37.31 38.80 40.35 42.37 44.49 46.72 29.47
1-1/2" 30.43 58.99 63.12 67.22 69.91 72.71 76.35 80.17 84.18 57.39
2" 46.79 90.50 96.84 103.00 107.00 112.00 117.60 123.48 129.66 90.89
3" 84.23 175.00 187.00 199.00 207.00 215.00 225.75 237.04 248.90 196.97
4" 128.68 269.00 288.00 307.00 319.00 332.00 348.60 366.03 384.34 353.30
6" 257.35 532.00 569.00 606.00 630.00 655.00 675.75 722.14 758.25 894.89
8" 397.73 847.00 906.00 965.00 1,003.00 1,044.00 1,096.20 1,151.01 1,208.57 1,564.89
10" 608.29 1,214.00 1,299.00 1,384.00 1,439.00 1,497.00 1,571.85 1,650.45 1,732.98 2,346.55
Volume Charges (per 100 cubic feet of water use)
2005-2007 11/1/2007 07/01/2008 2009 - 2010 2011-2012 1/1/2012 1/1/2013 1/1/2014 1/1/2015 1/1/2016
Tier 1 $1.18 $1.24 $1.28 $1.32 - $1.53 $1.58 - $1.71 $1.78 $1.98 $2.19 $2.31 $2.36
Tier 2 1.31 1.55 1.60 $1.65 - $1.86 $1.93 - $2.08 2.15 2.37 2.60 2.80 3.18
Tier 3 1.91 2.32 2.39 $2.46 - $2.67 $2.77 - $2.95 3.02 3.29 3.56 3.81 3.96
Tier 4 2.48 3.48 3.58 $3.69 - $3.90 $4.05 - $4.28 4.35 4.68 5.02 5.34 4.98
Tier 1 End(Hcf) 12.00 16.00 16.00 16.00 16.00 16.00 16.00 16.00 16.00 varies
Tier 2 End(Hcf) 24.00 67.00 67.00 67.00 67.00 67.00 67.00 67.00 67.00 by water
Tier 3 End(Hcf) 115.00 200.00 200.00 200.00 200.00 200.00 200.00 200.00 200.00 budget
Elevation Surcharges (per 100 cubic feet of water use)
2005-2007 11/01/2007 07/01/2008 07/01/2009 07/01/2010 2011-2012 01/01/2013 01/01/2014 1/1/2015 1/1/2016
Zone 1 $0.00 $0.00 $0.00 $0.00 $0.00 $0.00 $0.00 $0.00 $0.00 $0.00
Zone 2 0.31 0.32 0.33 0.34 0.35 0.36 0.38 0.40 0.42 0.42
Zone 3 0.52 0.54 0.56 0.58 0.60 0.62 0.66 0.70 0.74 0.98
Zone 4 0.92 0.95 0.98 1.01 1.05 1.09 1.15 1.21 1.28 1.56
Zone 5 1.85 1.91 1.97 2.03 2.11 2.19 2.30 2.42 2.55 -
Monthly Recycled Water Charges:
Readiness to Serve Charge
Meter Size 7/1/2006 11/01/2007 7/1/2008 7/1/2009 7/1/2010 7/1/2011 1/1/2013 1/1/2014 1/1/2015 1/1/2016
3/4" - - - - - - - - - $9.15
1" - - - - - - - - - 14.74
1-1/2" - - - - - - - - - 28.70
2" - - - - - - - - - 45.45
3" - - - - - - - - - 98.49
4" - - - - - - - - - 176.65
6" - - - - - - - - - 447.45
8" - - - - - - - - - 782.45
10" - - - - - - - - - 1,173.28
Volume Charges (per 100 cubic feet of water use)
2005-2007 11/01/2007 7/1/2008 1/1/2010 1/1/2011 1/1/2013 1/1/2015 1/1/2016
Tier 1 $0.58 $0.92 $0.94 $1.00 $1.04 $1.07 $1.09 $1.18
Tier 2 0.80 1.20 1.23 1.31 1.36 1.40 1.42 2.91
Tier 3 1.34 1.90 1.95 2.08 2.16 2.23 2.26 3.73
Tier 4 1.85 2.94 3.02 3.23 3.36 3.46 3.51 -
Elevation Surcharges (per 100 cubic feet of water use)
2005-2007 11/01/2007 7/1/2008 1/1/2010 1/1/2011 1/1/2013 1/1/2015 1/1/2016
L.V. Valley $0.00 $0.00 $0.00 $0.00 $0.00 $0.00 $0.00 $0.00
East/West 0.18 0.19 0.20 0.22 0.23 0.24 0.24 0.33
Bi-monthly
Schedule 4Las Virgenes Municipal Water District
Revenue Rates Last Ten Fiscal Years
Source: LVMWD Rate Ordinance63
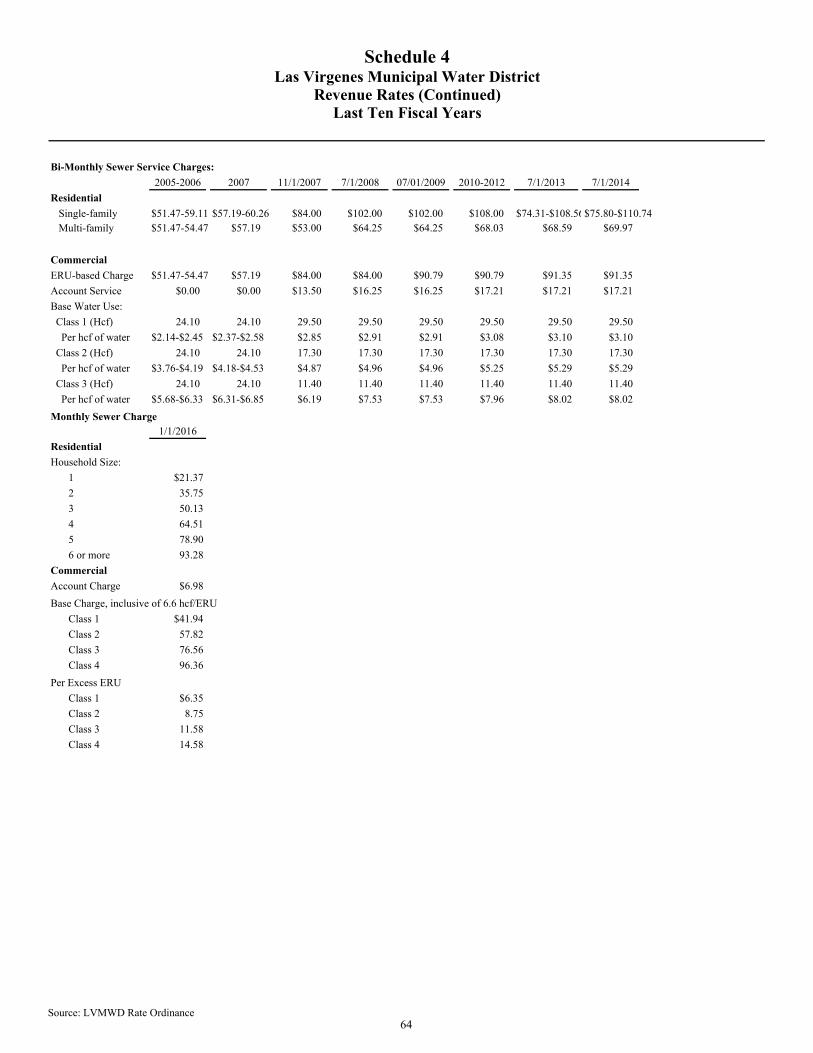
Bi-Monthly Sewer Service Charges:
2005-2006 2007 11/1/2007 7/1/2008 07/01/2009 2010-2012 7/1/2013 7/1/2014
Residential
Single-family $51.47-59.11 $57.19-60.26 $84.00 $102.00 $102.00 $108.00 $74.31-$108.56$75.80-$110.74 Multi-family $51.47-54.47 $57.19 $53.00 $64.25 $64.25 $68.03 $68.59 $69.97
Commercial
ERU-based Charge $51.47-54.47 $57.19 $84.00 $84.00 $90.79 $90.79 $91.35 $91.35
Account Service $0.00 $0.00 $13.50 $16.25 $16.25 $17.21 $17.21 $17.21
Base Water Use:
Class 1 (Hcf) 24.10 24.10 29.50 29.50 29.50 29.50 29.50 29.50
Per hcf of water $2.14-$2.45 $2.37-$2.58 $2.85 $2.91 $2.91 $3.08 $3.10 $3.10
Class 2 (Hcf) 24.10 24.10 17.30 17.30 17.30 17.30 17.30 17.30
Per hcf of water $3.76-$4.19 $4.18-$4.53 $4.87 $4.96 $4.96 $5.25 $5.29 $5.29
Class 3 (Hcf) 24.10 24.10 11.40 11.40 11.40 11.40 11.40 11.40
Per hcf of water $5.68-$6.33 $6.31-$6.85 $6.19 $7.53 $7.53 $7.96 $8.02 $8.02
Monthly Sewer Charge1/1/2016
Residential
Household Size:
1 $21.37
2 35.75
3 50.13
4 64.51
5 78.90
6 or more 93.28
Commercial
Account Charge $6.98
Base Charge, inclusive of 6.6 hcf/ERU
Class 1 $41.94
Class 2 57.82
Class 3 76.56
Class 4 96.36
Per Excess ERU
Class 1 $6.35
Class 2 8.75
Class 3 11.58
Class 4 14.58
Schedule 4Las Virgenes Municipal Water District
Revenue Rates (Continued)Last Ten Fiscal Years
Source: LVMWD Rate Ordinance64
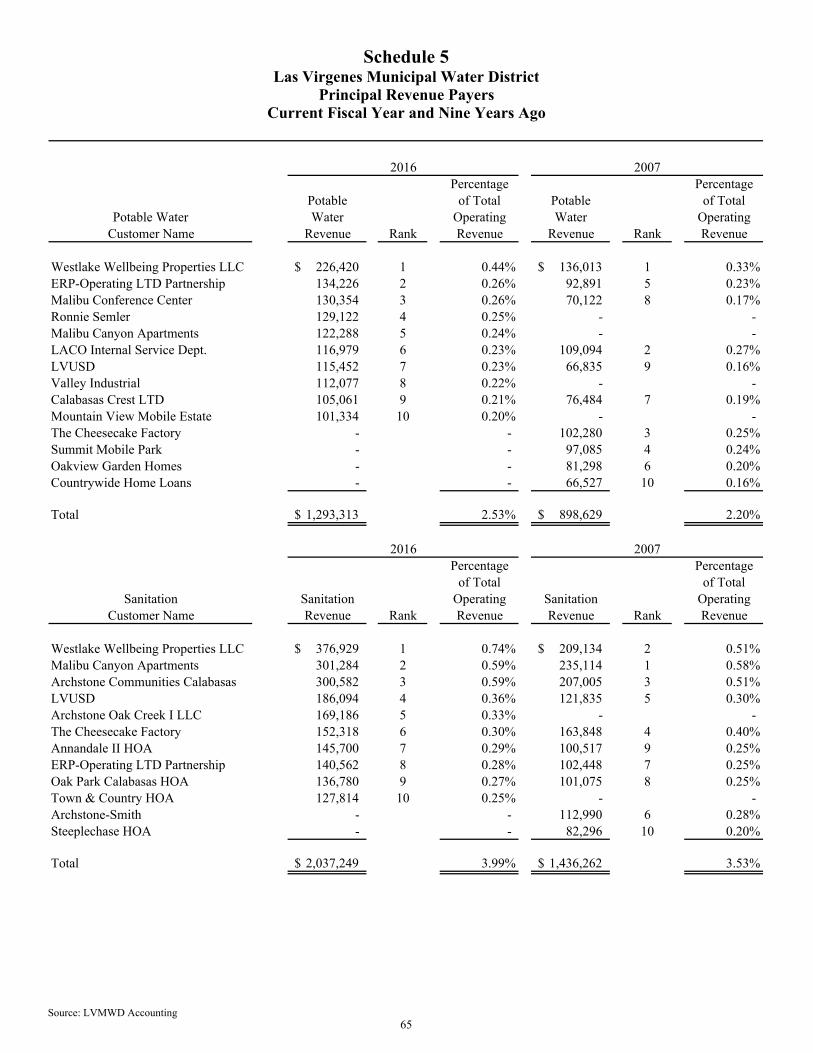
2016 2007Percentage Percentage
Potable of Total Potable of TotalPotable Water Water Operating Water Operating
Revenue Rank Revenue Revenue Rank Revenue
Westlake Wellbeing Properties LLC 226,420$ 1 0.44% 136,013$ 1 0.33%ERP-Operating LTD Partnership 134,226 2 0.26% 92,891 5 0.23%Malibu Conference Center 130,354 3 0.26% 70,122 8 0.17%Ronnie Semler 129,122 4 0.25% - - Malibu Canyon Apartments 122,288 5 0.24% - - LACO Internal Service Dept. 116,979 6 0.23% 109,094 2 0.27%LVUSD 115,452 7 0.23% 66,835 9 0.16%Valley Industrial 112,077 8 0.22% - - Calabasas Crest LTD 105,061 9 0.21% 76,484 7 0.19%Mountain View Mobile Estate 101,334 10 0.20% - - The Cheesecake Factory - - 102,280 3 0.25%Summit Mobile Park - - 97,085 4 0.24%Oakview Garden Homes - - 81,298 6 0.20%Countrywide Home Loans - - 66,527 10 0.16%
Total 1,293,313$ 2.53% 898,629$ 2.20%
2016 2007Percentage Percentage
of Total of TotalSanitation Sanitation Operating Sanitation Operating
Revenue Rank Revenue Revenue Rank Revenue
Westlake Wellbeing Properties LLC 376,929$ 1 0.74% 209,134$ 2 0.51%Malibu Canyon Apartments 301,284 2 0.59% 235,114 1 0.58%Archstone Communities Calabasas 300,582 3 0.59% 207,005 3 0.51%LVUSD 186,094 4 0.36% 121,835 5 0.30%Archstone Oak Creek I LLC 169,186 5 0.33% - - The Cheesecake Factory 152,318 6 0.30% 163,848 4 0.40%Annandale II HOA 145,700 7 0.29% 100,517 9 0.25%ERP-Operating LTD Partnership 140,562 8 0.28% 102,448 7 0.25%Oak Park Calabasas HOA 136,780 9 0.27% 101,075 8 0.25%Town & Country HOA 127,814 10 0.25% - - Archstone-Smith - - 112,990 6 0.28%Steeplechase HOA - - 82,296 10 0.20%
Total 2,037,249$ 3.99% 1,436,262$ 3.53%
Schedule 5Las Virgenes Municipal Water District
Principal Revenue PayersCurrent Fiscal Year and Nine Years Ago
Customer Name
Customer Name
Source: LVMWD Accounting65
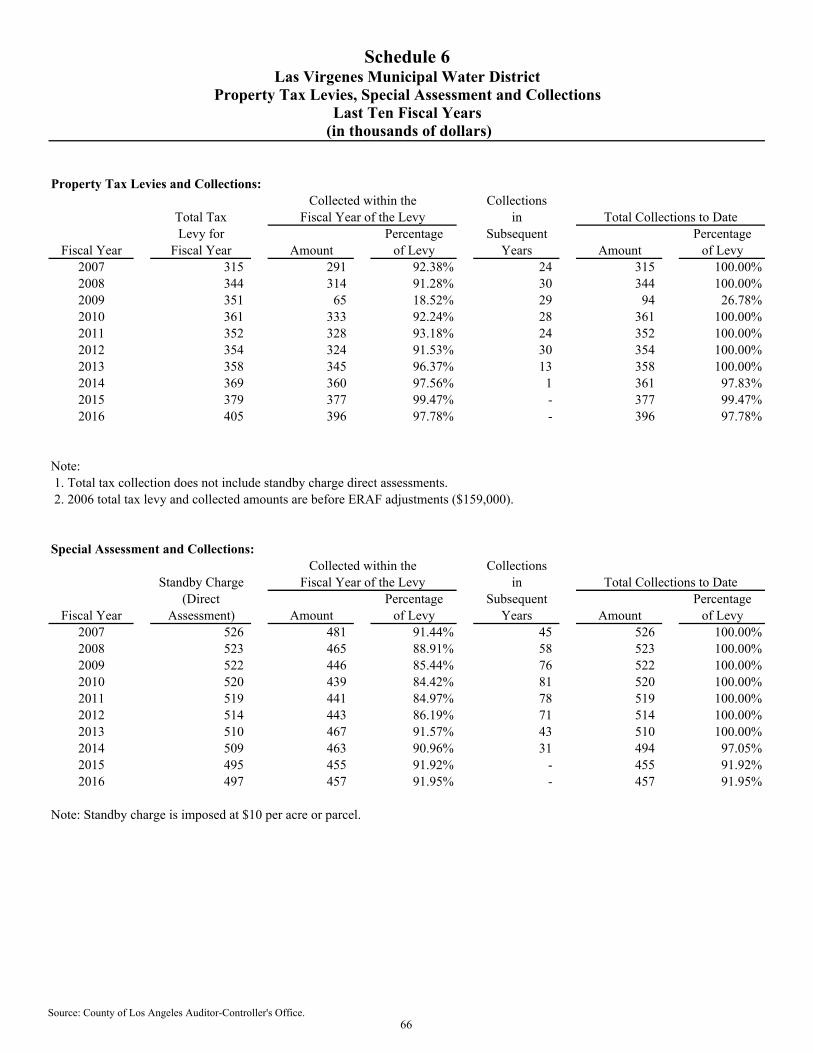
Property Tax Levies and Collections:Collected within the Collections
Total Tax Fiscal Year of the Levy in Total Collections to DateLevy for Percentage Subsequent Percentage
Fiscal Year Fiscal Year Amount of Levy Years Amount of Levy2007 315 291 92.38% 24 315 100.00%2008 344 314 91.28% 30 344 100.00%2009 351 65 18.52% 29 94 26.78%2010 361 333 92.24% 28 361 100.00%2011 352 328 93.18% 24 352 100.00%2012 354 324 91.53% 30 354 100.00%2013 358 345 96.37% 13 358 100.00%2014 369 360 97.56% 1 361 97.83%2015 379 377 99.47% - 377 99.47%2016 405 396 97.78% - 396 97.78%
Note: 1. Total tax collection does not include standby charge direct assessments. 2. 2006 total tax levy and collected amounts are before ERAF adjustments ($159,000).
Special Assessment and Collections:Collected within the Collections
Standby Charge Fiscal Year of the Levy in Total Collections to Date(Direct Percentage Subsequent Percentage
Fiscal Year Assessment) Amount of Levy Years Amount of Levy2007 526 481 91.44% 45 526 100.00%2008 523 465 88.91% 58 523 100.00%2009 522 446 85.44% 76 522 100.00%2010 520 439 84.42% 81 520 100.00%2011 519 441 84.97% 78 519 100.00%2012 514 443 86.19% 71 514 100.00%2013 510 467 91.57% 43 510 100.00%2014 509 463 90.96% 31 494 97.05%2015 495 455 91.92% - 455 91.92%2016 497 457 91.95% - 457 91.95%
Note: Standby charge is imposed at $10 per acre or parcel.
Schedule 6Las Virgenes Municipal Water District
Property Tax Levies, Special Assessment and CollectionsLast Ten Fiscal Years
(in thousands of dollars)
Source: County of Los Angeles Auditor-Controller's Office.66
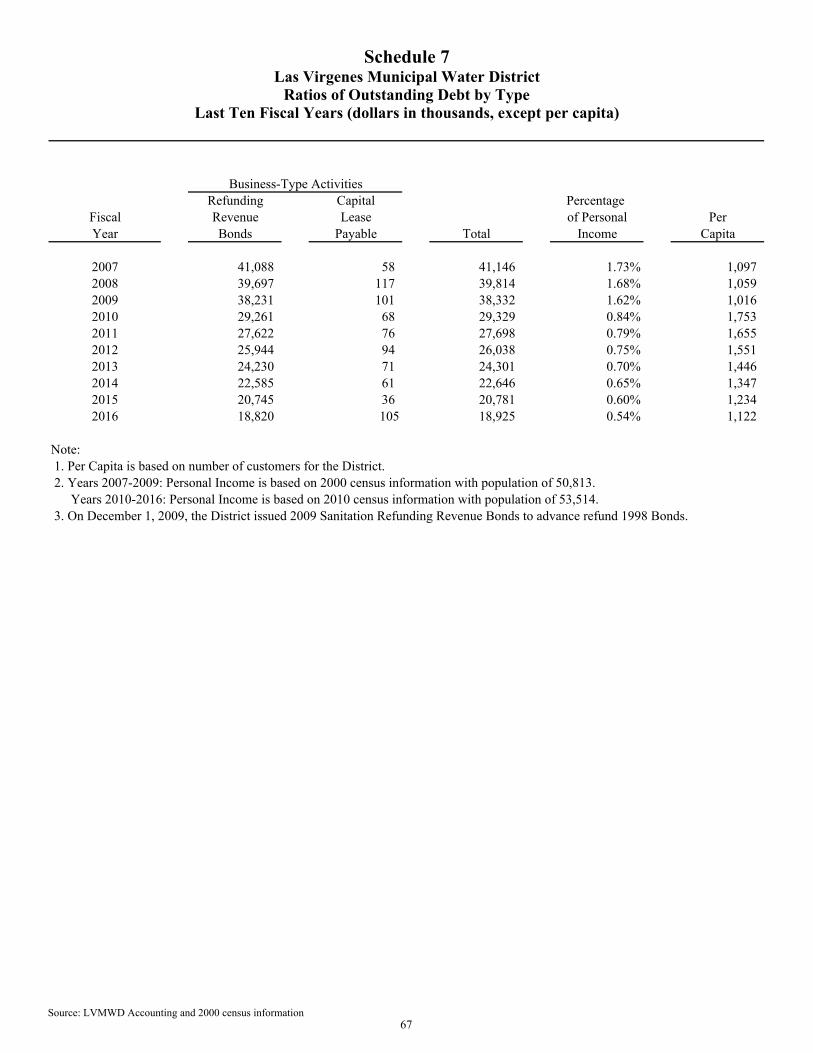
Business-Type ActivitiesRefunding Capital Percentage
Fiscal Revenue Lease of Personal PerYear Bonds Payable Total Income Capita
2007 41,088 58 41,146 1.73% 1,097 2008 39,697 117 39,814 1.68% 1,059 2009 38,231 101 38,332 1.62% 1,0162010 29,261 68 29,329 0.84% 1,7532011 27,622 76 27,698 0.79% 1,6552012 25,944 94 26,038 0.75% 1,5512013 24,230 71 24,301 0.70% 1,4462014 22,585 61 22,646 0.65% 1,3472015 20,745 36 20,781 0.60% 1,2342016 18,820 105 18,925 0.54% 1,122
Note: 1. Per Capita is based on number of customers for the District. 2. Years 2007-2009: Personal Income is based on 2000 census information with population of 50,813. Years 2010-2016: Personal Income is based on 2010 census information with population of 53,514. 3. On December 1, 2009, the District issued 2009 Sanitation Refunding Revenue Bonds to advance refund 1998 Bonds.
Schedule 7Las Virgenes Municipal Water District
Ratios of Outstanding Debt by TypeLast Ten Fiscal Years (dollars in thousands, except per capita)
Source: LVMWD Accounting and 2000 census information67
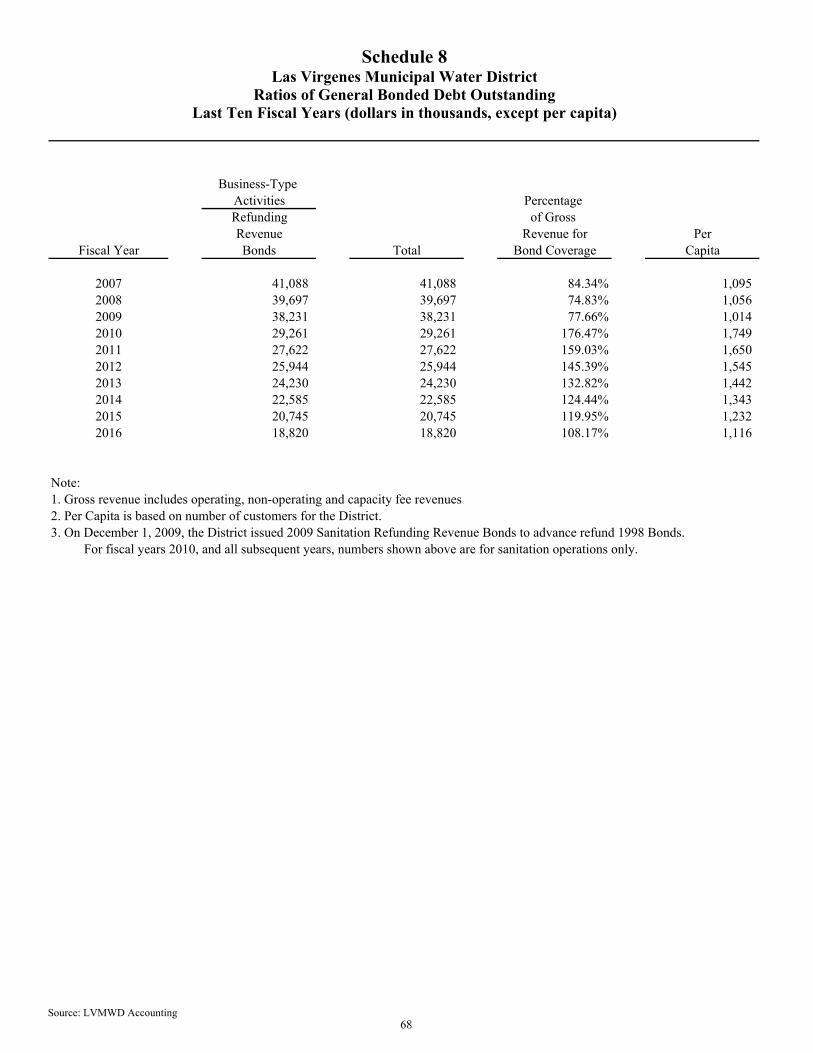
Business-Type Activities Percentage Refunding of Gross Revenue Revenue for Per
Fiscal Year Bonds Total Bond Coverage Capita
2007 41,088 41,088 84.34% 1,095 2008 39,697 39,697 74.83% 1,056 2009 38,231 38,231 77.66% 1,014 2010 29,261 29,261 176.47% 1,749 2011 27,622 27,622 159.03% 1,650 2012 25,944 25,944 145.39% 1,545 2013 24,230 24,230 132.82% 1,442 2014 22,585 22,585 124.44% 1,343 2015 20,745 20,745 119.95% 1,232 2016 18,820 18,820 108.17% 1,116
Note: 1. Gross revenue includes operating, non-operating and capacity fee revenues2. Per Capita is based on number of customers for the District.3. On December 1, 2009, the District issued 2009 Sanitation Refunding Revenue Bonds to advance refund 1998 Bonds.
For fiscal years 2010, and all subsequent years, numbers shown above are for sanitation operations only.
Schedule 8Las Virgenes Municipal Water District
Ratios of General Bonded Debt OutstandingLast Ten Fiscal Years (dollars in thousands, except per capita)
Source: LVMWD Accounting68
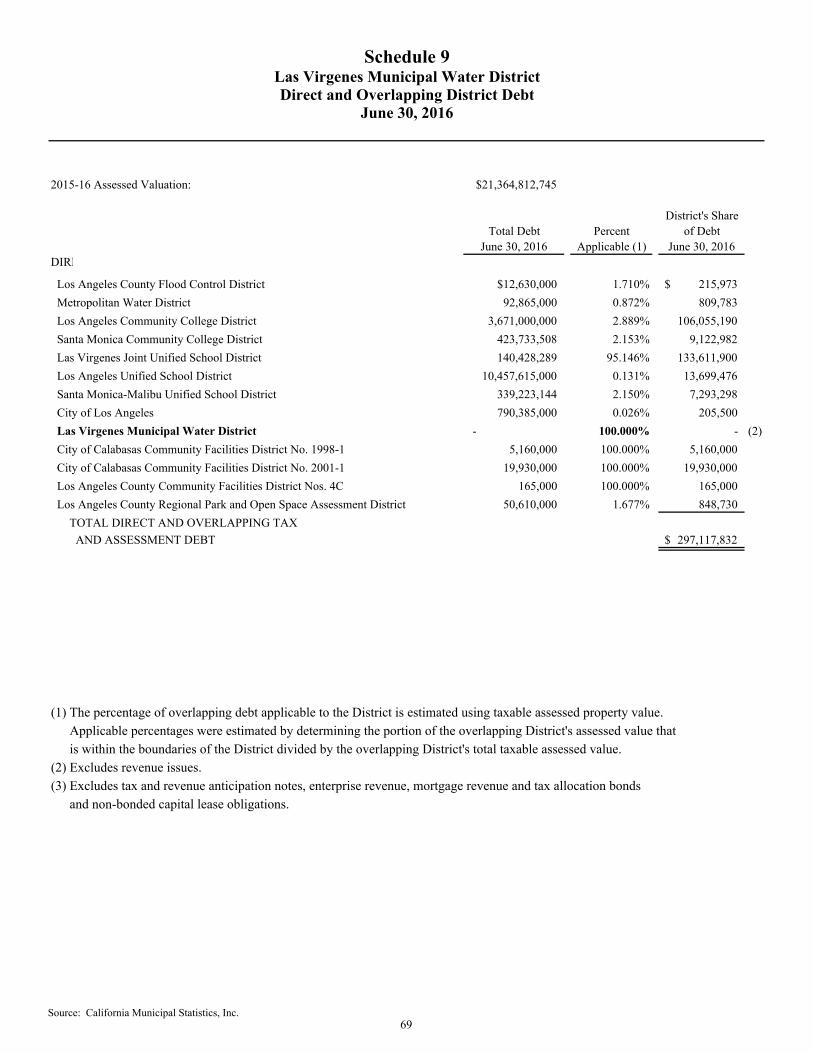
2015-16 Assessed Valuation: $21,364,812,745
District's ShareTotal Debt Percent of Debt
June 30, 2016 Applicable (1) June 30, 2016DIRE
Los Angeles County Flood Control District $12,630,000 1.710% 215,973$
Metropolitan Water District 92,865,000 0.872% 809,783
Los Angeles Community College District 3,671,000,000 2.889% 106,055,190
Santa Monica Community College District 423,733,508 2.153% 9,122,982
Las Virgenes Joint Unified School District 140,428,289 95.146% 133,611,900
Los Angeles Unified School District 10,457,615,000 0.131% 13,699,476
Santa Monica-Malibu Unified School District 339,223,144 2.150% 7,293,298
City of Los Angeles 790,385,000 0.026% 205,500
Las Virgenes Municipal Water District - 100.000% - (2)
City of Calabasas Community Facilities District No. 1998-1 5,160,000 100.000% 5,160,000
City of Calabasas Community Facilities District No. 2001-1 19,930,000 100.000% 19,930,000
Los Angeles County Community Facilities District Nos. 4C 165,000 100.000% 165,000
Los Angeles County Regional Park and Open Space Assessment District 50,610,000 1.677% 848,730
TOTAL DIRECT AND OVERLAPPING TAX
AND ASSESSMENT DEBT 297,117,832$
(1) The percentage of overlapping debt applicable to the District is estimated using taxable assessed property value.
Applicable percentages were estimated by determining the portion of the overlapping District's assessed value that
is within the boundaries of the District divided by the overlapping District's total taxable assessed value.
(2) Excludes revenue issues.
(3) Excludes tax and revenue anticipation notes, enterprise revenue, mortgage revenue and tax allocation bonds
and non-bonded capital lease obligations.
Schedule 9Las Virgenes Municipal Water District
June 30, 2016Direct and Overlapping District Debt
Source: California Municipal Statistics, Inc.69
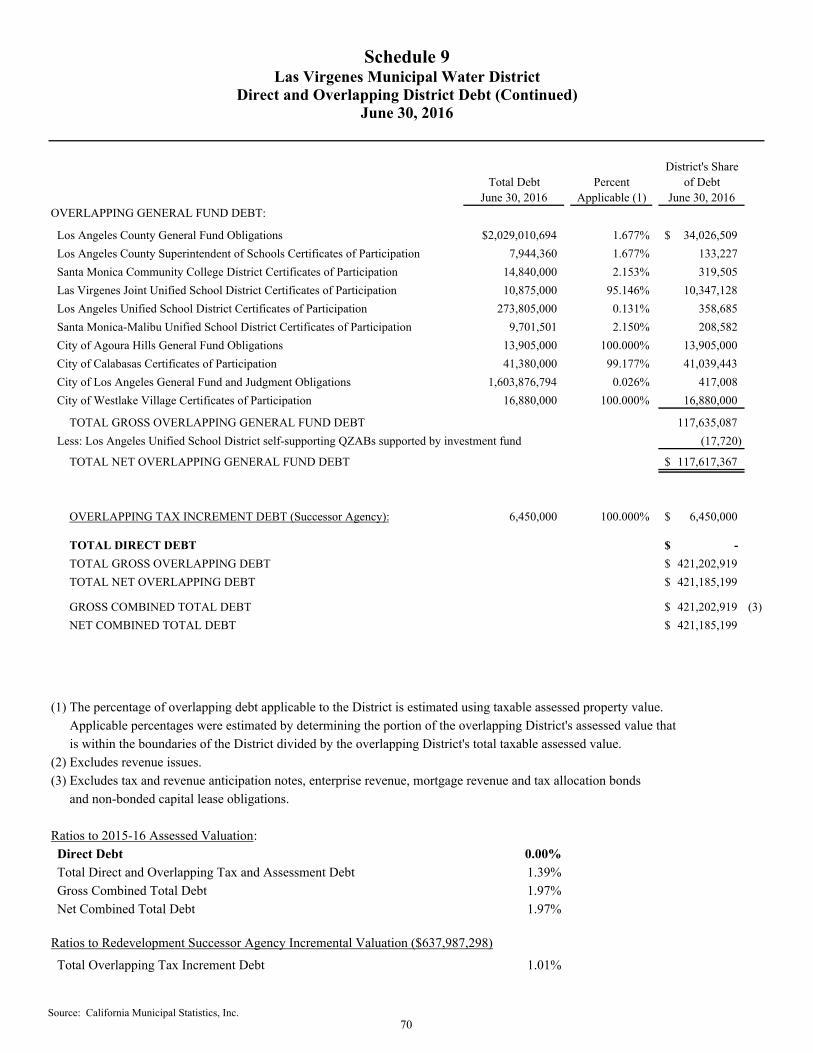
District's ShareTotal Debt Percent of Debt
June 30, 2016 Applicable (1) June 30, 2016OVERLAPPING GENERAL FUND DEBT:
Los Angeles County General Fund Obligations $2,029,010,694 1.677% 34,026,509$
Los Angeles County Superintendent of Schools Certificates of Participation 7,944,360 1.677% 133,227
Santa Monica Community College District Certificates of Participation 14,840,000 2.153% 319,505
Las Virgenes Joint Unified School District Certificates of Participation 10,875,000 95.146% 10,347,128
Los Angeles Unified School District Certificates of Participation 273,805,000 0.131% 358,685
Santa Monica-Malibu Unified School District Certificates of Participation 9,701,501 2.150% 208,582
City of Agoura Hills General Fund Obligations 13,905,000 100.000% 13,905,000
City of Calabasas Certificates of Participation 41,380,000 99.177% 41,039,443
City of Los Angeles General Fund and Judgment Obligations 1,603,876,794 0.026% 417,008
City of Westlake Village Certificates of Participation 16,880,000 100.000% 16,880,000
TOTAL GROSS OVERLAPPING GENERAL FUND DEBT 117,635,087
Less: Los Angeles Unified School District self-supporting QZABs supported by investment fund (17,720)
TOTAL NET OVERLAPPING GENERAL FUND DEBT 117,617,367$
OVERLAPPING TAX INCREMENT DEBT (Successor Agency): 6,450,000 100.000% 6,450,000$
TOTAL DIRECT DEBT -$
TOTAL GROSS OVERLAPPING DEBT 421,202,919$
TOTAL NET OVERLAPPING DEBT 421,185,199$
GROSS COMBINED TOTAL DEBT 421,202,919$ (3)
NET COMBINED TOTAL DEBT 421,185,199$
(1) The percentage of overlapping debt applicable to the District is estimated using taxable assessed property value.
Applicable percentages were estimated by determining the portion of the overlapping District's assessed value that
is within the boundaries of the District divided by the overlapping District's total taxable assessed value.
(2) Excludes revenue issues.
(3) Excludes tax and revenue anticipation notes, enterprise revenue, mortgage revenue and tax allocation bonds
and non-bonded capital lease obligations.
Ratios to 2015-16 Assessed Valuation:
Direct Debt 0.00%
Total Direct and Overlapping Tax and Assessment Debt 1.39%
Gross Combined Total Debt 1.97%
Net Combined Total Debt 1.97%
Ratios to Redevelopment Successor Agency Incremental Valuation ($637,987,298)
Total Overlapping Tax Increment Debt 1.01%
Las Virgenes Municipal Water DistrictDirect and Overlapping District Debt (Continued)
June 30, 2016
Schedule 9
Source: California Municipal Statistics, Inc.70
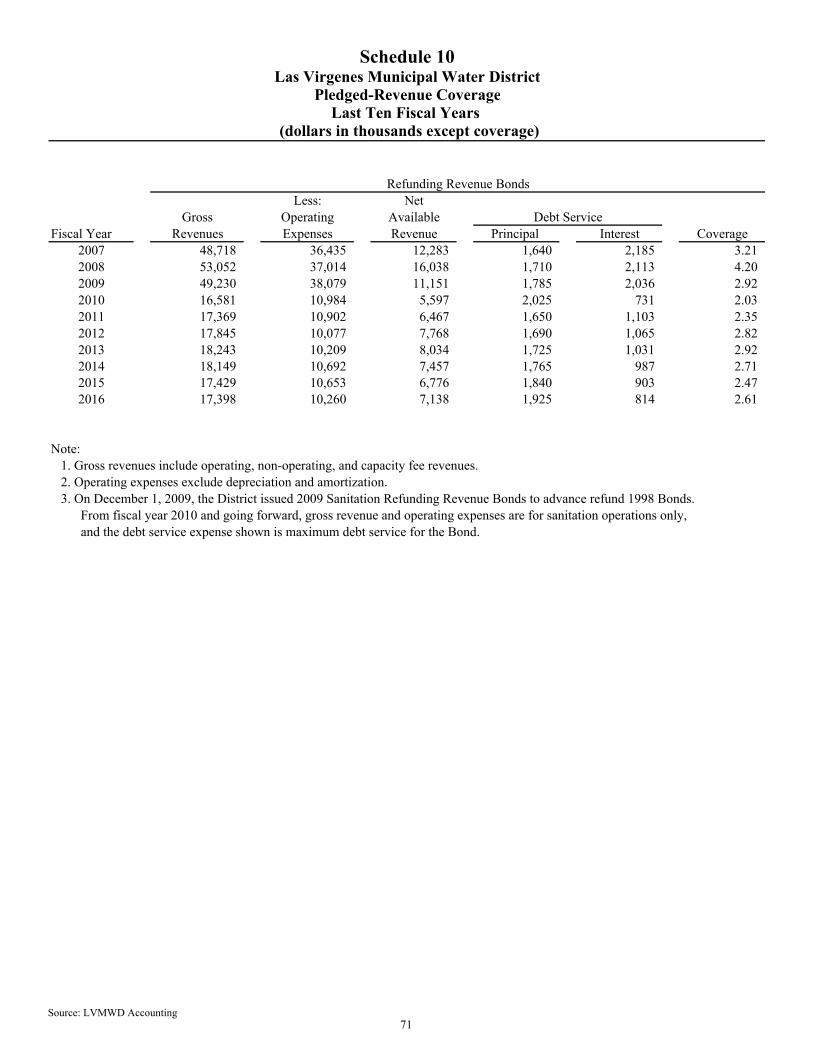
Refunding Revenue BondsLess: Net
Gross Operating Available Debt ServiceFiscal Year Revenues Expenses Revenue Principal Interest Coverage
2007 48,718 36,435 12,283 1,640 2,185 3.21 2008 53,052 37,014 16,038 1,710 2,113 4.20 2009 49,230 38,079 11,151 1,785 2,036 2.92 2010 16,581 10,984 5,597 2,025 731 2.03 2011 17,369 10,902 6,467 1,650 1,103 2.35 2012 17,845 10,077 7,768 1,690 1,065 2.82 2013 18,243 10,209 8,034 1,725 1,031 2.92 2014 18,149 10,692 7,457 1,765 987 2.71 2015 17,429 10,653 6,776 1,840 903 2.47 2016 17,398 10,260 7,138 1,925 814 2.61
Note: 1. Gross revenues include operating, non-operating, and capacity fee revenues. 2. Operating expenses exclude depreciation and amortization. 3. On December 1, 2009, the District issued 2009 Sanitation Refunding Revenue Bonds to advance refund 1998 Bonds. From fiscal year 2010 and going forward, gross revenue and operating expenses are for sanitation operations only, and the debt service expense shown is maximum debt service for the Bond.
Schedule 10Las Virgenes Municipal Water District
Pledged-Revenue CoverageLast Ten Fiscal Years
(dollars in thousands except coverage)
Source: LVMWD Accounting71
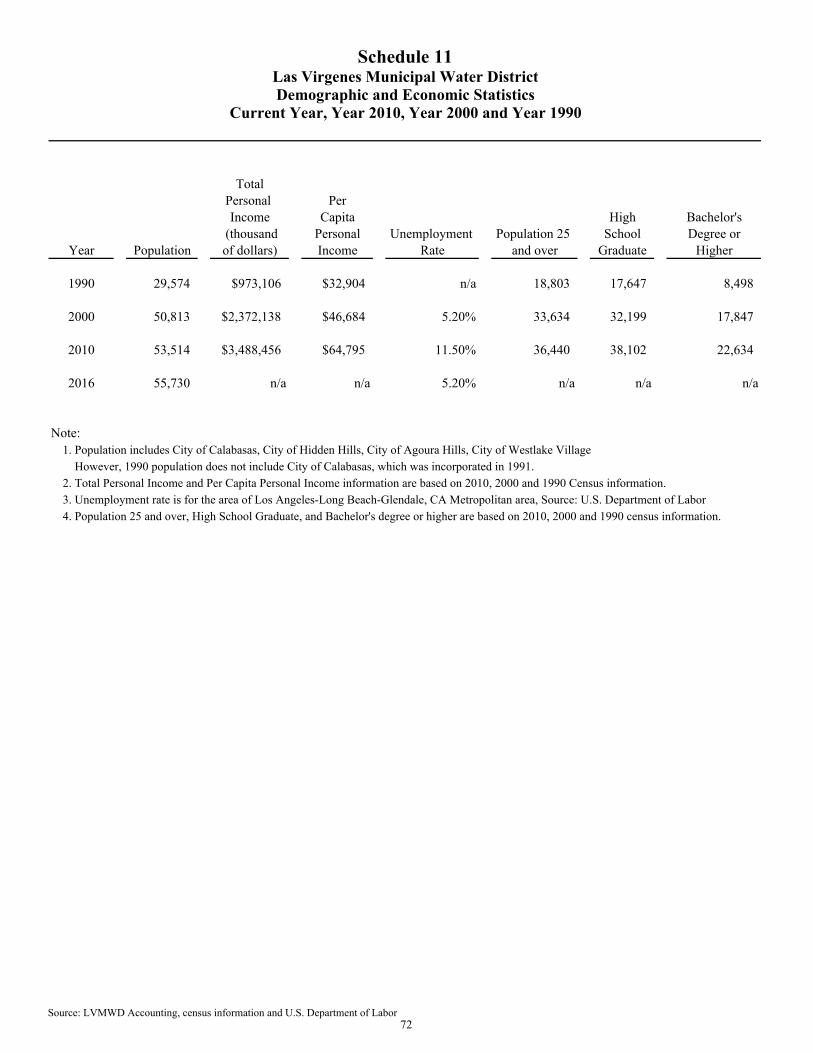
TotalPersonal PerIncome Capita High Bachelor's
(thousand Personal Unemployment Population 25 School Degree orYear Population of dollars) Income Rate and over Graduate Higher
1990 29,574 $973,106 $32,904 n/a 18,803 17,647 8,498
2000 50,813 $2,372,138 $46,684 5.20% 33,634 32,199 17,847
2010 53,514 $3,488,456 $64,795 11.50% 36,440 38,102 22,634
2016 55,730 n/a n/a 5.20% n/a n/a n/a
Note: 1. Population includes City of Calabasas, City of Hidden Hills, City of Agoura Hills, City of Westlake Village
However, 1990 population does not include City of Calabasas, which was incorporated in 1991.
2. Total Personal Income and Per Capita Personal Income information are based on 2010, 2000 and 1990 Census information.
3. Unemployment rate is for the area of Los Angeles-Long Beach-Glendale, CA Metropolitan area, Source: U.S. Department of Labor
4. Population 25 and over, High School Graduate, and Bachelor's degree or higher are based on 2010, 2000 and 1990 census information.
Schedule 11Las Virgenes Municipal Water DistrictDemographic and Economic Statistics
Current Year, Year 2010, Year 2000 and Year 1990
Source: LVMWD Accounting, census information and U.S. Department of Labor72
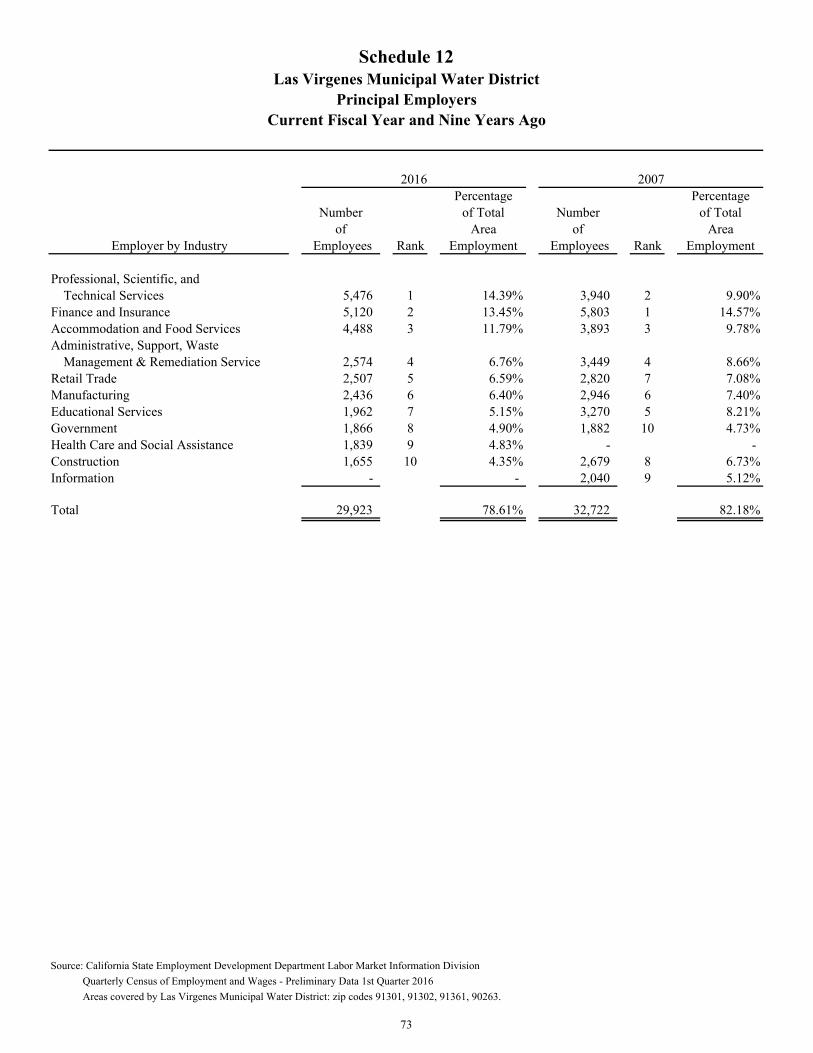
Schedule 12Las Virgenes Municipal Water District
Principal EmployersCurrent Fiscal Year and Nine Years Ago
Percentage PercentageNumber of Total Number of Total
of Area of Area Employees Rank Employment Employees Rank Employment
Professional, Scientific, andTechnical Services 5,476 1 14.39% 3,940 2 9.90%
Finance and Insurance 5,120 2 13.45% 5,803 1 14.57%Accommodation and Food Services 4,488 3 11.79% 3,893 3 9.78%Administrative, Support, Waste
Management & Remediation Service 2,574 4 6.76% 3,449 4 8.66%Retail Trade 2,507 5 6.59% 2,820 7 7.08%Manufacturing 2,436 6 6.40% 2,946 6 7.40%Educational Services 1,962 7 5.15% 3,270 5 8.21%Government 1,866 8 4.90% 1,882 10 4.73%Health Care and Social Assistance 1,839 9 4.83% - - Construction 1,655 10 4.35% 2,679 8 6.73%Information - - 2,040 9 5.12%
Total 29,923 78.61% 32,722 82.18%
Source: California State Employment Development Department Labor Market Information Division
Quarterly Census of Employment and Wages - Preliminary Data 1st Quarter 2016
Areas covered by Las Virgenes Municipal Water District: zip codes 91301, 91302, 91361, 90263.
2016 2007
Employer by Industry
73
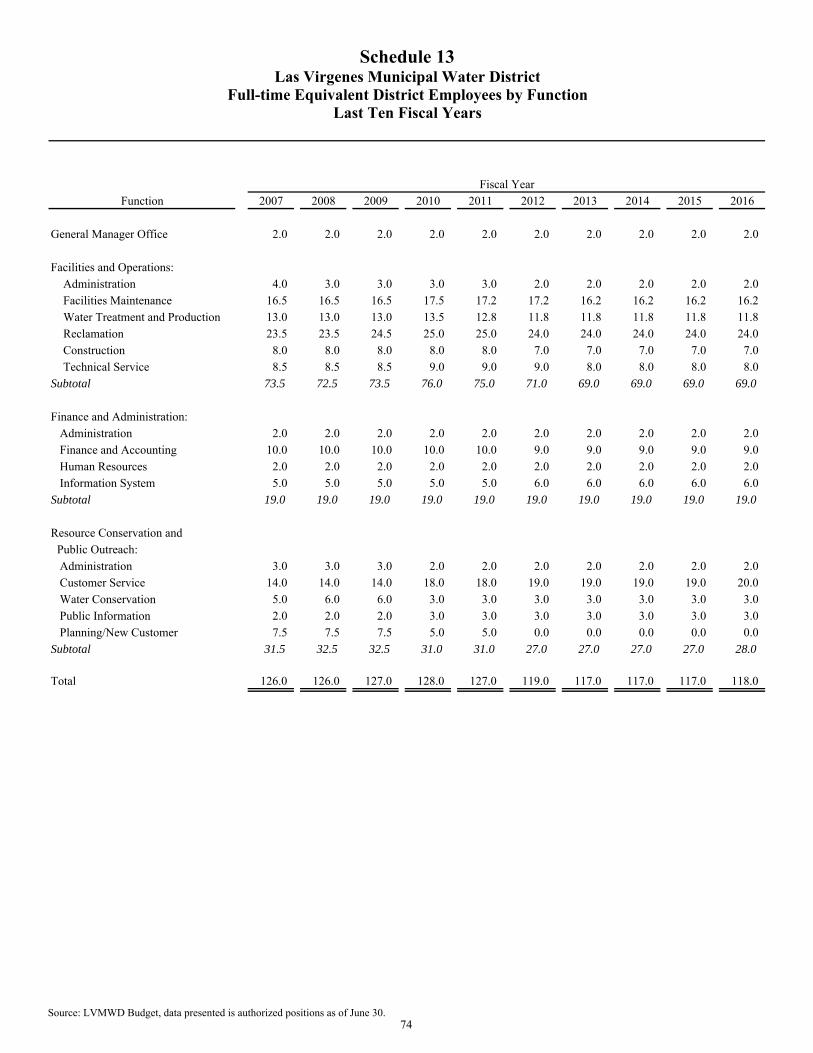
2007 2008 2009 2010 2011 2012 2013 2014 2015 2016
General Manager Office 2.0 2.0 2.0 2.0 2.0 2.0 2.0 2.0 2.0 2.0
Facilities and Operations:
Administration 4.0 3.0 3.0 3.0 3.0 2.0 2.0 2.0 2.0 2.0
Facilities Maintenance 16.5 16.5 16.5 17.5 17.2 17.2 16.2 16.2 16.2 16.2
Water Treatment and Production 13.0 13.0 13.0 13.5 12.8 11.8 11.8 11.8 11.8 11.8
Reclamation 23.5 23.5 24.5 25.0 25.0 24.0 24.0 24.0 24.0 24.0
Construction 8.0 8.0 8.0 8.0 8.0 7.0 7.0 7.0 7.0 7.0
Technical Service 8.5 8.5 8.5 9.0 9.0 9.0 8.0 8.0 8.0 8.0
Subtotal 73.5 72.5 73.5 76.0 75.0 71.0 69.0 69.0 69.0 69.0
Finance and Administration:
Administration 2.0 2.0 2.0 2.0 2.0 2.0 2.0 2.0 2.0 2.0
Finance and Accounting 10.0 10.0 10.0 10.0 10.0 9.0 9.0 9.0 9.0 9.0
Human Resources 2.0 2.0 2.0 2.0 2.0 2.0 2.0 2.0 2.0 2.0
Information System 5.0 5.0 5.0 5.0 5.0 6.0 6.0 6.0 6.0 6.0
Subtotal 19.0 19.0 19.0 19.0 19.0 19.0 19.0 19.0 19.0 19.0
Resource Conservation and
Public Outreach:
Administration 3.0 3.0 3.0 2.0 2.0 2.0 2.0 2.0 2.0 2.0
Customer Service 14.0 14.0 14.0 18.0 18.0 19.0 19.0 19.0 19.0 20.0
Water Conservation 5.0 6.0 6.0 3.0 3.0 3.0 3.0 3.0 3.0 3.0
Public Information 2.0 2.0 2.0 3.0 3.0 3.0 3.0 3.0 3.0 3.0
Planning/New Customer 7.5 7.5 7.5 5.0 5.0 0.0 0.0 0.0 0.0 0.0
Subtotal 31.5 32.5 32.5 31.0 31.0 27.0 27.0 27.0 27.0 28.0
Total 126.0 126.0 127.0 128.0 127.0 119.0 117.0 117.0 117.0 118.0
Fiscal Year
Function
Schedule 13Las Virgenes Municipal Water District
Full-time Equivalent District Employees by FunctionLast Ten Fiscal Years
Source: LVMWD Budget, data presented is authorized positions as of June 30. 74
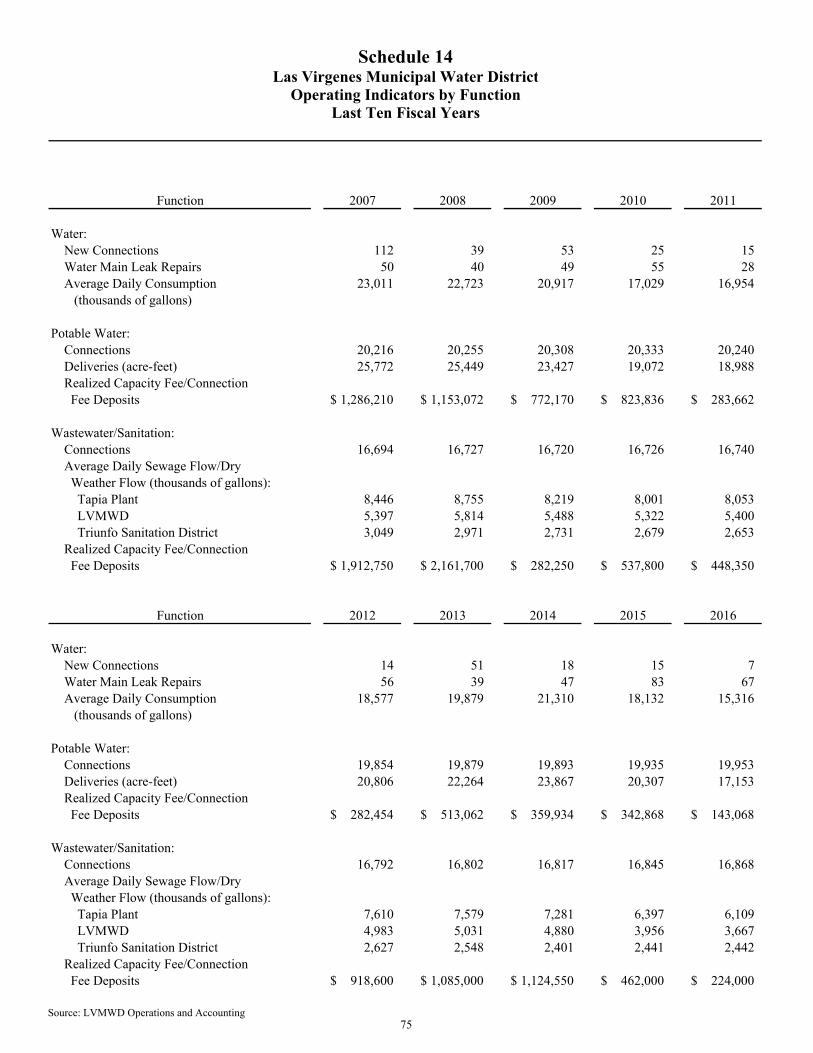
2007 2008 2009 2010 2011
Water: New Connections 112 39 53 25 15 Water Main Leak Repairs 50 40 49 55 28 Average Daily Consumption 23,011 22,723 20,917 17,029 16,954 (thousands of gallons)
Potable Water: Connections 20,216 20,255 20,308 20,333 20,240 Deliveries (acre-feet) 25,772 25,449 23,427 19,072 18,988 Realized Capacity Fee/Connection Fee Deposits 1,286,210$ 1,153,072$ 772,170$ 823,836$ 283,662$
Wastewater/Sanitation: Connections 16,694 16,727 16,720 16,726 16,740 Average Daily Sewage Flow/Dry Weather Flow (thousands of gallons): Tapia Plant 8,446 8,755 8,219 8,001 8,053 LVMWD 5,397 5,814 5,488 5,322 5,400 Triunfo Sanitation District 3,049 2,971 2,731 2,679 2,653 Realized Capacity Fee/Connection Fee Deposits 1,912,750$ 2,161,700$ 282,250$ 537,800$ 448,350$
2012 2013 2014 2015 2016
Water: New Connections 14 51 18 15 7 Water Main Leak Repairs 56 39 47 83 67 Average Daily Consumption 18,577 19,879 21,310 18,132 15,316 (thousands of gallons)
Potable Water: Connections 19,854 19,879 19,893 19,935 19,953 Deliveries (acre-feet) 20,806 22,264 23,867 20,307 17,153 Realized Capacity Fee/Connection Fee Deposits 282,454$ 513,062$ 359,934$ 342,868$ 143,068$
Wastewater/Sanitation: Connections 16,792 16,802 16,817 16,845 16,868 Average Daily Sewage Flow/Dry Weather Flow (thousands of gallons): Tapia Plant 7,610 7,579 7,281 6,397 6,109 LVMWD 4,983 5,031 4,880 3,956 3,667 Triunfo Sanitation District 2,627 2,548 2,401 2,441 2,442 Realized Capacity Fee/Connection Fee Deposits 918,600$ 1,085,000$ 1,124,550$ 462,000$ 224,000$
Function
Function
Schedule 14Las Virgenes Municipal Water District
Operating Indicators by FunctionLast Ten Fiscal Years
Source: LVMWD Operations and Accounting75
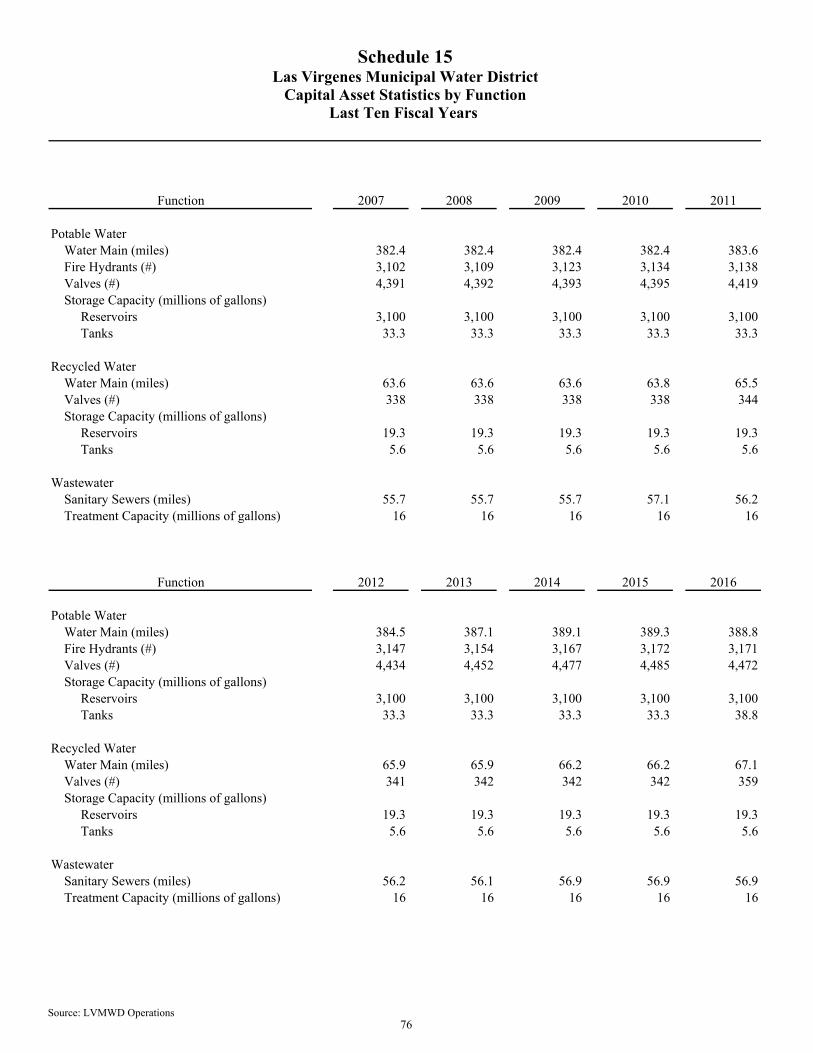
2007 2008 2009 2010 2011
Potable Water Water Main (miles) 382.4 382.4 382.4 382.4 383.6 Fire Hydrants (#) 3,102 3,109 3,123 3,134 3,138 Valves (#) 4,391 4,392 4,393 4,395 4,419 Storage Capacity (millions of gallons) Reservoirs 3,100 3,100 3,100 3,100 3,100 Tanks 33.3 33.3 33.3 33.3 33.3
Recycled Water Water Main (miles) 63.6 63.6 63.6 63.8 65.5 Valves (#) 338 338 338 338 344 Storage Capacity (millions of gallons) Reservoirs 19.3 19.3 19.3 19.3 19.3 Tanks 5.6 5.6 5.6 5.6 5.6
Wastewater Sanitary Sewers (miles) 55.7 55.7 55.7 57.1 56.2 Treatment Capacity (millions of gallons) 16 16 16 16 16
2012 2013 2014 2015 2016
Potable Water Water Main (miles) 384.5 387.1 389.1 389.3 388.8 Fire Hydrants (#) 3,147 3,154 3,167 3,172 3,171 Valves (#) 4,434 4,452 4,477 4,485 4,472 Storage Capacity (millions of gallons) Reservoirs 3,100 3,100 3,100 3,100 3,100 Tanks 33.3 33.3 33.3 33.3 38.8
Recycled Water Water Main (miles) 65.9 65.9 66.2 66.2 67.1 Valves (#) 341 342 342 342 359 Storage Capacity (millions of gallons) Reservoirs 19.3 19.3 19.3 19.3 19.3 Tanks 5.6 5.6 5.6 5.6 5.6
Wastewater Sanitary Sewers (miles) 56.2 56.1 56.9 56.9 56.9 Treatment Capacity (millions of gallons) 16 16 16 16 16
Function
Function
Schedule 15Las Virgenes Municipal Water District
Capital Asset Statistics by FunctionLast Ten Fiscal Years
Source: LVMWD Operations76

Beginning Balance:Capacity Fees 3,584,039$ Developer Fees 676,535Interest 1,405,761
Total Beginning Balance 5,666,335$ Fees Collected:
Capacity Fees 1,481,246$ Developer Fees 185,435
Total Fees Collected 1,666,681$ Reimbursed to Developer/Rec. as Exp. - Interest Earned 42,705
Fees Available 1,709,386$ Applied to:
Capital Costs Funded by: Capacity Fees 367,068$ Meter Installation 9,882 Developer Fees 66,105 Interest Earned 7,634
Total Capital Costs 450,689$ Refunds 54,165
Total Funds Applied 504,854$ Net Changes for the Year 1,204,532 Ending Balance:
Capacity Fees 4,631,465$ Developer Fees 798,569Interest (1) 1,440,833
Total Ending Balance 6,870,867$
(1): Interest earned is not reflected as a liability on the Statement of Net Position.
California Government Code (CGC) Section 66013(c) requires the District to place capital facilities connection fees received and
any interest income earned from the investment of these monies in a separate capital facilities fund. These monies are to be used
solely for the purposes for which they were collected and not commingled with other District funds.
CGC Section 66013(d) requires the District to make certain information available to the public within 180 days after the close of
each fiscal year. CGC Section 66013(e) allows the required information to be included in the District's annual financial report.
The Annual Connection Fee Report shown above meets this requirement.
Capacity fees are imposed for initiating water and sewer connection service by the District at the request of the customer.
No fees are imposed upon real property or upon persons as an incident of property ownership, but rather as a condition of service.
Developer fees are imposed for other services such as plan check, right-of-way, inspection and coring fees.
The District has a plan in the next five years to utilize these capacity fee deposits for Capital Improvement Projects in the
amount of $3,821,968 for Potable Water Projects, $470,328 for Recycled Water Projects, and $669,028 for Sanitation Projects.
Schedule 16Las Virgenes Municipal Water District
Annual Water and Sewer Capacity Fee Deposits ReportPer Government Code Section 66013 (d) and (e)
Fiscal Year Ended June 30, 2016
Source: LVMWD Accounting77

78