Embed Size (px)
Citation preview
Journal of Geomatics Vol. 13, No. 1, April 2019
© Indian Society of Geomatics
Landslide hazard evaluation and zonation in Dilbe Town and its surrounding areas, North-
western Central Ethiopia – A GIS based grid overlay statistical approach
Sendu Demessie1 and Tarun Kumar Raghuvanshi2* 1Department of Geology, Woldia University, PO Box 400, Woldia, Ethiopia
2School of Earth Sciences, College of Natural Sciences, PO Box 1176, Addis Ababa University, Addis Ababa, Ethiopia
*Email: [email protected]
(Received: Apr 04, 2019; in final form: June 18, 2019)
Abstract: The present study was carried out in Dilbe town and its surrounding areas, North-western Central Ethiopian,
located about 576 km from Addis Ababa city. The main objective of the present study was to carry out landslide evaluation
and Zonation of the study area for which an integrated GIS based Grid overlay statistical approach was followed. For
landslide hazard zonation (LHZ) six causative factors; slope-material, slope, aspect, elevation, land use/land cover and
groundwater surface traces were considered. These causative factors were derived from topographical sheets, secondary
maps, digital elevation model and through field investigation. The quantitative relationship between these causative
factors and the past landslides in the area was made through overlay analysis and the Landslide susceptibility index (LSI)
was computed. Further, geo-processing was done by overlaying a polygon grid (10x10 m) over each factor map in GIS
environment. This forms the basis to evaluate LHZ map of the study area. The results showed that 11.55% of the study
area falls into ‘very high hazard’, 19.84% area falls into ‘high hazard’, 14.36% area fall into ‘medium hazard’, 38.25%
area falls into ‘low hazard’ and remaining 16% of the area falls into ‘very low hazard’. Further, validation results showed
that 74% of the past landslides fall within ‘very high hazard’ and ‘high hazard’ zones of the prepared LHZ map. The
prepared LHZ map has reasonably validated with the past landslide data. Thus, various landslide hazard zones delineated
can safely be applied for future developmental planning in the present study area.
Keywords: Landslides, Landslide hazard evaluation, Landslide susceptibility index, Landslide hazard zonation
1. Introduction
Landslides are well known devastating natural hazard in
mountainous terrain. The landslides result into wide spread
damage to the infrastructure, land degradation and
significant loss to the human life and injury throughout the
world (Varnes, 1996; Parise and Jibson, 2000; Dai et al.,
2002; Sarkar and Kanungo, 2004; Crozier and Glade,
2005; Kanungo et al., 2006; Pan et al., 2008; Marraqu and
Jakka, 2014; Raghuvanshi et al., 2014a; Girma et al., 2015;
Raghuvanshi et al., 2015). Several internal and external
factors, in combination, result into landslide. The primary
internal factors are related to geo-morphology, geology
and hydrology (Anbalagan, 1992; Ayalew et al., 2004;
Wang and Niu, 2009; Hamza and Raghuvanshi, 2017)
whereas main external factors are rainfall (Collison et al.,
2000; Dai and Lee, 2001; Dahal et al., 2006; Raghuvanshi
et al., 2014a), seismicity (Parise and Jibson, 2000; Keefer,
2000; Bommer and Rodrı´guez, 2002; Raghuvanshi et al.,
2014a) and manmade activities (Gorsevski et al., 2006;
Raghuvanshi et al., 2014a). These factors are responsible
for slope failure either by reducing the shear strength of the
slope material or these factors may increase the shear
forces (Sarkar and Kanungo, 2004).
Landslide hazard evaluation and zonation involves
delineation of future hazardous zones based on analysis of
governing parameters (Arnous, 2011) and to classify land
into different zones of potential or actual landslide hazard
(Varnes, 1984; Anbalagan, 1992; Raghuvanshi et al.,
2014a). In order to carryout landslide hazard evaluation,
prediction and zonation, several techniques are proposed
by different researchers which can broadly be classified
into expert evaluation (Anbalagan, 1992; Raghuvanshi et
al., 2014b), statistical methods (Carrara et al., 1992;
WestenVan et al., 1997; Dai and Lee, 2001) and the
deterministic approach (Fall et al., 2006; Raghuvanshi et
al., 2015). Each of these techniques has their own merit
and demerits over others (Leroi, 1997; Guzzetti et al.,
1999; Casagli et al., 2004; Kanungo et al., 2006; Fall et al.,
2006; Raghuvanshi et al., 2014a; 2014b). The selection of
a technique for landslide hazard zonation primarily
depends on factors, namely; area to be covered for hazard
zonation, scale at which zonation has to be done,
geological and geo-morphological factors to be
considered, method by which parameter data has to be
acquired and skill set or capability of an evaluator
(Carrara, 1992; Ermias et al., 2017).
In Ethiopia, landslide is a common geo-environmental
hazard in the highlands (Ayalew and Yamagishi, 2004;
Ayenew and Barberie, 2005; Abebe et al., 2010;
Raghuvanshi, 2014a; 2014b). The present study area,
Dilbe town and its surrounding area, which is located in
the north western central Ethiopian highland, is a rugged
mountainous terrain. The area is well known for its
devastating landslides which has caused considerable
damage to the roads, houses and the agricultural land in the
area. Thus, there was a necessity to evaluate and carry out
landslide hazard zonation in the area, so that concerned
authorities and local people may be made aware about the
hazardous zones in the area. Such information may be
helpful for the safe land use planning and development in
the area. Besides, this may also help to mitigate the
problems related to landslides in the study area. The main
objective of the present study was to evaluate the factors
influencing the landslide hazard and to produce the
landslide Hazard Zonation (LHZ) map of the study area.
79
Journal of Geomatics Vol. 13, No. 1, April 2019
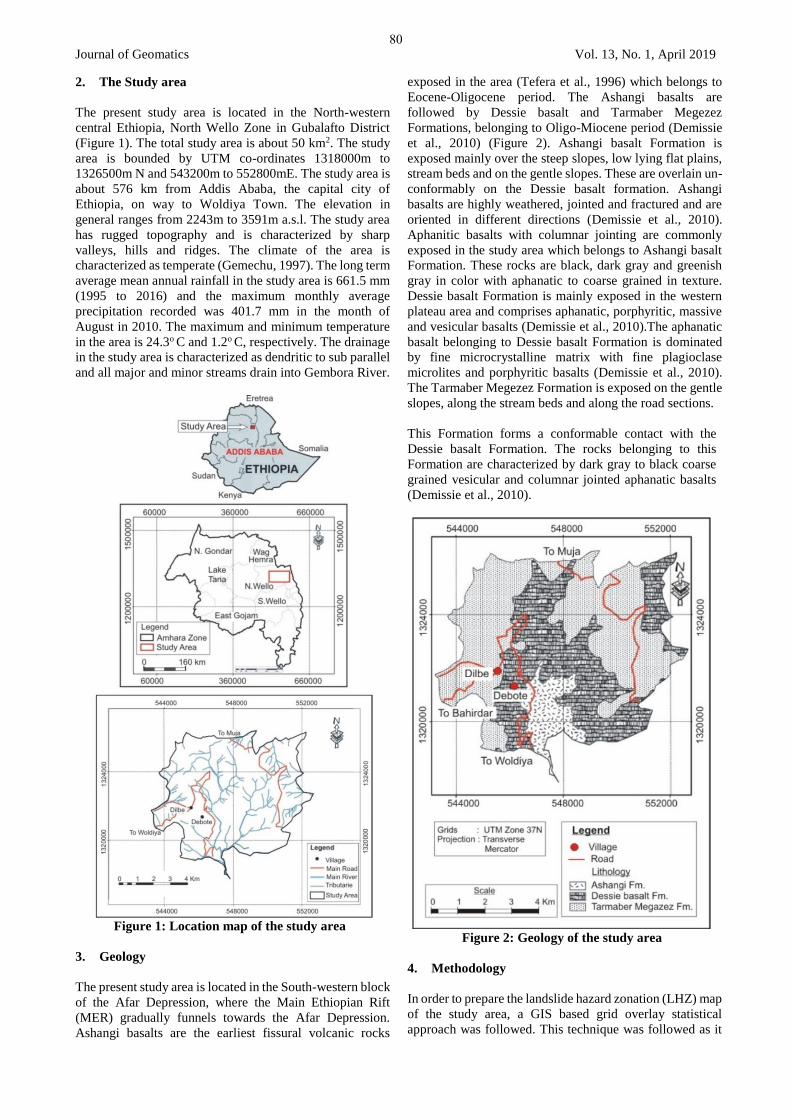
2. The Study area
The present study area is located in the North-western
central Ethiopia, North Wello Zone in Gubalafto District
(Figure 1). The total study area is about 50 km2. The study
area is bounded by UTM co-ordinates 1318000m to
1326500m N and 543200m to 552800mE. The study area is
about 576 km from Addis Ababa, the capital city of
Ethiopia, on way to Woldiya Town. The elevation in
general ranges from 2243m to 3591m a.s.l. The study area
has rugged topography and is characterized by sharp
valleys, hills and ridges. The climate of the area is
characterized as temperate (Gemechu, 1997). The long term
average mean annual rainfall in the study area is 661.5 mm
(1995 to 2016) and the maximum monthly average
precipitation recorded was 401.7 mm in the month of
August in 2010. The maximum and minimum temperature
in the area is 24.3o C and 1.2o C, respectively. The drainage
in the study area is characterized as dendritic to sub parallel
and all major and minor streams drain into Gembora River.
Figure 1: Location map of the study area
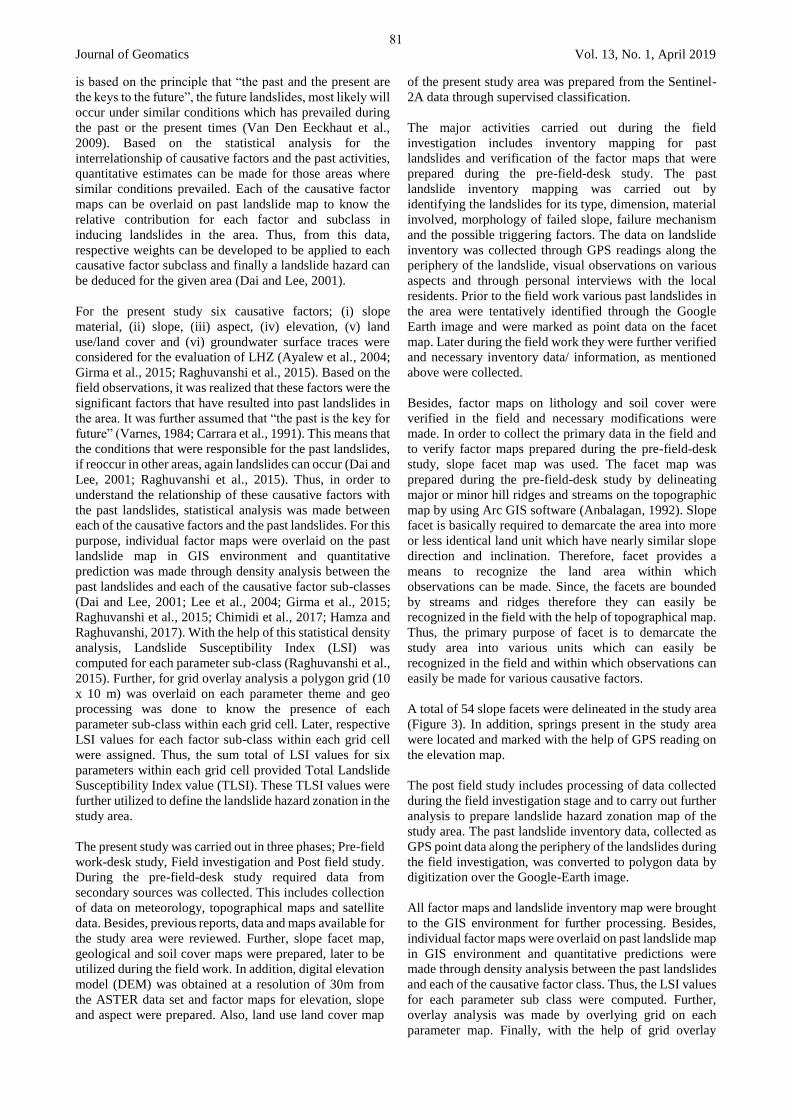
3. Geology
The present study area is located in the South-western block
of the Afar Depression, where the Main Ethiopian Rift
(MER) gradually funnels towards the Afar Depression.
Ashangi basalts are the earliest fissural volcanic rocks
exposed in the area (Tefera et al., 1996) which belongs to
Eocene-Oligocene period. The Ashangi basalts are
followed by Dessie basalt and Tarmaber Megezez
Formations, belonging to Oligo-Miocene period (Demissie
et al., 2010) (Figure 2). Ashangi basalt Formation is
exposed mainly over the steep slopes, low lying flat plains,
stream beds and on the gentle slopes. These are overlain un-
conformably on the Dessie basalt formation. Ashangi
basalts are highly weathered, jointed and fractured and are
oriented in different directions (Demissie et al., 2010).
Aphanitic basalts with columnar jointing are commonly
exposed in the study area which belongs to Ashangi basalt
Formation. These rocks are black, dark gray and greenish
gray in color with aphanatic to coarse grained in texture.
Dessie basalt Formation is mainly exposed in the western
plateau area and comprises aphanatic, porphyritic, massive
and vesicular basalts (Demissie et al., 2010).The aphanatic
basalt belonging to Dessie basalt Formation is dominated
by fine microcrystalline matrix with fine plagioclase
microlites and porphyritic basalts (Demissie et al., 2010).
The Tarmaber Megezez Formation is exposed on the gentle
slopes, along the stream beds and along the road sections.
This Formation forms a conformable contact with the
Dessie basalt Formation. The rocks belonging to this
Formation are characterized by dark gray to black coarse
grained vesicular and columnar jointed aphanatic basalts
(Demissie et al., 2010).
Figure 2: Geology of the study area
4. Methodology
In order to prepare the landslide hazard zonation (LHZ) map
of the study area, a GIS based grid overlay statistical
approach was followed. This technique was followed as it
80
Journal of Geomatics Vol. 13, No. 1, April 2019
is based on the principle that “the past and the present are
the keys to the future”, the future landslides, most likely will
occur under similar conditions which has prevailed during
the past or the present times (Van Den Eeckhaut et al.,
2009). Based on the statistical analysis for the
interrelationship of causative factors and the past activities,
quantitative estimates can be made for those areas where
similar conditions prevailed. Each of the causative factor
maps can be overlaid on past landslide map to know the
relative contribution for each factor and subclass in
inducing landslides in the area. Thus, from this data,
respective weights can be developed to be applied to each
causative factor subclass and finally a landslide hazard can
be deduced for the given area (Dai and Lee, 2001).
For the present study six causative factors; (i) slope
material, (ii) slope, (iii) aspect, (iv) elevation, (v) land
use/land cover and (vi) groundwater surface traces were
considered for the evaluation of LHZ (Ayalew et al., 2004;
Girma et al., 2015; Raghuvanshi et al., 2015). Based on the
field observations, it was realized that these factors were the
significant factors that have resulted into past landslides in
the area. It was further assumed that “the past is the key for
future” (Varnes, 1984; Carrara et al., 1991). This means that
the conditions that were responsible for the past landslides,
if reoccur in other areas, again landslides can occur (Dai and
Lee, 2001; Raghuvanshi et al., 2015). Thus, in order to
understand the relationship of these causative factors with
the past landslides, statistical analysis was made between
each of the causative factors and the past landslides. For this
purpose, individual factor maps were overlaid on the past
landslide map in GIS environment and quantitative
prediction was made through density analysis between the
past landslides and each of the causative factor sub-classes
(Dai and Lee, 2001; Lee et al., 2004; Girma et al., 2015;
Raghuvanshi et al., 2015; Chimidi et al., 2017; Hamza and
Raghuvanshi, 2017). With the help of this statistical density
analysis, Landslide Susceptibility Index (LSI) was
computed for each parameter sub-class (Raghuvanshi et al.,
2015). Further, for grid overlay analysis a polygon grid (10
x 10 m) was overlaid on each parameter theme and geo
processing was done to know the presence of each
parameter sub-class within each grid cell. Later, respective
LSI values for each factor sub-class within each grid cell
were assigned. Thus, the sum total of LSI values for six
parameters within each grid cell provided Total Landslide
Susceptibility Index value (TLSI). These TLSI values were
further utilized to define the landslide hazard zonation in the
study area.
The present study was carried out in three phases; Pre-field
work-desk study, Field investigation and Post field study.
During the pre-field-desk study required data from
secondary sources was collected. This includes collection
of data on meteorology, topographical maps and satellite
data. Besides, previous reports, data and maps available for
the study area were reviewed. Further, slope facet map,
geological and soil cover maps were prepared, later to be
utilized during the field work. In addition, digital elevation
model (DEM) was obtained at a resolution of 30m from
the ASTER data set and factor maps for elevation, slope
and aspect were prepared. Also, land use land cover map
of the present study area was prepared from the Sentinel-
2A data through supervised classification.
The major activities carried out during the field
investigation includes inventory mapping for past
landslides and verification of the factor maps that were
prepared during the pre-field-desk study. The past
landslide inventory mapping was carried out by
identifying the landslides for its type, dimension, material
involved, morphology of failed slope, failure mechanism
and the possible triggering factors. The data on landslide
inventory was collected through GPS readings along the
periphery of the landslide, visual observations on various
aspects and through personal interviews with the local
residents. Prior to the field work various past landslides in
the area were tentatively identified through the Google
Earth image and were marked as point data on the facet
map. Later during the field work they were further verified
and necessary inventory data/ information, as mentioned
above were collected.
Besides, factor maps on lithology and soil cover were
verified in the field and necessary modifications were
made. In order to collect the primary data in the field and
to verify factor maps prepared during the pre-field-desk
study, slope facet map was used. The facet map was
prepared during the pre-field-desk study by delineating
major or minor hill ridges and streams on the topographic
map by using Arc GIS software (Anbalagan, 1992). Slope
facet is basically required to demarcate the area into more
or less identical land unit which have nearly similar slope
direction and inclination. Therefore, facet provides a
means to recognize the land area within which
observations can be made. Since, the facets are bounded
by streams and ridges therefore they can easily be
recognized in the field with the help of topographical map.
Thus, the primary purpose of facet is to demarcate the
study area into various units which can easily be
recognized in the field and within which observations can
easily be made for various causative factors.
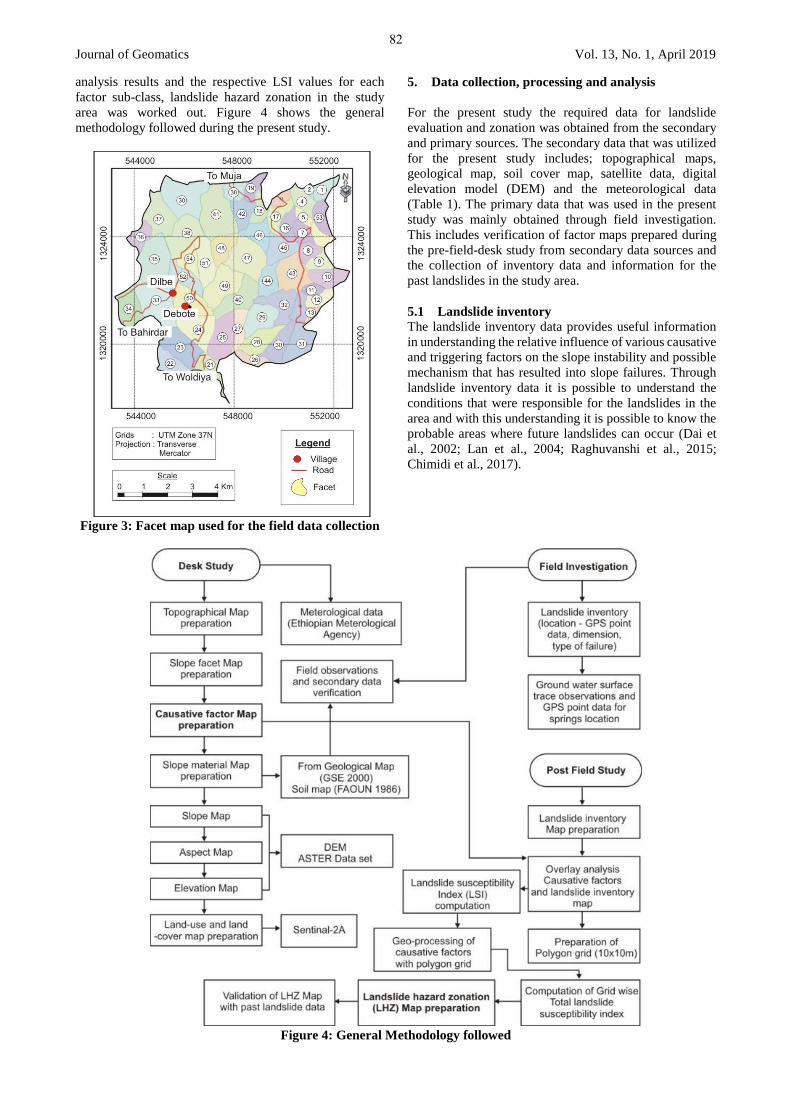
A total of 54 slope facets were delineated in the study area
(Figure 3). In addition, springs present in the study area
were located and marked with the help of GPS reading on
the elevation map.
The post field study includes processing of data collected
during the field investigation stage and to carry out further
analysis to prepare landslide hazard zonation map of the
study area. The past landslide inventory data, collected as
GPS point data along the periphery of the landslides during
the field investigation, was converted to polygon data by
digitization over the Google-Earth image.
All factor maps and landslide inventory map were brought
to the GIS environment for further processing. Besides,
individual factor maps were overlaid on past landslide map
in GIS environment and quantitative predictions were
made through density analysis between the past landslides
and each of the causative factor class. Thus, the LSI values
for each parameter sub class were computed. Further,
overlay analysis was made by overlying grid on each
parameter map. Finally, with the help of grid overlay
81
Journal of Geomatics Vol. 13, No. 1, April 2019
analysis results and the respective LSI values for each
factor sub-class, landslide hazard zonation in the study
area was worked out. Figure 4 shows the general
methodology followed during the present study.
Figure 3: Facet map used for the field data collection
5. Data collection, processing and analysis
For the present study the required data for landslide
evaluation and zonation was obtained from the secondary
and primary sources. The secondary data that was utilized
for the present study includes; topographical maps,
geological map, soil cover map, satellite data, digital
elevation model (DEM) and the meteorological data
(Table 1). The primary data that was used in the present
study was mainly obtained through field investigation.
This includes verification of factor maps prepared during
the pre-field-desk study from secondary data sources and
the collection of inventory data and information for the
past landslides in the study area.
5.1 Landslide inventory
The landslide inventory data provides useful information
in understanding the relative influence of various causative
and triggering factors on the slope instability and possible
mechanism that has resulted into slope failures. Through
landslide inventory data it is possible to understand the
conditions that were responsible for the landslides in the
area and with this understanding it is possible to know the
probable areas where future landslides can occur (Dai et
al., 2002; Lan et al., 2004; Raghuvanshi et al., 2015;
Chimidi et al., 2017).
Figure 4: General Methodology followed
82
Journal of Geomatics Vol. 13, No. 1, April 2019
Table1: Causative factors respective data source
Causative factors Data Source
Landslide inventory Field observations – GPS
point data along landslide
periphery and by using
Google Earth image.
Slope material Slope material map was
prepared from the Geological
map of Dessie area prepared
by Geological Survey of
Ethiopia with a scale of
1:250000 (GSE, 2010), soil
map of Ethiopia prepared by
Food and Agriculture
Organization of United
Nations (FAOUN, 1986) and
through field investigation
and mapping.
Slope DEM data with a resolution of
30 m ASTER elevation data
set
Aspect
Elevation
Land use land cover Sentinale-2A and field
observation and mapping
Groundwater surface
trace
Field observations - GPS
point data collected at springs
location during field work and
delineation of hydrological
homogeneous zones over
topographical maps.
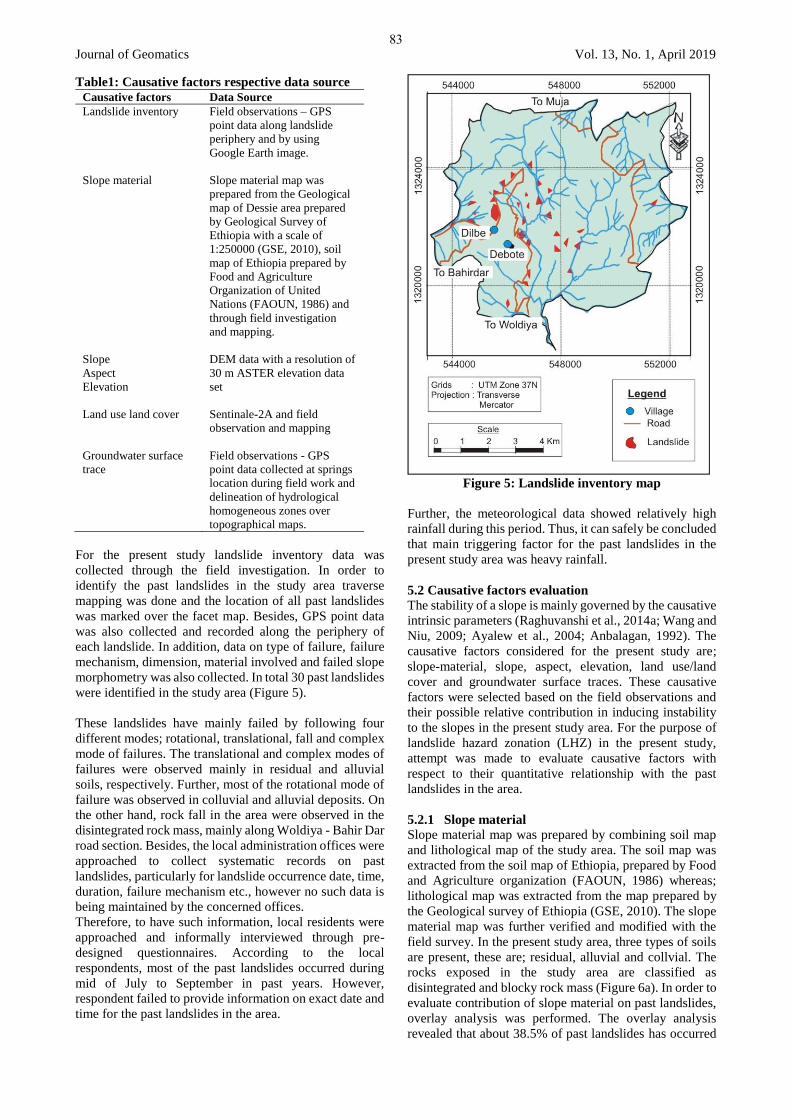
For the present study landslide inventory data was
collected through the field investigation. In order to
identify the past landslides in the study area traverse
mapping was done and the location of all past landslides
was marked over the facet map. Besides, GPS point data
was also collected and recorded along the periphery of
each landslide. In addition, data on type of failure, failure
mechanism, dimension, material involved and failed slope
morphometry was also collected. In total 30 past landslides
were identified in the study area (Figure 5).
These landslides have mainly failed by following four
different modes; rotational, translational, fall and complex
mode of failures. The translational and complex modes of
failures were observed mainly in residual and alluvial
soils, respectively. Further, most of the rotational mode of
failure was observed in colluvial and alluvial deposits. On
the other hand, rock fall in the area were observed in the
disintegrated rock mass, mainly along Woldiya - Bahir Dar
road section. Besides, the local administration offices were
approached to collect systematic records on past
landslides, particularly for landslide occurrence date, time,
duration, failure mechanism etc., however no such data is
being maintained by the concerned offices.
Therefore, to have such information, local residents were
approached and informally interviewed through pre-
designed questionnaires. According to the local
respondents, most of the past landslides occurred during
mid of July to September in past years. However,
respondent failed to provide information on exact date and
time for the past landslides in the area.
Figure 5: Landslide inventory map
Further, the meteorological data showed relatively high
rainfall during this period. Thus, it can safely be concluded
that main triggering factor for the past landslides in the
present study area was heavy rainfall.
5.2 Causative factors evaluation
The stability of a slope is mainly governed by the causative
intrinsic parameters (Raghuvanshi et al., 2014a; Wang and
Niu, 2009; Ayalew et al., 2004; Anbalagan, 1992). The
causative factors considered for the present study are;
slope-material, slope, aspect, elevation, land use/land
cover and groundwater surface traces. These causative
factors were selected based on the field observations and
their possible relative contribution in inducing instability
to the slopes in the present study area. For the purpose of
landslide hazard zonation (LHZ) in the present study,
attempt was made to evaluate causative factors with
respect to their quantitative relationship with the past
landslides in the area.
5.2.1 Slope material
Slope material map was prepared by combining soil map
and lithological map of the study area. The soil map was
extracted from the soil map of Ethiopia, prepared by Food
and Agriculture organization (FAOUN, 1986) whereas;
lithological map was extracted from the map prepared by
the Geological survey of Ethiopia (GSE, 2010). The slope
material map was further verified and modified with the
field survey. In the present study area, three types of soils
are present, these are; residual, alluvial and collvial. The
rocks exposed in the study area are classified as
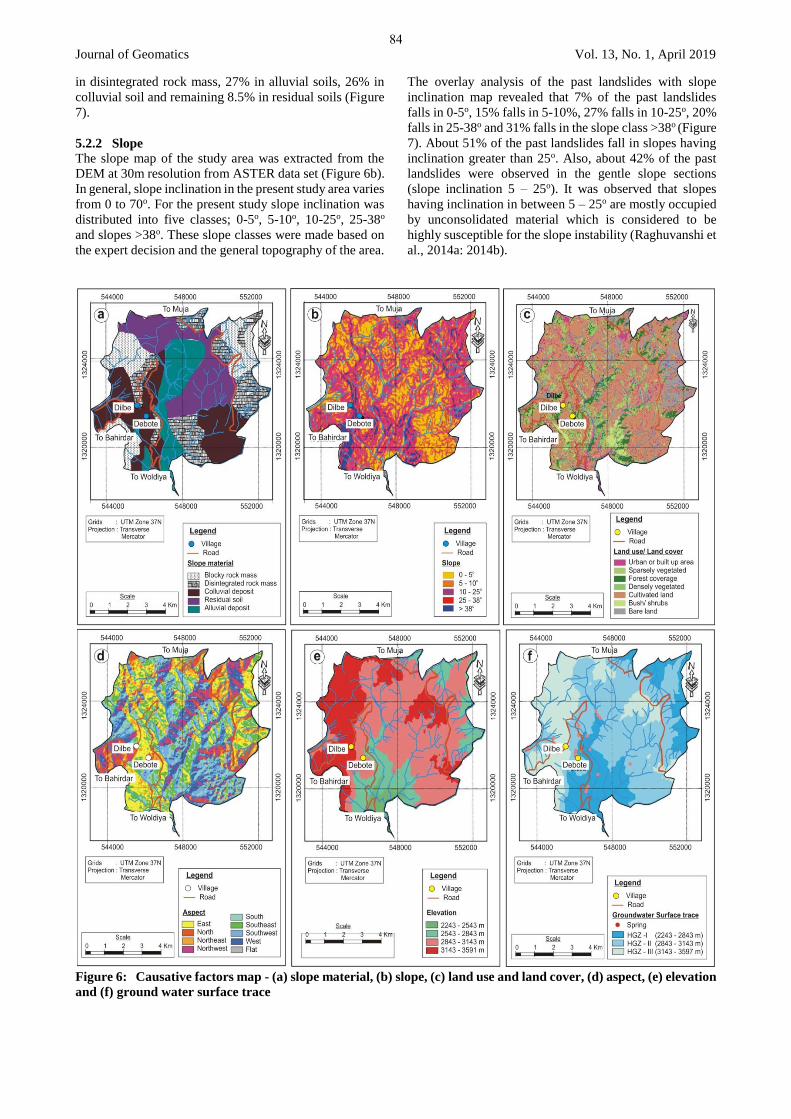
disintegrated and blocky rock mass (Figure 6a). In order to
evaluate contribution of slope material on past landslides,
overlay analysis was performed. The overlay analysis
revealed that about 38.5% of past landslides has occurred
83
Journal of Geomatics Vol. 13, No. 1, April 2019
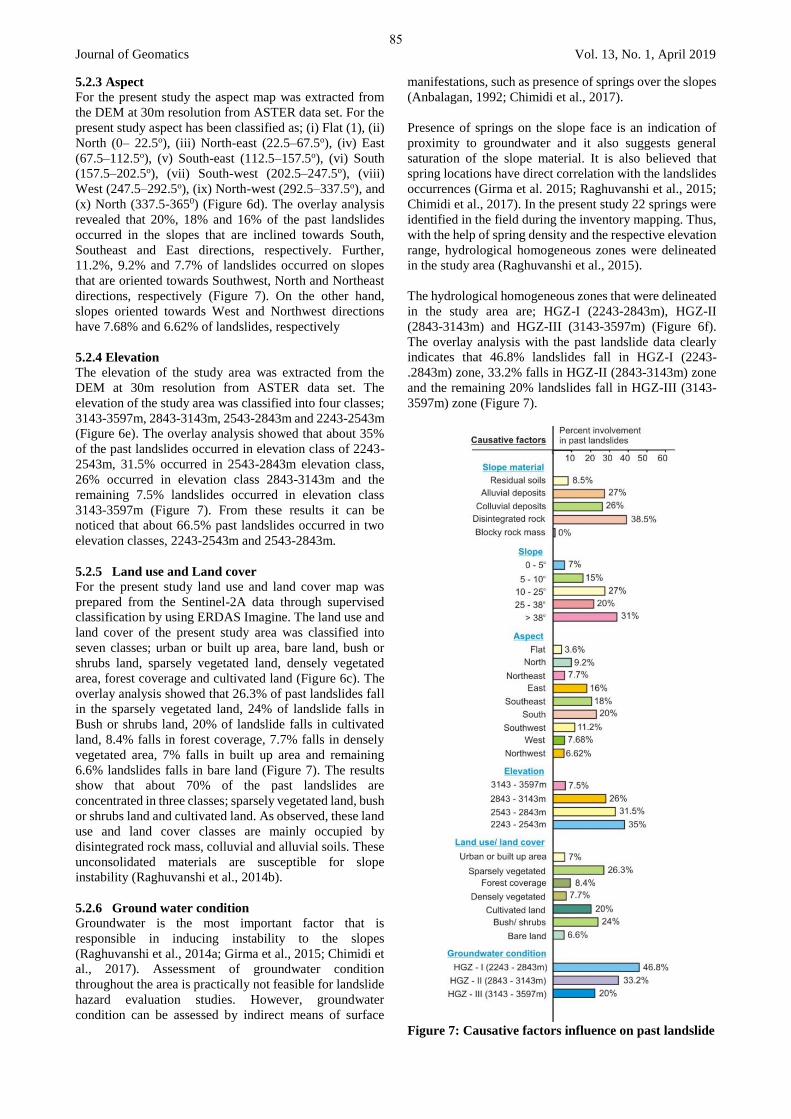
in disintegrated rock mass, 27% in alluvial soils, 26% in
colluvial soil and remaining 8.5% in residual soils (Figure
7).
5.2.2 Slope The slope map of the study area was extracted from the
DEM at 30m resolution from ASTER data set (Figure 6b).
In general, slope inclination in the present study area varies
from 0 to 70o. For the present study slope inclination was
distributed into five classes; 0-5o, 5-10o, 10-25o, 25-38o
and slopes >38o. These slope classes were made based on
the expert decision and the general topography of the area.
The overlay analysis of the past landslides with slope
inclination map revealed that 7% of the past landslides
falls in 0-5o, 15% falls in 5-10%, 27% falls in 10-25o, 20%
falls in 25-38o and 31% falls in the slope class >38o (Figure
7). About 51% of the past landslides fall in slopes having
inclination greater than 25o. Also, about 42% of the past
landslides were observed in the gentle slope sections
(slope inclination 5 – 25o). It was observed that slopes
having inclination in between 5 – 25o are mostly occupied
by unconsolidated material which is considered to be
highly susceptible for the slope instability (Raghuvanshi et
al., 2014a: 2014b).
Figure 6: Causative factors map - (a) slope material, (b) slope, (c) land use and land cover, (d) aspect, (e) elevation
and (f) ground water surface trace
84
Journal of Geomatics Vol. 13, No. 1, April 2019
5.2.3 Aspect
For the present study the aspect map was extracted from
the DEM at 30m resolution from ASTER data set. For the
present study aspect has been classified as; (i) Flat (1), (ii)
North (0– 22.5o), (iii) North-east (22.5–67.5o), (iv) East
(67.5–112.5o), (v) South-east (112.5–157.5o), (vi) South
(157.5–202.5o), (vii) South-west (202.5–247.5o), (viii)
West (247.5–292.5o), (ix) North-west (292.5–337.5o), and
(x) North (337.5-3650) (Figure 6d). The overlay analysis
revealed that 20%, 18% and 16% of the past landslides
occurred in the slopes that are inclined towards South,
Southeast and East directions, respectively. Further,
11.2%, 9.2% and 7.7% of landslides occurred on slopes
that are oriented towards Southwest, North and Northeast
directions, respectively (Figure 7). On the other hand,
slopes oriented towards West and Northwest directions
have 7.68% and 6.62% of landslides, respectively
5.2.4 Elevation
The elevation of the study area was extracted from the
DEM at 30m resolution from ASTER data set. The
elevation of the study area was classified into four classes;
3143-3597m, 2843-3143m, 2543-2843m and 2243-2543m
(Figure 6e). The overlay analysis showed that about 35%
of the past landslides occurred in elevation class of 2243-
2543m, 31.5% occurred in 2543-2843m elevation class,
26% occurred in elevation class 2843-3143m and the
remaining 7.5% landslides occurred in elevation class
3143-3597m (Figure 7). From these results it can be
noticed that about 66.5% past landslides occurred in two
elevation classes, 2243-2543m and 2543-2843m.
5.2.5 Land use and Land cover
For the present study land use and land cover map was
prepared from the Sentinel-2A data through supervised
classification by using ERDAS Imagine. The land use and
land cover of the present study area was classified into
seven classes; urban or built up area, bare land, bush or
shrubs land, sparsely vegetated land, densely vegetated
area, forest coverage and cultivated land (Figure 6c). The
overlay analysis showed that 26.3% of past landslides fall
in the sparsely vegetated land, 24% of landslide falls in
Bush or shrubs land, 20% of landslide falls in cultivated
land, 8.4% falls in forest coverage, 7.7% falls in densely
vegetated area, 7% falls in built up area and remaining
6.6% landslides falls in bare land (Figure 7). The results
show that about 70% of the past landslides are
concentrated in three classes; sparsely vegetated land, bush
or shrubs land and cultivated land. As observed, these land
use and land cover classes are mainly occupied by
disintegrated rock mass, colluvial and alluvial soils. These
unconsolidated materials are susceptible for slope
instability (Raghuvanshi et al., 2014b).
5.2.6 Ground water condition
Groundwater is the most important factor that is
responsible in inducing instability to the slopes
(Raghuvanshi et al., 2014a; Girma et al., 2015; Chimidi et
al., 2017). Assessment of groundwater condition
throughout the area is practically not feasible for landslide
hazard evaluation studies. However, groundwater
condition can be assessed by indirect means of surface
manifestations, such as presence of springs over the slopes
(Anbalagan, 1992; Chimidi et al., 2017).
Presence of springs on the slope face is an indication of
proximity to groundwater and it also suggests general
saturation of the slope material. It is also believed that
spring locations have direct correlation with the landslides
occurrences (Girma et al. 2015; Raghuvanshi et al., 2015;
Chimidi et al., 2017). In the present study 22 springs were
identified in the field during the inventory mapping. Thus,
with the help of spring density and the respective elevation
range, hydrological homogeneous zones were delineated
in the study area (Raghuvanshi et al., 2015).
The hydrological homogeneous zones that were delineated
in the study area are; HGZ-I (2243-2843m), HGZ-II
(2843-3143m) and HGZ-III (3143-3597m) (Figure 6f).
The overlay analysis with the past landslide data clearly
indicates that 46.8% landslides fall in HGZ-I (2243-
.2843m) zone, 33.2% falls in HGZ-II (2843-3143m) zone
and the remaining 20% landslides fall in HGZ-III (3143-
3597m) zone (Figure 7).
Figure 7: Causative factors influence on past landslide
85
Journal of Geomatics Vol. 13, No. 1, April 2019
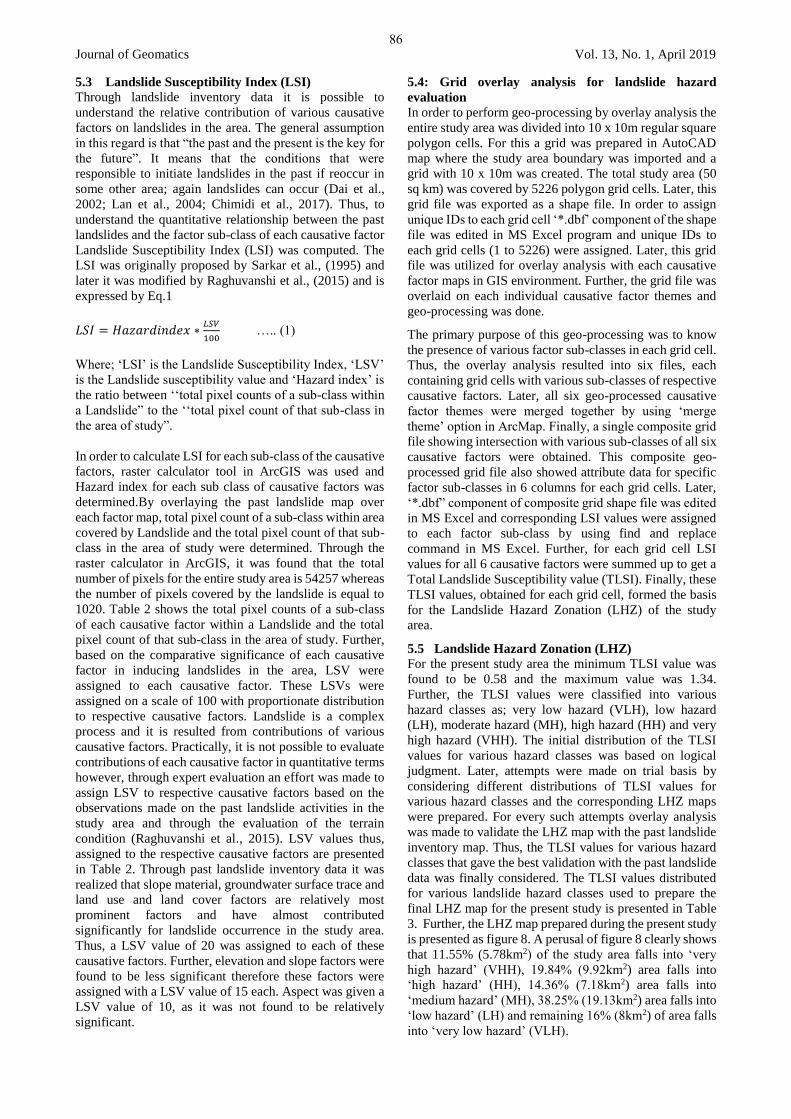
5.3 Landslide Susceptibility Index (LSI)
Through landslide inventory data it is possible to
understand the relative contribution of various causative
factors on landslides in the area. The general assumption
in this regard is that “the past and the present is the key for
the future”. It means that the conditions that were
responsible to initiate landslides in the past if reoccur in
some other area; again landslides can occur (Dai et al.,
2002; Lan et al., 2004; Chimidi et al., 2017). Thus, to
understand the quantitative relationship between the past
landslides and the factor sub-class of each causative factor
Landslide Susceptibility Index (LSI) was computed. The
LSI was originally proposed by Sarkar et al., (1995) and
later it was modified by Raghuvanshi et al., (2015) and is
expressed by Eq.1
𝐿𝑆𝐼 = 𝐻𝑎𝑧𝑎𝑟𝑑𝑖𝑛𝑑𝑒𝑥 ∗𝐿𝑆𝑉
100 ….. (1)
Where; ‘LSI’ is the Landslide Susceptibility Index, ‘LSV’
is the Landslide susceptibility value and ‘Hazard index’ is
the ratio between ‘‘total pixel counts of a sub-class within
a Landslide” to the ‘‘total pixel count of that sub-class in
the area of study”.
In order to calculate LSI for each sub-class of the causative
factors, raster calculator tool in ArcGIS was used and
Hazard index for each sub class of causative factors was
determined.By overlaying the past landslide map over
each factor map, total pixel count of a sub-class within area
covered by Landslide and the total pixel count of that sub-
class in the area of study were determined. Through the
raster calculator in ArcGIS, it was found that the total
number of pixels for the entire study area is 54257 whereas
the number of pixels covered by the landslide is equal to
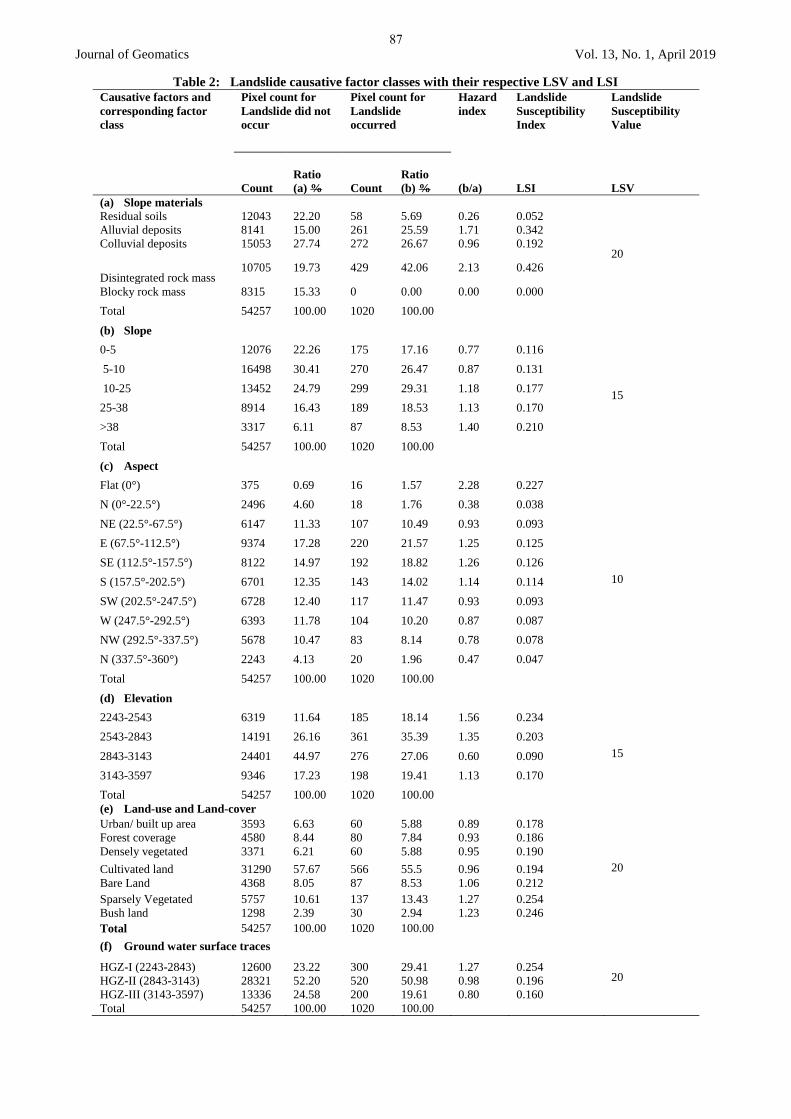
1020. Table 2 shows the total pixel counts of a sub-class
of each causative factor within a Landslide and the total
pixel count of that sub-class in the area of study. Further,
based on the comparative significance of each causative
factor in inducing landslides in the area, LSV were
assigned to each causative factor. These LSVs were
assigned on a scale of 100 with proportionate distribution
to respective causative factors. Landslide is a complex
process and it is resulted from contributions of various
causative factors. Practically, it is not possible to evaluate
contributions of each causative factor in quantitative terms
however, through expert evaluation an effort was made to
assign LSV to respective causative factors based on the
observations made on the past landslide activities in the
study area and through the evaluation of the terrain
condition (Raghuvanshi et al., 2015). LSV values thus,
assigned to the respective causative factors are presented
in Table 2. Through past landslide inventory data it was
realized that slope material, groundwater surface trace and
land use and land cover factors are relatively most
prominent factors and have almost contributed
significantly for landslide occurrence in the study area.
Thus, a LSV value of 20 was assigned to each of these
causative factors. Further, elevation and slope factors were
found to be less significant therefore these factors were
assigned with a LSV value of 15 each. Aspect was given a
LSV value of 10, as it was not found to be relatively
significant.
5.4: Grid overlay analysis for landslide hazard
evaluation
In order to perform geo-processing by overlay analysis the
entire study area was divided into 10 x 10m regular square
polygon cells. For this a grid was prepared in AutoCAD
map where the study area boundary was imported and a
grid with 10 x 10m was created. The total study area (50
sq km) was covered by 5226 polygon grid cells. Later, this
grid file was exported as a shape file. In order to assign
unique IDs to each grid cell ‘*.dbf’ component of the shape
file was edited in MS Excel program and unique IDs to
each grid cells (1 to 5226) were assigned. Later, this grid
file was utilized for overlay analysis with each causative
factor maps in GIS environment. Further, the grid file was
overlaid on each individual causative factor themes and
geo-processing was done.
The primary purpose of this geo-processing was to know
the presence of various factor sub-classes in each grid cell.
Thus, the overlay analysis resulted into six files, each
containing grid cells with various sub-classes of respective
causative factors. Later, all six geo-processed causative
factor themes were merged together by using ‘merge
theme’ option in ArcMap. Finally, a single composite grid
file showing intersection with various sub-classes of all six
causative factors were obtained. This composite geo-
processed grid file also showed attribute data for specific
factor sub-classes in 6 columns for each grid cells. Later,
‘*.dbf” component of composite grid shape file was edited
in MS Excel and corresponding LSI values were assigned
to each factor sub-class by using find and replace
command in MS Excel. Further, for each grid cell LSI
values for all 6 causative factors were summed up to get a
Total Landslide Susceptibility value (TLSI). Finally, these
TLSI values, obtained for each grid cell, formed the basis
for the Landslide Hazard Zonation (LHZ) of the study
area.
5.5 Landslide Hazard Zonation (LHZ)
For the present study area the minimum TLSI value was
found to be 0.58 and the maximum value was 1.34.
Further, the TLSI values were classified into various
hazard classes as; very low hazard (VLH), low hazard
(LH), moderate hazard (MH), high hazard (HH) and very
high hazard (VHH). The initial distribution of the TLSI
values for various hazard classes was based on logical
judgment. Later, attempts were made on trial basis by
considering different distributions of TLSI values for
various hazard classes and the corresponding LHZ maps
were prepared. For every such attempts overlay analysis
was made to validate the LHZ map with the past landslide
inventory map. Thus, the TLSI values for various hazard
classes that gave the best validation with the past landslide
data was finally considered. The TLSI values distributed
for various landslide hazard classes used to prepare the
final LHZ map for the present study is presented in Table
3. Further, the LHZ map prepared during the present study
is presented as figure 8. A perusal of figure 8 clearly shows
that 11.55% (5.78km2) of the study area falls into ‘very
high hazard’ (VHH), 19.84% (9.92km2) area falls into
‘high hazard’ (HH), 14.36% (7.18km2) area falls into
‘medium hazard’ (MH), 38.25% (19.13km2) area falls into
‘low hazard’ (LH) and remaining 16% (8km2) of area falls
into ‘very low hazard’ (VLH).
86
Journal of Geomatics Vol. 13, No. 1, April 2019
Table 2: Landslide causative factor classes with their respective LSV and LSI
Causative factors and
corresponding factor
class
Pixel count for
Landslide did not
occur
Pixel count for
Landslide
occurred
Hazard
index
Landslide
Susceptibility
Index
Landslide
Susceptibility
Value
Count
Ratio
(a) % Count
Ratio
(b) % (b/a) LSI LSV
(a) Slope materials
Residual soils 12043 22.20 58 5.69 0.26 0.052
20
Alluvial deposits 8141 15.00 261 25.59 1.71 0.342
Colluvial deposits 15053 27.74 272 26.67 0.96 0.192
Disintegrated rock mass 10705 19.73 429 42.06 2.13 0.426
Blocky rock mass 8315 15.33 0 0.00 0.00 0.000
Total 54257 100.00 1020 100.00
(b) Slope
0-5 12076 22.26 175 17.16 0.77 0.116
15
5-10 16498 30.41 270 26.47 0.87 0.131
10-25 13452 24.79 299 29.31 1.18 0.177
25-38 8914 16.43 189 18.53 1.13 0.170
>38 3317 6.11 87 8.53 1.40 0.210
Total 54257 100.00 1020 100.00
(c) Aspect
Flat (0°) 375 0.69 16 1.57 2.28 0.227
10
N (0°-22.5°) 2496 4.60 18 1.76 0.38 0.038
NE (22.5°-67.5°) 6147 11.33 107 10.49 0.93 0.093
E (67.5°-112.5°) 9374 17.28 220 21.57 1.25 0.125
SE (112.5°-157.5°) 8122 14.97 192 18.82 1.26 0.126
S (157.5°-202.5°) 6701 12.35 143 14.02 1.14 0.114
SW (202.5°-247.5°) 6728 12.40 117 11.47 0.93 0.093
W (247.5°-292.5°) 6393 11.78 104 10.20 0.87 0.087
NW (292.5°-337.5°) 5678 10.47 83 8.14 0.78 0.078
N (337.5°-360°) 2243 4.13 20 1.96 0.47 0.047
Total 54257 100.00 1020 100.00
(d) Elevation
2243-2543 6319 11.64 185 18.14 1.56 0.234
15
2543-2843 14191 26.16 361 35.39 1.35 0.203
2843-3143 24401 44.97 276 27.06 0.60 0.090
3143-3597 9346 17.23 198 19.41 1.13 0.170
Total 54257 100.00 1020 100.00
(e) Land-use and Land-cover
Urban/ built up area 3593 6.63 60 5.88 0.89 0.178
20
Forest coverage 4580 8.44 80 7.84 0.93 0.186
Densely vegetated 3371 6.21 60 5.88 0.95 0.190
Cultivated land 31290 57.67 566 55.5 0.96 0.194
Bare Land 4368 8.05 87 8.53 1.06 0.212
Sparsely Vegetated 5757 10.61 137 13.43 1.27 0.254
Bush land 1298 2.39 30 2.94 1.23 0.246
Total 54257 100.00 1020 100.00
(f) Ground water surface traces
HGZ-I (2243-2843) 12600 23.22 300 29.41 1.27 0.254 20 HGZ-II (2843-3143) 28321 52.20 520 50.98 0.98 0.196
HGZ-III (3143-3597) 13336 24.58 200 19.61 0.80 0.160
Total 54257 100.00 1020 100.00
87

Journal of Geomatics Vol. 13, No. 1, April 2019
6. Results and discussion
6.1 Causative factors relation with landslides
The landslide inventory carried out during the present
study showed the presence of 30 past landslides in the
study area. These landslides are mainly present in the
central, western and the southern parts of the study area
(Figure 5). The landslides, as observed in the study area,
have failed by following fall, transitional, rotational and
complex mode of failures. Out of total observed landslides
76% has failed by rotational mode of failure, 17% failed as
fall and remaining 7% as translational and complex mode
of failures. Most of the rotational mode of failure was
observed in colluvial and alluvial deposits whereas
transitional and complex modes of failures were observed
mainly in the residual and alluvial soils, respectively.
Besides, rock fall in the area were mainly observed in
disintegrated rock mass. As revealed by the local
respondents all these landslides in the present study area
have occurred during the rainy season (mid of July-
September). This indicates that the main triggering factor
for past landslides in the study area is heavy rainfall.
Table 3; Landslide hazard zonation based on Total
Landslide Susceptibility Index (TLSI) value
No Value for
zonation
Zone
Designation
Class
1 0.58-0.78 VLH Very low hazard
2 0.79-0.99 LH Low hazard
3 1.00-1.11 MH Moderately hazard
4 1.12-1.33 HH High hazard
5 >1.33 VHH Very high hazard
Further, past landslide data revealed that about 38.5%
landslides occurred in disintegrated rock mass, 27% in
alluvial soils, 26% in colluvial soil and the remaining 8.5%
in residual soils. No landslides were recorded in the blocky
rock mass. These figures clearly show that 61.5% of
landslides have occurred in slopes that are covered by
alluvial, colluvial or residual soils and 38.5% of landslides
occurred in disintegrated rock mass. The analysis further
revealed that probability of landslides is high in
disintegrated rock mass and the alluvial deposits as the
Hazard index values are 2.13 and 1.71, respectively (Table
2). It may be noted that, Hazard index value of greater than
‘1’ indicates more probability of the landslide occurrence
(Girma et al. 2015; Chimidi et al. 2017). Perusal of Table
2 shows that slope material classes; residual soils and
blocky rock mass have relatively less probability for
landslide occurrence as the hazard index values for these
classes is less than ‘1’. Also, colluvial material shows
hazard index value equal to 0.96 which is nearly close to
1; thus indicating some probability for landslide
occurrence. High concentration of landslides in the slopes
covered by the unconsolidated materials; disintegrated
rock mass, alluvial deposits and colluvial deposits is
related to the low shear strength of the material. Also, such
material when saturated may become more prone for
instability (Anbalagan 1992; Raghuvanshi et al. 2014a;
2014b).
The overlay analysis of past landslides with slope
inclination map further revealed that 31% of landslides fall
in slope class > 38o, 27% fall in slope class 10-25o and 20%
in slope class 25-38o. Also, it was found that the hazard
index values for slope classes; >38o, 10-25o and 25-38o are
1.4, 1.18 and 1.13, respectively (Table 2). Since all these
hazard index values are greater than ‘1’ therefore it shows
that the slope classes >38o, 10-25o and 25-38o are more
susceptible for landslides. The high concentration of
landslides in steeper slope sections are possibly related to
the fact that as the slope becomes steeper the shear stress
and tangential component of weight within the slope
increases, thus tendency of slope instability increases
(Ahmed 2009; Raghuvanshi et al. 2015). Also, about 42%
of the past landslides were observed in the gentle slope
sections (slope inclination 5 – 25o). It was observed that
slopes having inclination in between 5 – 25o in the study
area are mostly occupied by unconsolidated material
which is considered to be highly susceptible for the slope
instability (Raghuvanshi et al. 2014a: 2014b).
Figure 8: Landslide Hazard Zonation (LHZ) map
The overlay analysis of past landslides with aspect map
showed that about 54% of the past landslides occurred on
the slopes that are oriented towards South, Southeast and
East directions. Also, it was found that hazard index values
for aspect classes South, Southeast and East are 1.14, 1.26
and 1.25, respectively. Since all these hazard index values
are greater than ‘1’, therefore slope sections which are
inclined towards South, Southeast and East directions
show more probability for landslide occurrence. Further,
when past landslides are compared to the distribution of
springs in the area, it was found that most of the springs
88
Journal of Geomatics Vol. 13, No. 1, April 2019
are present on the slopes that are inclined towards South or
East directions. Thus, the high concentration of the past
landslides in the area may possibly be related to the general
groundwater flow direction, presence of unconsolidated
material over the slopes and oversaturated slope material.
All these conditions are responsible for slope instability
which might have possibly resulted into landslides (Arora
1997; Hoek and Bray 1981; Raghuvanshi et al. 2014a).
The overlay analysis between past landslides and the
elevation map of the study area showed that about 66.5%
past landslides occurred in two elevation classes, 2243-
2543m and 2543-2843m. Also, the hazard index values
computed for the elevation classes 2243-2543m and 2543-
2843m are 1.56 and 1.35, respectively (Table 2). These
hazard index values clearly show that elevation classes
2243-2543m and 2543-2843m are susceptible for slope
instability as these hazard index values are greater than ‘1’.
Further, it was observed that these elevation classes in the
study area are dominated by high concentration of springs,
disintegrated rock mass, colluvial and alluvial soils.
Besides, slopes on theses elevation classes are being
utilized for cultivation purpose. Cultivation practice may
possibly trigger slope instability by frequent unplanned
irrigation that saturates unconsolidated material
(Raghuvanshi et al. 2014a). Further, disintegrated rock
mass, colluvial and alluvial soils with presence of springs
make these slopes more susceptible for instability
(Raghuvanshi et al. 2015).
The past landslide data also showed that 26.3% of past
landslides fall in the sparsely vegetated land, 24% of
landslide falls in Bush land and 6.6% of landslides fall in
bare land. Also, Hazard index values for sparsely
vegetated land, bush land and bare land are 1.27, 1.23 and
1.06, respectively (Table 2). Since, hazard index values for
sparsely vegetated land, bush land and bare land are
greater than ‘1’ therefore these land use and land cover
classes have more probability for landslide occurrence.
Further, it was also observed that these land use and land
cover classes are mainly occupied by disintegrated rock
mass, colluvial and alluvial soils. These unconsolidated
materials are susceptible for slope instability
(Raghuvanshi et al. 2014b).
The past landslides data further showed that about 80% of
the landslides fall within hydrological homogeneous zone
classes HGZ-I and HGZ-II. Also, Hazard index value for
HGZ-I class is 1.27 which shows high probability for
landslide occurrence (Table 2). Similarly, Hazard index
value for HGZ-II class is 0.98 which is nearly close to ‘1’
thus it also shows relative probability for landslide
occurrence. The high concentration of landslides in HGZ-
I and HGZ-II zones show direct relation of landslides with
the springs in the area. Also, it may be seen that HGZ-I and
HGZ-II zones are dominated by disintegrated rock mass,
colluvial and alluvial soils. These materials have weak
shear strength and become more susceptible to instability
when they are relatively saturated (Raghuvanshi et al.
2015). Thus, all these conditions make HGZ-I and HGZ-II
zones more susceptible for slope instability. For this
reason, only about 80% of the landslides fall within
hydrological homogeneous zones HGZ-I and HGZ-II in
the study area.
6.2 Landslide hazard zonation (LHZ) - distribution
Landslide hazard evaluation shows that 11.55% (5.78km2)
of the study area falls into ‘very high hazard’ (VHH),
19.84% (9.92km2) area falls into ‘high hazard’ (HH),
14.36% (7.18km2) area falls into ‘medium hazard’ (MH),
38.25% (19.13km2) area falls into ‘low hazard’ (LH) and
remaining 16% (8km2) of area falls into ‘very low hazard’
(VLH). Further, perusal of Fig. 8 shows that VHH and HH
zones are mainly concentrated in the southern, northern
and eastern parts of the study area. The area delineated as
VHH and HH zones have good concentration of springs.
In general, it has been observed that spring locations
generally have direct correlation with the landslides
occurrences (Girma et al. 2015; Raghuvanshi et al. 2015;
Chimidi et al. 2017). Also, majority of the areas in VHH
and HH zones have slopes that are inclined at 10 to 38o and
generally have unconsolidated deposits and disintegrated
rock mass. As stated earlier, the unconsolidated materials
and disintegrated rock mass have relatively low shear
strength and such material when saturated may become
more prone for instability (Anbalagan 1992; Raghuvanshi
et al. 2014a; 2014b). Further, the MH zones are distributed
towards Northern, Central and Western regions of the
study area (Figure 8). On the other hand; LH zones are
scattered in the study area. The VLH zones are mainly
concentrated in the Northern and the Eastern parts of the
study area. Also, VLH and LH zones fall mainly in slopes
that are inclined at slope angles less than 5o and are mainly
composed of blocky rock mass.
6.3 LHZ map validation
In order to check the validity of the LHZ map, prepared
during the present study, an overlay analysis was made
with the past landslides activity in the area (Figure 8). It is
believed that if the past landslides fall either within high
hazard (HH) or very high hazard (VHH) zones the
prepared LHZ map is validated and it has possibly
delineated all hazard zones appropriately in the study area.
The overlay analysis results showed that 74% (22) of the
past landslides fall within VHH and HH zones of the
prepared LHZ map. Further, 17% (5) of the past landslides
fall into moderate hazard (MH) zone that also have
reasonable probability of landslide occurrence. Only 9%
(3) of the past landslides fall within low hazard (LH) and
very low hazard (VLH) of the LHZ map. Thus, it may be
concluded from these results that the prepared LHZ has
reasonably validated with the past landslide data. About
9% of the past landslides that fall within LH or VLH zones
do not validate with the prepared LHZ map. This variation
in the validity of the LHZ map may be due to the limitation
of the methodology followed in the present study. The
present study was conducted on medium scale and many
factors that are responsible for instability of slopes cannot
be considered at this scale (Ayele et al. 2014). These
factors are discontinuity characteristics and the
relationship of discontinuities with the slope, water
pressures within the slope, shear strength of the material
along the potential discontinuity surfaces etc. (Girma et al.
2015; Chimidi et al. 2017; Hamza and Raghuvanshi 2017).
89

Journal of Geomatics Vol. 13, No. 1, April 2019
7. Conclusion
Landslide hazard evaluation in the present study shows
that 11.55% (5.78km2) of the study area falls into ‘very
high hazard’ (VHH), 19.84% (9.92km2) area falls into
‘high hazard’ (HH), 14.36% (7.18km2) area falls into
‘medium hazard’ (MH), 38.25% (19.13km2) area falls into
‘low hazard’ (LH) and remaining 16% (8km2) of area falls
into ‘very low hazard’ (VLH). Further, validation results
showed that 74% (22) of the past landslides fall within
VHH and HH zones of the prepared LHZ map. Further,
17% (5) of the past landslides fall into moderate hazard
(MH) zone that also have reasonable probability of
landslide occurrence. Only 9% (3) of the past landslides
fall within low hazard (LH) and very low hazard (VLH) of
the LHZ map. The prepared LHZ map has reasonably
validated with the past landslide data. Finally, in general it
may be concluded that about 31% area falls into VHH and
HH zones and about 14% of the area falls into MH zone.
Thus, about 45% of the area is prone for the landslide
hazard. The major factors responsible for landslide hazard
in the area are the susceptible slope material comprising
mainly; disin-tegrated rock mass, alluvial, colluvial and
residual soils. Also, slopes that are inclined at moderate to
steep slope angles and are oriented towards South,
Southeast and East directions are more susceptible for
instability. Besides, slopes which fall in between
elevations 2243 to 2843m have also shown potential
instability. The landslides in the study area have been
triggered mainly during the rainy season. Since the
landslides in the area have been causing considerable
damage to the roads, houses and the agricultural land
therefore there is a need to implement mitigation measures,
particularly in hazardous zones delineated through the
present study.
Acknowledgements
We thankfully acknowledge all kinds of support extended
to us by the head and the staff of the School of Earth
Sciences, College of Natural and Computational Sciences,
Addis Ababa University. The meticulous review and
comments by the esteemed anonymous reviewers is also
duly acknowledged.
References
Abebe, B., F. Dramis, G. Fubelli, M. Umer and A. Asrat
(2010). Landslides in the Ethiopian highlands and the rift
margins, Journal of African Earth Sciences, 56, 131–138.
Ahmed, S. (2009). Slope stability analysis using GIS and
numerical modeling techniques (Unpublished MSc thesis),
Vrije Universiteit, Brussel.
Anbalagan, R. (1992). Landslide hazard evaluation and
zonation mapping in mountainous terrain, Engineering
Geology, 32, 269–277.
Arora, K.R. (1997). Soil mechanics and foundation
engineering, Standard Publishers Distributers, Delhi,
India, pp. 475.
Arnous, M.O. (2011). Integrated remote sensing and GIS
techniques for landslide hazard zonation: a case study
WadiWatier area, South Sinai, Egyptian Journal of Coastal
Conservation15, 477-497
Ayalew, L., H. Yamagishi and N. Ugawa (2004).
Landslide susceptibility mapping using GIS-based
weighted linear combination, the case in Tsugawa area of
Agano River, Niigata Prefecture, Japan, Landslides, 1, 73–
81.
Ayalew, L. and H. Yamagishi (2004). Slope failures in the
Blue Nile basin, as seen from landscape evolution
perspective, Geomorphology, 61, 1–22.
Ayele, S., T.K. Raghuvanshi and P.M. Kala (2014).
Application of remote sensing and GIS for landslide
disaster management—a case from Abay Gorge,
Gohatsion–Dejen section, Ethiopia. Landscape ecology
and water management, proceedings of International
Geographical Union (IGU) Rohtak Conference, Advances
in Geographical and Environmental Sciences (M. Singh,
R.B. Singh and M.I. Hassan: Editors),. Springer, Japan,
Vol. 2, pp. 15–32
Ayenew, T. and G. Barbieri (2005). Inventory of
landslides and susceptibility mapping in the Dessie area,
Northern Ethiopia, Engineering Geology, 77, 1–15
Bommer, J. J. and C. E. Rodrı’guez (2002). Earthquake-
induced landslides in Central America. Engineering
Geology, 63,189–220
Carrara, A., M. Cardinali and F. Guzzetti (1992).
Uncertainty in assessing landslide hazard and risk, ITC
Journal, 2, 172–183
Carrara, A., M. Cardinali, R. Detti, F. Guzzetti, V. Pasqui
and P. Reichenbach (1991). GIS techniques and statistical
models in evaluating landslide hazard. Earth Surface
Process Landform, 6, 427–445
Casagli, N., F. Catani, C. Puglisi, G. Delmonaco, L. Ermini
and C. Margottini (2004). An inventory-based approach to
landslide susceptibility assessment and its application to
the Virginio River Basin. Italy Environ, Journal of
Environmental and Engineering Geosciences, 10 (3), 203–
216
Chimidi, G., T. K., Raghuvanshi and K. V. Suryabhagavan
(2017). Landslide hazard evaluation and zonation in and
around Gimbi town, western Ethiopia – a GIS-based
statistical approach, Journal of Applied Geomatics, 9 (4),
219–236.
Collison A., S. Wade, J. Griffiths and M. Dehn (2000).
Modelling the impact of predicted climate change on
landslide frequency and magnitude in SE England,
Engineering Geology, 55, 205–218
Crozier, M.J. and T.Glade (2005). Landslide hazard and
risk: issues, concepts, and approach. Glade, Landslide
90

Journal of Geomatics Vol. 13, No. 1, April 2019
Hazard and Risk, (T. Anderson and M. Crozie: Editors)
Wiley, Chichester, pp. 1–40
Dahal, R.K., S.Hasegawa, T.Masuda and M.Yamanaka
(2006). Roadside slope failures in Nepal during torrential
rainfall and their mitigation. Disaster Mitigation of Debris
Flows, Slope Failures and Landslides, pp 503–514
Dai, F. C., C. F. Lee and Y. Y. Ngai (2002). Landslide risk
assessment and management: an overview. Engineering
Geology, 64, 65–87
Dai, F. C. and C. F. Lee (2001). Terrain-based mapping of
landslide susceptibility using a geographical information
system: a case study, Canadian Geotechnical Journal, 38,
911–923
Demissie, T., G. Yohannes, A. Mammo, Y. Tesfaye, Y.
Teshome, G. Burusa, M. Edris and M. Wenduante (2010).
Geology geochemistry and gravity survey of the Dessie
area, unpublished report, pp. 68.
Ermias, B., T. K. Raghuvanshi and B. Abebe (2017).
Landslide Hazard Zonation (LHZ) around Alemketema
Town, North Showa Zone, Central Ethiopia - A GIS based
expert evaluation approach International Journal of Earth
Sciences and Engineering, 10 (1), 33 -44
Fall, M., R. Azzam and C. Noubactep (2006). Amulti-
method approach to study the stability of natural slopes
and landslide susceptibility mapping, Engineering
Geology, 82, 241–263
FAOUN (Food and Agriculture Organization of the United
Nations) (1986). Ethiopian highlands reclamation study,
Food and Agriculture Organization of the United Nations,
Rome, pp. 334
Gemechu, D. (1977). Aspect of climate and water balance
in Ethiopia. Addis Ababa University press, Addis Ababa,
pp. 79
Girma, F., T.K. Raghuvanshi, T. Ayenew and T.
Hailemariam (2015). Landslide hazard zonation in
AddaBerga District, Central Ethiopia—a GIS based
statistical approach, Journal of Geomatics, 9, 25–38
Gorsevski, P.V., P. Jankowski and P.E. Gessler (2006). A
heuristic approach for mapping landslide hazard by
integrating fuzzy logic with analytic hierarchy process.
Control Cybernet, 35 (1), 121–146
GSE (Geological Survey of Ethiopian), (2010).
Geosciences Report on Dessie area, Unpublished Report,
Geological Survey of Ethiopian, Addis Ababa, Ethiopia,
pp. 68
Guzzetti, F., A. Carrara, M. Cardinali and P. Reichenbach
(1999). Landslide hazard evaluation: a review of current
techniques and their application in a multi-scale study,
central Italy. Geomorphology, 31(1–4), 181–216
Hamza, T. and T. K. Raghuvanshi (2017). GIS based
landslide hazard evaluation and zonation—a case from
Jeldu District, Central Ethiopia. Journal of King Saud
University–Science, 29, 151–165
Hoek, E and J. W. Bray (1981). Rock slope engineering
(revised third edition). Institute of Mining and Metallurgy,
London, pp. 358
Kanungo, D. P., M. K. Arora, S. Sarkar and R.P. Gupta
(2006). A comparative study of conventional, ANN black
box, fuzzy and combined neural and fuzzy weighting
procedures for landslide susceptibility zonation in
Darjeeling Himalayas, Engineering Geology, 85,347–366
Keefer, D. V. (2000). Statistical analysis of an earthquake-
induced landslide distribution—the 1989 Loma Prieta,
California event. Engineering Geology, 58, 231–249
Lan, H. X., C. H. Zhou, L. J. Wang, H. Y. Zhang and R.
H. Li (2004). Landslide hazard spatial analysis and
prediction usingGIS in the Xiaojiang watershed, Yunnan.
China, Engineering Geology, 76, 109–128
Lee, S., J.H. Rhyu, J. S. Won and H. J. Park (2004).
Determination and application of the weights for landslide
susceptibility mapping using an artificial neural network at
south. Korean Engineering Geology, 71, 289–302
Leroi, E. (1997). Landslide risk mapping: problems,
limitation and developments. Landslide risk assessment,
(F. Cruden : Editor), Balkema, Rotterdam, pp. 239–250
Marrapu, B. M and R. S. Jakka (2014). Landslide Hazard
Zonation Methods: A Critical Review, International
Journal of Civil Engineering Research, 5, 215-220
Pan, X., H. Nakamura, T. Nozaki and X. Huang (2008). A
GIS-based landslide hazard assessment by multivariate
analysis Landslides. Journal of Japan Landslide Society,
45 (3), 187–195.
Parise, M. and R.W. Jibson (2000). A seismic landslide
susceptibility rating of geologic units based on analysis of
characteristics of landslides triggered by the 17 January,
1994 Northridge, California earthquake, Engineering
Geology, 58, 251–270
Raghuvanshi, T. K., L. Negassa and P.M. Kala (2015). GIS
based grid overlay method versus modeling approach—a
comparative study for landslide hazard zonation (LHZ) in
Meta Robi District of west Shewa Zone in Ethiopia.
Egyptian Journal of Remote sensing and Space Science,
18(2), 235–250
Raghuvanshi, T. K., J. Ibrahim and D. Ayalew (2014a).
Slope stability susceptibility evaluation parameter (SSEP)
rating scheme—an approach for landslide hazard zonation.
Journal of African Earth Sciences, 99, 595–612
Raghuvanshi, T.K., P.M. Kala and M. Singh (2014b).
Landslide disaster management and reduction- An
approach through remote rensing and GIS. Landscape
91

Journal of Geomatics Vol. 13, No. 1, April 2019
ecology and water management, proceedings of
International Geographical Union (IGU) Rohtak
Conference, Advances in Geographical and
Environmental Sciences (M. Singh, R.B. Singh and M.I.
Hassan: Editors), Springer, Japan, Vol. 2, Springer Japan,
pp. 33-40
Sarkar, S. and D.P. Kanungo (2004). An integrated
approach for landslide susceptibility mapping using
remote sensing and GIS, Photogrammetric Engineering &
Remote Sensing, 70 (5), 617–625
Sarkar, S., D.P. Kanungo and G.S. Mehrotra (1995).
Landslide hazard zonation: a case study in Garhwal
Himalaya, India, Mountain Research and Development, 15
(4), 301–309.
Tefera, M., T. Chernet and W. Haro (1996). Explanation
of the geological map of Ethiopia, Ethiopian Institute of
Geological Surveys, Addis Ababa, 3: 79
Van Den Eeckhaut M., P. Reichenbach, F. Guzzetti, M.
Rossi and J. Poesen (2009). Combined landslide inventory
and susceptibility assessment based on different mapping
units: An example from the Flemish Ardennes, Belgium.
Journal of Natural Hazards Earth System Science, 9, 507–
521.
Varnes, D.J. (1996). Landslide Types and Processes,
Landslides: investigation and mitigation, transportation
Research Board Special Report 247, (A.K. Turner and R.L
Schuster: Editors), National Academy Press, National
Research Council, Washington, D.C, pp. 36-75
Varnes, D.J. (1984). Landslide hazard zonation: a review
of principles and practice. UNESCO, Paris, pp. 1–63
Wang, X. and R. Niu (2009). Spatial forecast of landslides
in three gorges based on spatial data mining, Sensors, 9,
2035–2061
WestenVan, C. J., N. Rengers and M. T. J. Terlien (1997).
Prediction of the occurrence of slope instability
phenomena through GIS-based hazard zonation.
Geologische Rundschau, 86, 4004–441
92